170
Report Dubuque Water Pollution Control Plant (WPCP) Facilities Plan City of Dubuque, IA May 2008
Report
Dubuque Water Pollution Control Plant (WPCP) Facilities Plan City of Dubuque, IA May 2008
i
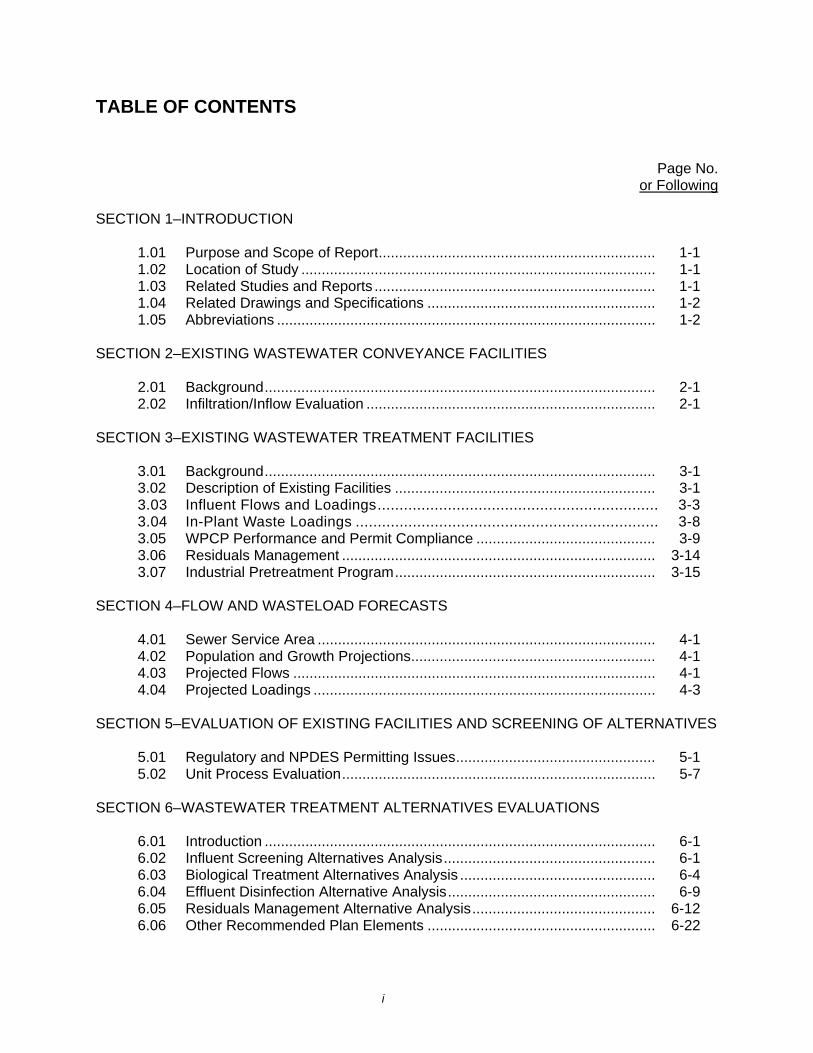
TABLE OF CONTENTS
Page No. or Following
SECTION 1–INTRODUCTION 1.01 Purpose and Scope of Report.................................................................... 1-1 1.02 Location of Study ....................................................................................... 1-1 1.03 Related Studies and Reports ..................................................................... 1-1 1.04 Related Drawings and Specifications ........................................................ 1-2 1.05 Abbreviations ............................................................................................. 1-2 SECTION 2–EXISTING WASTEWATER CONVEYANCE FACILITIES 2.01 Background................................................................................................ 2-1 2.02 Infiltration/Inflow Evaluation ....................................................................... 2-1 SECTION 3–EXISTING WASTEWATER TREATMENT FACILITIES 3.01 Background................................................................................................ 3-1 3.02 Description of Existing Facilities ................................................................ 3-1 3.03 Influent Flows and Loadings................................................................ 3-3 3.04 In-Plant Waste Loadings ..................................................................... 3-8 3.05 WPCP Performance and Permit Compliance ............................................ 3-9 3.06 Residuals Management ............................................................................. 3-14 3.07 Industrial Pretreatment Program................................................................ 3-15 SECTION 4–FLOW AND WASTELOAD FORECASTS 4.01 Sewer Service Area ................................................................................... 4-1 4.02 Population and Growth Projections............................................................ 4-1 4.03 Projected Flows ......................................................................................... 4-1 4.04 Projected Loadings .................................................................................... 4-3 SECTION 5–EVALUATION OF EXISTING FACILITIES AND SCREENING OF ALTERNATIVES 5.01 Regulatory and NPDES Permitting Issues................................................. 5-1 5.02 Unit Process Evaluation............................................................................. 5-7 SECTION 6–WASTEWATER TREATMENT ALTERNATIVES EVALUATIONS 6.01 Introduction ................................................................................................ 6-1 6.02 Influent Screening Alternatives Analysis.................................................... 6-1 6.03 Biological Treatment Alternatives Analysis ................................................ 6-4 6.04 Effluent Disinfection Alternative Analysis................................................... 6-9 6.05 Residuals Management Alternative Analysis............................................. 6-12 6.06 Other Recommended Plan Elements ........................................................ 6-22

TABLE OF CONTENTS Continued
Page No. or following
ii
SECTION 7–RECOMMENDED PLAN AND FISCAL IMPACT ANALYSES 7.01 Recommended Plan Summary .................................................................. 7-1 7.02 Opinion of Capital Costs and Project Financing ........................................ 7-4 7.03 Opinion of Operation, Maintenance, and Replacement Costs................... 7-4 7.04 Sewer Use Rate Impact of Recommended Plan ....................................... 7-5 7.05 Project Implementation Schedule .............................................................. 7-5
APPENDICES APPENDIX A–CITY OF DUBUQUE WPCP NPDES PERMIT APPENDIX B–ANTICIPATED WLA/PERMIT LIMITS FOR DUBUQUE WPCP APPENDIX C–PRESENT WORTH ANALYSIS APPENDIX D–DETAILED OPINIONS OF COST FOR BIOLOGICAL TREATMENT
ALTERNATIVE APPENDIX E–DETAILED OPINIONS OF COST FOR DISINFECTION ALTERNATIVES APPENDIX F–DETAILED OPINIONS OF COST FOR RESIDUALS MANAGEMENT
ALTERNATIVES
TABLES 3.02-1 Existing Effluent Limitationsa, City OF Dubuque, Iowa .............................. 3-2 3.02-2 Dubuque WPCP Existing Facilities ............................................................ 3-2 3.03-1 Average Daily Flows (2002-2007).............................................................. 3-3 3.03-2 BOD5 Loadings (2002-2007)...................................................................... 3-5 3.03-3 TSS Loadings (2002-2007)........................................................................ 3-5 3.05-1 Effluent BOD5 (2002-2007)........................................................................ 3-9 3.05-2 Effluent TSS (2002-2007) .......................................................................... 3-10 3.05-3 Effluent Ammonia Nitrogen (2002-2007) ................................................... 3-10 3.05-4 Effluent Fecal Coliform (2002-2007) .......................................................... 3-13 3.05-5 Effluent Chlorine Residual (2002-2007)..................................................... 3-13 3.05-6 Incinerator Emission Limits ........................................................................ 3-14 3.06-1 Dubuque WPCP Annual Sludge Quantities (2002-2007) .......................... 3-14 4.03-1 Existing Per Capita Flows and Infiltration/Inflow Calculations ................... 4-2 4.03-2 Design Flow Projections ............................................................................ 4-3 4.04-1 Per Capita BOD Loading Calculations....................................................... 4-4 4.04-2 Per Capita TSS Loading Calculations........................................................ 4-4 4.04-3 Design BOD5 Loading Projections ............................................................ 4-6 4.04-4 Design TSS Loading Projections ............................................................... 4-6 5.01-1 EPA Recommended Nutrient Criteria for Rivers in Ecoregion VII ............. 5-1 5.01-2 Anticipated NPDES Permit Limits .............................................................. 5-5 6.02-1 Influent Screening Opinion of Capital Cost Summary................................ 6-3 6.03-1 Biological Treatment Opinion of Present Worth Summary ........................ 6-7 6.04-1 Disinfection Opinion Of Present Worth Summary...................................... 6-10
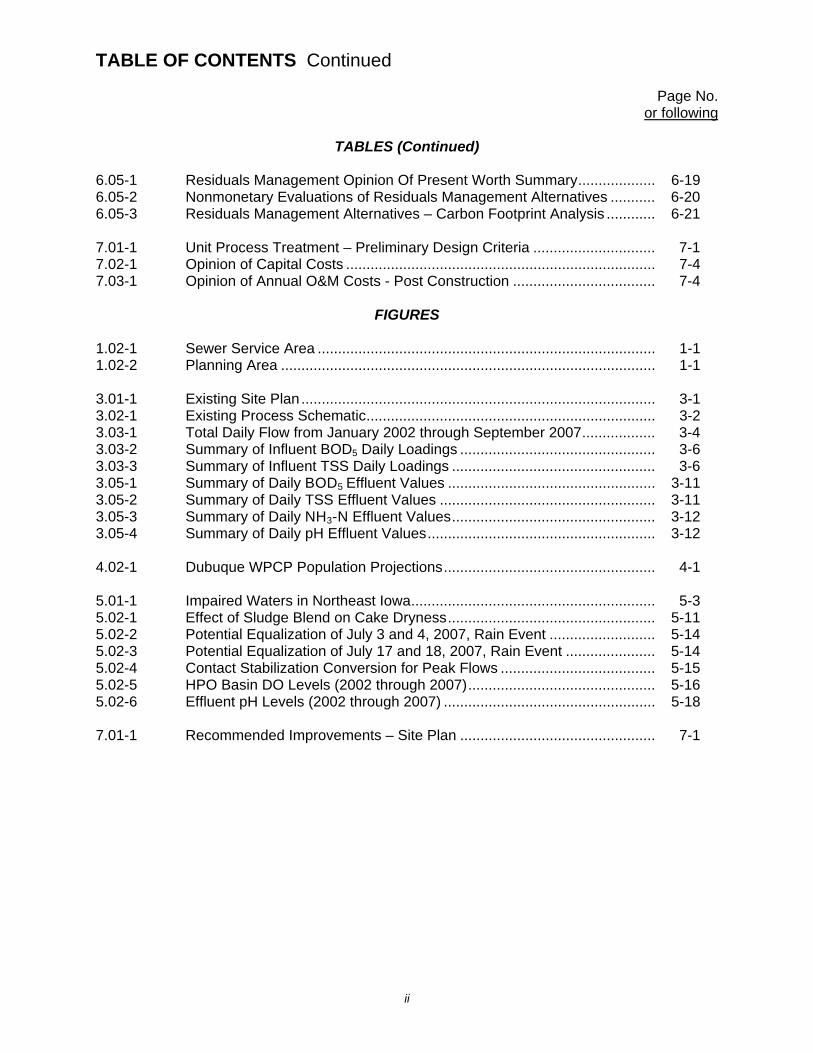
TABLE OF CONTENTS Continued
Page No. or following
ii
TABLES (Continued) 6.05-1 Residuals Management Opinion Of Present Worth Summary................... 6-19 6.05-2 Nonmonetary Evaluations of Residuals Management Alternatives ........... 6-20 6.05-3 Residuals Management Alternatives – Carbon Footprint Analysis ............ 6-21 7.01-1 Unit Process Treatment – Preliminary Design Criteria .............................. 7-1 7.02-1 Opinion of Capital Costs ............................................................................ 7-4 7.03-1 Opinion of Annual O&M Costs - Post Construction ................................... 7-4
FIGURES
1.02-1 Sewer Service Area ................................................................................... 1-1 1.02-2 Planning Area ............................................................................................ 1-1 3.01-1 Existing Site Plan ....................................................................................... 3-1 3.02-1 Existing Process Schematic....................................................................... 3-2 3.03-1 Total Daily Flow from January 2002 through September 2007.................. 3-4 3.03-2 Summary of Influent BOD5 Daily Loadings ................................................ 3-6 3.03-3 Summary of Influent TSS Daily Loadings .................................................. 3-6 3.05-1 Summary of Daily BOD5 Effluent Values ................................................... 3-11 3.05-2 Summary of Daily TSS Effluent Values ..................................................... 3-11 3.05-3 Summary of Daily NH3-N Effluent Values.................................................. 3-12 3.05-4 Summary of Daily pH Effluent Values........................................................ 3-12 4.02-1 Dubuque WPCP Population Projections.................................................... 4-1 5.01-1 Impaired Waters in Northeast Iowa............................................................ 5-3 5.02-1 Effect of Sludge Blend on Cake Dryness................................................... 5-11 5.02-2 Potential Equalization of July 3 and 4, 2007, Rain Event .......................... 5-14 5.02-3 Potential Equalization of July 17 and 18, 2007, Rain Event ...................... 5-14 5.02-4 Contact Stabilization Conversion for Peak Flows ...................................... 5-15 5.02-5 HPO Basin DO Levels (2002 through 2007).............................................. 5-16 5.02-6 Effluent pH Levels (2002 through 2007) .................................................... 5-18 7.01-1 Recommended Improvements – Site Plan ................................................ 7-1

SECTION 1 INTRODUCTION
City of Dubuque, Iowa Dubuque Water Pollution Control Plant Facilities Plan Section 1–Introduction
Prepared by STRAND ASSOCIATES, INC.® 1-1 RAW:pll\S:\@SAI\151--200\154\002\Wrd\Report\S1.doc\052008
1.01 PURPOSE AND SCOPE OF REPORT The City of Dubuque operates wastewater collection and treatment facilities that provide service to City residences, businesses, industries, and public institutions within the City of Dubuque. This Facilities Plan was prepared for the purpose of developing an overall plan for wastewater management at the Dubuque Water Pollution Control Plant (WPCP) for the next 20 years and beyond. This plan must be implemented to meet the requirements of federal and state regulations related to water quality in the Mississippi River. The majority of the current facilities at the Dubuque WPCP were placed in operation in 1975. The last major renovation of the facility was completed in 1996. Based on the age of the facilities and changes in the contributory flows to the Dubuque WPCP, there is a need to conduct a comprehensive review of the facilities. This report reviews the condition and capacity of the existing Dubuque WPCP facilities. The evaluations address compliance with the Iowa Administrative Code updates since the facility was designed in the 1970s, and upgraded in the 1990s, including the impacts of anticipated effluent limit changes. Facilities are evaluated for a 20-year planning period, which includes anticipated treatment needs through the planning year of 2030. A specific plan for modifications to the Dubuque WPCP is recommended and supported by an evaluation of monetary costs, environmental impacts, and other nonmonetary considerations. 1.02 LOCATION OF STUDY The Dubuque WPCP provides wastewater treatment for the City of Dubuque, Dubuque County, Iowa. Figure 1.02-1 indicates the existing sewer service area for the City, and Figure 1.02-2 presents the planning area for the Dubuque WPCP facilities plan based on the 2006 Annexation Study. 1.03 RELATED STUDIES AND REPORTS The following reports were used in the preparation of this Facilities Plan. A. I/I Analysis and Project Certification, Ecology Publication No. 97-03, USEPA, May 1985. B. Wastewater Treatment Facilities Plan of Action Study, Strand Associates, Inc., January
1991. C. Wastewater Treatment Facilities Solid Waste Coincineration Report, Strand Associates,
Inc., August 1991. D. Report on Annexation Study, City of Dubuque, Veenstra and Kimm, Inc., September 2006. E. Dubuque Metropolitan Area Transportation Study 2031 Long-Range Transportation Plan,
East Central Intergovernmental Association, 2006.
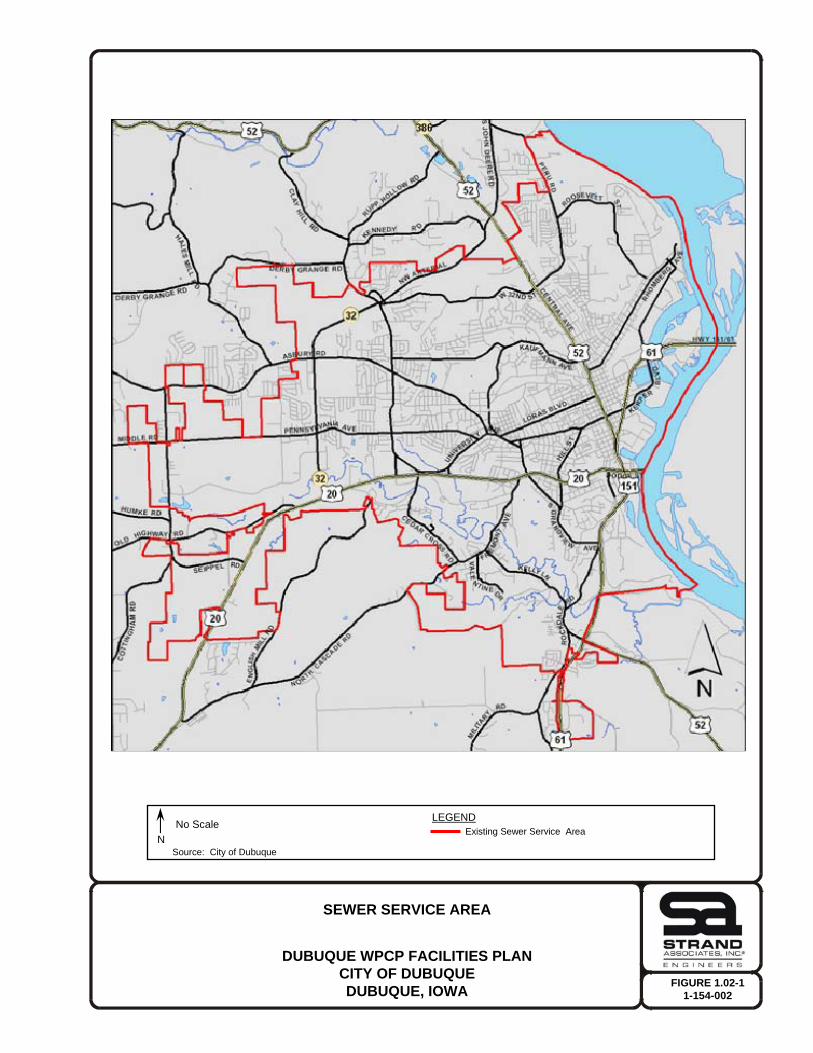
FIGURE 1.02-11-154-002
SEWER SERVICE AREA
DUBUQUE WPCP FACILITIES PLANCITY OF DUBUQUEDUBUQUE, IOWA
Source: City of Dubuque
LEGENDExisting Sewer Service Area
NNo Scale
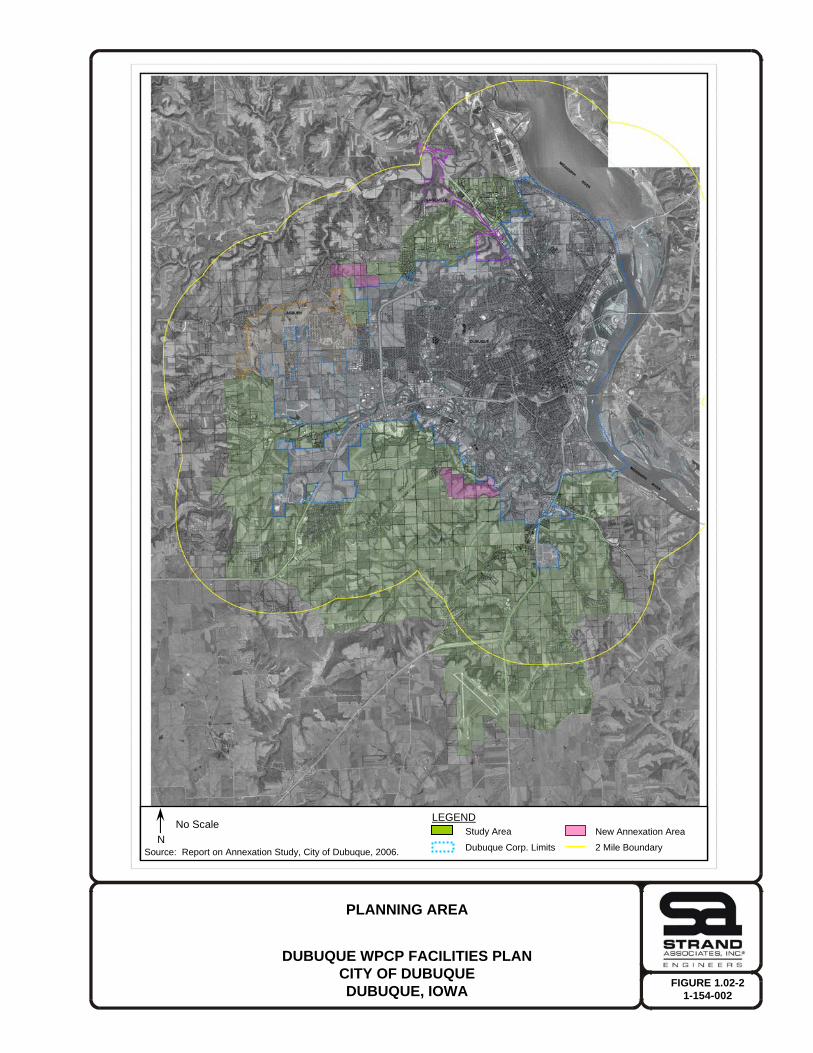
FIGURE 1.02-21-154-002
PLANNING AREA
DUBUQUE WPCP FACILITIES PLANCITY OF DUBUQUEDUBUQUE, IOWA
Source: Report on Annexation Study, City of Dubuque, 2006.
LEGENDStudy Area
Dubuque Corp. Limits
New Annexation Area
2 Mile BoundaryN
No Scale
City of Dubuque, Iowa Dubuque Water Pollution Control Plant Facilities Plan Section 1–Introduction
Prepared by STRAND ASSOCIATES, INC.® 1-2 RAW:pll\S:\@SAI\151--200\154\002\Wrd\Report\S1.doc\052008
F. Flow Equalization Study, Dubuque Water Pollution Control Plant, IIW Engineers & Surveyors, P.C., March 2007.
1.04 RELATED DRAWINGS AND SPECIFICATIONS The following were used in the preparation of this Facilities Plan. A. Wastewater Treatment Facilities Phase II, prepared by Henningson, Durham, and
Richardson, Inc. Engineers, 1974. B. Water Pollution Control Plant Phase 1 Improvements, prepared by Strand Associates, Inc.,
1993. C. Water Pollution Control Plant Phase 2 Improvements, prepared by Strand Associates, Inc.,
1993. D. Water Pollution Control Plant Phase 3 Improvements, prepared by Strand Associates, Inc.,
1996. 1.05 ABBREVIATIONS The following abbreviations are provided as an aid to the reader: avg - average BFP - belt filter press BOD5 - five day biochemical oxygen demand BPR - biological phosphorus removal cfm - cubic feet per minute cfs - cubic feet per second cfu/gTS - colony forming units per gram total solids col/100 mL - colonies (bacteria) per 100 milliliters CPR - chemical phosphorus removal CWA - Clean Water Act of 1972 DMASWA - Dubuque Metropolitan Area Solid Waste Agency DNR - Iowa Department of Natural Resources DO - dissolved oxygen ECIA - East Central Intergovernmental Association EPA - U.S. Environmental Protection Agency ft - feet ft2 - square feet ft3 - cubic feet gcd - gallons per capita per day GFG - green house gas gpd - gallons per day gpm - gallons per minute hp - horsepower
City of Dubuque, Iowa Dubuque Water Pollution Control Plant Facilities Plan Section 1–Introduction
Prepared by STRAND ASSOCIATES, INC.® 1-3 RAW:pll\S:\@SAI\151--200\154\002\Wrd\Report\S1.doc\052008
HPO - high purity oxygen HRT - hydraulic retention time in. - inches I/I - infiltration/inflow lbs - pounds lf - linear feet max - maximum MCC - motor control center mil gal - million gallons mgd - million gallons per day mg/L - milligrams per liter (parts per million in dilute solutions) MH - manhole min - minimum mL - milliliter ML - mixed liquor MLSS - mixed liquor suspended solids MLVSS - mixed liquor volatile suspended solids mo - month MPN - most probable number NH3N - ammonia nitrogen NPDES - National Pollutant Discharge Elimination System O2 - oxygen OTE - oxygen transfer efficiency P - phosphorus pcd - pounds per capita per day PE - population equivalent PI - plant effluent PS - pumping station PSA - pressure swing adsorption ppd - pounds per day (or lb/day) psig - pounds per square inch gauge POTW - publicly owned treatment works RAS - return activated sludge RW - raw wastewater SCADA - supervisory control and data acquisition scfm - standard cubic feet per minute SOR - surface overflow rate SOTE - standard oxygen transfer efficiency SRT - solids retention time SS - suspended solids SSES - sewer system evaluation survey SWD - side water depth TDH - total dynamic head TKN - total Kjeldahl nitrogen TN - total nitrogen TP - total phosphorous
City of Dubuque, Iowa Dubuque Water Pollution Control Plant Facilities Plan Section 1–Introduction
Prepared by STRAND ASSOCIATES, INC.® 1-4 RAW:pll\S:\@SAI\151--200\154\002\Wrd\Report\S1.doc\052008
TPAD - temperature phased anerobic digestion TPRS - thickened primary sludge TS - total solids TSS - total suspended solids (or SS) TWAS - thickened waste activated sludge μg - micrograms μg/L - micrograms per liter (parts per billion in dilute solutions) UV - ultraviolet light VFD - variable frequency drive VPSA - vacuum pressure-swing adsorption VSS - volatile suspended solids WAS - waste activated sludge WPCP - Water Pollution Control Plant-City of Dubuque WWTP - wastewater treatment plant WWTF - wastewater treatment facility

SECTION 2 EXISTING WASTEWATER CONVEYANCE FACILITIES
City of Dubuque, Iowa Dubuque Water Pollution Control Plant Facilities Plan Section 2–Existing Wastewater Conveyance Facilities
Prepared by STRAND ASSOCIATES, INC.® 2-1 RAW:pll\S:\@SAI\151--200\154\002\Wrd\Report\S2.doc\052008
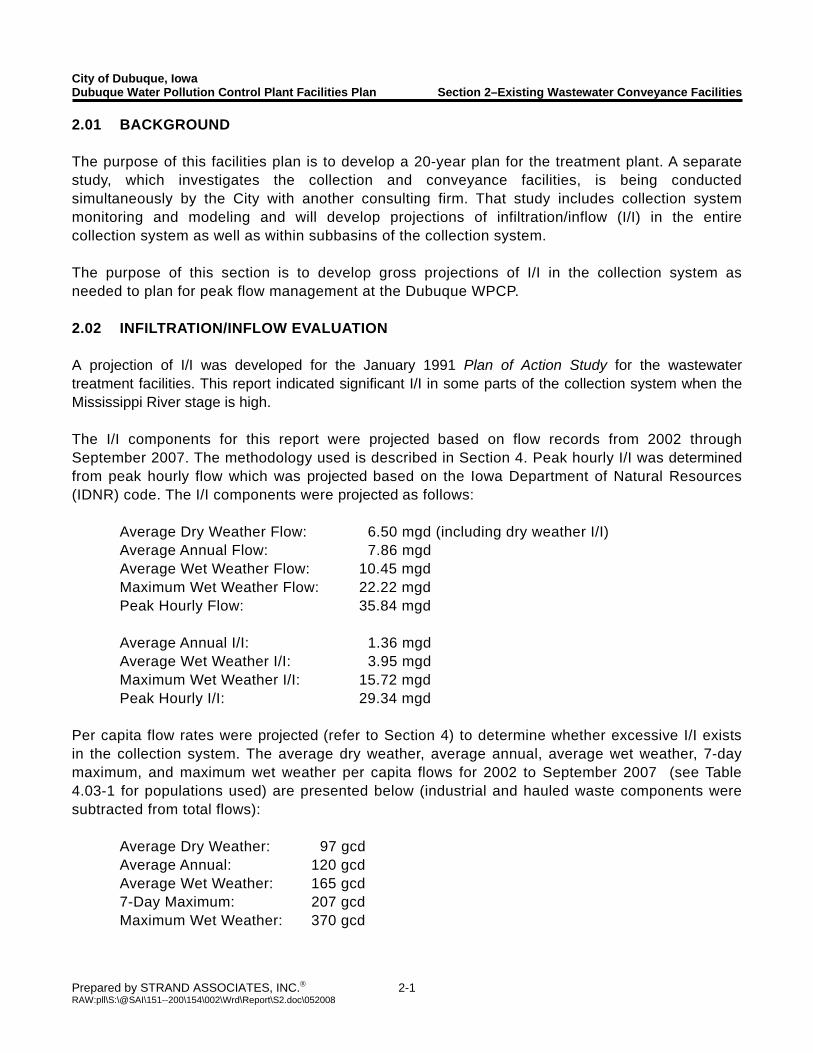
2.01 BACKGROUND The purpose of this facilities plan is to develop a 20-year plan for the treatment plant. A separate study, which investigates the collection and conveyance facilities, is being conducted simultaneously by the City with another consulting firm. That study includes collection system monitoring and modeling and will develop projections of infiltration/inflow (I/I) in the entire collection system as well as within subbasins of the collection system. The purpose of this section is to develop gross projections of I/I in the collection system as needed to plan for peak flow management at the Dubuque WPCP. 2.02 INFILTRATION/INFLOW EVALUATION A projection of I/I was developed for the January 1991 Plan of Action Study for the wastewater treatment facilities. This report indicated significant I/I in some parts of the collection system when the Mississippi River stage is high. The I/I components for this report were projected based on flow records from 2002 through September 2007. The methodology used is described in Section 4. Peak hourly I/I was determined from peak hourly flow which was projected based on the Iowa Department of Natural Resources (IDNR) code. The I/I components were projected as follows:
Average Dry Weather Flow: 6.50 mgd (including dry weather I/I) Average Annual Flow: 7.86 mgd Average Wet Weather Flow: 10.45 mgd Maximum Wet Weather Flow: 22.22 mgd Peak Hourly Flow: 35.84 mgd Average Annual I/I: 1.36 mgd Average Wet Weather I/I: 3.95 mgd Maximum Wet Weather I/I: 15.72 mgd Peak Hourly I/I: 29.34 mgd
Per capita flow rates were projected (refer to Section 4) to determine whether excessive I/I exists in the collection system. The average dry weather, average annual, average wet weather, 7-day maximum, and maximum wet weather per capita flows for 2002 to September 2007 (see Table 4.03-1 for populations used) are presented below (industrial and hauled waste components were subtracted from total flows):
Average Dry Weather: 97 gcd Average Annual: 120 gcd Average Wet Weather: 165 gcd 7-Day Maximum: 207 gcd Maximum Wet Weather: 370 gcd
City of Dubuque, Iowa Dubuque Water Pollution Control Plant Facilities Plan Section 2–Existing Wastewater Conveyance Facilities
Prepared by STRAND ASSOCIATES, INC.® 2-2 RAW:pll\S:\@SAI\151--200\154\002\Wrd\Report\S2.doc\052008
The average dry weather per capita flow of 97 gcd is less than the EPA nonexcessive infiltration guidance value of 120 gcd. The EPA nonexcessive inflow guidance value of 275 gcd for average wet weather flows is also higher than the 165 gcd projected. The maximum week per capita flow was projected at 207 gcd and is also below the 275 gcd guidance value. Based on these comparisons, I/I does not appear excessive. However, the City is conducting a separate study to evaluate I/I that will address these issues.

SECTION 3 EXISTING WASTEWATER TREATMENT FACILITIES
City of Dubuque, Iowa Dubuque Water Pollution Control Plant Facilities Plan Section 3–Existing Wastewater Treatment Facilities
Prepared by STRAND ASSOCIATES, INC.® 3-1 RAW:ebt\S:\@SAI\151--200\154\002\Wrd\Report\S3.doc\052708
3.01 BACKGROUND The City of Dubuque operates a secondary wastewater treatment plant that discharges to the Mississippi River. The majority of WPCP facilities were constructed in the 1960s and 1970s. The last major revisions to the WPCP were completed in the 1990s. A site plan of the existing facility is shown in Figure 3.01-1. This section presents a summary of the existing process and equipment as well as a review of the facility performance from January 2002 through September 2007. 3.02 DESCRIPTION OF EXISTING FACILITIES A. Historic Development of the Dubuque WPCP Site The City of Dubuque has operated a wastewater treatment facility at the site of the current Dubuque WPCP since approximately 1969. The original facility employed preliminary and primary treatment, followed by trickling filtration. Sludge was dewatered with vacuum filters and then incinerated. Clarifiers at the old plant were utilized for clarifying the trickling filter effluent, with sludge pumped from the old plant site to the head end of the new facilities. In 1973, the grit removal tanks, primary tanks, and trickling filters were covered, and an exhaust air odor scrubbing system was installed. In 1975, the biological treatment facilities were expanded to include pure oxygen activated sludge and final clarifiers downstream of the existing trickling filters. At that time, waste activated sludge (WAS) thickening and heat treatment (Zimpro) facilities were also provided. A belt filter press was installed in 1983 to improve the solids dewatering capability. Six WAS thickening centrifuges were installed in 1969. Four units were replaced in 1990. From 1993 through 1996, three phases of improvements were made to the plant. Phase 1 included the addition of new mechanical bar screens and screenings conveyors, a vortex grit removal system, new primary sludge pumps, an ash dewatering pad, and improvements to the sludge incineration system. The Zimpro sludge conditioning system and vacuum filters were decommissioned and removed. Two new dewatering centrifuges were installed to dewater sludge prior to incineration. Phase 2 improvements included the addition of chlorine contact tanks, a magnesium bisulfite dechlorination system and mixing chamber, and new final clarifier equipment. In 1996, Phase 3 improvements included final sludge pumping station improvements and new RAS pumps, various structural repairs, electrical upgrades, and a new Supervisory Control and Data Acquisition (SCADA) system. B. Existing Dubuque WPCP Facilities The existing Dubuque WPCP is located in the southern part of the City of Dubuque near the Mississippi River. The existing facilities were designed to meet the effluent limitations contained in the City’s National Pollutant Discharge Elimination System (NPDES) permit. Table 3.02-1 summarizes current NPDES permit limitations.
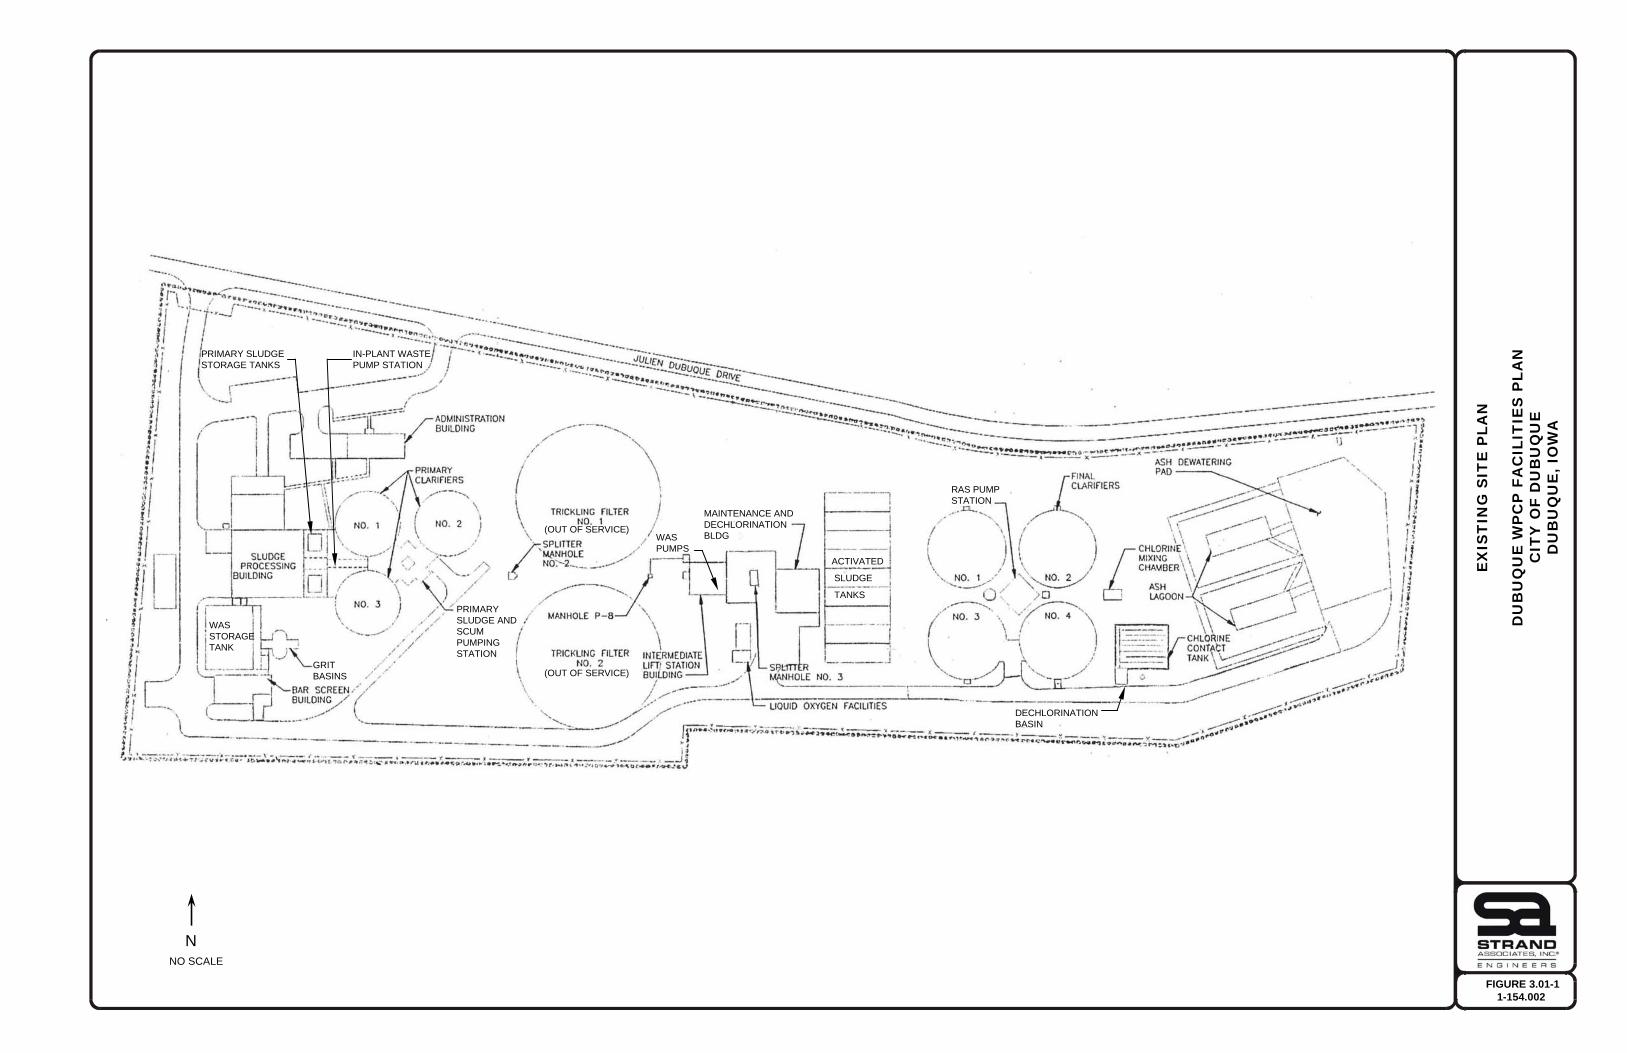
FIGURE 3.01-11-154.002
EX
IST
ING
SIT
E P
LAN
DU
BU
QU
E W
PC
P F
AC
ILIT
IES
PLA
NC
ITY
OF
DU
BU
QU
E
DU
BU
QU
E, I
OW
A
NNO SCALE
RAS PUMP STATION
WAS STORAGE TANK
DECHLORINATION BASIN
ACTIVATED
SLUDGE
TANKS
MAINTENANCE AND DECHLORINATION BLDGWAS
PUMPS
(OUT OF SERVICE)
(OUT OF SERVICE)
PRIMARY SLUDGE AND SCUM PUMPING STATION
GRIT BASINS
IN-PLANT WASTE PUMP STATION
PRIMARY SLUDGE STORAGE TANKS
City of Dubuque, Iowa Dubuque Water Pollution Control Plant Facilities Plan Section 3–Existing Wastewater Treatment Facilities
Prepared by STRAND ASSOCIATES, INC.® 3-2 RAW:ebt\S:\@SAI\151--200\154\002\Wrd\Report\S3.doc\052708
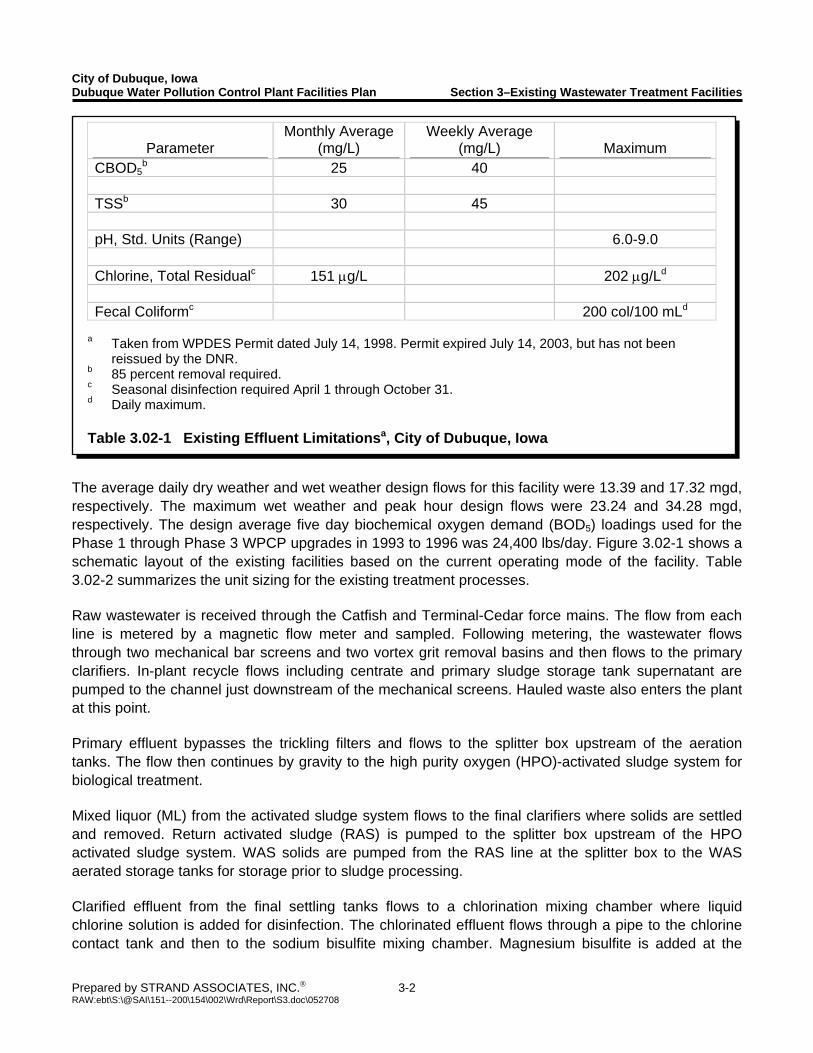
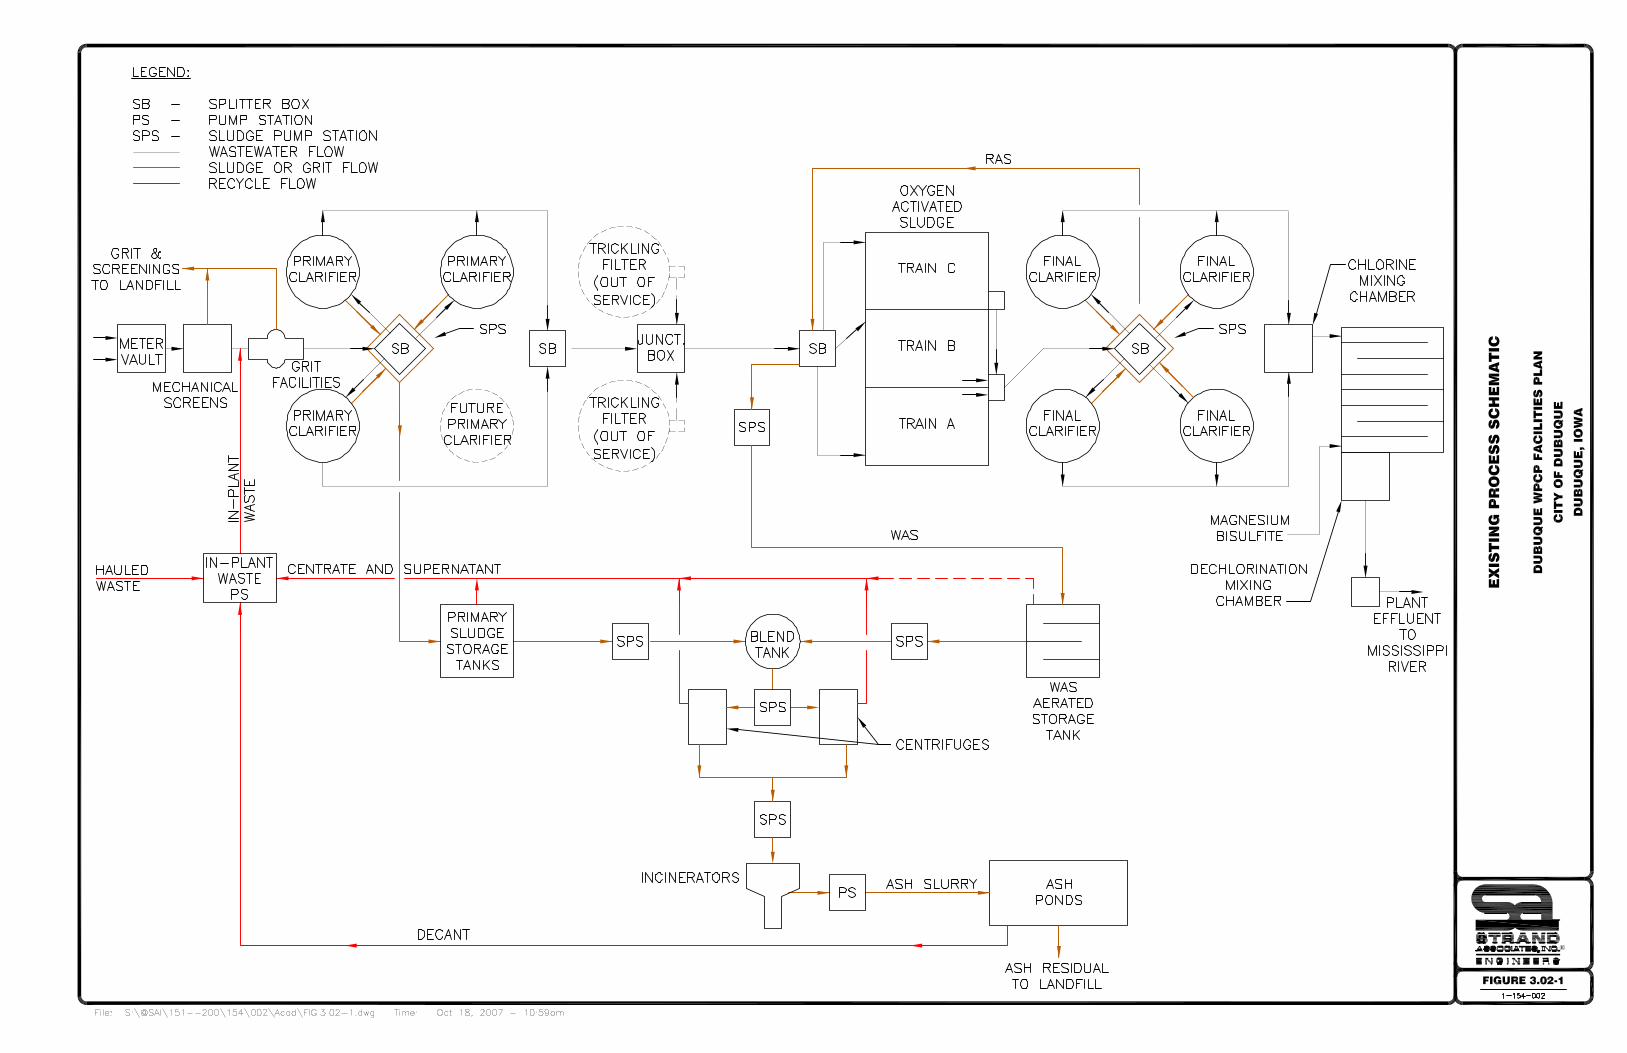
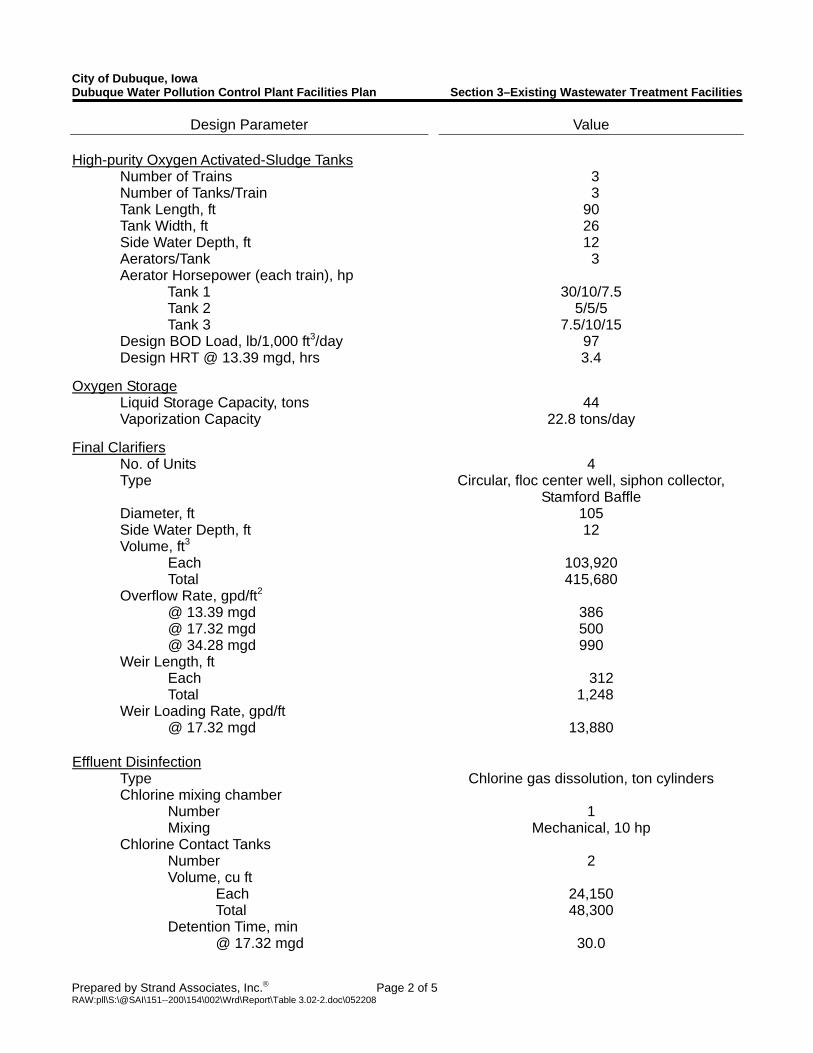
The average daily dry weather and wet weather design flows for this facility were 13.39 and 17.32 mgd, respectively. The maximum wet weather and peak hour design flows were 23.24 and 34.28 mgd, respectively. The design average five day biochemical oxygen demand (BOD5) loadings used for the Phase 1 through Phase 3 WPCP upgrades in 1993 to 1996 was 24,400 lbs/day. Figure 3.02-1 shows a schematic layout of the existing facilities based on the current operating mode of the facility. Table 3.02-2 summarizes the unit sizing for the existing treatment processes. Raw wastewater is received through the Catfish and Terminal-Cedar force mains. The flow from each line is metered by a magnetic flow meter and sampled. Following metering, the wastewater flows through two mechanical bar screens and two vortex grit removal basins and then flows to the primary clarifiers. In-plant recycle flows including centrate and primary sludge storage tank supernatant are pumped to the channel just downstream of the mechanical screens. Hauled waste also enters the plant at this point. Primary effluent bypasses the trickling filters and flows to the splitter box upstream of the aeration tanks. The flow then continues by gravity to the high purity oxygen (HPO)-activated sludge system for biological treatment. Mixed liquor (ML) from the activated sludge system flows to the final clarifiers where solids are settled and removed. Return activated sludge (RAS) is pumped to the splitter box upstream of the HPO activated sludge system. WAS solids are pumped from the RAS line at the splitter box to the WAS aerated storage tanks for storage prior to sludge processing. Clarified effluent from the final settling tanks flows to a chlorination mixing chamber where liquid chlorine solution is added for disinfection. The chlorinated effluent flows through a pipe to the chlorine contact tank and then to the sodium bisulfite mixing chamber. Magnesium bisulfite is added at the
Parameter Monthly Average
(mg/L) Weekly Average
(mg/L) Maximum CBOD5
b 25 40 TSSb 30 45 pH, Std. Units (Range) 6.0-9.0 Chlorine, Total Residualc 151 μg/L 202 μg/Ld Fecal Coliformc 200 col/100 mLd
a Taken from WPDES Permit dated July 14, 1998. Permit expired July 14, 2003, but has not been
reissued by the DNR. b 85 percent removal required. c Seasonal disinfection required April 1 through October 31. d Daily maximum. Table 3.02-1 Existing Effluent Limitationsa, City of Dubuque, Iowa
City of Dubuque, Iowa Dubuque Water Pollution Control Plant Facilities Plan Section 3–Existing Wastewater Treatment Facilities
Prepared by Strand Associates, Inc.® Page 1 of 5 RAW:pll\S:\@SAI\151--200\154\002\Wrd\Report\Table 3.02-2.doc\052208
TABLE 3.02-2 DUBUQUE WPCP EXISTING FACILITIES
Design Parameter Value Flows and Loading Average Dry Weather, mgd 13.39 Average Wet Weather, mgd 17.32 Maximum Wet Weather, mgd 23.24 Peak Hourly Flow, mgd 34.28
BOD, lb/d 24,400 TSS, lb/d 24,600
Mechanically Cleaned Bar Screens No. of Units 2 Rack Size 3-ft 6-in width, 3/4-in opening size Type Climbing Rake Mechanism Capacity 20.0 mgd (each unit) Controls Level and timed actuation Grit Removal Number of Units 2 Type Vortex Capacity 34.3 mgd, each Grit Pumps
Number 2 Type Recessed Impeller Motor 15 hp
Primary Clarifiers No. of Units 3 Type Circular Diameter, ft 90 Side Water Depth, ft 9
Total area, ft2 19,100 Overflow Rate, gpd/ft2 @ 40.0 mgd 2,100 Trickling Filters, Out of Service No. of Units 2 Diameter, feet 195 Intermediate Lift Station Trickling filter effluent pumps, out of service 3 @ 14,000 gpm WAS pumps
No. of Units 2 Type Centrifugal Capacity 250 gpm each
City of Dubuque, Iowa Dubuque Water Pollution Control Plant Facilities Plan Section 3–Existing Wastewater Treatment Facilities
Prepared by Strand Associates, Inc.® Page 2 of 5 RAW:pll\S:\@SAI\151--200\154\002\Wrd\Report\Table 3.02-2.doc\052208
Design Parameter Value High-purity Oxygen Activated-Sludge Tanks Number of Trains 3 Number of Tanks/Train 3 Tank Length, ft 90 Tank Width, ft 26 Side Water Depth, ft 12 Aerators/Tank 3 Aerator Horsepower (each train), hp
Tank 1 Tank 2 Tank 3
30/10/7.5
5/5/5 7.5/10/15
Design BOD Load, lb/1,000 ft3/day 97 Design HRT @ 13.39 mgd, hrs 3.4 Oxygen Storage Liquid Storage Capacity, tons 44 Vaporization Capacity 22.8 tons/day Final Clarifiers No. of Units 4 Type Circular, floc center well, siphon collector,
Stamford Baffle Diameter, ft 105 Side Water Depth, ft 12 Volume, ft3 Each 103,920 Total 415,680 Overflow Rate, gpd/ft2 @ 13.39 mgd 386 @ 17.32 mgd 500 @ 34.28 mgd 990 Weir Length, ft Each 312 Total 1,248 Weir Loading Rate, gpd/ft @ 17.32 mgd 13,880
Effluent Disinfection Type Chlorine gas dissolution, ton cylinders Chlorine mixing chamber Number 1 Mixing Mechanical, 10 hp Chlorine Contact Tanks Number 2 Volume, cu ft
Each 24,150 Total 48,300
Detention Time, min @ 17.32 mgd 30.0
City of Dubuque, Iowa Dubuque Water Pollution Control Plant Facilities Plan Section 3–Existing Wastewater Treatment Facilities
Prepared by Strand Associates, Inc.® Page 3 of 5 RAW:pll\S:\@SAI\151--200\154\002\Wrd\Report\Table 3.02-2.doc\052208
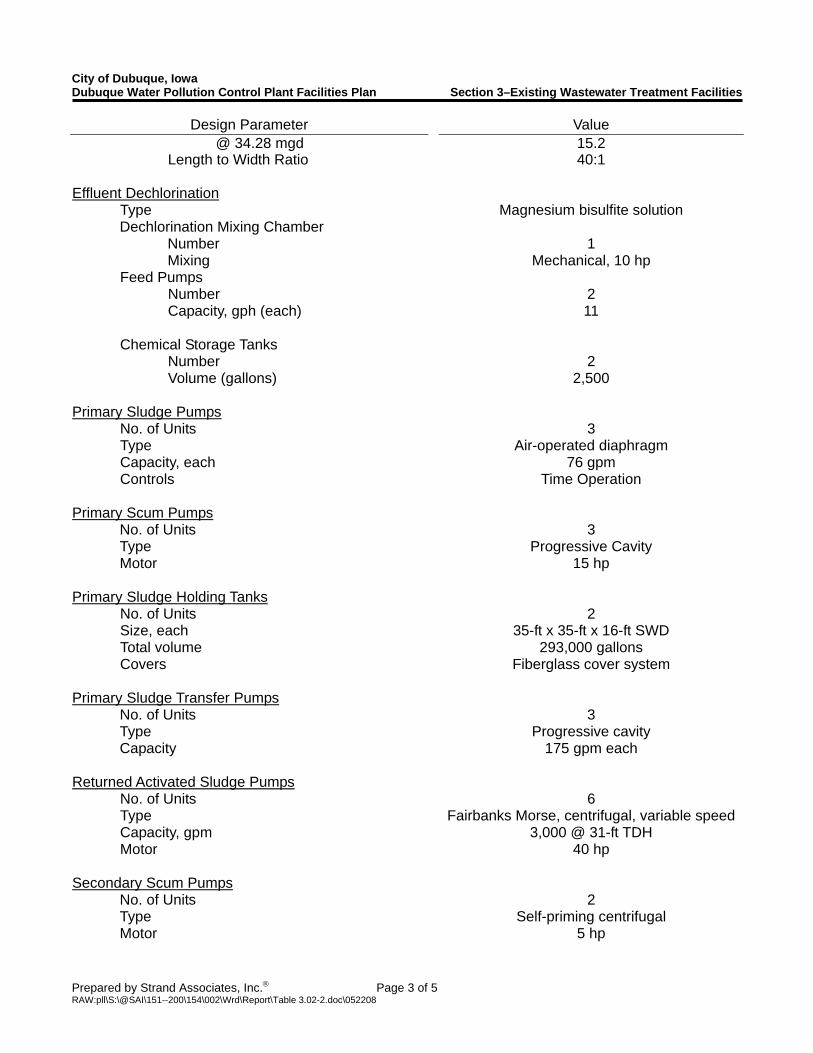
Design Parameter Value @ 34.28 mgd 15.2
Length to Width Ratio 40:1 Effluent Dechlorination Type Magnesium bisulfite solution
Dechlorination Mixing Chamber Number 1 Mixing Mechanical, 10 hp
Feed Pumps Number 2 Capacity, gph (each) 11 Chemical Storage Tanks Number 2 Volume (gallons) 2,500 Primary Sludge Pumps No. of Units 3 Type Air-operated diaphragm Capacity, each 76 gpm Controls Time Operation Primary Scum Pumps
No. of Units 3 Type Progressive Cavity Motor 15 hp
Primary Sludge Holding Tanks No. of Units 2 Size, each 35-ft x 35-ft x 16-ft SWD Total volume 293,000 gallons Covers Fiberglass cover system Primary Sludge Transfer Pumps
No. of Units 3 Type Progressive cavity Capacity 175 gpm each
Returned Activated Sludge Pumps No. of Units 6 Type Fairbanks Morse, centrifugal, variable speed Capacity, gpm 3,000 @ 31-ft TDH Motor 40 hp Secondary Scum Pumps
No. of Units 2 Type Self-priming centrifugal Motor 5 hp
City of Dubuque, Iowa Dubuque Water Pollution Control Plant Facilities Plan Section 3–Existing Wastewater Treatment Facilities
Prepared by Strand Associates, Inc.® Page 4 of 5 RAW:pll\S:\@SAI\151--200\154\002\Wrd\Report\Table 3.02-2.doc\052208
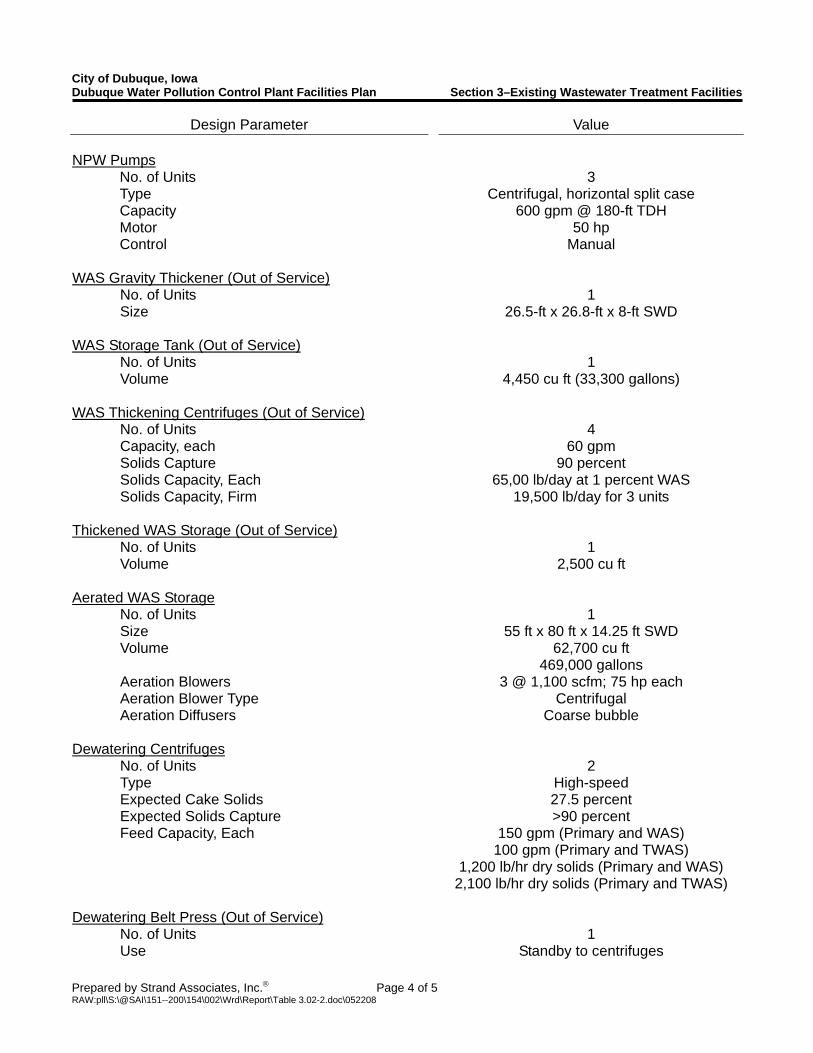
Design Parameter Value NPW Pumps
No. of Units 3 Type Centrifugal, horizontal split case Capacity 600 gpm @ 180-ft TDH Motor 50 hp Control Manual
WAS Gravity Thickener (Out of Service) No. of Units 1 Size 26.5-ft x 26.8-ft x 8-ft SWD WAS Storage Tank (Out of Service) No. of Units 1 Volume 4,450 cu ft (33,300 gallons) WAS Thickening Centrifuges (Out of Service) No. of Units 4 Capacity, each 60 gpm Solids Capture 90 percent Solids Capacity, Each 65,00 lb/day at 1 percent WAS Solids Capacity, Firm 19,500 lb/day for 3 units Thickened WAS Storage (Out of Service) No. of Units 1 Volume 2,500 cu ft Aerated WAS Storage No. of Units 1 Size 55 ft x 80 ft x 14.25 ft SWD Volume 62,700 cu ft 469,000 gallons Aeration Blowers 3 @ 1,100 scfm; 75 hp each Aeration Blower Type Centrifugal Aeration Diffusers Coarse bubble Dewatering Centrifuges No. of Units 2 Type High-speed Expected Cake Solids 27.5 percent Expected Solids Capture >90 percent Feed Capacity, Each 150 gpm (Primary and WAS) 100 gpm (Primary and TWAS) 1,200 lb/hr dry solids (Primary and WAS) 2,100 lb/hr dry solids (Primary and TWAS) Dewatering Belt Press (Out of Service) No. of Units 1 Use Standby to centrifuges
City of Dubuque, Iowa Dubuque Water Pollution Control Plant Facilities Plan Section 3–Existing Wastewater Treatment Facilities
Prepared by Strand Associates, Inc.® Page 5 of 5 RAW:pll\S:\@SAI\151--200\154\002\Wrd\Report\Table 3.02-2.doc\052208
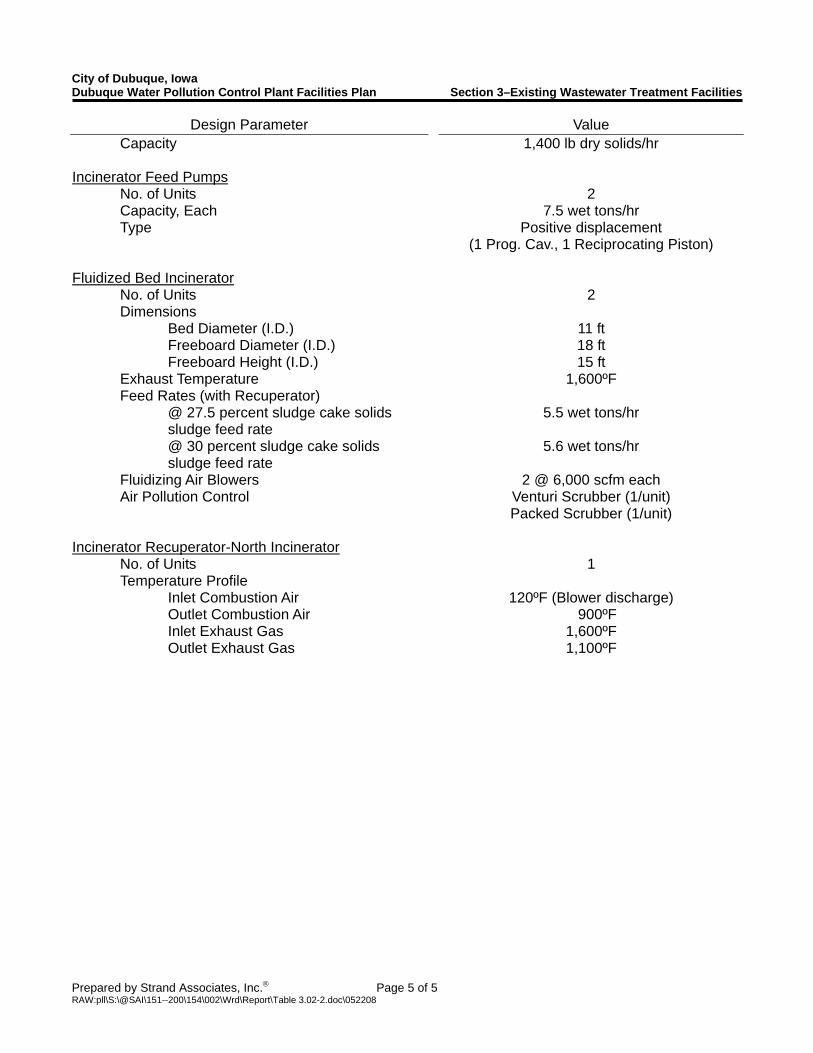
Design Parameter Value Capacity 1,400 lb dry solids/hr Incinerator Feed Pumps No. of Units 2 Capacity, Each 7.5 wet tons/hr Type Positive displacement
(1 Prog. Cav., 1 Reciprocating Piston) Fluidized Bed Incinerator No. of Units 2 Dimensions Bed Diameter (I.D.) 11 ft Freeboard Diameter (I.D.) 18 ft Freeboard Height (I.D.) 15 ft Exhaust Temperature 1,600ºF Feed Rates (with Recuperator) @ 27.5 percent sludge cake solids sludge feed rate
5.5 wet tons/hr
@ 30 percent sludge cake solids sludge feed rate
5.6 wet tons/hr
Fluidizing Air Blowers 2 @ 6,000 scfm each Air Pollution Control Venturi Scrubber (1/unit) Packed Scrubber (1/unit) Incinerator Recuperator-North Incinerator No. of Units 1 Temperature Profile Inlet Combustion Air 120ºF (Blower discharge) Outlet Combustion Air 900ºF Inlet Exhaust Gas 1,600ºF Outlet Exhaust Gas 1,100ºF
City of Dubuque, Iowa Dubuque Water Pollution Control Plant Facilities Plan Section 3–Existing Wastewater Treatment Facilities
Prepared by STRAND ASSOCIATES, INC.® 3-3 RAW:ebt\S:\@SAI\151--200\154\002\Wrd\Report\S3.doc\052708
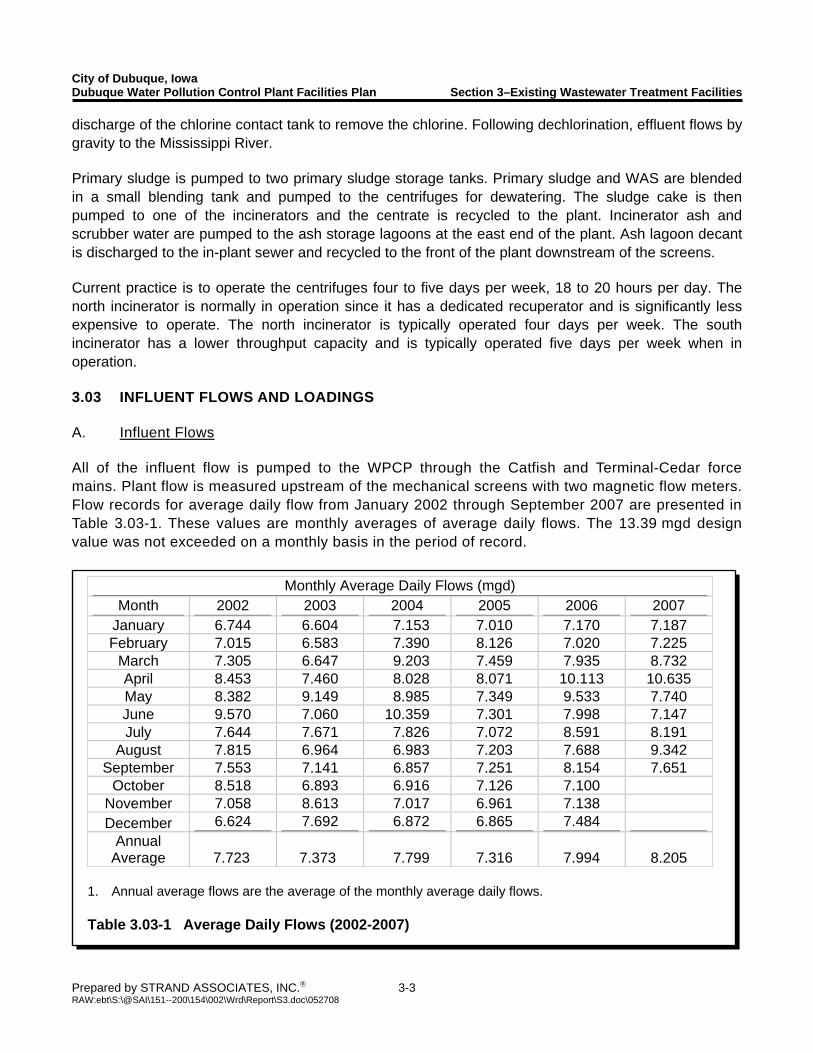
discharge of the chlorine contact tank to remove the chlorine. Following dechlorination, effluent flows by gravity to the Mississippi River. Primary sludge is pumped to two primary sludge storage tanks. Primary sludge and WAS are blended in a small blending tank and pumped to the centrifuges for dewatering. The sludge cake is then pumped to one of the incinerators and the centrate is recycled to the plant. Incinerator ash and scrubber water are pumped to the ash storage lagoons at the east end of the plant. Ash lagoon decant is discharged to the in-plant sewer and recycled to the front of the plant downstream of the screens. Current practice is to operate the centrifuges four to five days per week, 18 to 20 hours per day. The north incinerator is normally in operation since it has a dedicated recuperator and is significantly less expensive to operate. The north incinerator is typically operated four days per week. The south incinerator has a lower throughput capacity and is typically operated five days per week when in operation. 3.03 INFLUENT FLOWS AND LOADINGS A. Influent Flows All of the influent flow is pumped to the WPCP through the Catfish and Terminal-Cedar force mains. Plant flow is measured upstream of the mechanical screens with two magnetic flow meters. Flow records for average daily flow from January 2002 through September 2007 are presented in Table 3.03-1. These values are monthly averages of average daily flows. The 13.39 mgd design value was not exceeded on a monthly basis in the period of record.
Monthly Average Daily Flows (mgd) Month 2002 2003 2004 2005 2006 2007
January 6.744 6.604 7.153 7.010 7.170 7.187 February 7.015 6.583 7.390 8.126 7.020 7.225
March 7.305 6.647 9.203 7.459 7.935 8.732 April 8.453 7.460 8.028 8.071 10.113 10.635 May 8.382 9.149 8.985 7.349 9.533 7.740 June 9.570 7.060 10.359 7.301 7.998 7.147 July 7.644 7.671 7.826 7.072 8.591 8.191
August 7.815 6.964 6.983 7.203 7.688 9.342 September 7.553 7.141 6.857 7.251 8.154 7.651
October 8.518 6.893 6.916 7.126 7.100 November 7.058 8.613 7.017 6.961 7.138 December 6.624 7.692 6.872 6.865 7.484
Annual Average 7.723
7.373
7.799 7.316 7.994
8.205
1. Annual average flows are the average of the monthly average daily flows. Table 3.03-1 Average Daily Flows (2002-2007)
City of Dubuque, Iowa Dubuque Water Pollution Control Plant Facilities Plan Section 3–Existing Wastewater Treatment Facilities
Prepared by STRAND ASSOCIATES, INC.® 3-4 RAW:ebt\S:\@SAI\151--200\154\002\Wrd\Report\S3.doc\052708
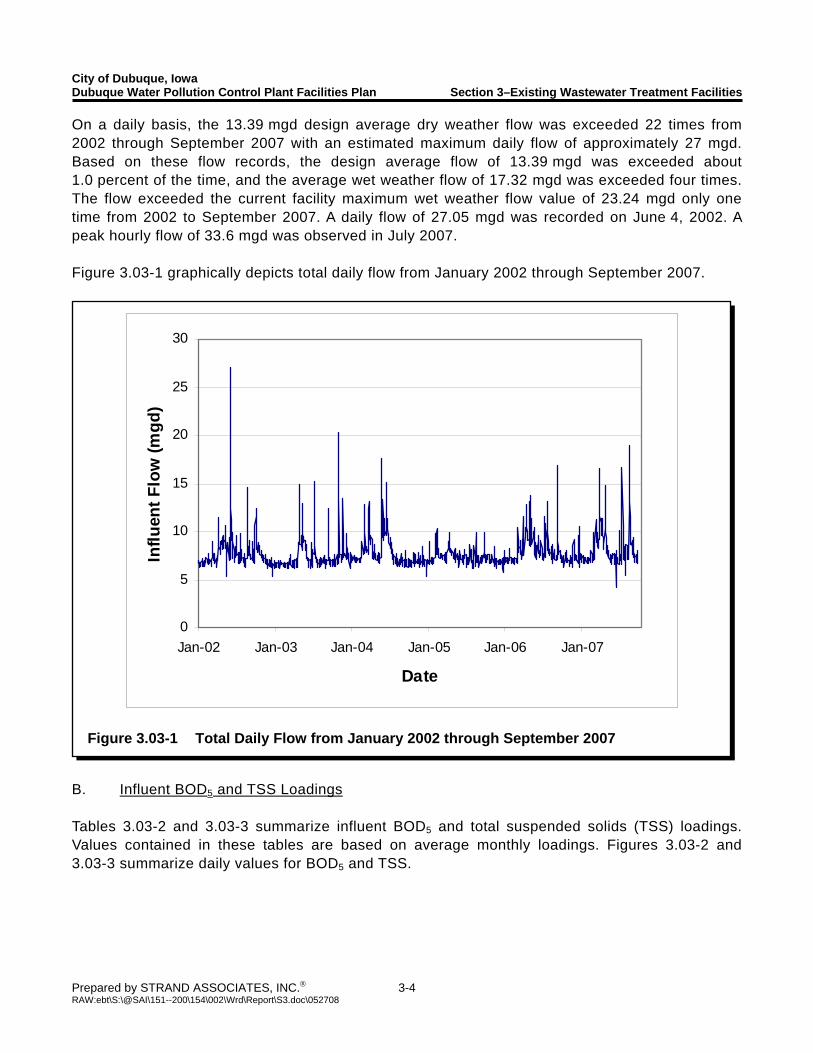
On a daily basis, the 13.39 mgd design average dry weather flow was exceeded 22 times from 2002 through September 2007 with an estimated maximum daily flow of approximately 27 mgd. Based on these flow records, the design average flow of 13.39 mgd was exceeded about 1.0 percent of the time, and the average wet weather flow of 17.32 mgd was exceeded four times. The flow exceeded the current facility maximum wet weather flow value of 23.24 mgd only one time from 2002 to September 2007. A daily flow of 27.05 mgd was recorded on June 4, 2002. A peak hourly flow of 33.6 mgd was observed in July 2007. Figure 3.03-1 graphically depicts total daily flow from January 2002 through September 2007.
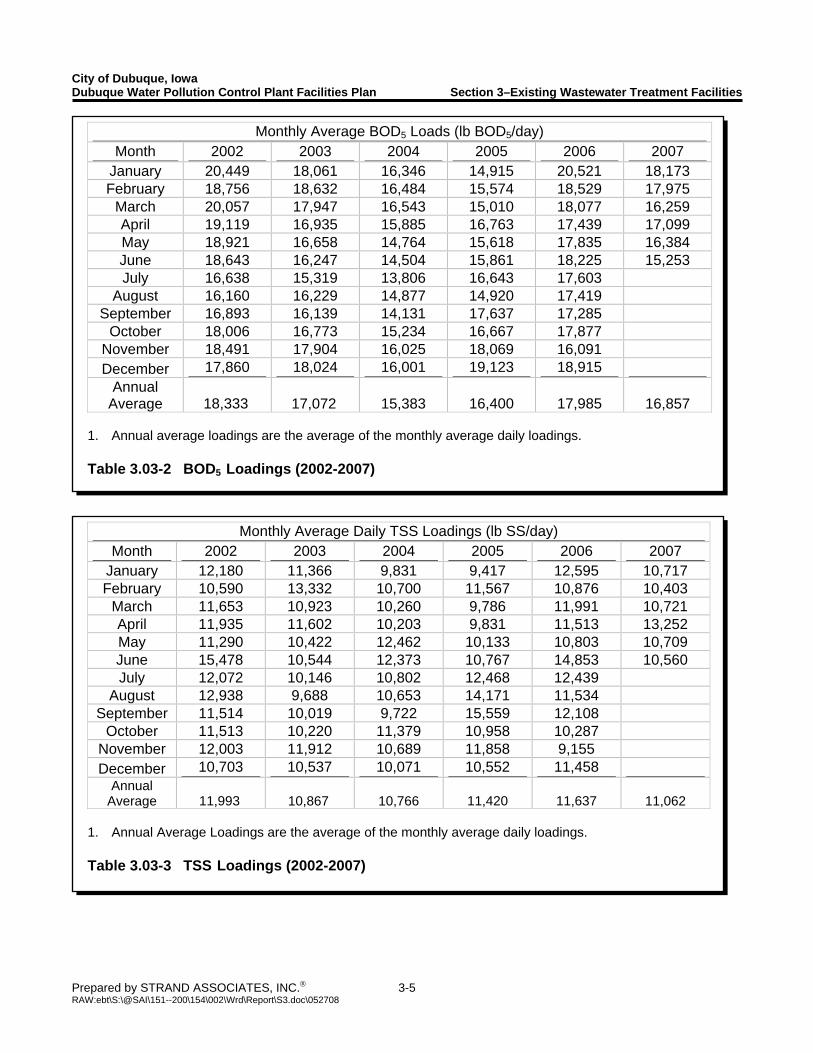
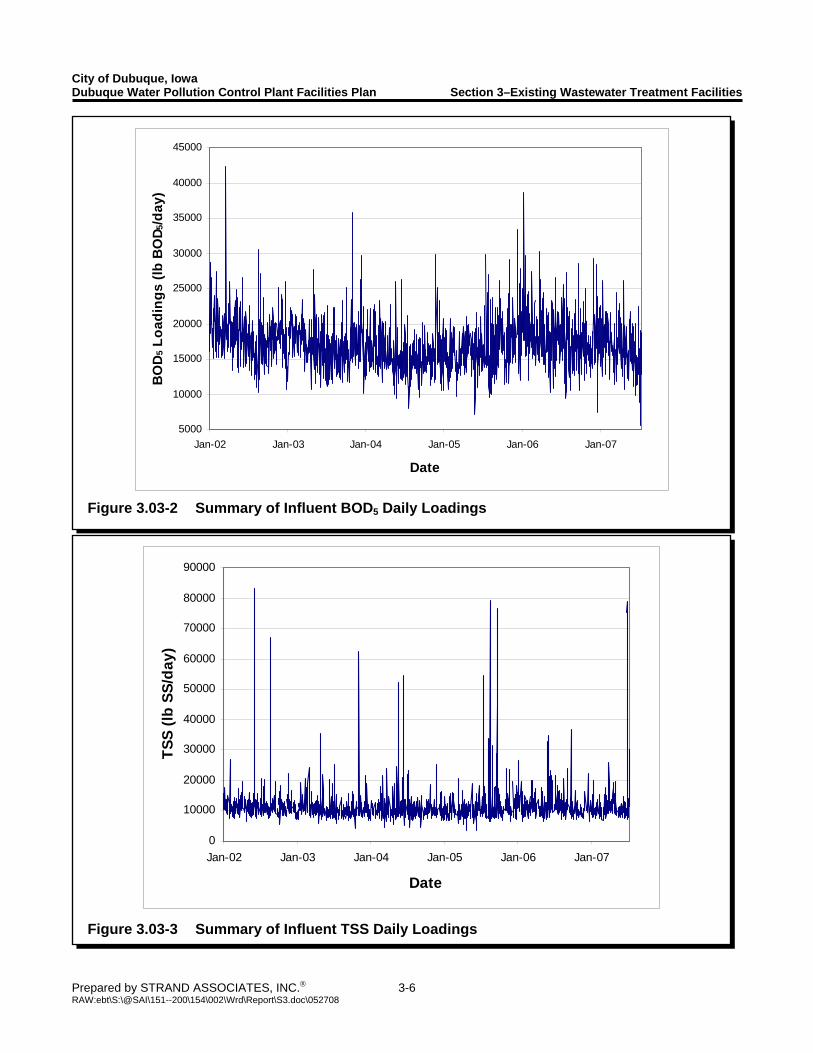
B. Influent BOD5 and TSS Loadings Tables 3.03-2 and 3.03-3 summarize influent BOD5 and total suspended solids (TSS) loadings. Values contained in these tables are based on average monthly loadings. Figures 3.03-2 and 3.03-3 summarize daily values for BOD5 and TSS.
0
5
10
15
20
25
30
Jan-02 Jan-03 Jan-04 Jan-05 Jan-06 Jan-07
Date
Influ
ent F
low
(mgd
)
Figure 3.03-1 Total Daily Flow from January 2002 through September 2007
City of Dubuque, Iowa Dubuque Water Pollution Control Plant Facilities Plan Section 3–Existing Wastewater Treatment Facilities
Prepared by STRAND ASSOCIATES, INC.® 3-5 RAW:ebt\S:\@SAI\151--200\154\002\Wrd\Report\S3.doc\052708
Monthly Average Daily TSS Loadings (lb SS/day) Month 2002 2003 2004 2005 2006 2007
January 12,180 11,366 9,831 9,417 12,595 10,717 February 10,590 13,332 10,700 11,567 10,876 10,403
March 11,653 10,923 10,260 9,786 11,991 10,721 April 11,935 11,602 10,203 9,831 11,513 13,252 May 11,290 10,422 12,462 10,133 10,803 10,709 June 15,478 10,544 12,373 10,767 14,853 10,560 July 12,072 10,146 10,802 12,468 12,439
August 12,938 9,688 10,653 14,171 11,534 September 11,514 10,019 9,722 15,559 12,108
October 11,513 10,220 11,379 10,958 10,287 November 12,003 11,912 10,689 11,858 9,155 December 10,703 10,537 10,071 10,552 11,458
Annual Average 11,993
10,867
10,766 11,420 11,637
11,062
1. Annual Average Loadings are the average of the monthly average daily loadings. Table 3.03-3 TSS Loadings (2002-2007)
Monthly Average BOD5 Loads (lb BOD5/day) Month 2002 2003 2004 2005 2006 2007
January 20,449 18,061 16,346 14,915 20,521 18,173 February 18,756 18,632 16,484 15,574 18,529 17,975
March 20,057 17,947 16,543 15,010 18,077 16,259 April 19,119 16,935 15,885 16,763 17,439 17,099 May 18,921 16,658 14,764 15,618 17,835 16,384 June 18,643 16,247 14,504 15,861 18,225 15,253 July 16,638 15,319 13,806 16,643 17,603
August 16,160 16,229 14,877 14,920 17,419 September 16,893 16,139 14,131 17,637 17,285
October 18,006 16,773 15,234 16,667 17,877 November 18,491 17,904 16,025 18,069 16,091 December 17,860 18,024 16,001 19,123 18,915
Annual Average 18,333
17,072
15,383 16,400 17,985
16,857
1. Annual average loadings are the average of the monthly average daily loadings. Table 3.03-2 BOD5 Loadings (2002-2007)
City of Dubuque, Iowa Dubuque Water Pollution Control Plant Facilities Plan Section 3–Existing Wastewater Treatment Facilities
Prepared by STRAND ASSOCIATES, INC.® 3-6 RAW:ebt\S:\@SAI\151--200\154\002\Wrd\Report\S3.doc\052708
5000
10000
15000
20000
25000
30000
35000
40000
45000
Jan-02 Jan-03 Jan-04 Jan-05 Jan-06 Jan-07
Date
BO
D5 L
oadi
ngs
(lb B
OD 5
/day
)
Figure 3.03-2 Summary of Influent BOD5 Daily Loadings
0
10000
20000
30000
40000
50000
60000
70000
80000
90000
Jan-02 Jan-03 Jan-04 Jan-05 Jan-06 Jan-07
Date
TSS
(lb S
S/da
y)
Figure 3.03-3 Summary of Influent TSS Daily Loadings
City of Dubuque, Iowa Dubuque Water Pollution Control Plant Facilities Plan Section 3–Existing Wastewater Treatment Facilities
Prepared by STRAND ASSOCIATES, INC.® 3-7 RAW:ebt\S:\@SAI\151--200\154\002\Wrd\Report\S3.doc\052708
From 2002 to June 2007, the total BOD and TSS loadings averaged 16,993 and 11,291 lb/day, respectively. The design BOD and TSS loadings for the existing plant are 24,400 lb/day and 24,600 lb/day, respectively. Therefore the plant design loadings have not been exceeded, and the plant is loaded at about 70 percent of the BOD capacity and at about 46 percent of the TSS capacity (excluding in-plant waste recycle streams). Loadings from industrial sources accounted for about 38 percent of the BOD and 14 percent of the TSS loadings. The majority of the BOD/TSS industrial loading is contributed by three major industries. These are Inland Protein (IP), Swiss Valley Farms (SVF), and Rousselot (ROS). ROS discharges about 55 percent of the industrial BOD load (3,588 lb/day) and about 36 percent of the industrial TSS load (574 lb/day). IP and SVF each contribute about half of the remaining loads. Because of the soluble, high-strength industrial loadings, the influent wastewater BOD is more soluble than most municipal wastewaters. For most WWTP influents, the average TSS loading is marginally greater than the average BOD5 loading. However, the influent data for the Dubuque WPCP indicates that the average TSS loading is approximately 6,000 to 7,000 lbs/day less than the average BOD5 loading. The soluble nature of the industrial loadings (measured at the respective industrial discharge locations) account for approximately 4,000 to 5,000 lbs/day of the noted difference. However, the remaining difference cannot be accounted for unless there is a consistent sampling error that underestimates TSS (as well as the BOD5 associated with those solids) in the influent wastewater. There is reason to believe that TSS and BOD5 concentrations are consistently underestimated. The following observations appear to support this hypothesis:
1. Based on plant records since 2002, the amount of primary sludge generated (see Section 3.06) would require an average primary clarifier TSS removal efficiency of 96 percent to achieve the amount of primary sludge from the measured influent TSS loadings (including an allowance for in-plant waste recycle loadings). This removal efficiency is significantly above the more typical 65 to 70 percent TSS removal efficiency observed in primary clarifiers.
2. Based on plant records since 2002, the average measured primary clarifier TSS
removal efficiency [(influent TSS–effluent TSS)/influent TSS; including an allowance for in-plant waste loadings] is only 53 percent, which is significantly lower than typical 65 to 70 percent.
3. Based on plant records since 2002, the average measured primary clarifier BOD5
removal efficiency [(influent BOD5–effluent BOD5)/influent BOD5; including an allowance for in-plant waste loadings] is less than 5 percent. Typical primary clarifier removal efficiencies are in the range of 25 to 35 percent.
4. Based on our analyses (Section 4), the projected per capita TSS loading (not
including industrial loadings) since 2002 is only 0.16 lb TSS/person/day. This value is less than the per capita BOD5 loading of 0.18 lb/person/day, which is atypical for municipal wastewater. In addition, the calculated per capita TSS loading is
City of Dubuque, Iowa Dubuque Water Pollution Control Plant Facilities Plan Section 3–Existing Wastewater Treatment Facilities
Prepared by STRAND ASSOCIATES, INC.® 3-8 RAW:ebt\S:\@SAI\151--200\154\002\Wrd\Report\S3.doc\052708
significantly less than the expected value of approximately 0.20 to 0.25 lb TSS/person/day (industrial loadings not included).
Based on these observations, we believe that the influent TSS loadings may be underestimated by as much as 40 percent, and the resulting BOD5 loadings are underestimated by 25 to 30 percent. If the TSS and BOD5 loadings are underestimated as noted above, the plant monitoring data correlates very well with the sludge quantities generated. An explanation for this potential sampling error follows. The Dubuque WPCP has two separate force mains discharging to the headworks. Each force main is tapped with a small diameter pipe, and raw, unscreened wastewater is pumped with small centrifugal pumps to the sampler. Because the wastewater is unscreened at the point of sampling, there is a reasonably good chance that the sample piping could be plugged and acts like a filter to remove some of the TSS in the raw wastewater. In addition, the samplers used to measure the influent wastewater strength have a dipping cup that enters the waste stream with the cup facing downstream. This could result in nonrepresentative sampling for TSS, since the mass and momentum of the TSS would tend to keep the particles moving downstream instead of laterally into the cup. Additional verification sampling is discussed in Section 5. C. Phosphorus and Nitrogen Loadings
The WPCP is not currently required to remove phosphorus, ammonia nitrogen, or total nitrogen. As part of this planning effort, the plant collected limited primary effluent phosphorus and total Kjeldahl nitrogen (TKN) data during the spring and summer of 2007. In addition, ammonia nitrogen is monitored in the plant effluent and those results are shown in Table 3.05-3. Primary effluent phosphorus concentrations ranged from approximately 3 mg/L to 40 mg/L, with an average of about 10 mg/L. Primary effluent TKN values ranged from approximately 60 mg/L to 72 mg/L, with an average of 63 mg/L. Both of these values are approximately 50 percent higher than typical medium-strength municipal wastewater, which corresponds well with the influent BOD5 and TSS concentrations and the high-strength industrial loadings. 3.04 IN-PLANT WASTE LOADINGS Section 3.02 briefly described the operation of the sludge handling system. Primary sludge and WAS are pumped to separate storage tanks prior to processing. These two sludge flows are combined in a small blend tank and then pumped to the centrifuges for dewatering. The centrifuges capture approximately 97 to 98 percent of the TSS, and the remaining 2 to 3 percent are discharged to the in-plant waste pump station. Additional in-plant waste loads come from decanting the primary sludge storage tanks, decanting the ash storage lagoons, and secondary clarifier scum removal. In addition, the plant accepts minor amounts of septage. All of these flows are discharged to the in-plant waste pump station, which conveys these flows to the wastewater channel immediately upstream of the grit removal basins. These in-plant waste loadings are not measured by the influent wastewater sampler. The centrate flow represents the majority of in-plant waste flow, and projections of the additional loads
City of Dubuque, Iowa Dubuque Water Pollution Control Plant Facilities Plan Section 3–Existing Wastewater Treatment Facilities
Prepared by STRAND ASSOCIATES, INC.® 3-9 RAW:ebt\S:\@SAI\151--200\154\002\Wrd\Report\S3.doc\052708
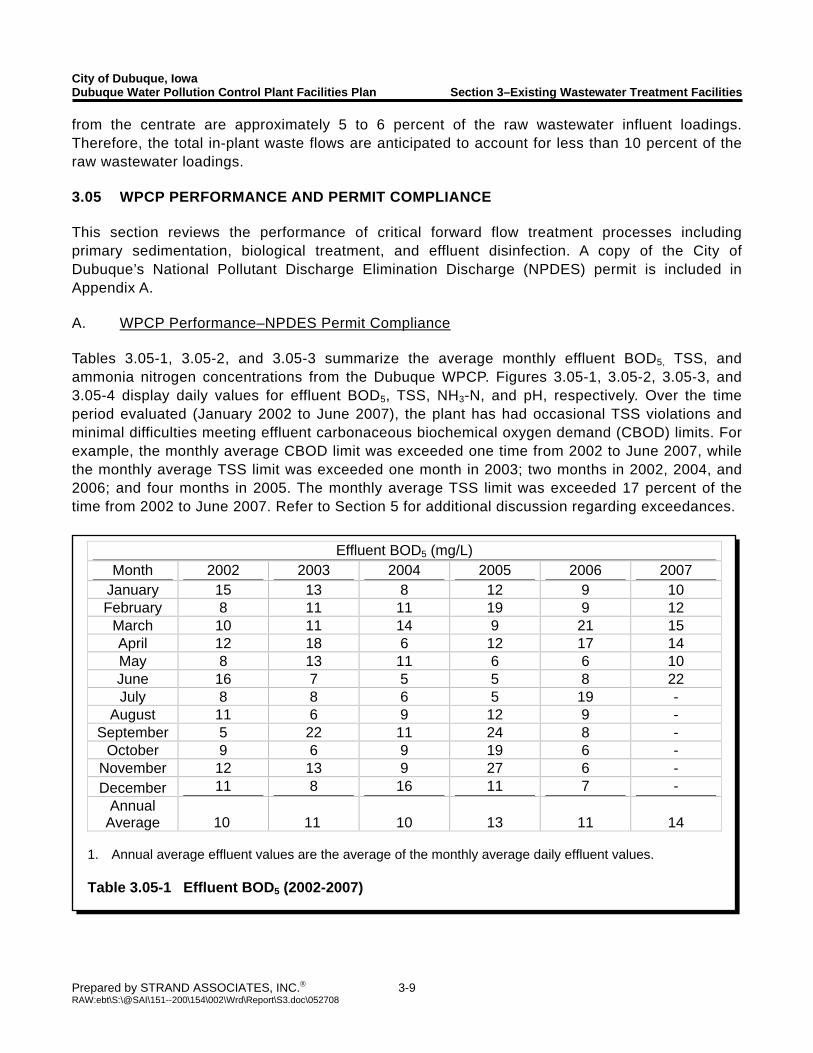
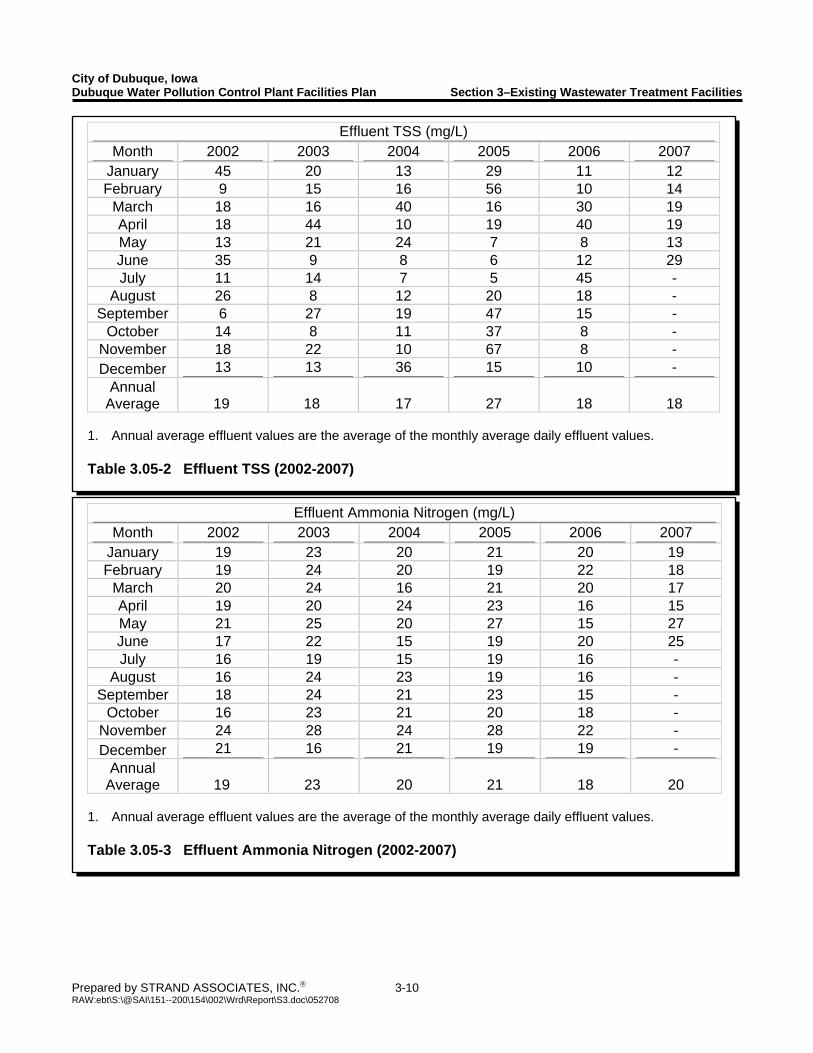
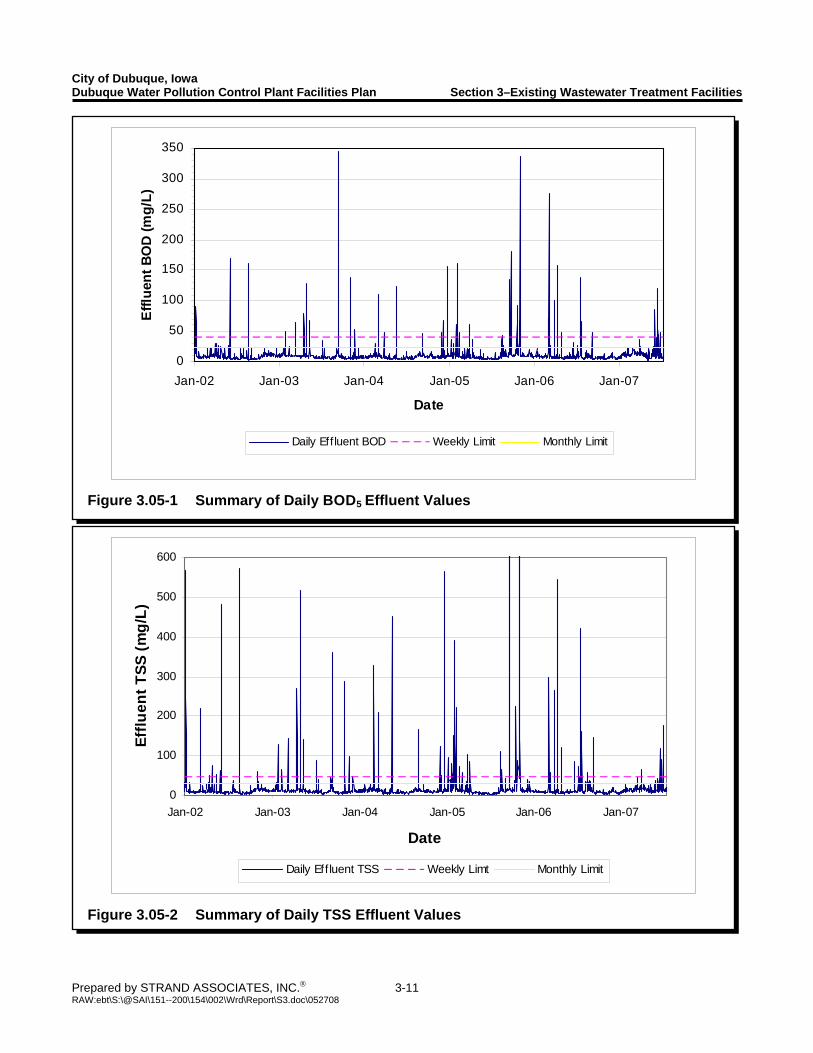
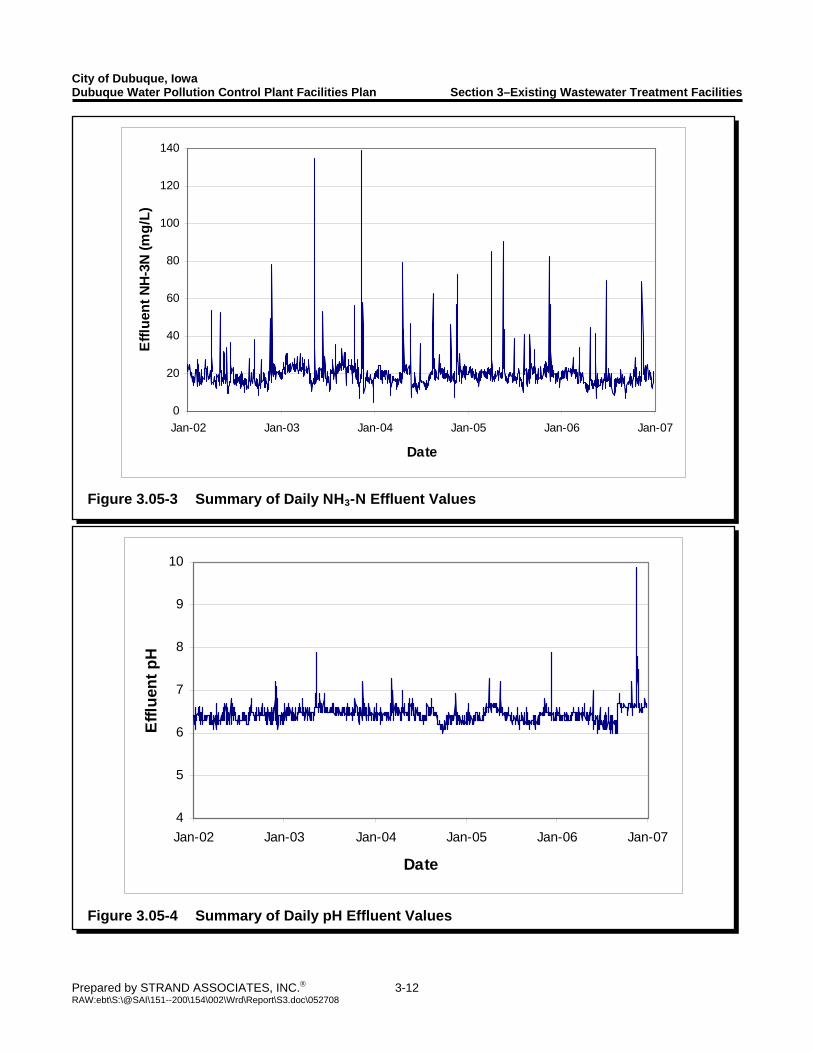
from the centrate are approximately 5 to 6 percent of the raw wastewater influent loadings. Therefore, the total in-plant waste flows are anticipated to account for less than 10 percent of the raw wastewater loadings. 3.05 WPCP PERFORMANCE AND PERMIT COMPLIANCE This section reviews the performance of critical forward flow treatment processes including primary sedimentation, biological treatment, and effluent disinfection. A copy of the City of Dubuque’s National Pollutant Discharge Elimination Discharge (NPDES) permit is included in Appendix A. A. WPCP Performance–NPDES Permit Compliance Tables 3.05-1, 3.05-2, and 3.05-3 summarize the average monthly effluent BOD5, TSS, and ammonia nitrogen concentrations from the Dubuque WPCP. Figures 3.05-1, 3.05-2, 3.05-3, and 3.05-4 display daily values for effluent BOD5, TSS, NH3-N, and pH, respectively. Over the time period evaluated (January 2002 to June 2007), the plant has had occasional TSS violations and minimal difficulties meeting effluent carbonaceous biochemical oxygen demand (CBOD) limits. For example, the monthly average CBOD limit was exceeded one time from 2002 to June 2007, while the monthly average TSS limit was exceeded one month in 2003; two months in 2002, 2004, and 2006; and four months in 2005. The monthly average TSS limit was exceeded 17 percent of the time from 2002 to June 2007. Refer to Section 5 for additional discussion regarding exceedances.
Effluent BOD5 (mg/L) Month 2002 2003 2004 2005 2006 2007
January 15 13 8 12 9 10 February 8 11 11 19 9 12
March 10 11 14 9 21 15 April 12 18 6 12 17 14 May 8 13 11 6 6 10 June 16 7 5 5 8 22 July 8 8 6 5 19 -
August 11 6 9 12 9 - September 5 22 11 24 8 -
October 9 6 9 19 6 - November 12 13 9 27 6 - December 11 8 16 11 7 -
Annual Average 10
11
10 13 11
14
1. Annual average effluent values are the average of the monthly average daily effluent values. Table 3.05-1 Effluent BOD5 (2002-2007)
City of Dubuque, Iowa Dubuque Water Pollution Control Plant Facilities Plan Section 3–Existing Wastewater Treatment Facilities
Prepared by STRAND ASSOCIATES, INC.® 3-10 RAW:ebt\S:\@SAI\151--200\154\002\Wrd\Report\S3.doc\052708
Effluent Ammonia Nitrogen (mg/L) Month 2002 2003 2004 2005 2006 2007
January 19 23 20 21 20 19 February 19 24 20 19 22 18
March 20 24 16 21 20 17 April 19 20 24 23 16 15 May 21 25 20 27 15 27 June 17 22 15 19 20 25 July 16 19 15 19 16 -
August 16 24 23 19 16 - September 18 24 21 23 15 -
October 16 23 21 20 18 - November 24 28 24 28 22 - December 21 16 21 19 19 -
Annual Average 19 23 20 21 18 20
1. Annual average effluent values are the average of the monthly average daily effluent values. Table 3.05-3 Effluent Ammonia Nitrogen (2002-2007)
Effluent TSS (mg/L) Month 2002 2003 2004 2005 2006 2007
January 45 20 13 29 11 12 February 9 15 16 56 10 14
March 18 16 40 16 30 19 April 18 44 10 19 40 19 May 13 21 24 7 8 13 June 35 9 8 6 12 29 July 11 14 7 5 45 -
August 26 8 12 20 18 - September 6 27 19 47 15 -
October 14 8 11 37 8 - November 18 22 10 67 8 - December 13 13 36 15 10 -
Annual Average 19 18 17 27 18 18
1. Annual average effluent values are the average of the monthly average daily effluent values. Table 3.05-2 Effluent TSS (2002-2007)
City of Dubuque, Iowa Dubuque Water Pollution Control Plant Facilities Plan Section 3–Existing Wastewater Treatment Facilities
Prepared by STRAND ASSOCIATES, INC.® 3-11 RAW:ebt\S:\@SAI\151--200\154\002\Wrd\Report\S3.doc\052708
0
100
200
300
400
500
600
Jan-02 Jan-03 Jan-04 Jan-05 Jan-06 Jan-07
Date
Efflu
ent T
SS (m
g/L)
Daily Eff luent TSS Weekly Limt Monthly Limit
Figure 3.05-2 Summary of Daily TSS Effluent Values
0
50
100
150
200
250
300
350
Jan-02 Jan-03 Jan-04 Jan-05 Jan-06 Jan-07
Date
Efflu
ent B
OD
(mg/
L)
Daily Eff luent BOD Weekly Limit Monthly Limit
Figure 3.05-1 Summary of Daily BOD5 Effluent Values
City of Dubuque, Iowa Dubuque Water Pollution Control Plant Facilities Plan Section 3–Existing Wastewater Treatment Facilities
Prepared by STRAND ASSOCIATES, INC.® 3-12 RAW:ebt\S:\@SAI\151--200\154\002\Wrd\Report\S3.doc\052708
4
5
6
7
8
9
10
Jan-02 Jan-03 Jan-04 Jan-05 Jan-06 Jan-07
Date
Effl
uent
pH
Figure 3.05-4 Summary of Daily pH Effluent Values
0
20
40
60
80
100
120
140
Jan-02 Jan-03 Jan-04 Jan-05 Jan-06 Jan-07
Date
Effl
uent
NH-
3N (m
g/L)
Figure 3.05-3 Summary of Daily NH3-N Effluent Values
City of Dubuque, Iowa Dubuque Water Pollution Control Plant Facilities Plan Section 3–Existing Wastewater Treatment Facilities
Prepared by STRAND ASSOCIATES, INC.® 3-13 RAW:ebt\S:\@SAI\151--200\154\002\Wrd\Report\S3.doc\052708
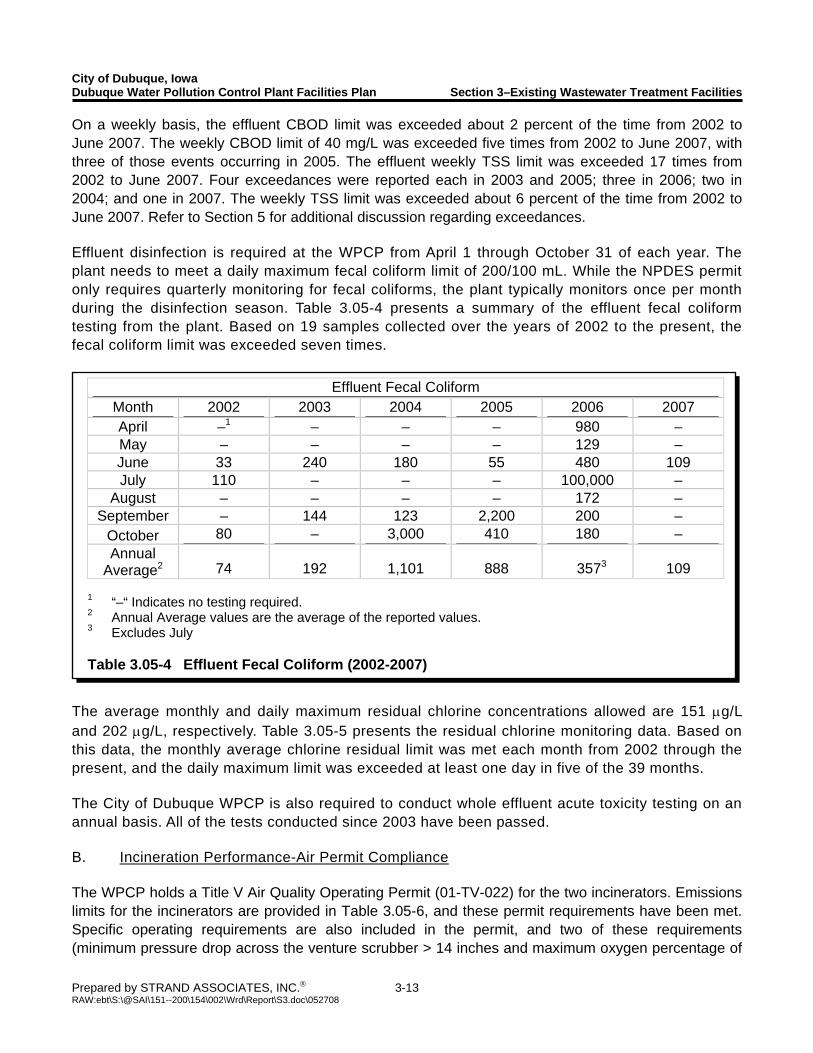
On a weekly basis, the effluent CBOD limit was exceeded about 2 percent of the time from 2002 to June 2007. The weekly CBOD limit of 40 mg/L was exceeded five times from 2002 to June 2007, with three of those events occurring in 2005. The effluent weekly TSS limit was exceeded 17 times from 2002 to June 2007. Four exceedances were reported each in 2003 and 2005; three in 2006; two in 2004; and one in 2007. The weekly TSS limit was exceeded about 6 percent of the time from 2002 to June 2007. Refer to Section 5 for additional discussion regarding exceedances. Effluent disinfection is required at the WPCP from April 1 through October 31 of each year. The plant needs to meet a daily maximum fecal coliform limit of 200/100 mL. While the NPDES permit only requires quarterly monitoring for fecal coliforms, the plant typically monitors once per month during the disinfection season. Table 3.05-4 presents a summary of the effluent fecal coliform testing from the plant. Based on 19 samples collected over the years of 2002 to the present, the fecal coliform limit was exceeded seven times.
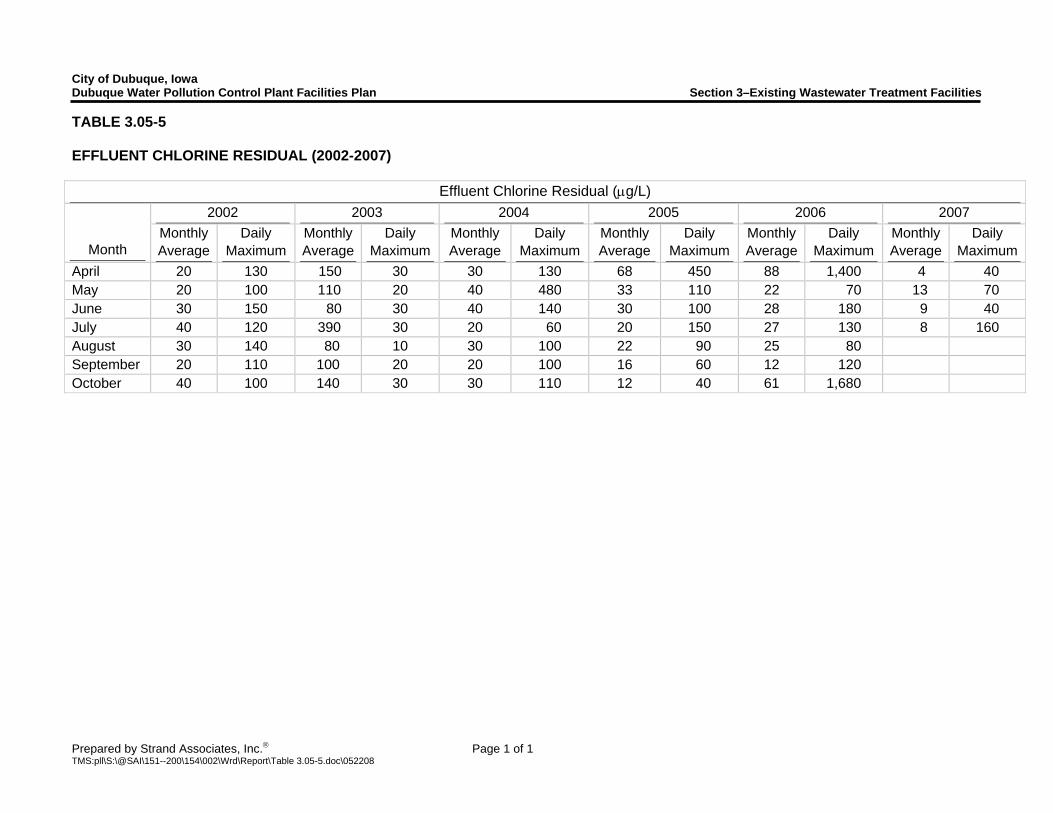
The average monthly and daily maximum residual chlorine concentrations allowed are 151 μg/L and 202 μg/L, respectively. Table 3.05-5 presents the residual chlorine monitoring data. Based on this data, the monthly average chlorine residual limit was met each month from 2002 through the present, and the daily maximum limit was exceeded at least one day in five of the 39 months. The City of Dubuque WPCP is also required to conduct whole effluent acute toxicity testing on an annual basis. All of the tests conducted since 2003 have been passed. B. Incineration Performance-Air Permit Compliance The WPCP holds a Title V Air Quality Operating Permit (01-TV-022) for the two incinerators. Emissions limits for the incinerators are provided in Table 3.05-6, and these permit requirements have been met. Specific operating requirements are also included in the permit, and two of these requirements (minimum pressure drop across the venture scrubber > 14 inches and maximum oxygen percentage of
Effluent Fecal Coliform Month 2002 2003 2004 2005 2006 2007 April –1 – – – 980 – May – – – – 129 – June 33 240 180 55 480 109 July 110 – – – 100,000 –
August – – – – 172 – September – 144 123 2,200 200 –
October 80 – 3,000 410 180 – Annual
Average2 74 192 1,101 888 3573 109 1 “–“ Indicates no testing required. 2 Annual Average values are the average of the reported values. 3 Excludes July Table 3.05-4 Effluent Fecal Coliform (2002-2007)
City of Dubuque, Iowa Dubuque Water Pollution Control Plant Facilities Plan Section 3–Existing Wastewater Treatment Facilities
Prepared by Strand Associates, Inc.® Page 1 of 1 TMS:pll\S:\@SAI\151--200\154\002\Wrd\Report\Table 3.05-5.doc\052208
TABLE 3.05-5 EFFLUENT CHLORINE RESIDUAL (2002-2007)
Effluent Chlorine Residual (μg/L) 2002 2003 2004 2005 2006 2007
Month Monthly Average
Daily Maximum
Monthly Average
Daily Maximum
Monthly Average
Daily Maximum
Monthly Average
Daily Maximum
Monthly Average
Daily Maximum
Monthly Average
Daily Maximum
April 20 130 150 30 30 130 68 450 88 1,400 4 40 May 20 100 110 20 40 480 33 110 22 70 13 70 June 30 150 80 30 40 140 30 100 28 180 9 40 July 40 120 390 30 20 60 20 150 27 130 8 160 August 30 140 80 10 30 100 22 90 25 80 September 20 110 100 20 20 100 16 60 12 120 October 40 100 140 30 30 110 12 40 61 1,680
City of Dubuque, Iowa Dubuque Water Pollution Control Plant Facilities Plan Section 3–Existing Wastewater Treatment Facilities
Prepared by STRAND ASSOCIATES, INC.® 3-14 RAW:ebt\S:\@SAI\151--200\154\002\Wrd\Report\S3.doc\052708
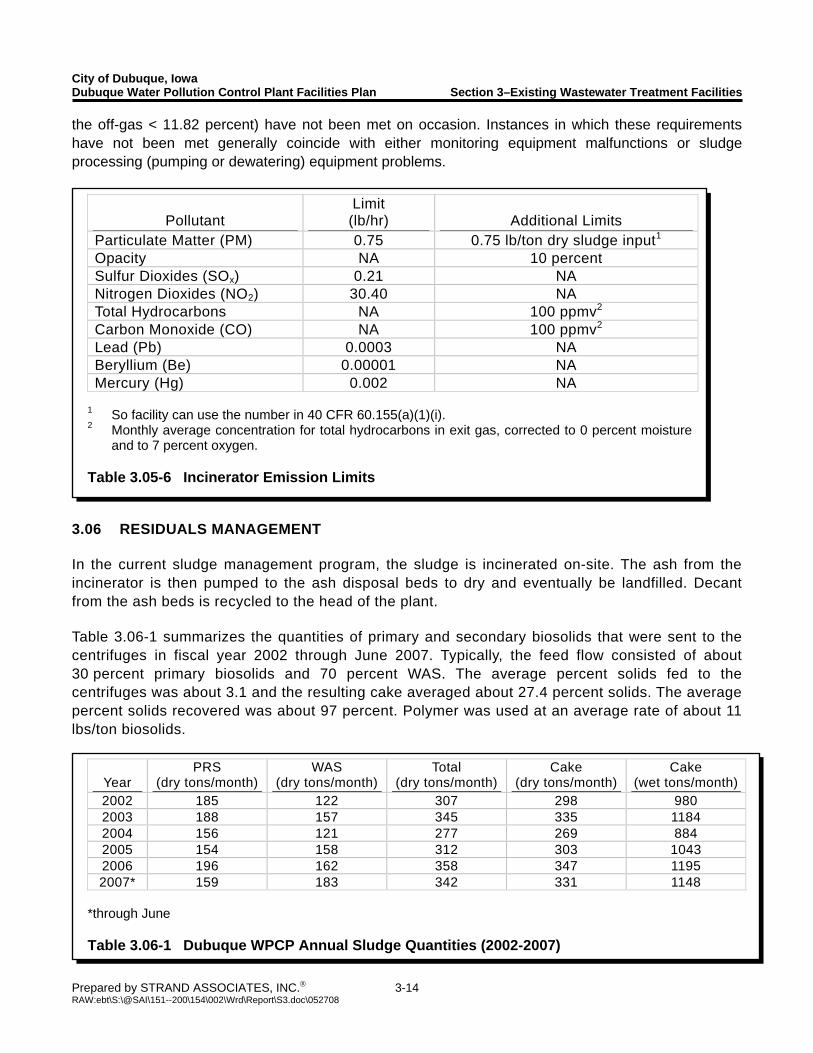
the off-gas < 11.82 percent) have not been met on occasion. Instances in which these requirements have not been met generally coincide with either monitoring equipment malfunctions or sludge processing (pumping or dewatering) equipment problems.
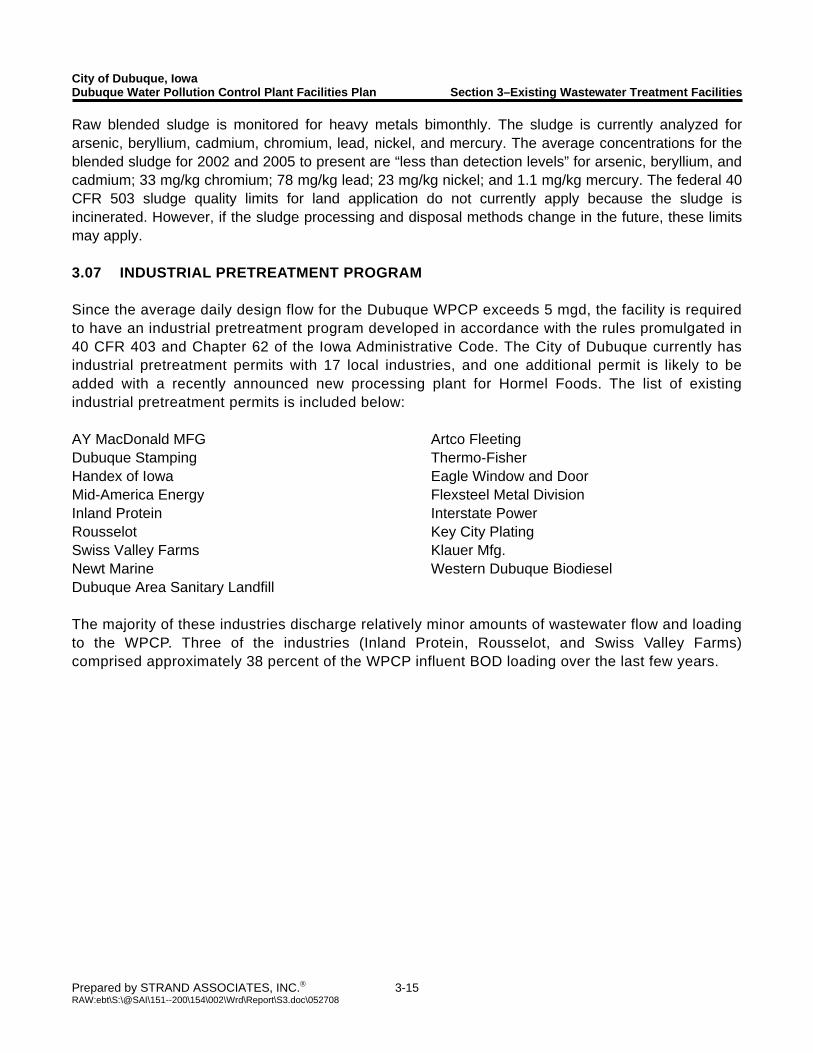
3.06 RESIDUALS MANAGEMENT In the current sludge management program, the sludge is incinerated on-site. The ash from the incinerator is then pumped to the ash disposal beds to dry and eventually be landfilled. Decant from the ash beds is recycled to the head of the plant. Table 3.06-1 summarizes the quantities of primary and secondary biosolids that were sent to the centrifuges in fiscal year 2002 through June 2007. Typically, the feed flow consisted of about 30 percent primary biosolids and 70 percent WAS. The average percent solids fed to the centrifuges was about 3.1 and the resulting cake averaged about 27.4 percent solids. The average percent solids recovered was about 97 percent. Polymer was used at an average rate of about 11 lbs/ton biosolids.
Year PRS
(dry tons/month) WAS
(dry tons/month) Total
(dry tons/month) Cake
(dry tons/month) Cake
(wet tons/month)2002 185 122 307 298 980 2003 188 157 345 335 1184 2004 156 121 277 269 884 2005 154 158 312 303 1043 2006 196 162 358 347 1195 2007* 159 183 342 331 1148
*through June Table 3.06-1 Dubuque WPCP Annual Sludge Quantities (2002-2007)
Pollutant Limit (lb/hr) Additional Limits
Particulate Matter (PM) 0.75 0.75 lb/ton dry sludge input1 Opacity NA 10 percent Sulfur Dioxides (SOx) 0.21 NA Nitrogen Dioxides (NO2) 30.40 NA Total Hydrocarbons NA 100 ppmv2 Carbon Monoxide (CO) NA 100 ppmv2 Lead (Pb) 0.0003 NA Beryllium (Be) 0.00001 NA Mercury (Hg) 0.002 NA
1 So facility can use the number in 40 CFR 60.155(a)(1)(i). 2 Monthly average concentration for total hydrocarbons in exit gas, corrected to 0 percent moisture
and to 7 percent oxygen. Table 3.05-6 Incinerator Emission Limits
City of Dubuque, Iowa Dubuque Water Pollution Control Plant Facilities Plan Section 3–Existing Wastewater Treatment Facilities
Prepared by STRAND ASSOCIATES, INC.® 3-15 RAW:ebt\S:\@SAI\151--200\154\002\Wrd\Report\S3.doc\052708
Raw blended sludge is monitored for heavy metals bimonthly. The sludge is currently analyzed for arsenic, beryllium, cadmium, chromium, lead, nickel, and mercury. The average concentrations for the blended sludge for 2002 and 2005 to present are “less than detection levels” for arsenic, beryllium, and cadmium; 33 mg/kg chromium; 78 mg/kg lead; 23 mg/kg nickel; and 1.1 mg/kg mercury. The federal 40 CFR 503 sludge quality limits for land application do not currently apply because the sludge is incinerated. However, if the sludge processing and disposal methods change in the future, these limits may apply. 3.07 INDUSTRIAL PRETREATMENT PROGRAM Since the average daily design flow for the Dubuque WPCP exceeds 5 mgd, the facility is required to have an industrial pretreatment program developed in accordance with the rules promulgated in 40 CFR 403 and Chapter 62 of the Iowa Administrative Code. The City of Dubuque currently has industrial pretreatment permits with 17 local industries, and one additional permit is likely to be added with a recently announced new processing plant for Hormel Foods. The list of existing industrial pretreatment permits is included below: AY MacDonald MFG Dubuque Stamping Handex of Iowa Mid-America Energy Inland Protein Rousselot Swiss Valley Farms Newt Marine Dubuque Area Sanitary Landfill
Artco Fleeting Thermo-Fisher Eagle Window and Door Flexsteel Metal Division Interstate Power Key City Plating Klauer Mfg. Western Dubuque Biodiesel
The majority of these industries discharge relatively minor amounts of wastewater flow and loading to the WPCP. Three of the industries (Inland Protein, Rousselot, and Swiss Valley Farms) comprised approximately 38 percent of the WPCP influent BOD loading over the last few years.

SECTION 4 FLOW AND WASTELOAD FORECASTS
City of Dubuque, Iowa Dubuque Water Pollution Control Plant Facilities Plan Section 4–Flow and Wasteload Forecasts
Prepared by STRAND ASSOCIATES, INC.® 4-1 RAW:ebt\S:\@SAI\151--200\154\002\Wrd\Report\S4.doc\052708
74,663
66,28263,368
40,00045,00050,00055,00060,00065,00070,00075,00080,000
2000 2010 2020 2030
Year
Popu
latio
n
Figure 4.02-1 Dubuque WPCP Population Projections
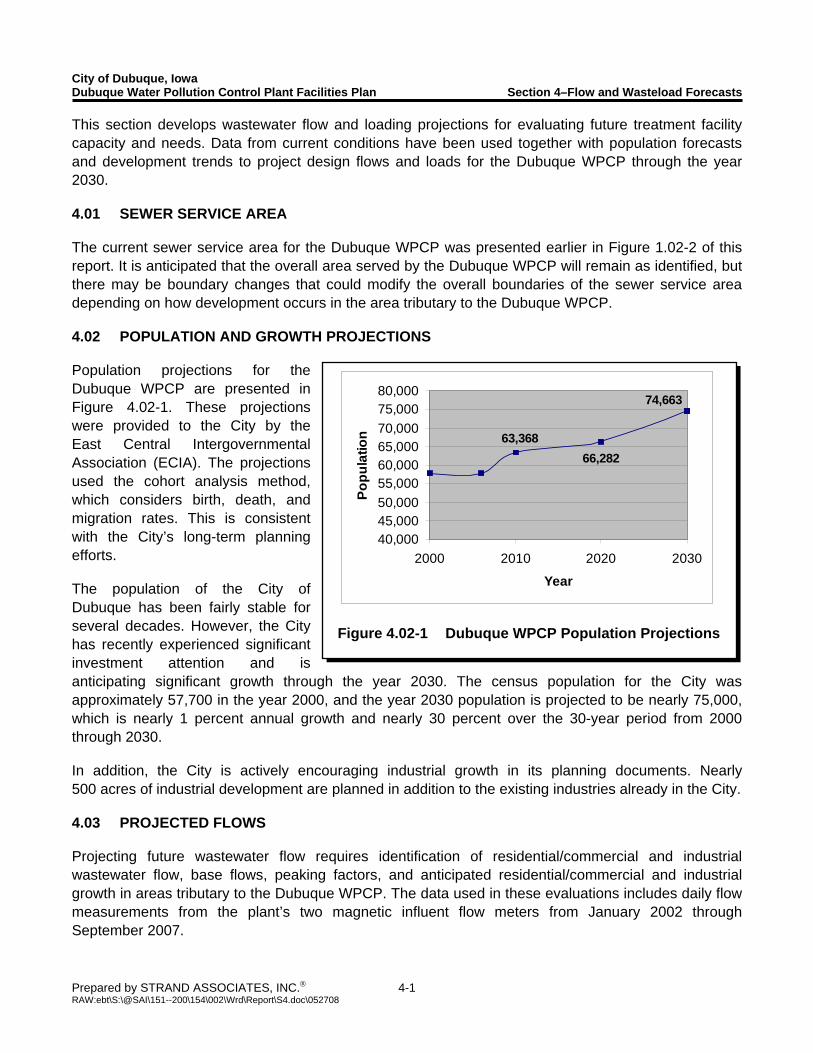
This section develops wastewater flow and loading projections for evaluating future treatment facility capacity and needs. Data from current conditions have been used together with population forecasts and development trends to project design flows and loads for the Dubuque WPCP through the year 2030. 4.01 SEWER SERVICE AREA The current sewer service area for the Dubuque WPCP was presented earlier in Figure 1.02-2 of this report. It is anticipated that the overall area served by the Dubuque WPCP will remain as identified, but there may be boundary changes that could modify the overall boundaries of the sewer service area depending on how development occurs in the area tributary to the Dubuque WPCP. 4.02 POPULATION AND GROWTH PROJECTIONS Population projections for the Dubuque WPCP are presented in Figure 4.02-1. These projections were provided to the City by the East Central Intergovernmental Association (ECIA). The projections used the cohort analysis method, which considers birth, death, and migration rates. This is consistent with the City’s long-term planning efforts. The population of the City of Dubuque has been fairly stable for several decades. However, the City has recently experienced significant investment attention and is anticipating significant growth through the year 2030. The census population for the City was approximately 57,700 in the year 2000, and the year 2030 population is projected to be nearly 75,000, which is nearly 1 percent annual growth and nearly 30 percent over the 30-year period from 2000 through 2030. In addition, the City is actively encouraging industrial growth in its planning documents. Nearly 500 acres of industrial development are planned in addition to the existing industries already in the City. 4.03 PROJECTED FLOWS Projecting future wastewater flow requires identification of residential/commercial and industrial wastewater flow, base flows, peaking factors, and anticipated residential/commercial and industrial growth in areas tributary to the Dubuque WPCP. The data used in these evaluations includes daily flow measurements from the plant’s two magnetic influent flow meters from January 2002 through September 2007.
City of Dubuque, Iowa Dubuque Water Pollution Control Plant Facilities Plan Section 4–Flow and Wasteload Forecasts
Prepared by STRAND ASSOCIATES, INC.® 4-2 RAW:ebt\S:\@SAI\151--200\154\002\Wrd\Report\S4.doc\052708
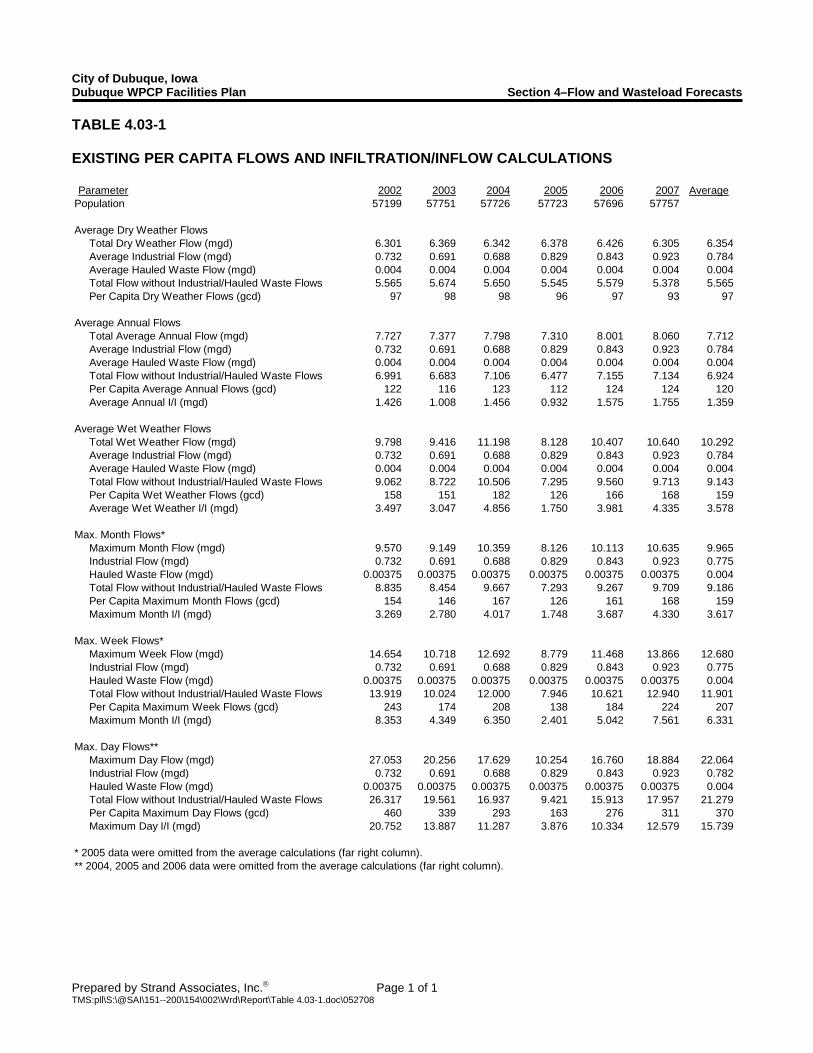
A. Dry Weather Base Flows and Per Capita Flows Since January 2002, the annual average daily flow treated at the Dubuque WPCP has ranged from a low of approximately 7.3 mgd in 2003 and 2005 to a high of 8.1 mgd in 2007. Over that same time period, the maximum month flow was 10.64 mgd in April 2007, the maximum week flow was 14.65 mgd in June of 2002, the maximum day flow was 27.1 mgd in June 2002, and the maximum hourly flow recorded was nearly 34 mgd in July 2007. To project future design average and maximum flows, an evaluation was made to establish average dry weather flows to the WPCP and then generate an estimate of I/I levels to establish future maximum design flows. The average dry weather flow, which includes background dry weather infiltration, was established from a review of the WWTP influent flows. Daily flows were reviewed for the years 2002 through 2007, and the minimum daily flows to the plant that were less than the minimum monthly flow for the period reviewed, which included 158 days, were used in the analyses. The annual average dry weather flow over this time period was 6.363 mgd, with a range of 6.301 mgd to 6.426 mgd. This flow rate is assumed to contain a minimum amount of I/I expected from the City’s collection system. To determine per capita dry weather flow (sometimes referred to as base flow), the average industrial and hauled-waste flows components were subtracted from the dry weather flow, and this was divided by the contributing population. The per capita flow was calculated in this manner for each year and averaged to determine the per capita flow for the period 2002 to 2007. The average dry weather per capital/flow was calculated to be approximately 97 gcd. This per capita flow value was then used to estimate future dry weather base flows from the projected number of residential and commercial customers. Industrial flows were estimated separately, and I/I components to estimate wet weather flows were also considered separately as noted below. B. Design Flow Projections–Wet Weather Design Flows The daily flow data from January 2002 through September 2007 was used to develop wet weather design flows. For each year of data evaluated, the design wet weather flows were calculated. Then, the dry weather base flow and average industrial flow for each year were subtracted from each of the calculated wet weather flows to estimate wet weather I/I volumes. Estimates of the industrial flows for users in the City of Dubuque were made based on flow records from the three major wet industries plus an estimate of total flow for the remaining smaller industries. Table 4.03-1 presents a summary of the various flow determinations for the years 2002 through 2007, including estimates of I/I for each flow category. To develop year 2030 design flows, the dry weather per capita flow of 97 gcd was multiplied to calculate the future dry weather residential/commercial base flow of approximately 7.2 mgd. The amount of I/I in the collection system for each of the design wet weather flows (maximum month, maximum weekly, etc.) was assumed to increase by 10 percent to the year 2030. Wastewater flows from the existing industries were also assumed to increase by 10 percent, and new planned industry was assigned a flow of 1,500 gpd/acre. A factor of 10 percent of the total projected industrial flow was
City of Dubuque, Iowa Dubuque WPCP Facilities Plan Section 4–Flow and Wasteload Forecasts
Prepared by Strand Associates, Inc.® Page 1 of 1 TMS:pll\S:\@SAI\151--200\154\002\Wrd\Report\Table 4.03-1.doc\052708
TABLE 4.03-1 EXISTING PER CAPITA FLOWS AND INFILTRATION/INFLOW CALCULATIONS
Parameter 2002 2003 2004 2005 2006 2007 AveragePopulation 57199 57751 57726 57723 57696 57757
Average Dry Weather Flows Total Dry Weather Flow (mgd) 6.301 6.369 6.342 6.378 6.426 6.305 6.354 Average Industrial Flow (mgd) 0.732 0.691 0.688 0.829 0.843 0.923 0.784 Average Hauled Waste Flow (mgd) 0.004 0.004 0.004 0.004 0.004 0.004 0.004 Total Flow without Industrial/Hauled Waste Flows 5.565 5.674 5.650 5.545 5.579 5.378 5.565 Per Capita Dry Weather Flows (gcd) 97 98 98 96 97 93 97
Average Annual Flows Total Average Annual Flow (mgd) 7.727 7.377 7.798 7.310 8.001 8.060 7.712 Average Industrial Flow (mgd) 0.732 0.691 0.688 0.829 0.843 0.923 0.784 Average Hauled Waste Flow (mgd) 0.004 0.004 0.004 0.004 0.004 0.004 0.004 Total Flow without Industrial/Hauled Waste Flows 6.991 6.683 7.106 6.477 7.155 7.134 6.924 Per Capita Average Annual Flows (gcd) 122 116 123 112 124 124 120 Average Annual I/I (mgd) 1.426 1.008 1.456 0.932 1.575 1.755 1.359
Average Wet Weather Flows Total Wet Weather Flow (mgd) 9.798 9.416 11.198 8.128 10.407 10.640 10.292 Average Industrial Flow (mgd) 0.732 0.691 0.688 0.829 0.843 0.923 0.784 Average Hauled Waste Flow (mgd) 0.004 0.004 0.004 0.004 0.004 0.004 0.004 Total Flow without Industrial/Hauled Waste Flows 9.062 8.722 10.506 7.295 9.560 9.713 9.143 Per Capita Wet Weather Flows (gcd) 158 151 182 126 166 168 159 Average Wet Weather I/I (mgd) 3.497 3.047 4.856 1.750 3.981 4.335 3.578
Max. Month Flows* Maximum Month Flow (mgd) 9.570 9.149 10.359 8.126 10.113 10.635 9.965 Industrial Flow (mgd) 0.732 0.691 0.688 0.829 0.843 0.923 0.775 Hauled Waste Flow (mgd) 0.00375 0.00375 0.00375 0.00375 0.00375 0.00375 0.004 Total Flow without Industrial/Hauled Waste Flows 8.835 8.454 9.667 7.293 9.267 9.709 9.186 Per Capita Maximum Month Flows (gcd) 154 146 167 126 161 168 159 Maximum Month I/I (mgd) 3.269 2.780 4.017 1.748 3.687 4.330 3.617
Max. Week Flows* Maximum Week Flow (mgd) 14.654 10.718 12.692 8.779 11.468 13.866 12.680 Industrial Flow (mgd) 0.732 0.691 0.688 0.829 0.843 0.923 0.775 Hauled Waste Flow (mgd) 0.00375 0.00375 0.00375 0.00375 0.00375 0.00375 0.004 Total Flow without Industrial/Hauled Waste Flows 13.919 10.024 12.000 7.946 10.621 12.940 11.901 Per Capita Maximum Week Flows (gcd) 243 174 208 138 184 224 207 Maximum Month I/I (mgd) 8.353 4.349 6.350 2.401 5.042 7.561 6.331
Max. Day Flows** Maximum Day Flow (mgd) 27.053 20.256 17.629 10.254 16.760 18.884 22.064 Industrial Flow (mgd) 0.732 0.691 0.688 0.829 0.843 0.923 0.782 Hauled Waste Flow (mgd) 0.00375 0.00375 0.00375 0.00375 0.00375 0.00375 0.004 Total Flow without Industrial/Hauled Waste Flows 26.317 19.561 16.937 9.421 15.913 17.957 21.279 Per Capita Maximum Day Flows (gcd) 460 339 293 163 276 311 370 Maximum Day I/I (mgd) 20.752 13.887 11.287 3.876 10.334 12.579 15.739
* 2005 data were omitted from the average calculations (far right column).** 2004, 2005 and 2006 data were omitted from the average calculations (far right column).
City of Dubuque, Iowa Dubuque Water Pollution Control Plant Facilities Plan Section 4–Flow and Wasteload Forecasts
Prepared by STRAND ASSOCIATES, INC.® 4-3 RAW:ebt\S:\@SAI\151--200\154\002\Wrd\Report\S4.doc\052708
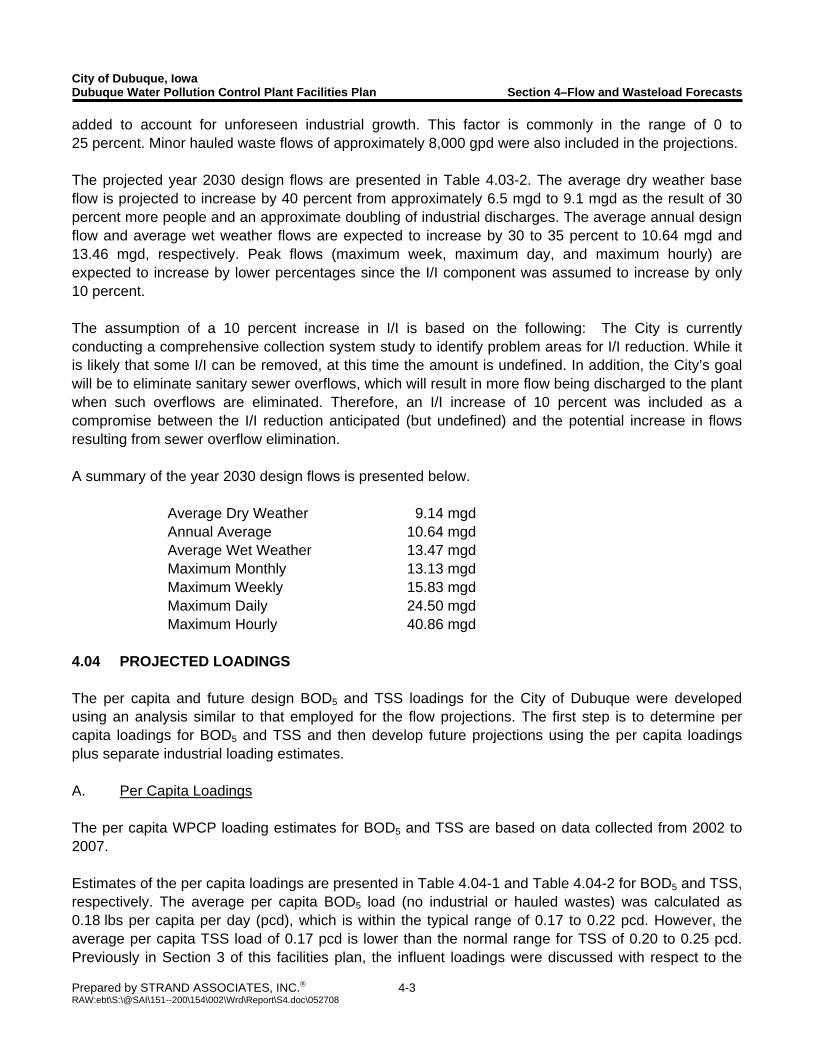
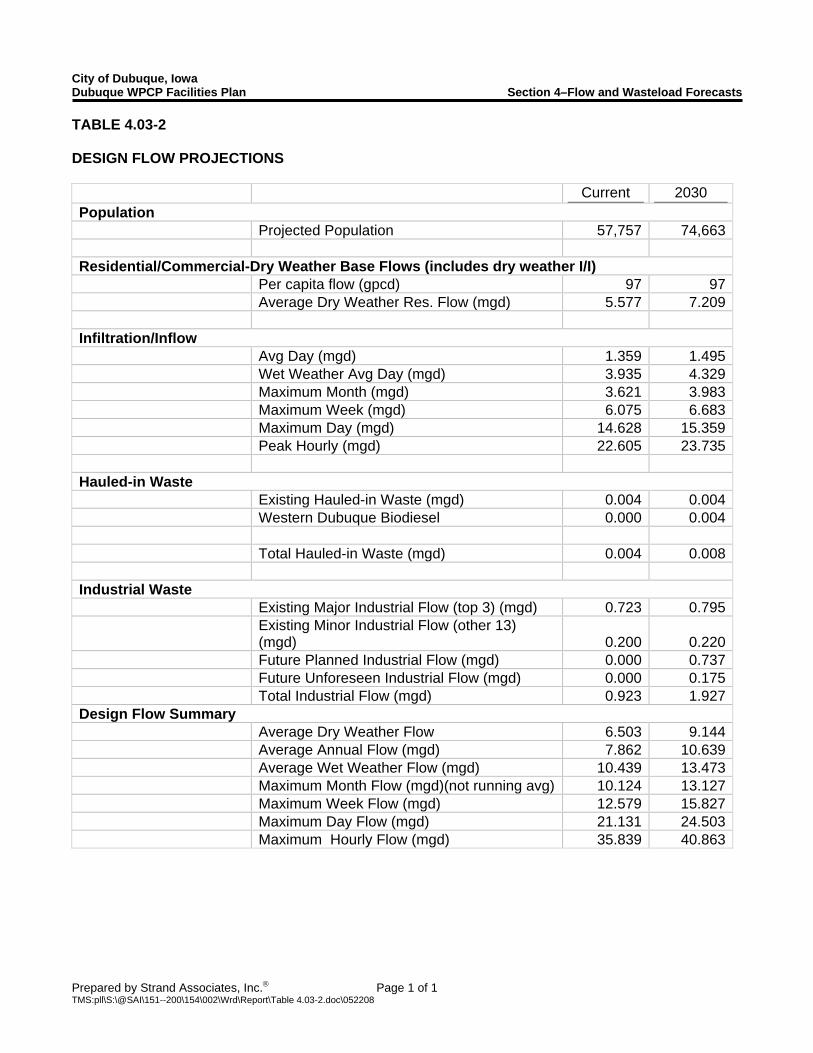
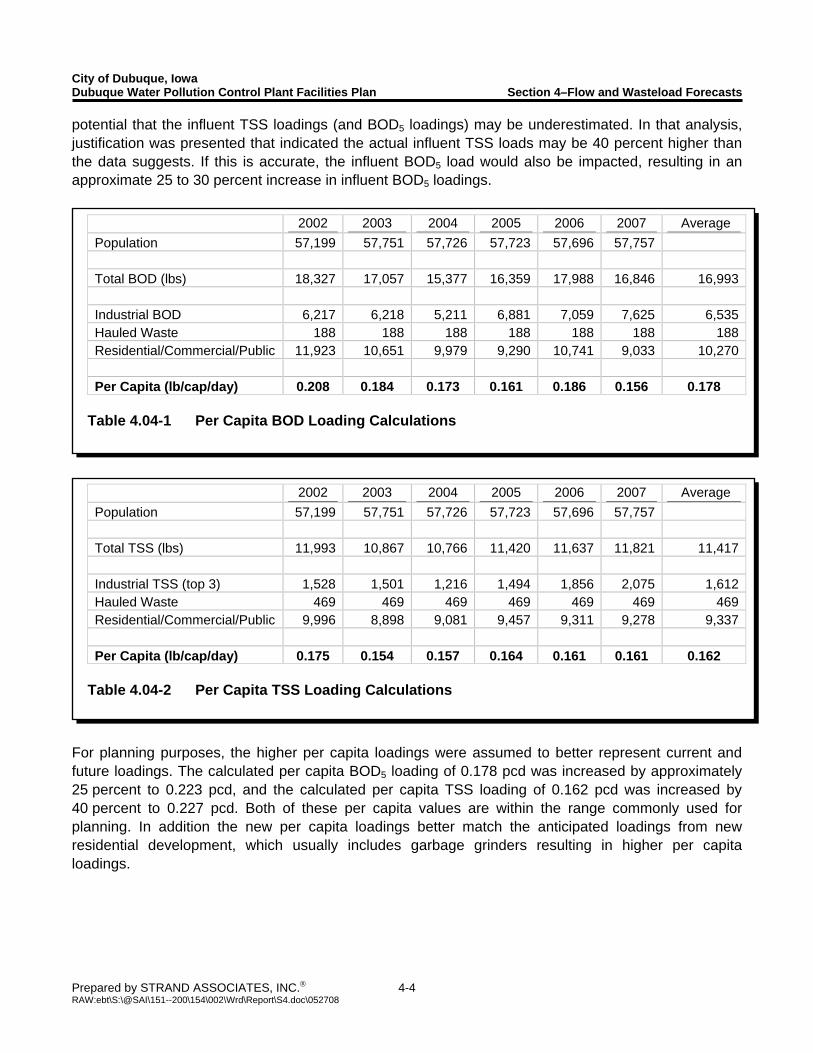
added to account for unforeseen industrial growth. This factor is commonly in the range of 0 to 25 percent. Minor hauled waste flows of approximately 8,000 gpd were also included in the projections. The projected year 2030 design flows are presented in Table 4.03-2. The average dry weather base flow is projected to increase by 40 percent from approximately 6.5 mgd to 9.1 mgd as the result of 30 percent more people and an approximate doubling of industrial discharges. The average annual design flow and average wet weather flows are expected to increase by 30 to 35 percent to 10.64 mgd and 13.46 mgd, respectively. Peak flows (maximum week, maximum day, and maximum hourly) are expected to increase by lower percentages since the I/I component was assumed to increase by only 10 percent. The assumption of a 10 percent increase in I/I is based on the following: The City is currently conducting a comprehensive collection system study to identify problem areas for I/I reduction. While it is likely that some I/I can be removed, at this time the amount is undefined. In addition, the City’s goal will be to eliminate sanitary sewer overflows, which will result in more flow being discharged to the plant when such overflows are eliminated. Therefore, an I/I increase of 10 percent was included as a compromise between the I/I reduction anticipated (but undefined) and the potential increase in flows resulting from sewer overflow elimination. A summary of the year 2030 design flows is presented below. Average Dry Weather 9.14 mgd Annual Average 10.64 mgd Average Wet Weather 13.47 mgd Maximum Monthly 13.13 mgd Maximum Weekly 15.83 mgd Maximum Daily 24.50 mgd Maximum Hourly 40.86 mgd 4.04 PROJECTED LOADINGS The per capita and future design BOD5 and TSS loadings for the City of Dubuque were developed using an analysis similar to that employed for the flow projections. The first step is to determine per capita loadings for BOD5 and TSS and then develop future projections using the per capita loadings plus separate industrial loading estimates. A. Per Capita Loadings The per capita WPCP loading estimates for BOD5 and TSS are based on data collected from 2002 to 2007. Estimates of the per capita loadings are presented in Table 4.04-1 and Table 4.04-2 for BOD5 and TSS, respectively. The average per capita BOD5 load (no industrial or hauled wastes) was calculated as 0.18 lbs per capita per day (pcd), which is within the typical range of 0.17 to 0.22 pcd. However, the average per capita TSS load of 0.17 pcd is lower than the normal range for TSS of 0.20 to 0.25 pcd. Previously in Section 3 of this facilities plan, the influent loadings were discussed with respect to the
City of Dubuque, Iowa Dubuque WPCP Facilities Plan Section 4–Flow and Wasteload Forecasts
Prepared by Strand Associates, Inc.® Page 1 of 1 TMS:pll\S:\@SAI\151--200\154\002\Wrd\Report\Table 4.03-2.doc\052208
TABLE 4.03-2 DESIGN FLOW PROJECTIONS Current 2030 Population Projected Population 57,757 74,663 Residential/Commercial-Dry Weather Base Flows (includes dry weather I/I) Per capita flow (gpcd) 97 97 Average Dry Weather Res. Flow (mgd) 5.577 7.209 Infiltration/Inflow Avg Day (mgd) 1.359 1.495 Wet Weather Avg Day (mgd) 3.935 4.329 Maximum Month (mgd) 3.621 3.983 Maximum Week (mgd) 6.075 6.683 Maximum Day (mgd) 14.628 15.359 Peak Hourly (mgd) 22.605 23.735 Hauled-in Waste Existing Hauled-in Waste (mgd) 0.004 0.004 Western Dubuque Biodiesel 0.000 0.004 Total Hauled-in Waste (mgd) 0.004 0.008 Industrial Waste Existing Major Industrial Flow (top 3) (mgd) 0.723 0.795
Existing Minor Industrial Flow (other 13) (mgd) 0.200 0.220
Future Planned Industrial Flow (mgd) 0.000 0.737 Future Unforeseen Industrial Flow (mgd) 0.000 0.175 Total Industrial Flow (mgd) 0.923 1.927Design Flow Summary Average Dry Weather Flow 6.503 9.144 Average Annual Flow (mgd) 7.862 10.639 Average Wet Weather Flow (mgd) 10.439 13.473 Maximum Month Flow (mgd)(not running avg) 10.124 13.127 Maximum Week Flow (mgd) 12.579 15.827 Maximum Day Flow (mgd) 21.131 24.503 Maximum Hourly Flow (mgd) 35.839 40.863
City of Dubuque, Iowa Dubuque Water Pollution Control Plant Facilities Plan Section 4–Flow and Wasteload Forecasts
Prepared by STRAND ASSOCIATES, INC.® 4-4 RAW:ebt\S:\@SAI\151--200\154\002\Wrd\Report\S4.doc\052708
potential that the influent TSS loadings (and BOD5 loadings) may be underestimated. In that analysis, justification was presented that indicated the actual influent TSS loads may be 40 percent higher than the data suggests. If this is accurate, the influent BOD5 load would also be impacted, resulting in an approximate 25 to 30 percent increase in influent BOD5 loadings.
For planning purposes, the higher per capita loadings were assumed to better represent current and future loadings. The calculated per capita BOD5 loading of 0.178 pcd was increased by approximately 25 percent to 0.223 pcd, and the calculated per capita TSS loading of 0.162 pcd was increased by 40 percent to 0.227 pcd. Both of these per capita values are within the range commonly used for planning. In addition the new per capita loadings better match the anticipated loadings from new residential development, which usually includes garbage grinders resulting in higher per capita loadings.
2002 2003 2004 2005 2006 2007 Average Population 57,199 57,751 57,726 57,723 57,696 57,757 Total TSS (lbs) 11,993 10,867 10,766 11,420 11,637 11,821 11,417 Industrial TSS (top 3) 1,528 1,501 1,216 1,494 1,856 2,075 1,612 Hauled Waste 469 469 469 469 469 469 469 Residential/Commercial/Public 9,996 8,898 9,081 9,457 9,311 9,278 9,337 Per Capita (lb/cap/day) 0.175 0.154 0.157 0.164 0.161 0.161 0.162
Table 4.04-2 Per Capita TSS Loading Calculations
2002 2003 2004 2005 2006 2007 Average Population 57,199 57,751 57,726 57,723 57,696 57,757 Total BOD (lbs) 18,327 17,057 15,377 16,359 17,988 16,846 16,993 Industrial BOD 6,217 6,218 5,211 6,881 7,059 7,625 6,535 Hauled Waste 188 188 188 188 188 188 188 Residential/Commercial/Public 11,923 10,651 9,979 9,290 10,741 9,033 10,270 Per Capita (lb/cap/day) 0.208 0.184 0.173 0.161 0.186 0.156 0.178
Table 4.04-1 Per Capita BOD Loading Calculations
City of Dubuque, Iowa Dubuque Water Pollution Control Plant Facilities Plan Section 4–Flow and Wasteload Forecasts
Prepared by STRAND ASSOCIATES, INC.® 4-5 RAW:ebt\S:\@SAI\151--200\154\002\Wrd\Report\S4.doc\052708
For the purposes of developing design loadings, the following per capita loadings are used in these analyses:
BOD5 0.223 pcd (see discussion above) TSS 0.227 pcd (see discussion above) NH3-N 0.024 pcd (based on typical reference loadings) TKN 0.036 pcd (based on typical reference loadings) P 0.006 pcd (based on typical reference loadings)
B. Projected Design Loadings The projected average design loadings for BOD5 and TSS were developed using the per capita loadings calculated above for the residential/commercial portion of the projections and then adding the existing industrial loadings, the planned future industrial loadings, an allowance (5 percent of the total) for unforeseen industrial loadings, and the anticipated hauled waste loadings to develop future total design loadings. Most of the loading components are relatively straightforward to develop. However, the planned industrial loadings are based on the following assumptions:
1. The City has 491 acres of new industrial development planned. 2. As noted previously, a typical wastewater flow value of 1,500 gpd/acre for the future
planned industrial flows was assumed. 3. The future planned industrial BOD5 loading increases were assumed to be in proportion
to the anticipated increase in industrial flows. This results in a similar mix of wet and dry industries in the future, with a subsequent similar overall industrial waste composition.
4. Future industrial TSS loadings will be equal to the future industrial BOD loadings. This is
different than the current industrial loading characteristics. However, it is likely to have similar BOD and TSS loadings rather than highly soluble industrial loadings.
Tables 4.04-3 and 4.04-4 summarize the design BOD5 and TSS loads, respectively, for the year 2030. The maximum design loadings were developed based on analyses of the variability of influent BOD5 and TSS loadings at the WPCP from 2002 through 2007. Annual average-based peaking factors were developed for the maximum month, maximum week, and maximum day loading conditions for each year. These peaking factors were then applied to the year 2030 average loading projections to develop the maximum design loadings in the future. The year 2030 design loadings for the Dubuque WPCP are listed below: Average BOD5 36,900 lbs/day Max. Month BOD5 41,200 lbs/day Average TSS 29,400 lbs/day Max. Month TSS 37,100 lbd/day

City of Dubuque, Iowa Dubuque Water Pollution Control Plant Facilities Plan Section 4–Flow and Wasteload Forecasts
Prepared by STRAND ASSOCIATES, INC.® 4-6 RAW:ebt\S:\@SAI\151--200\154\002\Wrd\Report\S4.doc\052708
Current 2030 Projected Population 57,757 74,663 Per Capita BOD, lb/cap/day 0.223 0.223 Residential (lb/d) 12,866 16,632 Existing Hauled Wastes 188 188 Western Dubuque Biodiesel - 1,650 Future Hauled Wastes - - Total Hauled Wastes (lb/d) 188 1,838 Existing Major Industries (top 3) 7,625 8,388 Existing Minor Industries (other 13) - - Future Planned Industries (491 acres planned) - 8,296 Future Unforeseen Industrial - 1,758 Total Industrial BOD (lb/d) 7,625 18,441 Design BOD Summary Current 2030 Total Average BOD 20,700 36,900 Total Maximum Month BOD 23,100 41,200 Total Maximum Week BOD 27,500 49,000 Total Maximum Day BOD 43,600 77,700
Table 4.04-3 Design BOD5 Loading Projections
Current 2030 Projected Population 57,757 74,663 Per Capita TSS, lb/cap/day 0.227 0.227 Residential 13,099 16,933 Existing Hauled Wastes 469 469 Western Dubuque Biodiesel - - Future Hauled Wastes - - Total Hauled Wastes 469 469 Existing Major Industries (top 3) 2,075 2,282 Existing Minor Industries (other 13) - - Future Planned Industries - 8,296 Future Unforeseen Industrial - 1,399 Total Industrial TSS 2,075 11,977 TSS Design Loadings Current 2030 Total Average TSS 15,600 29,400 Maximum Monthly TSS 19,700 37,100
Table 4.04-4 Design TSS Loading Projections

SECTION 5 EVALUATION OF EXISTING FACILITIES AND SCREENING OF
ALTERNATIVES
City of Dubuque, Iowa Section 5–Evaluation of Existing Facilities Dubuque Water Pollution Control Plant Facilities Plan and Screening of Alternatives
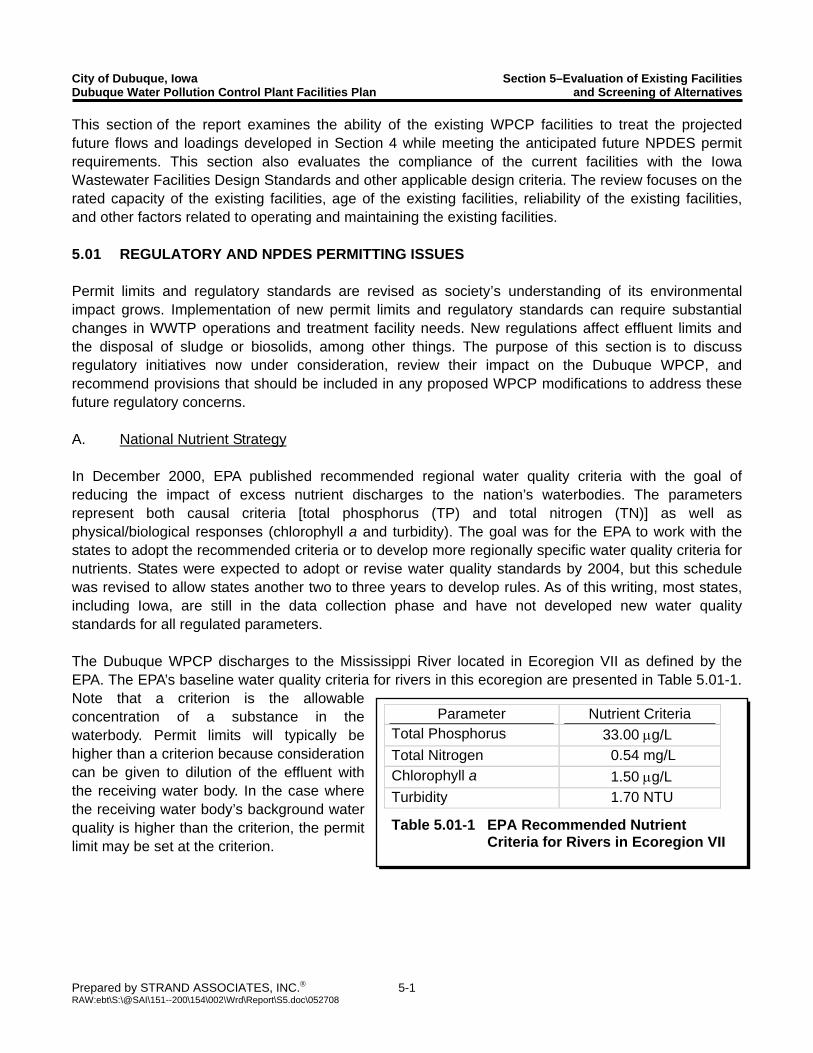
Prepared by STRAND ASSOCIATES, INC.® 5-1 RAW:ebt\S:\@SAI\151--200\154\002\Wrd\Report\S5.doc\052708
This section of the report examines the ability of the existing WPCP facilities to treat the projected future flows and loadings developed in Section 4 while meeting the anticipated future NPDES permit requirements. This section also evaluates the compliance of the current facilities with the Iowa Wastewater Facilities Design Standards and other applicable design criteria. The review focuses on the rated capacity of the existing facilities, age of the existing facilities, reliability of the existing facilities, and other factors related to operating and maintaining the existing facilities. 5.01 REGULATORY AND NPDES PERMITTING ISSUES Permit limits and regulatory standards are revised as society’s understanding of its environmental impact grows. Implementation of new permit limits and regulatory standards can require substantial changes in WWTP operations and treatment facility needs. New regulations affect effluent limits and the disposal of sludge or biosolids, among other things. The purpose of this section is to discuss regulatory initiatives now under consideration, review their impact on the Dubuque WPCP, and recommend provisions that should be included in any proposed WPCP modifications to address these future regulatory concerns. A. National Nutrient Strategy In December 2000, EPA published recommended regional water quality criteria with the goal of reducing the impact of excess nutrient discharges to the nation’s waterbodies. The parameters represent both causal criteria [total phosphorus (TP) and total nitrogen (TN)] as well as physical/biological responses (chlorophyll a and turbidity). The goal was for the EPA to work with the states to adopt the recommended criteria or to develop more regionally specific water quality criteria for nutrients. States were expected to adopt or revise water quality standards by 2004, but this schedule was revised to allow states another two to three years to develop rules. As of this writing, most states, including Iowa, are still in the data collection phase and have not developed new water quality standards for all regulated parameters. The Dubuque WPCP discharges to the Mississippi River located in Ecoregion VII as defined by the EPA. The EPA’s baseline water quality criteria for rivers in this ecoregion are presented in Table 5.01-1. Note that a criterion is the allowable concentration of a substance in the waterbody. Permit limits will typically be higher than a criterion because consideration can be given to dilution of the effluent with the receiving water body. In the case where the receiving water body’s background water quality is higher than the criterion, the permit limit may be set at the criterion.
Parameter Nutrient Criteria Total Phosphorus 33.00 μg/L Total Nitrogen 0.54 mg/L Chlorophyll a 1.50 μg/L Turbidity 1.70 NTU
Table 5.01-1 EPA Recommended Nutrient Criteria for Rivers in Ecoregion VII

City of Dubuque, Iowa Section 5–Evaluation of Existing Facilities Dubuque Water Pollution Control Plant Facilities Plan and Screening of Alternatives
Prepared by STRAND ASSOCIATES, INC.® 5-2 RAW:ebt\S:\@SAI\151--200\154\002\Wrd\Report\S5.doc\052708
B. Iowa Nutrient Strategies and Status The DNR was contacted to determine its approximate schedule for nutrient criteria development. The DNR is currently developing a state comprehensive nutrient management strategy, which includes the following preliminary steps:
1. Development of a comprehensive state nutrient budget for the maximum volume, frequency, and concentration of nutrients for each watershed that addresses all significant sources of nutrients in a water of this state on a watershed basis. This step is complete and a copy of the nutrient budget report is available on the DNR’s Web site.
2. Assessment of the available nutrient control technologies required to identify and assess
their effectiveness.
3. Development and adoption of administrative rules required to establish numeric water quality standards for nutrients.
According to DNR staff, there is no definitive schedule for implementing nutrient limits in NPDES permits in response to nutrient criteria development. The process of establishing water quality standards and nutrient criteria, as well as assessing nutrient control technologies, is ongoing. After the criteria have been established, it will take another period of years to determine specifically how the criteria might be applied and then to implement limits into NPDES permits. Therefore, while nutrient limits are not likely for the Dubuque WPCP within the next NPDES permit cycle, and potentially not with the next two cycles, it is likely that the Dubuque WPCP will need to meet effluent phosphorus and/or TN limits within the 20-year planning period. To date in the State of Iowa, nutrient limits have been imposed in NPDES permits as the result of the development of total maximum daily loads (TMDLs) for a receiving stream. In the majority of these cases, the nutrient limit has been assigned a value equal to a treatment plant’s current mass loadings to the water body. Justification for this approach is that the DNR’s research has shown about 10 percent of the TN and 15 percent of the TP in a typical Iowa stream is discharged from point sources. C. Impaired Waters and Total Maximum Daily Load Impacts The Clean Water Act (CWA) provides special authority for restoring polluted or impaired waters. For waterbodies that appear on the list of impaired waters [303(d) list], the CWA mandated development of the maximum amount of a specific pollutant that a waterbody can receive and still meet water quality standards, referred to as the TMDL. A TMDL also allocates the maximum amount of each identified pollutant of concern that can be contributed from both NPDES permitted discharges and nonpoint (surface runoff) sources.
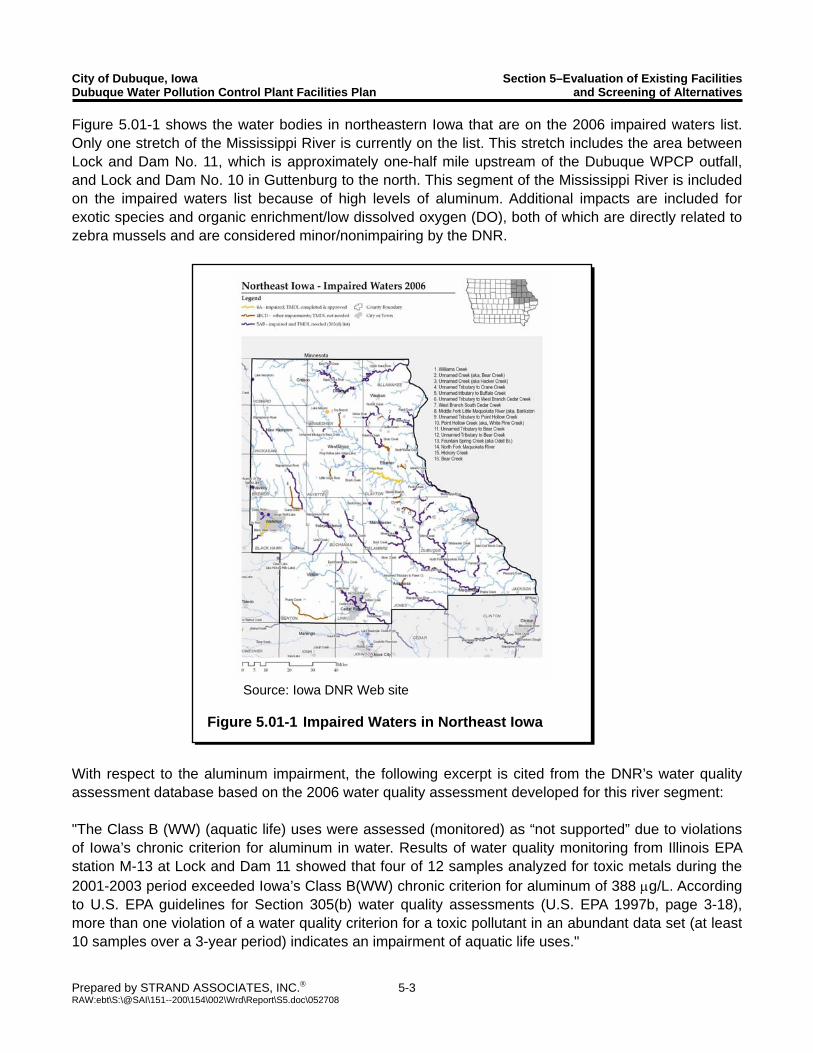
City of Dubuque, Iowa Section 5–Evaluation of Existing Facilities Dubuque Water Pollution Control Plant Facilities Plan and Screening of Alternatives
Prepared by STRAND ASSOCIATES, INC.® 5-3 RAW:ebt\S:\@SAI\151--200\154\002\Wrd\Report\S5.doc\052708
Figure 5.01-1 shows the water bodies in northeastern Iowa that are on the 2006 impaired waters list. Only one stretch of the Mississippi River is currently on the list. This stretch includes the area between Lock and Dam No. 11, which is approximately one-half mile upstream of the Dubuque WPCP outfall, and Lock and Dam No. 10 in Guttenburg to the north. This segment of the Mississippi River is included on the impaired waters list because of high levels of aluminum. Additional impacts are included for exotic species and organic enrichment/low dissolved oxygen (DO), both of which are directly related to zebra mussels and are considered minor/nonimpairing by the DNR.
With respect to the aluminum impairment, the following excerpt is cited from the DNR’s water quality assessment database based on the 2006 water quality assessment developed for this river segment: "The Class B (WW) (aquatic life) uses were assessed (monitored) as “not supported” due to violations of Iowa’s chronic criterion for aluminum in water. Results of water quality monitoring from Illinois EPA station M-13 at Lock and Dam 11 showed that four of 12 samples analyzed for toxic metals during the 2001-2003 period exceeded Iowa’s Class B(WW) chronic criterion for aluminum of 388 μg/L. According to U.S. EPA guidelines for Section 305(b) water quality assessments (U.S. EPA 1997b, page 3-18), more than one violation of a water quality criterion for a toxic pollutant in an abundant data set (at least 10 samples over a 3-year period) indicates an impairment of aquatic life uses."
Source: Iowa DNR Web site
Figure 5.01-1 Impaired Waters in Northeast Iowa

City of Dubuque, Iowa Section 5–Evaluation of Existing Facilities Dubuque Water Pollution Control Plant Facilities Plan and Screening of Alternatives
Prepared by STRAND ASSOCIATES, INC.® 5-4 RAW:ebt\S:\@SAI\151--200\154\002\Wrd\Report\S5.doc\052708
Based on comments from the DNR, the only potential 303(d) listing for the Mississippi River near the Dubuque WPCP outfall in the next impairment list update (scheduled to be released in May or June 2008) would be for mercury levels in fish. Some mercury samples in largemouth bass in 2006 were a little higher than the DNR’s trigger level for mercury of 0.3 ppm. DNR Fisheries conducted follow-up monitoring in the fall of 2007, and if the mercury levels in the follow-up samples are above 0.3 ppm, the DNR will issue a fish consumption advisory for that segment of river. The fish consumption uses would be considered impaired and that segment of the Mississippi River would be added to Iowa’s 2008 list of impaired waters [303(d) list]. D. Antidegradation Analysis Within the EPA’s framework of water quality criteria, the nation’s waterbodies are to be protected through compliance with water quality standards. All water quality standards are comprised of the following:
1. Designated uses. 2. Instream water quality criteria (both numeric and narrative) required to support the
designated use. 3. An antidegradation policy intended to prevent waterbodies that do meet water quality
criteria from deteriorating beyond their current condition. For the 20-year design period considered in this report, the average annual design flow of 10.64 mgd is less than the previously established design dry weather average flow of 13.39 mgd. Therefore, an antidegradation analysis should not be required. E. Anticipated NPDES Permit Requirements The current NPDES permit was developed in 1998 with an expiration date of 2003. While the City has applied for permit reissuance as required, the plant has been operating on that expired permit for the past four years. The DNR was requested to develop anticipated NPDES permit limits for the next permit reissuance, which is expected in 2008. In response to this request, the DNR issued a memorandum titled WLA/Permit Limits for the City of Dubuque Water Pollution Control Plant dated October 18, 2007, and also provided information on wasteload allocations/NPDES permit limits for toxics, TDS, chlorides, and iron in a spreadsheet. The memorandum and spreadsheet output are included in Appendix B. The NPDES effluent limits for CBOD5 and TSS are not expected to change. In addition, the DNR does not anticipate new limits for ammonia, TN, or phosphorus. However, a few of the existing permit limits will probably be modified (Table 5.01-2):
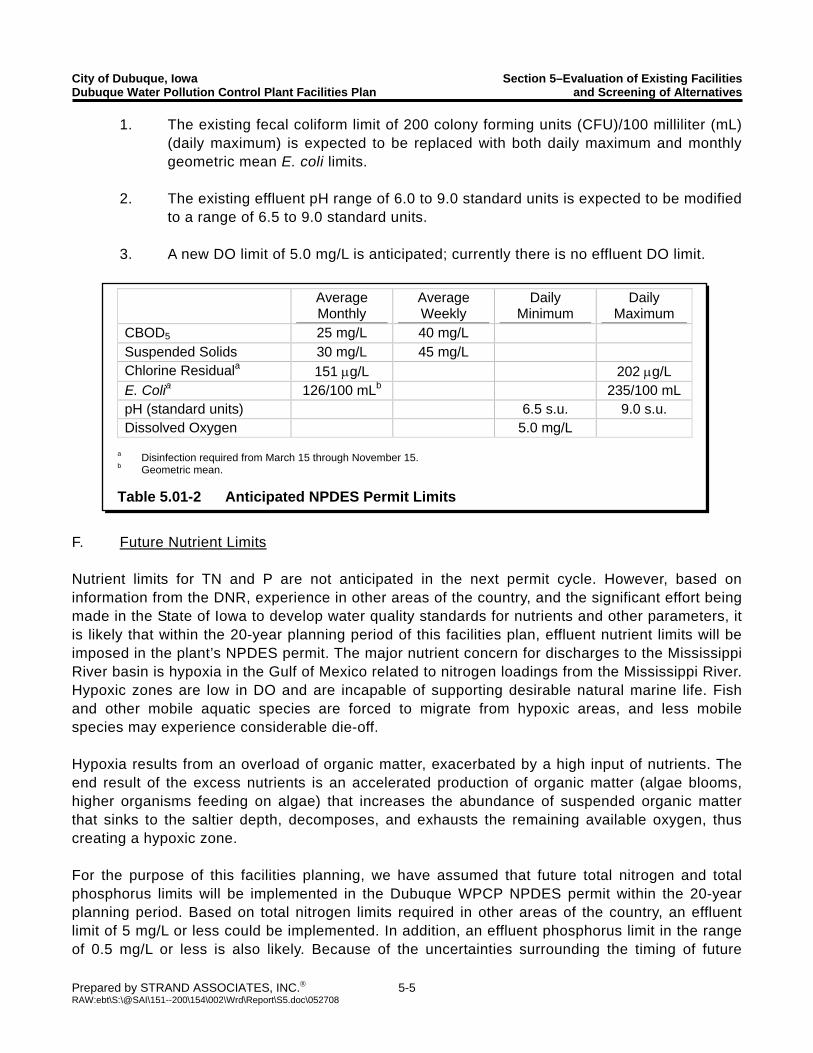
City of Dubuque, Iowa Section 5–Evaluation of Existing Facilities Dubuque Water Pollution Control Plant Facilities Plan and Screening of Alternatives
Prepared by STRAND ASSOCIATES, INC.® 5-5 RAW:ebt\S:\@SAI\151--200\154\002\Wrd\Report\S5.doc\052708
1. The existing fecal coliform limit of 200 colony forming units (CFU)/100 milliliter (mL) (daily maximum) is expected to be replaced with both daily maximum and monthly geometric mean E. coli limits.
2. The existing effluent pH range of 6.0 to 9.0 standard units is expected to be modified
to a range of 6.5 to 9.0 standard units.
3. A new DO limit of 5.0 mg/L is anticipated; currently there is no effluent DO limit.
F. Future Nutrient Limits Nutrient limits for TN and P are not anticipated in the next permit cycle. However, based on information from the DNR, experience in other areas of the country, and the significant effort being made in the State of Iowa to develop water quality standards for nutrients and other parameters, it is likely that within the 20-year planning period of this facilities plan, effluent nutrient limits will be imposed in the plant’s NPDES permit. The major nutrient concern for discharges to the Mississippi River basin is hypoxia in the Gulf of Mexico related to nitrogen loadings from the Mississippi River. Hypoxic zones are low in DO and are incapable of supporting desirable natural marine life. Fish and other mobile aquatic species are forced to migrate from hypoxic areas, and less mobile species may experience considerable die-off. Hypoxia results from an overload of organic matter, exacerbated by a high input of nutrients. The end result of the excess nutrients is an accelerated production of organic matter (algae blooms, higher organisms feeding on algae) that increases the abundance of suspended organic matter that sinks to the saltier depth, decomposes, and exhausts the remaining available oxygen, thus creating a hypoxic zone. For the purpose of this facilities planning, we have assumed that future total nitrogen and total phosphorus limits will be implemented in the Dubuque WPCP NPDES permit within the 20-year planning period. Based on total nitrogen limits required in other areas of the country, an effluent limit of 5 mg/L or less could be implemented. In addition, an effluent phosphorus limit in the range of 0.5 mg/L or less is also likely. Because of the uncertainties surrounding the timing of future
Average Monthly
Average Weekly
Daily Minimum
Daily Maximum
CBOD5 25 mg/L 40 mg/L Suspended Solids 30 mg/L 45 mg/L Chlorine Residuala 151 μg/L 202 μg/L
E. Colia 126/100 mLb 235/100 mL pH (standard units) 6.5 s.u. 9.0 s.u. Dissolved Oxygen 5.0 mg/L
a Disinfection required from March 15 through November 15. b Geometric mean. Table 5.01-2 Anticipated NPDES Permit Limits
City of Dubuque, Iowa Section 5–Evaluation of Existing Facilities Dubuque Water Pollution Control Plant Facilities Plan and Screening of Alternatives
Prepared by STRAND ASSOCIATES, INC.® 5-6 RAW:ebt\S:\@SAI\151--200\154\002\Wrd\Report\S5.doc\052708
nutrient limits, as well as the magnitude of any future limits, this facilities plan will not include a detailed evaluation of the treatment processes and facilities needed to meet such future limits. However, for all process alternatives evaluated, the impacts required to construct future nutrient removal facilities and operations will be carefully considered. G. Biosolids Disposal and Beneficial Reuse Incinerator ash from the Dubuque WPCP is currently dewatered and held at the WPCP site for a period of one to several years. Final disposal in the past has been by landfilling. However, more recent disposal has been through beneficial reuse of the ash as a component in engineered fill. If incineration is eliminated, solids produced at the WPCP will require disposal to the land either by land application on agricultural lands or through the production of compost for distribution to other users. These disposal alternatives are regulated by Iowa Administrative Code (IAC) 567, Chapter 67, which includes permissible metals concentrations in both Class I (exceptional quality) or Class II (normal quality) biosolids. The sludge produced from current Dubuque WPCP operations appears to meet the metals concentration limits included in IAC 567, Chapter 67 for arsenic, cadmium, lead, nickel, and mercury. Year 2007 monitoring data indicates that the current sludge concentrations for these five metals were all significantly lower than required for land application. No monitoring is currently conducted for copper, selenium, or zinc, which are also regulated by IAC 567, Chapter 67. Therefore, these parameters will need to be monitored to determine whether exceptional quality biosolids can be produced from the existing sludge. For the purposes of this planning document, we have assumed that the copper, selenium, and zinc concentrations in the sludge meet the requirements of IAC 567, Chapter 67. H. Sludge Incineration Regulations In January 2007 the USEPA announced that municipal sludge incineration operations would be regulated under Section 112 of the Clean Air Act. However, the results of a recent court case may reverse that decision and may result in regulation under Section 129 in lieu of Section 112. Section 129 covers municipal solid waste incinerators and is expected to require significantly more monitoring for specific compounds than the current permit requires, including particulate matter, sulfur dioxide, nitrogen oxides, cadmium, mercury, lead, dioxins, and furans. The Dubuque sludge incinerators would likely meet new numerical limits imposed by Section 129. However, the annual monitoring costs and reporting effort could increase substantially. I. Chemical Security Wastewater treatment plants are exempt from federal chemical security regulations developed for the chemical industry. Draft legislation would establish permanent security requirements for chemical plants, which may be defined to include water and wastewater utilities. Currently water and wastewater utilities provide security measures and programs on a voluntary basis. If the legislation is passed and requires wastewater utilities to comply, the Dubuque WPCP chlorine and bisulfite facilities would likely be regulated and may require additional controls, monitoring, and security measures.
City of Dubuque, Iowa Section 5–Evaluation of Existing Facilities Dubuque Water Pollution Control Plant Facilities Plan and Screening of Alternatives
Prepared by STRAND ASSOCIATES, INC.® 5-7 RAW:ebt\S:\@SAI\151--200\154\002\Wrd\Report\S5.doc\052708
5.02 UNIT PROCESS EVALUATION This section evaluates the ability of the existing WPCP facilities to treat the projected future flows and loadings while meeting the anticipated future NPDES permit requirements. In addition, other nontreatment issues are discussed. Where applicable, treatment alternatives are identified for detailed evaluation and consideration in Section 6 of this report. The City of Dubuque has an existing WWTP constituting a significant investment from the City’s residences, industries, commercial enterprises, and other entities. A wastewater treatment facility has been in operation at the current WPCP site since the late 1960s. As a result, there is a substantial investment in the infrastructure both of the conveyance and treatment facilities. Given this investment, the overall community acceptance of the current location of the Dubuque WPCP, and the availability of adequate land at or near the current site both for current facility needs and future expansion, all alternatives evaluated in this report will use the existing site and continue the discharge of treated effluent to the Mississippi River. A. Influent Screening Influent wastewater enters the plant through two force mains (FM), the 18-inch Catfish FM and the 42-inch Cedar-Terminal FM, and is metered by two magnetic flow meters installed in a meter vault. The preliminary treatment facilities consist of two mechanically cleaned bar screens and a vortex-type grit removal system. The mechanical screens are climber-type screens with 3/4-inch bar openings. The screenings are dropped into a screw conveyor/wash press and are discharged to a dumpster for landfilling. The bypass channel has a manually cleaned bar screen with 1 5/8-inch bar openings. The existing mechanical screens were installed in 1993, and the nominal capacity of each screen is 20 mgd for a total capacity of 40 mgd. The screens are nearing the end of their useful life, and while they have required relatively minor maintenance since being installed, the 3/4-inch openings allow a significant amount of relatively large solids to pass to the downstream treatment units. Most screening installations in the last 5 to 10 years have included screens with 1/8-inch to 1/4-inch openings to reduce the amount of debris and material passing to downstream treatment processes. Therefore, we recommend that finer influent wastewater screening be implemented at the Dubuque WPCP. While it may be feasible to install screens with 1/8-inch openings, the additional head loss could create high headwaters at the treatment plant. Based on a preliminary hydraulic analysis, at this time we recommend a screen opening of 1/4-inch for screens installed in the existing channels. Based on this, the following influent screening alternatives will be evaluated in Section 6:
S1: Renovate the existing screening frames with 3/8-inch screens and climber rake; install screenings washer/compactor.
S2: Replace existing screens with new 1/4-inch fine screens and washer/compactor.
City of Dubuque, Iowa Section 5–Evaluation of Existing Facilities Dubuque Water Pollution Control Plant Facilities Plan and Screening of Alternatives
Prepared by STRAND ASSOCIATES, INC.® 5-8 RAW:ebt\S:\@SAI\151--200\154\002\Wrd\Report\S5.doc\052708
B. Grit Removal Following screening, wastewater flows to the vortex grit units, which were installed in 1993. The two units each have a nominal capacity of approximately 34 mgd. This type of grit removal still represents the state-of-the art for wastewater treatment, and since these facilities have adequate capacity for the future design flows, the existing grit removal structures should remain. Grit settles to the bottom of the basins and is pumped to two grit classifiers by recessed impeller vortex grit pumps. These pumps were replaced in 2007. Grit is dewatered in the classifiers, and this material is discharged to a recently replaced belt conveyor that discharges dewatered grit to a dumpster for landfilling. The grit classifiers are corroded and in need of replacement. The plant also has problems with the grit pump suction and discharge lines plugging. Costs for replacement of the grit classifiers are included in the opinion of cost for the project. The classifiers will be rearranged to minimize the length of auxiliary conveyors needed to convey grit to the dumpster. New conveyors will be of the screw conveyor type rather than belted conveyors. In addition, an allowance for replacing and/or reconfiguring the grit suction and discharge piping will be included in the opinion of costs. C. Primary Sedimentation Wastewater flows by gravity from the grit chambers to three 90-foot-diameter primary clarifiers. The tanks have lightweight concrete dome covers that were installed in the 1970s and resurfaced in the 1980s. The clarifier drives and mechanisms were installed in the 1980s and are planned to be refurbished as part of the plant’s preventive maintenance program. New baffles and weirs were installed during the 1993 project. Primary sludge is pumped to two primary sludge holding tanks using air diaphragm pumps that were installed in 1993. Scum and grease are pumped to a separate holding and decanting tank by progressive cavity pumps that were installed in the 1970s. The scum box on each clarifier is constantly flowing with flush water, so the amount of scum and grease requiring pumping is considerably more than necessary. The 90-foot-diameter sedimentation tanks have a total surface area of 19,100 square feet, which provides a surface overflow rate (SOR) of 705 gpd/ft2 at the design average wet weather (AWW) flow rate of 13.47 mgd and an SOR of 2,143 gpd/ft2 at the design peak hourly flow rate of 40.9 mgd. The Iowa Facilities Design Standards includes a maximum AWW SOR of 1,000 gpd/ft2 (condition met) and a maximum peak hourly SOR of 1,500 gpd/ft2 (condition not met). However, these design standards do allow a higher peak hourly SOR as long as the primary BOD removal efficiency is decreased for design of the downstream secondary treatment facilities. If a fourth 90-foot-diameter primary clarifier were constructed, the peak hourly design SOR would be approximately 1,600 gpd/ft2, which is still higher than the recommended design standard of 1,500 gpd/ft2. However, a fourth clarifier would provide improved redundancy for preventive maintenance and would be expected to improve primary treatment performance, especially at higher wet weather flows. The following primary treatment modifications are included in the opinion of capital cost developed in Section 6 of this report:
City of Dubuque, Iowa Section 5–Evaluation of Existing Facilities Dubuque Water Pollution Control Plant Facilities Plan and Screening of Alternatives
Prepared by STRAND ASSOCIATES, INC.® 5-9 RAW:ebt\S:\@SAI\151--200\154\002\Wrd\Report\S5.doc\052708
1. A fourth 90-foot-diameter clarifier is planned to be constructed to provide more reliable primary treatment and improve wet weather treatment capacity. However, it is noted that this unit is not required by code and could be constructed in the future.
2. The existing domes will be removed and replaced with flat fiberglass weir covers only.
The ventilation system will be modified and directed to an odor control system discussed later in this section.
3. The primary scum pumps will be replaced with new progressing cavity pumps. 4. The flush water system used to remove scum will be modified to reduce the volume of
water utilized. 5. The central building will be modified to accommodate removal of the domes. 6. The primary influent splitter structure will be upgraded with new gates.
D. Biological Treatment The biological treatment facilities include the activated sludge basins, aeration mixers, and the oxygen delivery system. There are three trains of aeration basins, each with a volume of approximately 630,000 gallons for a total volume of 1.89-million gallons. The plant has only utilized two of the three trains (1.26-million gallons) for the past 10 to 15 years. Each train is separated into three passes, and each pass has three stages in series. Each stage has a surface aerator for a total of 9 aerators per train and 27 aerators total. The HPO activated sludge facilities were installed in the 1970s. Most of the mixers are original and are operating beyond the expected life of such equipment. The original cryogenic oxygen generation system was decommissioned in the early 1990s, and the plant has purchased liquid oxygen since then. The existing facilities continue to serve the plant well, even with only two of the three trains operating. Future design BOD loadings to secondary treatment are approximately 30,900 lbs/day (maximum month), which equates to a volumetric BOD load of 122 lbs/1,000 ft3/day if all three basins are in service. At an mixed liquor volatile suspended solids (MLVSS) of 3,500 mg/L, the maximum month food-to-microorganism (F:M) ratio is approximately 0.56 lbs BOD5/lb MLVSS/day. The oxygen demand is projected to be approximately 15 to 17 tons/day at the future design average BOD loadings assuming 90 percent oxygen utilization and 1.1 lbs O2/lb BOD5 according to Iowa Design Standards. Nitrification requirements were not considered in this calculation as ammonia limits are not anticipated and the plant doesn’t typically nitrify now because of suppressed pH levels. However, if future TN limits are imposed, an additional oxygen demand will need to be met for biological nitrification reactions. This will be considered in the alternative evaluations in Section 6. All these design values are within the normal range of high-rate HPO activated sludge facility design standards. Therefore, the HPO activated sludge basins appear to have adequate volume, and physical expansion would not be required to accommodate the future design loadings. However, the system would require replacement of the existing 34-year-old surface mixers to improve energy efficiency and
City of Dubuque, Iowa Section 5–Evaluation of Existing Facilities Dubuque Water Pollution Control Plant Facilities Plan and Screening of Alternatives
Prepared by STRAND ASSOCIATES, INC.® 5-10 RAW:ebt\S:\@SAI\151--200\154\002\Wrd\Report\S5.doc\052708
mechanical reliability. The existing controls would also be upgraded to improve efficiencies. Therefore, while the existing HPO activated sludge facilities are a viable option for the future secondary treatment needs, the costs to upgrade the existing HPO activated sludge facilities will be significant and it makes sense to evaluate other options at this time. In addition, the potential for future nutrient limits will require careful consideration as HPO activated sludge treatment is typically not as amenable as air activated sludge for removal of TN and TP. This report evaluates the following alternatives in Section 6:
B1 HPO activated sludge; new aerators and controls; hauled liquid O2. B2 HPO activated sludge; new aerators and controls; on-site O2 generation. B3 Air activated sludge; expand tankage; new blowers and diffusers. B4 Moving bed biological reactor (MBBR) activated sludge; expand tankage; new blowers
and diffusers. Each of these alternatives includes the following with respect to the existing facilities:
1. Reuse of the existing activated sludge basins to the extent practical. A structural analyses of the tanks and concrete decks will be required during final design.
2. Reuse of the existing four final clarifiers (see below). 3. Reuse of the existing RAS pumps (six pumps at 3,000 gpm each), which were installed
in the mid-1990s. 4. Reuse of the two existing WAS pumps.
Process sizing for the biological treatment alternatives will be based on the design loads and flows summarized in Section 4, assuming 30 percent removal of the plant influent BOD5 loading in the primary clarifiers. Other biological treatment alternatives were also considered, such as wetland treatment or wetland polishing, aquatic plant systems (hyacinths, duckweed), and similar “natural” treatment systems. In general, these systems have been used for relatively small wastewater treatment applications to polish treated effluent and/or remove nutrients from secondary effluent prior to discharge. This size limitation is the result of the significant land area required for such systems. Most recent applications of natural treatment systems have been for flows of less than 100,000 gpd and typically less than 25,000 gpd. There have been some systems operating at higher flow rates, but these systems have extensive land areas dedicated for treatment. The design average effluent flow from the Dubuque WPCP is approximately 10 mgd. Using a constructed wetland system or similar aquatic plant polishing system to remove nutrients from the existing treated effluent from the Dubuque WPCP would require a land area of approximately 120 acres and perhaps significantly more. By comparison, the existing WPCP site is only about 20 acres in total area. Sizing a wetland or similar system to provide full treatment of raw wastewater for the City of Dubuque would require considerably more land, perhaps an additional 500 to 1,000 acres. For these
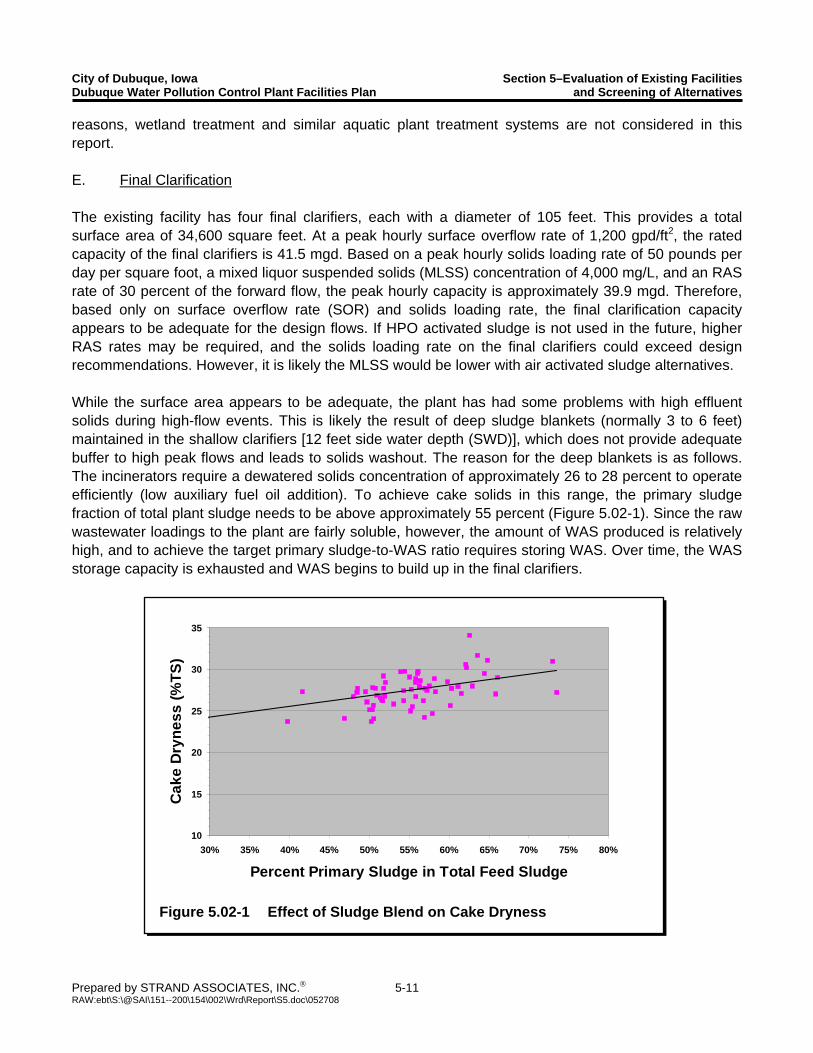
City of Dubuque, Iowa Section 5–Evaluation of Existing Facilities Dubuque Water Pollution Control Plant Facilities Plan and Screening of Alternatives
Prepared by STRAND ASSOCIATES, INC.® 5-11 RAW:ebt\S:\@SAI\151--200\154\002\Wrd\Report\S5.doc\052708
reasons, wetland treatment and similar aquatic plant treatment systems are not considered in this report. E. Final Clarification The existing facility has four final clarifiers, each with a diameter of 105 feet. This provides a total surface area of 34,600 square feet. At a peak hourly surface overflow rate of 1,200 gpd/ft2, the rated capacity of the final clarifiers is 41.5 mgd. Based on a peak hourly solids loading rate of 50 pounds per day per square foot, a mixed liquor suspended solids (MLSS) concentration of 4,000 mg/L, and an RAS rate of 30 percent of the forward flow, the peak hourly capacity is approximately 39.9 mgd. Therefore, based only on surface overflow rate (SOR) and solids loading rate, the final clarification capacity appears to be adequate for the design flows. If HPO activated sludge is not used in the future, higher RAS rates may be required, and the solids loading rate on the final clarifiers could exceed design recommendations. However, it is likely the MLSS would be lower with air activated sludge alternatives. While the surface area appears to be adequate, the plant has had some problems with high effluent solids during high-flow events. This is likely the result of deep sludge blankets (normally 3 to 6 feet) maintained in the shallow clarifiers [12 feet side water depth (SWD)], which does not provide adequate buffer to high peak flows and leads to solids washout. The reason for the deep blankets is as follows. The incinerators require a dewatered solids concentration of approximately 26 to 28 percent to operate efficiently (low auxiliary fuel oil addition). To achieve cake solids in this range, the primary sludge fraction of total plant sludge needs to be above approximately 55 percent (Figure 5.02-1). Since the raw wastewater loadings to the plant are fairly soluble, however, the amount of WAS produced is relatively high, and to achieve the target primary sludge-to-WAS ratio requires storing WAS. Over time, the WAS storage capacity is exhausted and WAS begins to build up in the final clarifiers.
10
15
20
25
30
35
30% 35% 40% 45% 50% 55% 60% 65% 70% 75% 80%
Percent Primary Sludge in Total Feed Sludge
Cak
e D
ryne
ss (%
TS)
Figure 5.02-1 Effect of Sludge Blend on Cake Dryness
City of Dubuque, Iowa Section 5–Evaluation of Existing Facilities Dubuque Water Pollution Control Plant Facilities Plan and Screening of Alternatives
Prepared by STRAND ASSOCIATES, INC.® 5-12 RAW:ebt\S:\@SAI\151--200\154\002\Wrd\Report\S5.doc\052708
The issue of high WAS levels compared to primary sludge quantities will be addressed in the following manner:
1. If the existing incineration system is maintained, aerobic digestion or other WAS minimization process will be required to reduce the amount of WAS. Alternatively, longer sludge ages could be employed in the activated sludge system [current solids retention time (SRT) is approximately five days with an observed yield of approximately 0.55 lbs WAS/lb BOD5]. However, based on past plant experience, longer sludge ages result in proliferation of filamentous organisms. Therefore, for the purpose of this report, we have assumed that aerobic WAS digestion would be employed if sludge incineration is continued.
2. If alternative sludge management systems are employed, the significance of the primary
sludge-to-WAS mass ratio is reduced, and a dedicated WAS reduction process is not required.
Density current baffles were installed in the 1990s and have improved the performance of the final clarifiers. Over the last few years, there have been some additional developments in energy dissipation inlets in the clarification industry. Because of the concerns with peak flows and the impacts on solids washout, new energy dissipation inlets have been included for all four clarifiers. F. Effluent Disinfection The existing disinfection system at the Dubuque WPCP employs a chlorine gas solution added in a mixing chamber downstream of the final clarifiers and upstream of the chlorine contact tanks. Dechlorination is provided by addition of liquid magnesium bisulfite solution in a mixing chamber immediately downstream of the chlorine contact tank. Effluent from the dechlorination chamber discharges to an outfall pipe to the Mississippi River. The two chlorine contact tanks each have a volume of 24,150 ft3 for a total volume of 48,300 ft3. At the average wet weather flow of 13.5 mgd, this provides about 38 minutes of detention time, and at the peak hourly flow of 40.9 mgd, about 13 minutes of detention time is provided. The current facility meets the Iowa Wastewater Facilities Design Standards–Chapter 20 Disinfection requirement of 30 minutes detention time at average wet weather flow but does not meet the requirement for 15 minutes detention time at the peak hourly wet weather flow. The current fecal coliform limit has been exceeded on some occasions with the current system. The existing system has been in compliance with the average residual chlorine limit on a regular basis, but it has exceeded the maximum day residual chlorine limit several times since 2003. The disinfection system will have to meet the new water quality standards for E. coli as discussed previously in this section as well as in Section 6. Redundant gaseous chlorination equipment was originally installed, but only one chlorinator and related equipment is currently operational. If gaseous chlorination is continued, replacement of all the equipment will be required. In addition, because of concerns with a gaseous chlorine release in the area, a new scrubber for the storage and handling rooms would be necessary.
City of Dubuque, Iowa Section 5–Evaluation of Existing Facilities Dubuque Water Pollution Control Plant Facilities Plan and Screening of Alternatives
Prepared by STRAND ASSOCIATES, INC.® 5-13 RAW:ebt\S:\@SAI\151--200\154\002\Wrd\Report\S5.doc\052708
The Dubuque WPCP operating staff has expressed a desire to replace the chlorine gas system with a system with less potential emergency risk and exposure concerns. Systems identified for evaluation include the following (see Section 6):
D1 Replace existing gas chlorination equipment and continue with gaseous chlorine and liquid dechlorination; install chlorine gas scrubber.
D2 Convert to liquid sodium hypochlorite system and continue with liquid dechlorination. D3 Convert to on-site hypochlorite generation and continue with liquid dechlorination. D4 Convert to ozone disinfection. D5 Convert to ultraviolet light (UV) disinfection.
G. Peak Flow Management/Equalization Peak hourly design flows are not anticipated to exceed the WPCP final clarifier capacity as noted previously in this section. However, because of the high effluent suspended solids discharged in the past during peak flow events, and relatively shallow depth of the final clarifiers, this report considers alternatives to reduce peak flows through the final clarifiers and improve peak flow management overall. In other states, flow blending facilities are allowed and provide the means to off-load the secondary treatment facilities while still meeting effluent discharge limits. However, based on discussions with the DNR, flow blending in Iowa may not be allowed. Early in 2007, the City conducted a preliminary evaluation of the existing trickling filters, which have not been used for about 20 years, for reuse as peak flow equalization basins. These structures are each 195 feet in diameter with a potential liquid depth of about 7 feet, for a total volume of approximately 3.1-million gallons. Hydraulically, peak flows could be diverted to these structures downstream of primary clarification using existing flow control structures, as this was the normal forward flow since the late 1960s when these structures were built. Modifications would be required to allow forward flows to continue to the secondary treatment processes while diverting excess flows above an established threshold (e.g., 15 or 20 mgd). The overflow from the equalization structures would be set at an elevation of approximately 1 foot below the top of the existing walls. This overflow would not receive any flow until the tanks were full. If the tanks would completely fill because of a long sustained peak flow event, the plant could either shut off flow to the equalization tanks to direct all flow to secondary treatment, or the tanks could be designed to overflow to the secondary treatment basins. Based on preliminary hydraulic evaluations and a review of tank elevations in comparison to upstream and downstream treatment units, it appears these existing tanks are well positioned for such operation. While an exhaustive peak flow evaluation was not completed for this planning report, we did review several major recent events, including two significant peak flow events in July of 2007. Figures 5.02-2 and 5.02-3 graphically represents the potential equalization provided by these structures under two peak flow events that occurred in July 2007. For the first event, which is a fairly typical occurrence in Dubuque, flows increased from about 6 mgd to approximately 27 mgd within a few hours and then slowly decreased back to 10 mgd over several more hours. This event (Figure 5.02-2) would only have required 300,000 gallons of equalization to maintain maximum flows through the secondary treatment system at 15 mgd. The volume of these structures would have been adequate to maintain even lower maximum flows if desired.

City of Dubuque, Iowa Section 5–Evaluation of Existing Facilities Dubuque Water Pollution Control Plant Facilities Plan and Screening of Alternatives
Prepared by STRAND ASSOCIATES, INC.® 5-14 RAW:ebt\S:\@SAI\151--200\154\002\Wrd\Report\S5.doc\052708
For the second event later in July, influent flows increased from about 6 mgd to nearly 35 mgd over a couple of hours and sustained flows above 30 mgd for nearly 10 hours. The two trickling filter structures, if used for equalization, could have reduced the peak flow through the secondary treatment system to approximately 22 mgd. Therefore, the use of these structures should provide a relatively low-cost improvement to peak flow management, and we recommend these modifications be included in the project.
-
5
10
15
20
25
3019
:55
20:1
2
20:2
8
20:4
5
21:0
1
21:1
7
21:3
4
21:5
0
22:0
7
22:2
3
22:4
0
22:5
6
23:1
2
23:2
9
23:4
5
0:02
0:18
0:35
0:51
1:07
1:24
1:40
1:57
2:13
2:30
2:46
3:03
3:19
3:35
3:52
Time of Day
Influ
ent F
low
(mgd
)
Flows > 15 mgd storedRequired Storage
~ 300,000 gal
Figure 5.02-2 Potential Equalization of July 3 and 4, 2007, Rain Event
-
5
10
15
20
25
30
35
40
19:5
7
20:4
1
21:2
4
22:0
8
22:5
1
23:3
5
0:18
1:02
1:45
2:29
3:12
3:56
4:39
5:22
6:06
6:49
7:33
8:16
9:00
9:43
10:2
7
11:1
0
11:5
4
Time of Day
Influ
ent F
low
(mgd
)
Flows > 22 mgd stored Required Storage ~ 3,100,000 gal
Figure 5.02-3 Potential Equalization of July 17 and 18, 2007, Rain Event
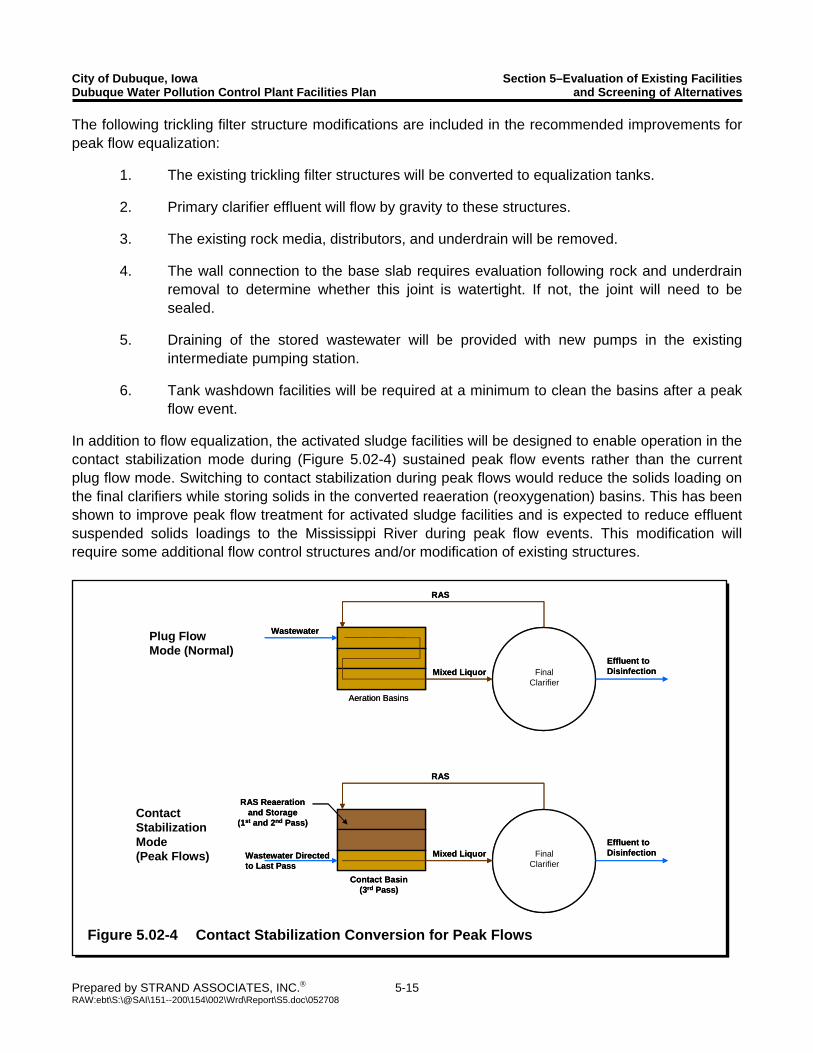
City of Dubuque, Iowa Section 5–Evaluation of Existing Facilities Dubuque Water Pollution Control Plant Facilities Plan and Screening of Alternatives
Prepared by STRAND ASSOCIATES, INC.® 5-15 RAW:ebt\S:\@SAI\151--200\154\002\Wrd\Report\S5.doc\052708
The following trickling filter structure modifications are included in the recommended improvements for peak flow equalization:
1. The existing trickling filter structures will be converted to equalization tanks. 2. Primary clarifier effluent will flow by gravity to these structures. 3. The existing rock media, distributors, and underdrain will be removed. 4. The wall connection to the base slab requires evaluation following rock and underdrain
removal to determine whether this joint is watertight. If not, the joint will need to be sealed.
5. Draining of the stored wastewater will be provided with new pumps in the existing
intermediate pumping station. 6. Tank washdown facilities will be required at a minimum to clean the basins after a peak
flow event.
In addition to flow equalization, the activated sludge facilities will be designed to enable operation in the contact stabilization mode during (Figure 5.02-4) sustained peak flow events rather than the current plug flow mode. Switching to contact stabilization during peak flows would reduce the solids loading on the final clarifiers while storing solids in the converted reaeration (reoxygenation) basins. This has been shown to improve peak flow treatment for activated sludge facilities and is expected to reduce effluent suspended solids loadings to the Mississippi River during peak flow events. This modification will require some additional flow control structures and/or modification of existing structures.
Effluent toDisinfection
RAS
Wastewater
Mixed Liquor FinalClarifier
Aeration Basins
Effluent toDisinfection
RAS
Wastewater
Mixed Liquor FinalClarifier
Aeration Basins
Effluent toDisinfection
RAS
Wastewater Directedto Last Pass
Mixed Liquor FinalClarifier
Contact Basin(3rd Pass)
RAS Reaerationand Storage
(1st and 2nd Pass)
Effluent toDisinfection
RAS
Wastewater Directedto Last Pass
Mixed Liquor FinalClarifier
Contact Basin(3rd Pass)
RAS Reaerationand Storage
(1st and 2nd Pass)ContactStabilizationMode (Peak Flows)
Plug FlowMode (Normal)
Figure 5.02-4 Contact Stabilization Conversion for Peak Flows
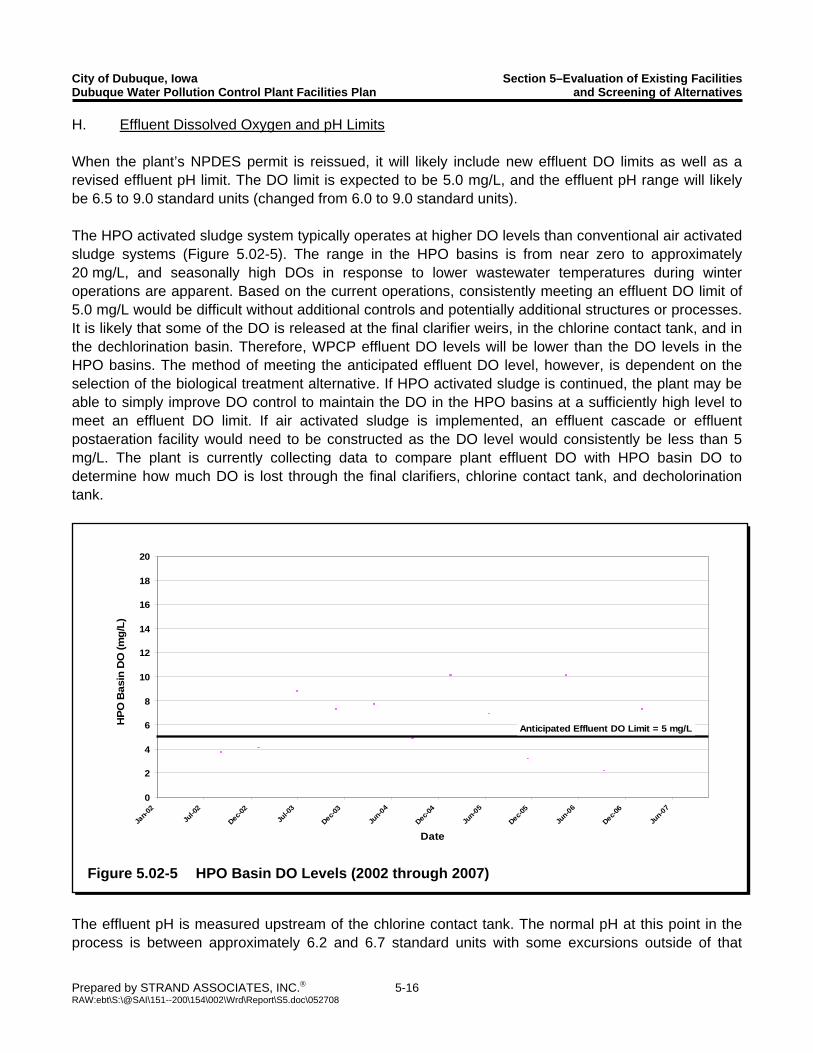
City of Dubuque, Iowa Section 5–Evaluation of Existing Facilities Dubuque Water Pollution Control Plant Facilities Plan and Screening of Alternatives
Prepared by STRAND ASSOCIATES, INC.® 5-16 RAW:ebt\S:\@SAI\151--200\154\002\Wrd\Report\S5.doc\052708
H. Effluent Dissolved Oxygen and pH Limits When the plant’s NPDES permit is reissued, it will likely include new effluent DO limits as well as a revised effluent pH limit. The DO limit is expected to be 5.0 mg/L, and the effluent pH range will likely be 6.5 to 9.0 standard units (changed from 6.0 to 9.0 standard units). The HPO activated sludge system typically operates at higher DO levels than conventional air activated sludge systems (Figure 5.02-5). The range in the HPO basins is from near zero to approximately 20 mg/L, and seasonally high DOs in response to lower wastewater temperatures during winter operations are apparent. Based on the current operations, consistently meeting an effluent DO limit of 5.0 mg/L would be difficult without additional controls and potentially additional structures or processes. It is likely that some of the DO is released at the final clarifier weirs, in the chlorine contact tank, and in the dechlorination basin. Therefore, WPCP effluent DO levels will be lower than the DO levels in the HPO basins. The method of meeting the anticipated effluent DO level, however, is dependent on the selection of the biological treatment alternative. If HPO activated sludge is continued, the plant may be able to simply improve DO control to maintain the DO in the HPO basins at a sufficiently high level to meet an effluent DO limit. If air activated sludge is implemented, an effluent cascade or effluent postaeration facility would need to be constructed as the DO level would consistently be less than 5 mg/L. The plant is currently collecting data to compare plant effluent DO with HPO basin DO to determine how much DO is lost through the final clarifiers, chlorine contact tank, and decholorination tank.
The effluent pH is measured upstream of the chlorine contact tank. The normal pH at this point in the process is between approximately 6.2 and 6.7 standard units with some excursions outside of that
0
2
4
6
8
10
12
14
16
18
20
Jan-0
2Ju
l-02
Dec-02
Jul-0
3
Dec-03
Jun-0
4
Dec-04
Jun-05
Dec-05
Jun-06
Dec-06
Jun-0
7
Date
HPO
Bas
in D
O (m
g/L)
Anticipated Effluent DO Limit = 5 mg/L
Figure 5.02-5 HPO Basin DO Levels (2002 through 2007)
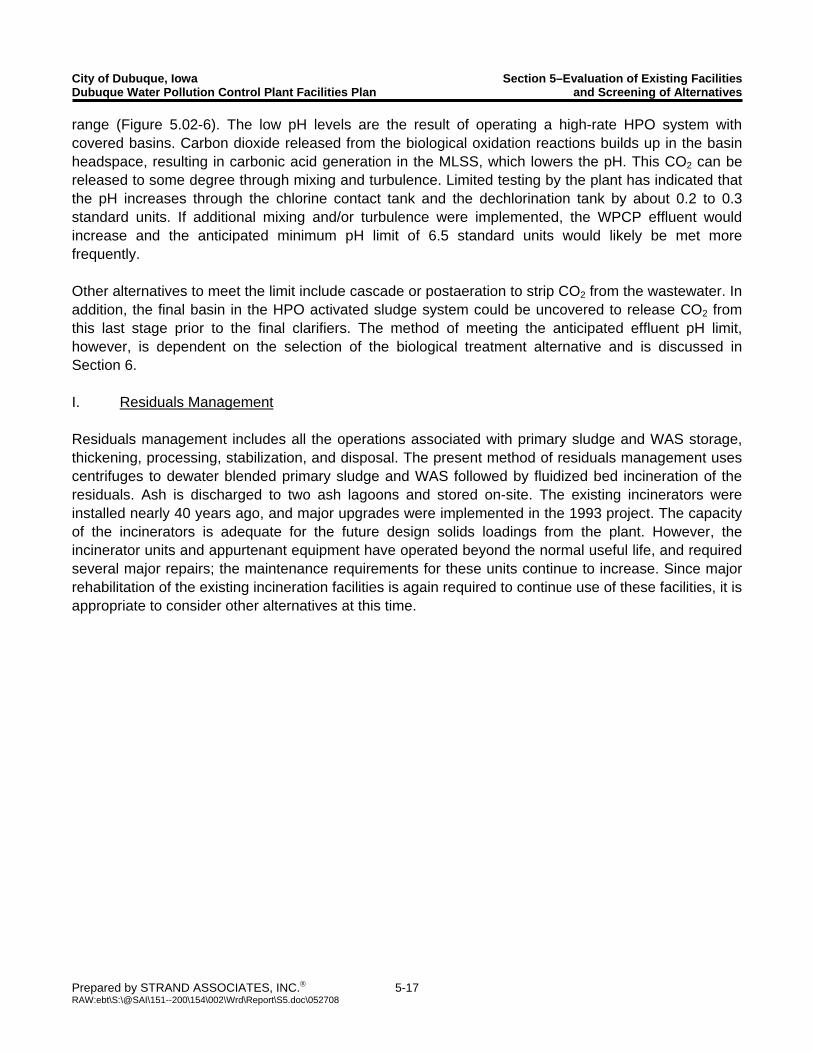
City of Dubuque, Iowa Section 5–Evaluation of Existing Facilities Dubuque Water Pollution Control Plant Facilities Plan and Screening of Alternatives
Prepared by STRAND ASSOCIATES, INC.® 5-17 RAW:ebt\S:\@SAI\151--200\154\002\Wrd\Report\S5.doc\052708
range (Figure 5.02-6). The low pH levels are the result of operating a high-rate HPO system with covered basins. Carbon dioxide released from the biological oxidation reactions builds up in the basin headspace, resulting in carbonic acid generation in the MLSS, which lowers the pH. This CO2 can be released to some degree through mixing and turbulence. Limited testing by the plant has indicated that the pH increases through the chlorine contact tank and the dechlorination tank by about 0.2 to 0.3 standard units. If additional mixing and/or turbulence were implemented, the WPCP effluent would increase and the anticipated minimum pH limit of 6.5 standard units would likely be met more frequently. Other alternatives to meet the limit include cascade or postaeration to strip CO2 from the wastewater. In addition, the final basin in the HPO activated sludge system could be uncovered to release CO2 from this last stage prior to the final clarifiers. The method of meeting the anticipated effluent pH limit, however, is dependent on the selection of the biological treatment alternative and is discussed in Section 6. I. Residuals Management Residuals management includes all the operations associated with primary sludge and WAS storage, thickening, processing, stabilization, and disposal. The present method of residuals management uses centrifuges to dewater blended primary sludge and WAS followed by fluidized bed incineration of the residuals. Ash is discharged to two ash lagoons and stored on-site. The existing incinerators were installed nearly 40 years ago, and major upgrades were implemented in the 1993 project. The capacity of the incinerators is adequate for the future design solids loadings from the plant. However, the incinerator units and appurtenant equipment have operated beyond the normal useful life, and required several major repairs; the maintenance requirements for these units continue to increase. Since major rehabilitation of the existing incineration facilities is again required to continue use of these facilities, it is appropriate to consider other alternatives at this time.
City of Dubuque, Iowa Section 5–Evaluation of Existing Facilities Dubuque Water Pollution Control Plant Facilities Plan and Screening of Alternatives
Prepared by STRAND ASSOCIATES, INC.® 5-18 RAW:ebt\S:\@SAI\151--200\154\002\Wrd\Report\S5.doc\052708
4.0
4.5
5.0
5.5
6.0
6.5
7.0
7.5
8.0
Jan-02Jul-0
2
Dec-02Jul-0
3
Dec-03
Jun-04
Dec-04
Jun-05
Dec-05
Jun-06
Dec-06
Jun-07
Date
Efflu
ent p
H
Anticipated Effluent Low pH Limit = 6.5
Figure 5.02-6 Effluent pH Levels (2002 through 2007)
The alternatives to be included in Section 6 for residuals management are as follows:
RM1a Major rehabilitation of the two existing incinerators. RM1b Major rehabilitation of one incinerator; no rehabilitation of the second unit. RM2a Major rehabilitation of one incinerator with lime stabilization for backup. RM2b One new incinerator with lime stabilization for backup. RM3 Lime stabilization with agricultural land application. RM4 Anaerobic digestion with agricultural land application. RM5 Anaerobic digestion with composting. RM6 Anaerobic digestion with drying and agricultural land application. RM7 Drying with agricultural land application.
The comparison among the alternatives will include the continued use of centrifuges to dewater either raw sludge (Alternatives RM1, RM2, RM3, and RM7) or stabilized biosolids (RM4, RM5, and RM6) with improved standby capacity and reliability. The plant currently has two centrifuges that were installed in the early 1990s as well as a belt filter press located in an adjacent room that was installed in 1983. The proposed project will include two new centrifuges and reuse of one of the existing centrifuges. The second existing centrifuge will be used for parts, and the existing belt filter press will be removed. Additionally, several “sludge minimization” systems and technologies are being promoted in the wastewater industry. These systems claim to significantly reduce the amount of secondary sludge (WAS) requiring disposal. For example, the Cannibal® system utilizes a controlled sidestream
City of Dubuque, Iowa Section 5–Evaluation of Existing Facilities Dubuque Water Pollution Control Plant Facilities Plan and Screening of Alternatives
Prepared by STRAND ASSOCIATES, INC.® 5-19 RAW:ebt\S:\@SAI\151--200\154\002\Wrd\Report\S5.doc\052708
bioreactor and other equipment to significantly reduce the amount of WAS generated. However, the Cannibal® system is typically used at conventional air activated sludge plants that employ longer sludge ages in the 10 to 15 day (or longer) range. For that reason, the Cannibal® system is not evaluated in this report. Another method of sludge minimization is ozonation of the return activated sludge, which has been demonstrated at one plant in Italy to reduce WAS generation by as much as 80 percent (no effect on primary sludge). A 2004 Water Environment Research Foundation (WERF) report on sludge minimization technologies indicated that although the ozone system technology could successfully reduce secondary sludge generation by as much as 80 percent, these systems were generally not cost-effective and resulted in higher overall operating costs as well as high initial capital costs. More recently, a company is promoting an ozone system for sludge minimization that is claimed to be significantly more cost-effective. The status of sludge minimization technologies and application in the United States for systems similar to the Dubuque WPCP is not established. While such systems may have merit, for the purposes of this facilities planning report, more proven systems provide significantly more confidence that the selected approach will be viable for the long-term operation of the plant. However, WAS minimization technologies will be considered in Section 6 as an add-on technology to the selected approach. Regardless of which residuals management alternative is selected, minimizing WAS generation could have a beneficial effect and could reduce costs. J. Sampling The influent (and possibly effluent) samplers are suspected of collecting unrepresentative samples of the raw wastewater solids and BOD concentrations as noted in Section 4. The system includes the use of two small centrifugal pumps that pump wastewater from each influent force main to a dedicated automated sampler. Plant effluent is pumped across the site to the headworks building where it is sampled in a third automated sampler. This report includes new automated samplers for both of the influent force mains and the plant effluent. The location of the influent samplers will depend on the selection of a disinfection alternative. Should the gaseous chlorination system be replaced with an alternative system, the new influent samplers will be located in the space currently occupied by the chlorination equipment. If gaseous chlorination is continued, a new dedicated sampler building will be provided for the influent samplers. The effluent sampler will be located in a dedicated sampler building located near the effluent from the plant rather than sampling effluent pumped across the site. K. Emergency Power Dual power feeds are available to provide emergency power and are sufficient to run all necessary process equipment. Because of the concerns regarding system vulnerability, the City of Dubuque is also considering the installation of an independent emergency generator or multiple generators at the WPCP. Costs for this emergency power system will be reviewed in Section 6 and included in the overall recommended plan. However, this element may be eliminated or postponed.
City of Dubuque, Iowa Section 5–Evaluation of Existing Facilities Dubuque Water Pollution Control Plant Facilities Plan and Screening of Alternatives
Prepared by STRAND ASSOCIATES, INC.® 5-20 RAW:ebt\S:\@SAI\151--200\154\002\Wrd\Report\S5.doc\052708
L. Administration Building, Laboratory, and Locker Rooms The administration building houses staff offices, the laboratory, locker rooms, storage areas, meeting rooms, and related spaces. In general, only minor upgrades have been implemented for these facilities since the 1970s, and the existing space is in need of significant refurbishment and potential expansion. In particular, the laboratory facilities, which provide analytical services for the WPCP, the water utility, and several other customers, do not have adequate space or separation for water and wastewater analytical requirements. In addition, the needs of the industrial pretreatment monitoring program should be addressed with a remodeling and expansion of the laboratory facilities. The recommendations and opinion of costs include allowances to refurbish the existing spaces, including improving energy efficiency, and an expansion of the laboratory facilities. A detailed space needs study is needed and will be provided during the design phase of the project. M. Vehicle Storage and Maintenance Building Vehicular storage and maintenance facilities are limited at the site, and several large pieces of equipment are typically stored outside or in buildings not designed for vehicular storage. A new vehicular storage and maintenance garage is included in the project budget. A detailed evaluation of space needs will be included during the design phase of the project. N. Sewer Cleaning Debris Pad Currently, sewer cleaning crews use the WPCP site to store sewer cleaning/jetting debris. To improve dewatering and handling of such material, a drained concrete pad is included in the project budget. The location of this pad is dependent on the sludge management alternative selection. O. Odor Control The City is sensitive to potential odors generated at the WPCP. In the 1970s and 1980s, the WPCP was the source of significant odors associated with the Zimpro sludge conditioning system. In the 1990s, Zimpro was decommissioned and odors are currently not a major issue at the site. The main source of odors appears to be the primary clarifiers and preliminary treatment building, although odor complaints are rare. The new facilities will be designed to add odor control equipment in the future if such facilities are required. However, odors are not anticipated to be significantly different from the current facilities. P. Flood Protection A WWTP has been operating on the existing site since the 1960s. The current treatment facility, as constructed, satisfies code requirements for flood protection. All existing units are above the 100-year flood elevation for the Mississippi River of 611.30 feet above mean sea level. All current facilities on the site are protected to a minimum elevation of approximately 625 feet.

SECTION 6 WASTEWATER TREATMENT ALTERNATIVES EVALUATIONS

Fon
City of Dubuque, Iowa Dubuque Water Pollution Control Plant Facilities Plan Section 6–Wastewater Treatment Alternatives Evaluations
Prepared by STRAND ASSOCIATES, INC.® 6-1 RAW:ebt\S:\@SAI\151--200\154\002\Wrd\Report\S6.doc\052708
This Section of the report presents the analyses of alternatives identified in Section 5 as well as the other recommended project elements discussed in Section 5. 6.01 INTRODUCTION The design flows and loadings that provide the basis for the alternative analysis presented in this Section were developed in Section 4. Section 5 described the deficiencies of the existing WPCP to meet the future design conditions and anticipated NPDES permit limits and identified treatment alternatives recommended for evaluation. This section evaluates the treatment alternatives identified in Section 5 on the bases of capital costs, annual O&M costs, 20-year present worth costs, nonmonetary issues, and environmental issues. These alternative technology evaluations include the following: 1. Influent Screening 2. Biological Treatment 3. Effluent Disinfection 4. Residuals Management In addition to these alternative analyses, this Section also reviews other recommended improvements at the Dubuque WPCP. These project elements are developed and described based on the technology selections of the four major alternative analyses presented above. These additional project elements include: 1. Grit Removal 2. Primary Treatment 3. Final Clarification 4. Effluent DO and pH Control 5. Peak Flow Management 6. Sampling 7. Emergency Backup Power and Electrical Service 8. Administration Building, Laboratory, and Locker Rooms
9. Vehicle Storage and Maintenance Building 10. Sewer Cleaning Debris Pad 11. Odor Control 12. Other Equipment Replacement 13. Miscellaneous Piping, Valves, and Mechanical Components
The process of developing cost opinions and comparing alternatives on a present worth basis is presented in Appendix C. 6.02 INFLUENT SCREENING ALTERNATIVES ANALYSIS The existing 3/4-inch climber screens have provided relatively low maintenance operation for nearly 15 years. At the time these were installed, this type of screen was the state-of-the-art for influent screening. However, within the last 10 years, the trend for influent screening has been to install finer screens for removal of finer solids, as well as screenings washers. Washers are used to remove
Fon
City of Dubuque, Iowa Dubuque Water Pollution Control Plant Facilities Plan Section 6–Wastewater Treatment Alternatives Evaluations
Prepared by STRAND ASSOCIATES, INC.® 6-2 RAW:ebt\S:\@SAI\151--200\154\002\Wrd\Report\S6.doc\052708
organic material from the screenings for further treatment, which reduces odors in the screening area and results in a product that is more amenable to landfill disposal. Screen openings within the range of 1/4-inch to 1/8-inch and even finer have become common in Europe and the United States. The major advantages of using fine screens compared to coarser screens is reduced plugging in downstream piping and pumps, reduced floating material in downstream tanks, and reduced plastics and other identifiable solids in the sludge or biosolids, which is especially important if the solids are to be land applied or otherwise beneficially reused. For the Dubuque WPCP, two fine screening alternatives were evaluated to replace the existing coarse screening equipment. A. Description of Alternatives Alternative S1 includes installing a finer bar screen and rake on the existing frames. The existing screen frames, controls, and other appurtenances would remain. Based on information from the screen manufacturer, a screening opening of 3/8-inch appears to be the narrowest retrofit opening available and was assumed for this alternative. A new screenings washer/compactor is included for each screen. Alternative S2 includes replacing both of the existing screens with a different style fine screen. This alternative includes costs for two fine screens with 1/4-inch bar spacing, a screw conveyor, a screenings washer, and related equipment and controls. Finer screens should be considered during final design but may result in head losses through the screens that are too great for the existing influent channels. There are a number of screen types that could be used in the existing channels at the Dubuque WPCP, including step screens, basket screens, perforated plate screens, and fine bar screens. Each of these has advantages and disadvantages and should be carefully evaluated in detail during final design. For the purpose of this report, we have included opinions of capital costs for both 1/4-inch step screens (Alternative S2a) and perforated plate screens (Alternative S2b). B. Monetary Comparisons Table 6.02-1 summarizes our opinion of capital costs for the screening alternatives. Annual operation and maintenance (O&M) costs for the alternatives are expected to differ marginally in that the finer screens will remove more material and result in higher landfilling costs for screenings disposal. However, because the finer screens included in Alternatives 2a and 2b remove more material, these screens have the potential to decrease ongoing maintenance costs related to plugging and abrasion of downstream equipment, processes, and piping. For this reason, O&M costs were not included in this monetary evaluation. In addition, future equipment replacement and salvage costs of the equipment were assumed to be zero since this equipment is expected to have a life of approximately 20 years. Alternative S1 has a much lower projected capital cost and present worth cost since only the screening bars, rakes, and screenings washers are being replaced (Table 6.02-1). Alternative S2a and Alternative S2b include completely new systems and, therefore, higher initial capital costs.
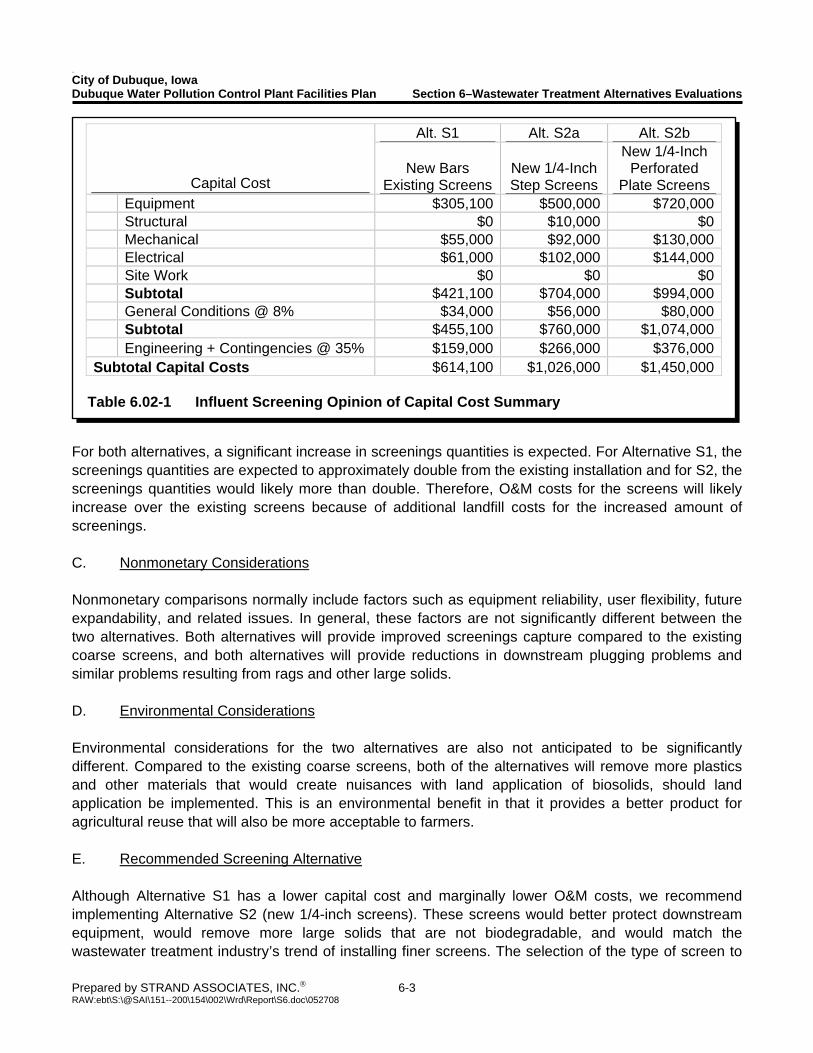
Fon
City of Dubuque, Iowa Dubuque Water Pollution Control Plant Facilities Plan Section 6–Wastewater Treatment Alternatives Evaluations
Prepared by STRAND ASSOCIATES, INC.® 6-3 RAW:ebt\S:\@SAI\151--200\154\002\Wrd\Report\S6.doc\052708
For both alternatives, a significant increase in screenings quantities is expected. For Alternative S1, the screenings quantities are expected to approximately double from the existing installation and for S2, the screenings quantities would likely more than double. Therefore, O&M costs for the screens will likely increase over the existing screens because of additional landfill costs for the increased amount of screenings. C. Nonmonetary Considerations Nonmonetary comparisons normally include factors such as equipment reliability, user flexibility, future expandability, and related issues. In general, these factors are not significantly different between the two alternatives. Both alternatives will provide improved screenings capture compared to the existing coarse screens, and both alternatives will provide reductions in downstream plugging problems and similar problems resulting from rags and other large solids. D. Environmental Considerations Environmental considerations for the two alternatives are also not anticipated to be significantly different. Compared to the existing coarse screens, both of the alternatives will remove more plastics and other materials that would create nuisances with land application of biosolids, should land application be implemented. This is an environmental benefit in that it provides a better product for agricultural reuse that will also be more acceptable to farmers. E. Recommended Screening Alternative Although Alternative S1 has a lower capital cost and marginally lower O&M costs, we recommend implementing Alternative S2 (new 1/4-inch screens). These screens would better protect downstream equipment, would remove more large solids that are not biodegradable, and would match the wastewater treatment industry’s trend of installing finer screens. The selection of the type of screen to
Alt. S1 Alt. S2a Alt. S2b
Capital Cost New Bars
Existing ScreensNew 1/4-Inch Step Screens
New 1/4-Inch Perforated
Plate Screens Equipment $305,100 $500,000 $720,000 Structural $0 $10,000 $0 Mechanical $55,000 $92,000 $130,000 Electrical $61,000 $102,000 $144,000 Site Work $0 $0 $0 Subtotal $421,100 $704,000 $994,000 General Conditions @ 8% $34,000 $56,000 $80,000 Subtotal $455,100 $760,000 $1,074,000 Engineering + Contingencies @ 35% $159,000 $266,000 $376,000 Subtotal Capital Costs $614,100 $1,026,000 $1,450,000
Table 6.02-1 Influent Screening Opinion of Capital Cost Summary
Fon
City of Dubuque, Iowa Dubuque Water Pollution Control Plant Facilities Plan Section 6–Wastewater Treatment Alternatives Evaluations
Prepared by STRAND ASSOCIATES, INC.® 6-4 RAW:ebt\S:\@SAI\151--200\154\002\Wrd\Report\S6.doc\052708
install should be made based on site visits to similar installations to observe the screens and talk to the operators of the equipment. For the purpose of developing a project budget, we have assumed that perforated plate fine screens will be included in the project. In addition, during final design a detailed hydraulic study should be developed for the screening area to determine if even finer screens (1/8-inch) could be installed. 6.03 BIOLOGICAL TREATMENT ALTERNATIVES ANALYSIS The Dubuque WPCP has employed high-rate HPO activated sludge since the mid 1970s. Most of the equipment still in use is original, and a significant upgrade is required to continue the use of the existing facilities. The section presents three alternatives for biological treatment at the Dubuque WPCP. A. Description of Alternatives Three biological treatment alternatives will be reviewed in this analysis. These include:
B1 HPO activated sludge; new mixers and controls; hauled liquid O2 (existing system). B2 HPO activated sludge; new mixers and controls; on-site O2 generation. B3 Air activated sludge; expand tankage; new blowers and diffusers. B4 MBBR activated sludge; expand tankage; new blowers and diffusers.
Each of the alternatives assumes continued use of the existing primary clarifiers to provide approximately 25 percent BOD5 removal upstream of the biological treatment facilities. In addition, the existing final clarifiers, RAS pumps, and WAS pumps will be reused. Future nutrient removal requirements are considered in the nonmonetary considerations portion of this discussion. Alternative B1–Upgrading Existing HPO System. This alternative continues the use of HPO activated sludge with oxygen hauled to the plant by trucks. No additional aeration tank volume is required for this alternative, but all equipment would be replaced and/or upgraded to provide improved reliability and energy efficiency. The following elements are included:
1. Conduct concrete testing on the aeration basin structure and concrete deck to determine condition; repair as require.
2. Seal concrete deck to minimize oxygen loss. 3. Replace the 27 mixers (9 per train) with new surface mixers. The new mixers are
estimated to have a connected power of approximately 300 hp and an average operating power of about 260 hp.
4. Replace vent pressure and volatile organics monitoring and control equipment. 5. Implement DO monitoring for improved control.
Fon
City of Dubuque, Iowa Dubuque Water Pollution Control Plant Facilities Plan Section 6–Wastewater Treatment Alternatives Evaluations
Prepared by STRAND ASSOCIATES, INC.® 6-5 RAW:ebt\S:\@SAI\151--200\154\002\Wrd\Report\S6.doc\052708
6. Continue purchasing liquid oxygen and hauling oxygen to the plant. The O2 storage
facility is leased from the oxygen supplier, and upgrades required for this alternative will be implemented by the supplier.
Alternative B2–Upgrading Existing HPO System and On-Site O2 Generation. This alternative is similar to Alternative B1 except that the plant would generate oxygen on-site using pressure swing adsorption (PSA) or vacuum-pressure swing adsorption (VPSA) equipment (collectively termed V/PSA). The following elements are included in this alternative:
1. Conduct concrete testing on the aeration basin structure and concrete deck to determine condition; repair as require.
2. Seal concrete deck to minimize oxygen loss. 3. Replace the 27 mixers (9 per train) with new surface mixers. 4. Replace vent pressure and volatile organics monitoring and control equipment. 5. Implement DO monitoring for improved control. 6. Install a new V/PSA in the existing space previously occupied by the cryogenic oxygen
generation equipment. One unit would be provided to meet maximum month oxygen demands of 15 to 18 tons/day and would have a turn-down capacity to allow efficient oxygen generation at the near future typical demand of approximately 8 to 9 tons O2/day. The approximate average power for this equipment is 200 to 250 hp at future design conditions.
7. The V/PSA may be owned by the City (Alternative B2a) or leased from the supplier
(Alternative B2b). 8. The existing backup liquid oxygen system would continue to be leased.
Alternative B3–Diffused Air Activated Sludge. This alternative presents a significant change to the existing HPO activated sludge system and includes conversion to more conventional air activated sludge to provide biological treatment. Average design BOD5 loading rates of approximately 30 lbs/1,000 ft3/day were used to develop the required additional aeration basin volumes for this alternative. The following modifications are required:
1. Construction of approximately 6.9-million gallons of aeration basin volume and demolition of the existing shallow HPO basins. The new basins would have a minimum side water depth of 20 feet because of limited site availability whereas the existing basins only have a side water depth of 12 feet. The construction of the new tanks and demolition of the existing tanks will need to be phased to provide continuous biological treatment.
Fon
City of Dubuque, Iowa Dubuque Water Pollution Control Plant Facilities Plan Section 6–Wastewater Treatment Alternatives Evaluations
Prepared by STRAND ASSOCIATES, INC.® 6-6 RAW:ebt\S:\@SAI\151--200\154\002\Wrd\Report\S6.doc\052708
2. Installation of fine membrane diffusers and associated piping and controls within the new
aeration basins. 3. Installation of five new centrifugal aeration blowers in the existing HPO building space to
provide an average design air flow rate of approximately 10,000 scfm and a maximum day air flow rate of about 24,000 scfm. For preliminary design purposes, we have assumed 5 or 6 new blowers with a total connected power of approximately 2,000 hp. The average design operating power is approximately 430 hp.
Alternative B4–MMBR Activated Sludge. This alternative is a modified version of Alternative B3 and also represents a significant change from the existing activated sludge system. hange to the existing HPO activated sludge system and includes conversion to more conventional air activated sludge to provide biological treatment. Average design BOD5 loading rates of approximately 30 lbs/1,000 ft3/day were used to develop the required additional aeration basin volumes for this alternative. The following modifications are required:
1. Construction of approximately 1.3-million gallons of aerated MMBR basin volume upstream of the existing HPO basins. Medium bubble aeration diffusers would be used to transfer oxygen into the wastewater. Plastic media would be included in these basins to develop a population of attached-growth bacteria to increase solids retention time. The new basins would essentially be used as a roughing stage to reduce the loadings to the existing basins.
2. Installation of fine membrane diffusers and associated piping and controls within the
existing aeration basins. 3. Installation of new centrifugal aeration blowers in the existing HPO building similar to
Alternative B3. B. Monetary Comparisons Table 6.03-1 summarizes the present worth analysis for each of the alternatives. A detailed summary of the total present worth of each alternative is included in Appendix D. Based on this analysis, Alternative B1–HPO with Liquid Oxygen has the lowest capital cost opinion at approximately $4.5 million, followed by Alternative B2b–HPO with Leased V/PSA at $6.5 million. Alternative B2a has an opinion of capital cost of approximately $8.4 million, and Alternative B3–Air Activated Sludge has the highest projected capital cost at nearly $15 million.

Fon
City of Dubuque, Iowa Dubuque Water Pollution Control Plant Facilities Plan Section 6–Wastewater Treatment Alternatives Evaluations
Prepared by STRAND ASSOCIATES, INC.® 6-7 RAW:ebt\S:\@SAI\151--200\154\002\Wrd\Report\S6.doc\052708
However, based on annual O&M cost opinions, the order is reversed in that Alternative B3 has the lowest projected annual O&M cost whereas Alternative B1 has the highest. This indicates that to maintain the existing facilities will result in the lowest up-front costs and highest annual O&M costs of the four alternatives. The 20-year present worth cost opinions of Alternatives B1, B2a, and B2b are all within approximately 5 percent of each other, which is considered equal for the purposes of this evaluation. Alternative B3–Air Activated Sludge has a projected present worth cost that is approximately 32 percent greater than the low-present-worth-cost alternative (B2a). C. Nonmonetary Considerations All systems provide reliable treatment for BOD and TSS. Should future effluent nutrient limits be implemented in the NPDES permit, the air activated sludge process is more adaptable to biological nitrogen and phosphorus removal processes. One main advantage that HPO activated sludge has over air activated sludge for this application is that it requires considerably less space on the site. The site restrictions are significant, as the entire plant is only about 20 acres, which is very small for this size facility. Continuing with HPO activated sludge, therefore, provides better flexibility with respect to site constraints over air activated sludge. More specifically, Alternative B1–HPO with Liquid Oxygen provides the additional advantage of limiting the investment in the existing infrastructure, which could be important should very strict effluent nutrient limits be imposed in the future at the plant.
Alt. B1 Alt. B2a Alt. B2b Alt. B3 Alt. B4
HPO with Trucked-in
Liquid Oxygen
HPO with City-Owned
V/PSA
HPO with Leased V/PSA
Air Activated Sludge
MBBR Air Activated Sludge
Opinion of Capital Costs $4,527,000 $8,388,000 $6,498,000 $14,567,000 $13,963,000 Annual O&M Costs Labor $83,000 $104,000 $42,000 $83,000 $83,000 Maintenance $40,000 $78,000 $40,000 $43,000 $57,000 Liquid O2/Lease Fee $501,000 $19,000 $325,200 $0 $0 Power $136,000 $251,000 $251,000 $225,000 $225,000
Subtotal Opinion of Annual O&M1 $760,000 $452,000 $658,000 $351,000 $365,000 Present Worth of O&M $9,572,000 $5,693,000 $8,288,000 $4,421,000 $4,597,000 Present Worth of Future Equipment $196,000 $196,000 $196,000 $481,000 $2,122,000 Present Worth of Salvage ($241,000) ($268,000) ($268,000) ($1,139,000) ($1,422,000)
TOTAL OPINION OF PRESENT WORTH1 $14,054,000 $14,009,000 $14,714,000 $18,330,000 $19,260,000 Notes: 1 Project life = 20 years; discount rate = 4.875%.
Table 6.03-1 Biological Treatment Opinion of Present Worth Summary
Fon
City of Dubuque, Iowa Dubuque Water Pollution Control Plant Facilities Plan Section 6–Wastewater Treatment Alternatives Evaluations
Prepared by STRAND ASSOCIATES, INC.® 6-8 RAW:ebt\S:\@SAI\151--200\154\002\Wrd\Report\S6.doc\052708
From an overall energy balance among the alternatives, there is not a clear-cut best alternative. All of the systems evaluated are among the most efficient in terms of power required per unit of BOD removal provided because of the high oxygen transfer capacity of these systems. Therefore, for the purpose of “green” comparisons, all the alternatives are approximately equal. D. Environmental Considerations (Future NPDES Permit Issues) The costs for the air activated sludge treatment system are significantly higher on the bases of capital and present worth costs. However, air activated sludge does offer the following advantage over the HPO alternatives–air activated sludge provides improved capacity and flexibility to meet future ammonia and/or total nitrogen limits. In addition, biological P removal is likely simpler to implement with air activated sludge compared to HPO systems. While the air activated sludge system has certain advantages over HPO systems with respect to nutrient removal, the HPO system can be modified to some degree to improve the ability to implement nutrient removal as well as to lower operating costs. For example, since the HPO basins are relatively lightly loaded compared to typical design of HPO systems, the last one or two stages (nine stages per train) could have the concrete covers removed and operate as air activated sludge basins. This provides the following benefits:
1. Lowers liquid oxygen requirements (or generated oxygen requirements), since the oxygen required for those stages will be supplied from the air.
2. Releases carbon dioxide and increases pH, which would allow the plant to more easily
meet the anticipated future pH limit. 3. Results in lower DO levels for those stages, which may allow an internal recirculation
loop to be integrated into the HPO system to affect some level of biological nitrogen and/or phosphorus removal.
E. Recommended Biological Treatment Alternative Based on these preceding evaluations, we recommend that Alternative B1–HPO Activated Sludge with Hauled Liquid Oxygen be implemented. This alternative provides the lowest capital cost alternative and lowest 20-year present worth costs as well. Because of the lower capital costs, the investment in the existing infrastructure is lower than the other alternatives, which provides more flexibility if future nutrient limits require major changes at the plant. We also recommend modifying the existing HPO system to enable operation of the last one or two stages under ambient air conditions. This should further reduce oxygen use and associated trucking costs and fuel usage and will also raise the effluent pH to some degree.
Fon
City of Dubuque, Iowa Dubuque Water Pollution Control Plant Facilities Plan Section 6–Wastewater Treatment Alternatives Evaluations
Prepared by STRAND ASSOCIATES, INC.® 6-9 RAW:ebt\S:\@SAI\151--200\154\002\Wrd\Report\S6.doc\052708
6.04 EFFLUENT DISINFECTION ALTERNATIVE ANALYSIS Disinfection is currently required at the Dubuque WPCP from April 15 through October 15 to reduce the presence of fecal coliforms in the treated effluent. Current regulations mandate a fecal coliform plate count of less than 200 CFUs per 100 mL. More stringent regulations are likely to be included in the next NPDES permit and will require disinfection to achieve a maximum daily plate count of less than 235 E. coli per 100 mL. Disinfection will also be required from March 15 through November 15. The disinfection alternatives will each be sized to meet the future E. coli limits at a peak flow of 30 mgd. While the projected peak hourly flow to the WPCP is 40.9 mgd, because of the implementation of flow equalization using the existing trickling filter structures, the anticipated peak flow at the disinfection facilities is only about 25 to 30 mgd. A. Description of Alternatives The following disinfection alternatives are considered for the Dubuque WPCP:
D1 New chlorine gas system equipment D2 Liquid sodium hypochlorite D3 On-site hypochlorite generation D4 Ozone D5 Ultraviolet disinfection
Alternative D1–Chlorination with Chlorine Gas is essentially an equipment replacement project at the Dubuque WPCP. The plant currently disinfects effluent wastewater with chlorine gas followed by dechlorination with liquid magnesium bisulfite. Both of these unit processes would continue. All the gaseous chlorine control equipment would be replaced with new equipment. In addition, a new caustic scrubber would be installed to evacuate the chlorine gas storage area and the control room in the event of a chlorine gas leak. The two existing chlorine contact tanks, each having a volume of 24,150 ft3, will provide adequate chlorine contact time throughout the design life of the facility. As noted in Section 5, the contact time at the peak hourly flow of 40.9 mgd is marginally less than 15 minutes. However, with the conversion of the trickling filter structures to equalization tanks, the peak flow through the disinfection system will be significantly less than 40.9 mgd, and the existing contact tanks will meet the Iowa Design Standards for chlorine contact time. Liquid magnesium bisulfite will continue to be added in the mixing chamber downstream of the chlorine contact tank for dechlorination to meet the maximum chlorine residual effluent limit of 202 μg/L. The existing dechlorination system was added approximately 12 years ago and does not require replacement at this time. Alternative D2–Liquid Sodium Hypochlorite includes the replacement of the gaseous chlorine system with a liquid sodium hypochlorite system. Liquid hypochlorite solution would be delivered to the WPCP in tanker trucks and stored in bulk containers, similar to the existing dechlorination system. This analysis includes costs for new liquid hypochlorite equipment including chemical storage tanks, metering pumps and accessories, controls and instrumentation. The liquid storage tanks would either be housed in the existing ton cylinder storage room at the headworks or potentially in the same building where the dechlorination storage tanks and metering pumps are installed. The required liquid storage
Fon
City of Dubuque, Iowa Dubuque Water Pollution Control Plant Facilities Plan Section 6–Wastewater Treatment Alternatives Evaluations
Prepared by STRAND ASSOCIATES, INC.® 6-10 RAW:ebt\S:\@SAI\151--200\154\002\Wrd\Report\S6.doc\052708
volume is approximately 15,000 gallons to provide approximately 30 days of storage under the design average flows. This would include two 7,500-gallon FRP tanks and two or three metering pumps to deliver hypochlorite solution to the mixing chamber upstream of the chlorine contact tank. The existing dechlorination system would be maintained as in Alternative D1.
Alternative D3–On-site Hypochlorite Generation is identical to Alternative D2 except that liquid sodium hypochlorite solution would be generated on-site using electrolysis of a brine solution. On-site hypochlorite generation systems are more commonly used in water treatment, but they are gaining acceptance at wastewater facilities. Reportedly, the same level of treatment may be achieved with on-site or purchased hypochlorite solution. The primary advantage of this system is that it eliminates the transportation and handling of hypochlorite solution, although salt will still need to be trucked to the site. Also, since the hypochlorite is generated as-needed, degradation of the disinfecting power of the solution during storage is minimized. We have assumed that the equipment and storage tanks would be housed in the same building as the dechlorination facilities. As in Alternatives D1 and D2, the existing bisulfite dechlorination system would be reused. Alternative D4–Ozone Disinfection involves the removal of the existing chlorination and dechlorination systems and installation of an ozone generator, control system, off-gas destructor, and instrumentation. The feed gas to the ozone generator would be oxygen. The contact time for ozone would be similar to chlorine systems. Advantages of using ozone are essentially the same as other nonchlorine systems;, however, off-gases may be toxic and must be handled/monitored accordingly. The analysis includes costs for a complete ozone system installed in the existing dechlorination room in the HPO building. For the purposes of this evaluation, we have assumed that biological treatment will continue to be by HPO activated sludge and the source of oxygen will be as recommended in Section 6.03. Alternative D5–Ultraviolet Disinfection represents the state-of-the-art in wastewater disinfection systems. UV disinfection has gained popularity as a disinfection technology during the last two decades because it produces consistent results without the disadvantages of chlorine disinfection. These disadvantages include the need for dechlorination, potential concerns related to chlorinated compounds in the plant effluent, and safety concerns with handling chlorination and dechlorination chemicals. Capital costs related to implementation of UV disinfection at the Dubuque WPCP include construction costs for modification to the chlorine contact tank to provide a disinfection channel and equipment costs; including lamps, ballasts, and controls. The existing chlorination and dechlorination equipment would be removed from the site. Preliminary testing indicates the Dubuque WPCP effluent has a UV transmittance in the range of 60 to 70 percent, with an average of approximately 65 percent. This is a fairly typical range for application of UV disinfection technology. B. Monetary Comparisons Table 6.04-1 summarizes the present worth analysis for the five disinfection alternatives, and Appendix E provides additional details of the monetary comparisons. Based on this analysis, Alternative D2–Liquid Hypochlorite has the lowest projected capital cost ($617,000) and present worth cost ($1,329,000) of the five alternatives. Gaseous chlorination (Alternative D1) is approximately 20 percent
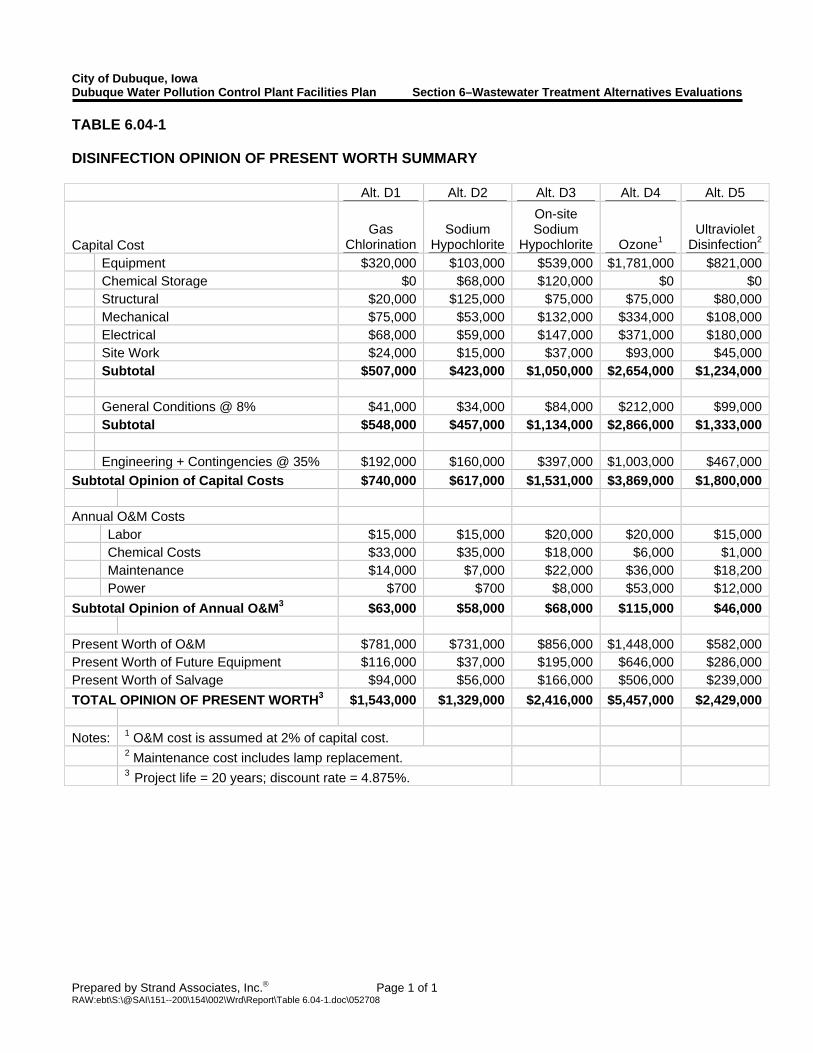
City of Dubuque, Iowa Dubuque Water Pollution Control Plant Facilities Plan Section 6–Wastewater Treatment Alternatives Evaluations
Prepared by Strand Associates, Inc.® Page 1 of 1 RAW:ebt\S:\@SAI\151--200\154\002\Wrd\Report\Table 6.04-1.doc\052708
TABLE 6.04-1 DISINFECTION OPINION OF PRESENT WORTH SUMMARY Alt. D1 Alt. D2 Alt. D3 Alt. D4 Alt. D5
Capital Cost Gas
ChlorinationSodium
Hypochlorite
On-site Sodium
Hypochlorite Ozone1 Ultraviolet
Disinfection2
Equipment $320,000 $103,000 $539,000 $1,781,000 $821,000 Chemical Storage $0 $68,000 $120,000 $0 $0 Structural $20,000 $125,000 $75,000 $75,000 $80,000 Mechanical $75,000 $53,000 $132,000 $334,000 $108,000 Electrical $68,000 $59,000 $147,000 $371,000 $180,000 Site Work $24,000 $15,000 $37,000 $93,000 $45,000 Subtotal $507,000 $423,000 $1,050,000 $2,654,000 $1,234,000 General Conditions @ 8% $41,000 $34,000 $84,000 $212,000 $99,000 Subtotal $548,000 $457,000 $1,134,000 $2,866,000 $1,333,000 Engineering + Contingencies @ 35% $192,000 $160,000 $397,000 $1,003,000 $467,000 Subtotal Opinion of Capital Costs $740,000 $617,000 $1,531,000 $3,869,000 $1,800,000 Annual O&M Costs Labor $15,000 $15,000 $20,000 $20,000 $15,000 Chemical Costs $33,000 $35,000 $18,000 $6,000 $1,000 Maintenance $14,000 $7,000 $22,000 $36,000 $18,200 Power $700 $700 $8,000 $53,000 $12,000 Subtotal Opinion of Annual O&M3 $63,000 $58,000 $68,000 $115,000 $46,000 Present Worth of O&M $781,000 $731,000 $856,000 $1,448,000 $582,000 Present Worth of Future Equipment $116,000 $37,000 $195,000 $646,000 $286,000 Present Worth of Salvage $94,000 $56,000 $166,000 $506,000 $239,000 TOTAL OPINION OF PRESENT WORTH3 $1,543,000 $1,329,000 $2,416,000 $5,457,000 $2,429,000 Notes: 1 O&M cost is assumed at 2% of capital cost. 2 Maintenance cost includes lamp replacement. 3 Project life = 20 years; discount rate = 4.875%.
Fon
City of Dubuque, Iowa Dubuque Water Pollution Control Plant Facilities Plan Section 6–Wastewater Treatment Alternatives Evaluations
Prepared by STRAND ASSOCIATES, INC.® 6-11 RAW:ebt\S:\@SAI\151--200\154\002\Wrd\Report\S6.doc\052708
higher on a capital cost basis and 16 percent higher on a total present worth basis. Alternatives D3 (on-site generation) and D5 (UV) have considerably higher capital cost and total present worth cost projections. The ozone disinfection alternative has a projected capital cost and present worth cost that is more than double the next lowest cost alternative. Based solely on monetary costs, continued chlorination (either gaseous or liquid) followed by liquid dechlorination represent that lowest cost alternative. These two alternatives (D1 and D2) would result in the lowest impacts on user rates. C. Nonmonetary Considerations and Environmental Considerations Nonmonetary issues must also be considered when evaluating disinfection alternatives. The vast majority of wastewater treatment plants use either chlorination/dechlorination or UV disinfection systems. On-site hypochlorite generation is becoming more common but its use is still significantly less than either chlorination or UV disinfection. Ozone is not used regularly in the wastewater industry, though it has seen more application in the water treatment industry. The City of Dubuque has a strong desire to reduce chemical usage at the plant. Chlorine, even at low concentrations, is toxic to fish and other biota, and potentially harmful chlorinated hydrocarbons may be formed by the oxidation of organic compounds by chlorine in the disinfection process. UV disinfection has the following additional advantages:
1. Lowest opinion of annual O&M costs of the five alternatives. 2. Eliminates safety concerns with respect to the storage and handling of chemicals such
as chlorine gas, liquid hypochlorite, liquid bisulfite, and ozone as UV disinfection is the only alternative to eliminate the use of chemicals.
3. Eliminates concerns of on-site and off-site exposure to chlorine gas. 4. Eliminates concerns for the uncertainty of chlorine usage for wastewater disinfection in
the future. 5. Eliminates concerns regarding the potential toxicity of chlorine compounds on aquatic
life and the need for chlorine residual monitoring. 6. Eliminates the concerns of potential off-gassing from ozonation process. 7. Provides more than 20 years of use in the wastewater treatment industry.
In addition to the benefits of UV disinfection provided above, UV disinfection may also be considered a “greener” technology from an energy perspective. Chlorine production is relatively energy intensive, and the overall energy requirements to produce chlorine and transport it to the site are greater than the energy use from a UV disinfection system. Therefore, based on energy use, implementing UV

Fon
City of Dubuque, Iowa Dubuque Water Pollution Control Plant Facilities Plan Section 6–Wastewater Treatment Alternatives Evaluations
Prepared by STRAND ASSOCIATES, INC.® 6-12 RAW:ebt\S:\@SAI\151--200\154\002\Wrd\Report\S6.doc\052708
disinfection better meets the City of Dubuque’s top priority of implementing sustainable programs and establishing itself as a “Green City.” D. Recommended Disinfection Alternative Based on the evaluations presented above, Alternative D5–UV Disinfection is recommended for implementation at the Dubuque WPCP. While the monetary costs to implement this technology are higher than maintaining the chemical systems needed for chlorination and dechlorination, UV disinfection has numerous nonmonetary and environmental benefits and better meets the goals of the City of Dubuque. 6.05 RESIDUALS MANAGEMENT ALTERNATIVE ANALYSIS The current residuals management system includes primary sludge storage, WAS storage, blended sludge storage, centrifuge dewatering, dewatered cake conveying and pumping, fluidized bed sludge incineration (two units, one with one recuperator), and ash ponds. In addition, scum and grease from the primary clarifiers is handled separately with the intent of directly injecting this material into the incinerators. The scum and grease handling system has been difficult to manage. The incineration facilities are nearly 40 years old and have undergone some upgrades. The dewatering facilities are approximately 15 years old. The existing residuals management system requires considerable maintenance and repairs to keep it operational at this time and retaining incineration will require major capital investment. Therefore, it is appropriate to consider other alternatives. A. Description of Alternatives The following residuals management alternatives are included in this evaluation and described below:
RM1a Major rehabilitation of both existing incinerators. RM1b Major rehabilitation of one incinerator; no rehabilitation of the second unit. RM2a Major rehabilitation of one incinerator with lime stabilization for backup. RM2b One new incinerator with lime stabilization for backup. RM3 Lime stabilization with agricultural land application. RM4 Anaerobic digestion with agricultural land application. RM5 Anaerobic digestion with composting. RM6 Anaerobic digestion with drying and agricultural land application. RM7 Drying with agricultural land application.
The evaluation of each of these management alternatives is based on continued primary treatment and secondary biological treatment using the HPO activated sludge system. The design sludge quantities for this alternative are 46,900 lbs/day (dry weight basis) at the future maximum month condition, which includes approximately 26,500 lbs/day of primary sludge, 20,400 lbs/day of WAS, and an assumed 10 percent recycle loading. Power usage, labor costs, chemical costs, and residuals disposal costs are considered in the analysis. Based on available data, the metals concentration in the residuals are low enough for land application as either Class I or Class II biosolids if appropriate stabilization is provided.
Fon
City of Dubuque, Iowa Dubuque Water Pollution Control Plant Facilities Plan Section 6–Wastewater Treatment Alternatives Evaluations
Prepared by STRAND ASSOCIATES, INC.® 6-13 RAW:ebt\S:\@SAI\151--200\154\002\Wrd\Report\S6.doc\052708
All alternatives include the use of centrifuges for dewatering either raw sludge or digested biosolids. With respect to the centrifuges, one of the two existing units will remain, and the other will be used for spare parts. Two new centrifuges will be installed to provide three operating centrifuges for improved redundancy and reliability. For the alternatives that include land application, we have assumed the removal of biosolids from the WPCP, storage requirements for biosolids, and land application of the biosolids on agricultural land will be provided by a third-party contractor. Two contractors were contacted and both indicated they would be willing to construct off-site storage and develop an extended-term land application program for the City of Dubuque. This method of biosolids disposal is desired in this case as the WPCP site does not have excess space to store biosolids or hauling equipment, and the City does not have a history with land application in the area. Alternative RM1a–Major rehabilitation of the two existing incinerators. This alternative includes major rehabilitation of the 40-year-old incinerators and replacement of all major incineration equipment and controls. A recent inspection of the incineration facilities indicated the need to significantly rehabilitate the equipment and structures if continued use of the fluid bed incinerators were to continue. Residuals management upstream of the fluid bed incinerators would also be modified. Dewatering of the raw blended sludge requires the primary sludge percentage to be near 58 to 60 percent for improved dewatering and efficient incinerator operation. Because of the highly soluble raw wastewater, however, the WAS production is too high to meet this requirement. Therefore, some form of WAS reduction is required for this alternative. WAS reduction could be implemented by any of the following methods:
1. Operating the HPO activated sludge systems at a longer sludge age to reduce the observed biological yield. This will require more oxygen for endogenous decay of the biological sludge. In addition, the plant has experienced filamentous problems when operating at longer sludge ages, so additional controls would be required to manage filamentous bulking events.
2. Constructing aerobic digestion facilities for WAS. The existing WAS holding tank only
provides a detention time of 4.5 days at the future design loadings. An additional detention time of about 15 days would require a tank volume of 1.6-million gallons and significant blower horsepower to provide adequate aeration. Siting such a tank at this site will be difficult.
3. Installing a WAS minimization system that uses ozone to lyse cells and reduce WAS by
as much as 80 percent. The additional oxygen required to oxidize the soluble BOD generated from cell rupture is met by the ozone reduction to oxygen. There are a few companies marketing this technology, though there are no known full-scale installations in the United States. This system would also utilize additional oxygen in the ozone generator.
Fon
City of Dubuque, Iowa Dubuque Water Pollution Control Plant Facilities Plan Section 6–Wastewater Treatment Alternatives Evaluations
Prepared by STRAND ASSOCIATES, INC.® 6-14 RAW:ebt\S:\@SAI\151--200\154\002\Wrd\Report\S6.doc\052708
The construction of aerobic digestion facilities is not deemed to be feasible without sacrificing much of the remaining space on the site. Installing an ozone sludge minimization system may be feasible, but it will require considerably more evaluation prior to making the decision to install such a system. Operating the activated sludge system at a longer sludge age is feasible, especially since the third train will be available rather than only two trains of aeration basins. This alternative is included for this evaluation. However, should one of the incinerator alternatives be selected, the potential to use the ozone WAS minimization technology may be considered further. This alternative includes the following elements directly related to the fluid bed incinerators:
1. Replacing refractory lining in incinerators and ductwork. 2. Repairing steel shells of both incinerators. 3. Replacing all controls. 4. Replacing all pumps and fans. 5. Retrofitting existing scrubbers with new scrubber internals. 6. Replacing internal tubes on existing recuperator (north incinerator) and install one new
recuperator (south incinerator). 7. Constructing a building addition (approximately 4,000 ft2) to house the new recuperator
for the south incinerator and provide improved constructability in the incinerator space. In addition, prior to incineration, the sludge management elements include the following:
1. Retrofitting the WAS holding tanks with new aeration diffusers and piping. 2. Replacing the existing WAS storage tank blowers with three new blowers in the
headworks building provided to replace the existing units. All of the existing equipment and piping is in very poor condition.
3. Providing primary sludge and WAS flow meters. 4. Providing a new, larger sludge blending tank and mixing equipment. 5. Providing three new centrifuge feed pumps. 6. Installing two new centrifuges; reuse one of the existing centrifuges with new back drive;
remove the existing belt filter press (BFP). 7. Replacing the dewatered cake belt conveyors with enclosed screw conveyors.
Fon
City of Dubuque, Iowa Dubuque Water Pollution Control Plant Facilities Plan Section 6–Wastewater Treatment Alternatives Evaluations
Prepared by STRAND ASSOCIATES, INC.® 6-15 RAW:ebt\S:\@SAI\151--200\154\002\Wrd\Report\S6.doc\052708
8. Refurbishing the high-solids hydraulic piston pump to convey dewatered cake to the
incinerators. 9. Installing one new high-solids hydraulic piston pump for redundancy. 10. Installing new grease/scum concentration equipment and modify scum management.
This alternative would provide improved overall redundancy over the existing incineration system. Currently, only the north incinerator has a recuperator (exhaust stack heat recovery), which significantly lowers energy usage and requires only a small amount of fuel to sustain combustion. The existing south incinerator, when used, requires considerably more fuel and is much more expensive to operate. Ash will continue to be pumped to the ash ponds for dewatering and temporary storage. Alternative RM1b–Major rehabilitation of one incinerator; no rehabilitation of the second unit. This alternative is similar to RM1a except that only the north incinerator would be rehabilitated. The south incinerator would continue to function as a standby and no upgrades would be made for this unit. It is understood that this alternative is not directly comparable to the other alternatives in terms of overall system reliability, since a 40-year-old incinerator would serve as the standby unit. Alternative RM2a–Major rehabilitation of one incinerator with backup lime stabilization. This alternative includes a major rehabilitation of the south incinerator and demolition of the other incinerator. A backup lime stabilization system would be installed to provide Class I biosolids for times when the incinerator is off-line. We have assumed that the lime system will be utilized for one month each year to allow maintenance of the incinerator. We have assumed that these biosolids would be contract hauled to agricultural sites or other third-party-provided off-site storage on an as-needed basis. A unit cost of $28/wet ton was assumed, which is significantly higher than comparable off-site storage and land application costs in the Dubuque area. The higher costs were used since the land application operations will be intermittent and could be at irregular intervals. This alternative includes the following elements related to the fluid bed incinerator and backup lime system:
1. Remove the existing north incinerator and associated equipment, materials, and structures.
2. Rehabilitate the south fluid bed incinerator, as well as the existing recuperator, scrubber,
and all required equipment and controls. 3. Install one new lime stabilization system. For the purposes of this evaluation, we have
based the system requirements on the Schwing-Bioset system, which utilizes lime and small amounts of acids to generate Class I biosolids. This system includes the required lime and acid storage and feed systems, contact reactor, high-solids hydraulic pump, odor control system, and required controls. This system is anticipated to be installed within the existing sludge processing building.
Fon
City of Dubuque, Iowa Dubuque Water Pollution Control Plant Facilities Plan Section 6–Wastewater Treatment Alternatives Evaluations
Prepared by STRAND ASSOCIATES, INC.® 6-16 RAW:ebt\S:\@SAI\151--200\154\002\Wrd\Report\S6.doc\052708
4. Install a small, covered storage pad to hold approximately one week of lime-stabilized
biosolids. Prior to incineration or lime stabilization, the sludge management elements are identical to that of Alternative RM1, except that the redundant high-solids piston pump is already included above. For 11 months of every year, the incinerators will destroy the volatile solids, and ash will be pumped to the ash ponds, resulting in very low final solids disposal costs. For one month of every year, the expected average biosolids production would be approximately 49,400 lbs/day (dry weight), which includes the raw sludge solids of about 30,000 lbs/day (average over 20-year period) and a lime dose of approximately 65 percent on a dry weight basis. This amounts to an average of approximately 67 wet tons/day of biosolids hauled to the remote site. Alternative RM2b–One new incinerator with backup lime stabilization. This alternative is similar to Alternative RM2a except that both existing fluid bed incinerators and all appurtenant equipment would be removed, and a new fluid bed incinerator with backup lime stabilization system would be installed. The other elements are essentially identical to Alternative RM2a. Alternative RM3–Lime stabilization with agricultural land application. Lime stabilization is a process that achieves pathogen reduction by exposing the bacteria in the biosolids to an elevated pH. Addition of lime to dewatered biosolids also causes a temperature increase. This process can be used to produce Class I or Class II biosolids, depending on the pH and temperature achieved and the detention time. One drawback to this stabilization method is the increase in the volume of solids generated from lime addition. For the purposes of this evaluation, the Schwing-Bioset system was used to develop project costs, with the assumption that Class I biosolids would be produced. This system would have redundant reactors and high-solids feed pumps and would be installed within the sludge processing building, similar to Alternative RM2. Significant odor control capabilities would be required to minimize the potential of ammonia odor from this high pH system. We have assumed that these biosolids would be contract hauled to agricultural sites or other third-party-provided off-site storage on an as-needed basis. A unit cost of $20/wet ton for contract biosolids hauling, storage, and disposal was assumed based on discussions with two local contractors. A lease fee for a third-party-owned storage facility would be included with an option to purchase the facility after a 5- or 10-year period. Upstream sludge management would be similar to Alternatives RM1 and RM2, except that WAS minimization would not be as critical and systems to reduce WAS are not included. Alternative RM4–Anaerobic digestion with agricultural land application. Anaerobic digestion has been used for decades to stabilize sludge prior to land application. Temperature phased anaerobic digestion (TPAD) is a high-rate digestion system that stabilizes biosolids in a two-step process where the sludge is first held for a minimum of five days under thermophilic conditions (131°F) before being held for a minimum of ten days under mesophilic conditions (95°F). TPAD designs allow for a higher volumetric loading rate than standard mesophilic digestion. Design volumetric loadings of over 200 lbs VS/1,000 ft3/day are possible with this process.
Fon
City of Dubuque, Iowa Dubuque Water Pollution Control Plant Facilities Plan Section 6–Wastewater Treatment Alternatives Evaluations
Prepared by STRAND ASSOCIATES, INC.® 6-17 RAW:ebt\S:\@SAI\151--200\154\002\Wrd\Report\S6.doc\052708
Implementation of anaerobic digestion would require the construction of four new anaerobic digesters and a central control building, likely adjacent to Julien Dubuque Drive on the west side of the site. Two of the digesters would typically operate as thermophilic digesters with fixed covers, and the other two would operate as mesophilic digesters with gas holding covers. Each digester would be approximately 70 feet in diameter and 30 feet tall. The digestion system would normally operate in the TPAD mode, with sludge being delivered from the sludge blending tank to the thermophilic digesters first and then to the mesophilic digesters. From there, stabilized biosolids would be pumped to the centrifuges for dewatering. A small structure would be constructed to temporarily store biosolids, and disposal would be by contract hauling to an off-site storage facility and ultimately to agricultural land application. A unit cost of $20/wet ton for biosolids contract biosolids hauling, storage, and disposal was assumed based on discussions with two local contractors. A lease fee for a third-party-owned storage facility would be included with an option to purchase the facility after a 5- or 10-year period. The anaerobic digestion process produces biogas, which contains about 60 to 65 percent methane and can be collected and burned to provide heat for boilers or fuel for electricity and heat cogeneration. The anaerobic digestion process requires heat to maintain temperatures in the digestion tanks, and this heat consumes a significant amount of the biogas produced in the process. Analysis of anticipated biogas production rates indicates the biogas produced in the process will exceed the digester heating requirements even under the coldest weather conditions at current and future design loadings. Biogas reuse would include one of the following options:
Option 1: Burn the biogas in a boiler to produce heat for the digestion process and for building heating needs. This option would utilize a portion of the biogas to generate heat, and the excess biogas would be flared. No supplemental natural gas would be required on a year-round basis to heat the digester or the new digester control building. During the warmer months of the year, a significant portion of the biogas would be flared. The current heating needs of the digesters and the new building are anticipated to be approximately 0.9 and 2.6 MBtu/hr during summer months and winter months, respectively, and the future design heating needs are projected to be approximately 1.4 and 3.1 MBtu/hr, respectively. By comparison, the anticipated heating value of the biogas produced is approximately 3.6 MBtu/hr under current loadings and 6.5 MBtu/hr at future design loadings. Therefore, if Option 1 is implemented, the amount of excess biogas will be adequate to consider additional energy recovery systems such as providing heat in other buildings. Option 2: Use the biogas to generate electricity and recover waste heat to provide some of the heating needs of the digestion process. Option 2 uses nearly all of the gas year-round to produce electricity. At the current average loadings, approximately 250 to 275 kW (335 to 370 hp) of electricity could be produced on a continuous basis. At future design loadings, approximately 400 kW (535 hp) could be generated. Waste heat recovery systems could recover approximately 1.2 MBtu/hr from the 250 kW system and 1.6 to 1.8 MBtu/hr from the 400 kW system. Compared to the heat demands for the digesters and building during much of the year, Option 2 would require the purchase of natural gas to supplement the heating needs of the facilities.
Fon
City of Dubuque, Iowa Dubuque Water Pollution Control Plant Facilities Plan Section 6–Wastewater Treatment Alternatives Evaluations
Prepared by STRAND ASSOCIATES, INC.® 6-18 RAW:ebt\S:\@SAI\151--200\154\002\Wrd\Report\S6.doc\052708
The decision of whether to include electrical generation will be made during final design. However, based on preliminary calculations, it appears that Option 1 has a lower present worth cost and will be included in the overall present worth analyses. This option also has the following benefits:
1. Biogas quality can significantly impact beneficial reuse opportunities and costs,
especially when used for electrical generation. Since the Dubuque WPCP does not currently produce biogas, the quality of the future biogas is unknown. Option 1 will allow the City to determine biogas quality and then design an appropriate gas conditioning system for beneficial reuse.
2. Electrical generation (Option 2) could be provided with engine generators or with
microturbines. The status of microturbines for electrical generation is still questionable. While several plants in the Midwest (and elsewhere) are using microturbines, the equipment maintenance costs and equipment life have been higher and shorter, respectively, than originally anticipated.
3. The performance of the anaerobic digestion system can be measured and the quantity
of biogas produced can then be more accurately assessed. This will allow the design of a future electrical generation system to better match the amount of biogas generated at the time, which will result in more efficient use of the renewable energy.
4. Option 1 is simpler to construct and operate. In addition, the initial construction cost for
Option 1 is anticipated to be approximately $1 to $2 million less than the cost of Option 2, depending on the level of gas treatment required.
5. Option 1 could potentially be implemented with sale of excess biogas to a nearby
industry. This potential has not been investigated in any detail at this time but is believed to have sufficient merit to be considered.
Upstream of anaerobic digestion, the modifications previously described would be made to the WAS storage tank and aeration equipment, as well as the blended sludge storage tank. In addition, WAS thickening equipment would be included in the existing sludge processing building, including two thickeners (centrifuges assumed) and thickened WAS pumps. WAS thickening was included for all the anaerobic digestion alternatives (Alternatives RM4, RM5, and RM6). Finally, for the anaerobic digestion alternatives, the centrifuges would dewater digested biosolids in lieu of raw sludge. Alternative RM5–Anaerobic digestion with composting. This alternative is identical to Alternative RM4 in terms of capital improvements and modifications needed at the WPCP. The only difference is that dewatered biosolids would be hauled to the yard trimmings composting facility at the Dubuque Metropolitan Area Solid Waste Agency (DMASWA) site west of Dubuque. This facility processes yard trimmings and some food scraps (pilot study) using unaerated windrow-type composting. The finished compost is sold for $3/yd3 to local businesses and residents. We have included a biosolids disposal cost for this alternative of $35/ton, which includes the tipping fee (current yard trimming tipping fee = $25.30/ton) and approximate transportation costs to the site. While this site is not currently regulated for biosolids, based on a site visit and discussions with Agency staff, there is land available and some
Fon
City of Dubuque, Iowa Dubuque Water Pollution Control Plant Facilities Plan Section 6–Wastewater Treatment Alternatives Evaluations
Prepared by STRAND ASSOCIATES, INC.® 6-19 RAW:ebt\S:\@SAI\151--200\154\002\Wrd\Report\S6.doc\052708
potential to cocompost biosolids with yard trimmings. In addition, since the biosolids would meet Class I standards, the regulatory requirements will not be as significant compared to biosolids only meeting Class II standards. We have not included any costs to construct additional buildings at the DMASWA site, nor have we included any costs associated with labor and maintenance at the facility. We have assumed that the higher than normal tipping fee would be required to help pay for the capital (buildings, equipment, odor control) and operation of the facility. To date, there has not been any significant discussion with respect to cocomposting of biosolids and yard trimmings, and this alternative will require considerably more evaluation and cooperation between the City of Dubuque and the DMASWA. If anaerobic digestion is selected for residuals management, the potential of such a facility should be discussed and evaluated in more detail. Alternative RM6–Anaerobic digestion with drying and agricultural land application. This alternative was included to reduce the amount of biosolids trucking from the site. The process is identical to that for RM4 and RM5, except that dewatered digested biosolids would be conveyed to dryers and dried to a solids content of about 90 percent. This eliminates nearly all of the water weight, resulting in significantly lower hauling costs and truck traffic. However, the operating cost for the dryers is relatively high for natural gas and electricity. Alternative RM7–Drying with agricultural land application. This alternative uses the same type of drying equipment as included in Alternative RM6, except that the dryer would receive raw sludge rather than digested biosolids. Therefore, the capacity of these dryers is required to be larger than the capacity of Alternative RM6. For both RM6 and RM7, dust control is required as sewage sludge dryers have had some serious problems with explosions caused by dust. In addition, odors from the dryer exhaust can be a problem and odor control systems would be required. B. Monetary Comparisons Table 6.05-1 summarizes the 20-year present worth analysis for each of the residuals management alternatives, and Appendix F provides additional details of these monetary comparisons. Based on this analysis, the lime stabilization alternative (RM3) has a significantly lower projected capital cost and a significantly higher projected annual O&M cost than the other alternatives. The incineration Alternatives RM1b and RM2a have the lowest projected present worth costs at about $29.4 to $30.6 million, and Alternative RM3 (lime stabilization) had the next lowest projected present worth cost at about $33.6 million (16 percent more than the lowest). Alternatives RM4 and RM5 (anaerobic digestion) have projected present worth costs that are approximately 23 percent higher than the low present worth cost. While the two incineration alternatives (RM1b and RM 2a) noted above have the lowest present worth costs, these two alternatives (especially Alternative RM1b) do not provide the same level of reliability and long-term serviceability (sustainability) as the other seven alternatives. This is because only one of the existing fluid bed incinerators would be rehabilitated for both of these alternatives, and the backup system (either a 40-year old incinerator or a lime stabilization system) would likely be called to operate more frequently than in the other alternatives. If the goal is to establish and implement the long-term solids management alternative at this time, these two alternatives should not be considered since
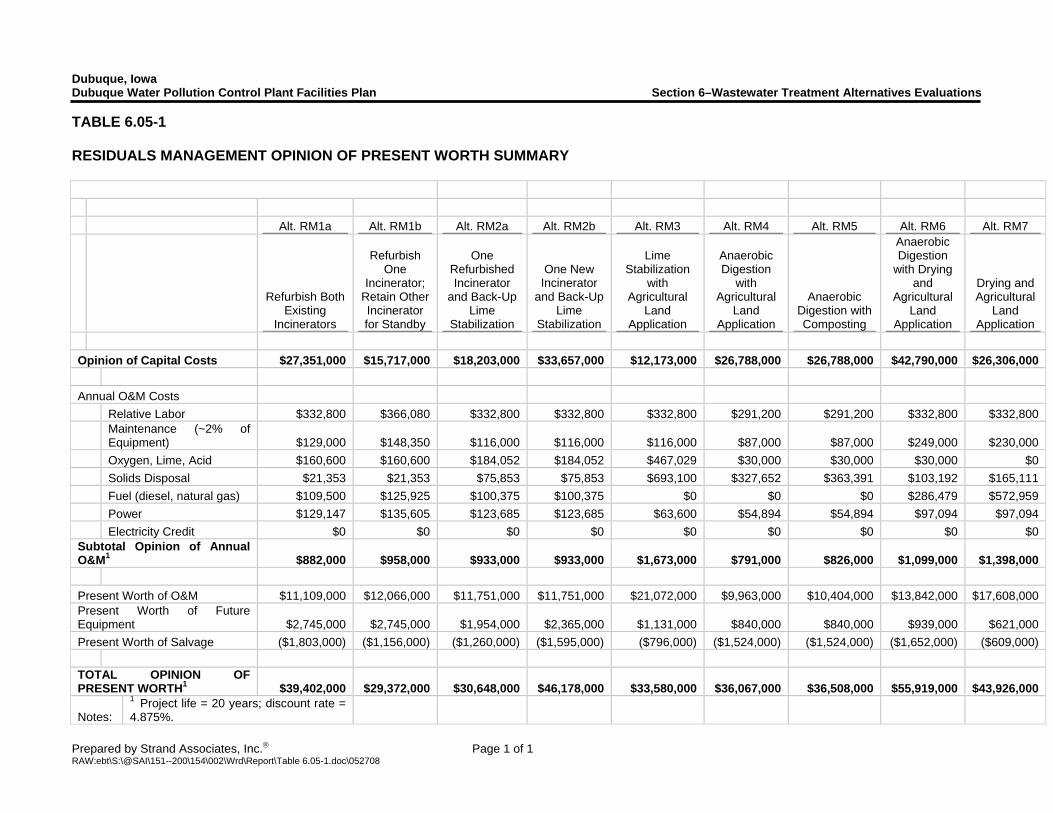
Dubuque, Iowa Dubuque Water Pollution Control Plant Facilities Plan Section 6–Wastewater Treatment Alternatives Evaluations
Prepared by Strand Associates, Inc.® Page 1 of 1 RAW:ebt\S:\@SAI\151--200\154\002\Wrd\Report\Table 6.05-1.doc\052708
TABLE 6.05-1 RESIDUALS MANAGEMENT OPINION OF PRESENT WORTH SUMMARY Alt. RM1a Alt. RM1b Alt. RM2a Alt. RM2b Alt. RM3 Alt. RM4 Alt. RM5 Alt. RM6 Alt. RM7
Refurbish Both Existing
Incinerators
Refurbish One
Incinerator; Retain Other Incinerator for Standby
One Refurbished Incinerator
and Back-Up Lime
Stabilization
One New Incinerator
and Back-Up Lime
Stabilization
Lime Stabilization
with Agricultural
Land Application
Anaerobic Digestion
with Agricultural
Land Application
Anaerobic Digestion with Composting
Anaerobic Digestion
with Drying and
Agricultural Land
Application
Drying and Agricultural
Land Application
Opinion of Capital Costs $27,351,000 $15,717,000 $18,203,000 $33,657,000 $12,173,000 $26,788,000 $26,788,000 $42,790,000 $26,306,000 Annual O&M Costs Relative Labor $332,800 $366,080 $332,800 $332,800 $332,800 $291,200 $291,200 $332,800 $332,800
Maintenance (~2% of Equipment) $129,000 $148,350 $116,000 $116,000 $116,000 $87,000 $87,000 $249,000 $230,000
Oxygen, Lime, Acid $160,600 $160,600 $184,052 $184,052 $467,029 $30,000 $30,000 $30,000 $0 Solids Disposal $21,353 $21,353 $75,853 $75,853 $693,100 $327,652 $363,391 $103,192 $165,111 Fuel (diesel, natural gas) $109,500 $125,925 $100,375 $100,375 $0 $0 $0 $286,479 $572,959 Power $129,147 $135,605 $123,685 $123,685 $63,600 $54,894 $54,894 $97,094 $97,094 Electricity Credit $0 $0 $0 $0 $0 $0 $0 $0 $0 Subtotal Opinion of Annual O&M1 $882,000 $958,000 $933,000 $933,000 $1,673,000 $791,000 $826,000 $1,099,000 $1,398,000 Present Worth of O&M $11,109,000 $12,066,000 $11,751,000 $11,751,000 $21,072,000 $9,963,000 $10,404,000 $13,842,000 $17,608,000 Present Worth of Future Equipment $2,745,000 $2,745,000 $1,954,000 $2,365,000 $1,131,000 $840,000 $840,000 $939,000 $621,000 Present Worth of Salvage ($1,803,000) ($1,156,000) ($1,260,000) ($1,595,000) ($796,000) ($1,524,000) ($1,524,000) ($1,652,000) ($609,000) TOTAL OPINION OF PRESENT WORTH1 $39,402,000 $29,372,000 $30,648,000 $46,178,000 $33,580,000 $36,067,000 $36,508,000 $55,919,000 $43,926,000
Notes: 1 Project life = 20 years; discount rate = 4.875%.
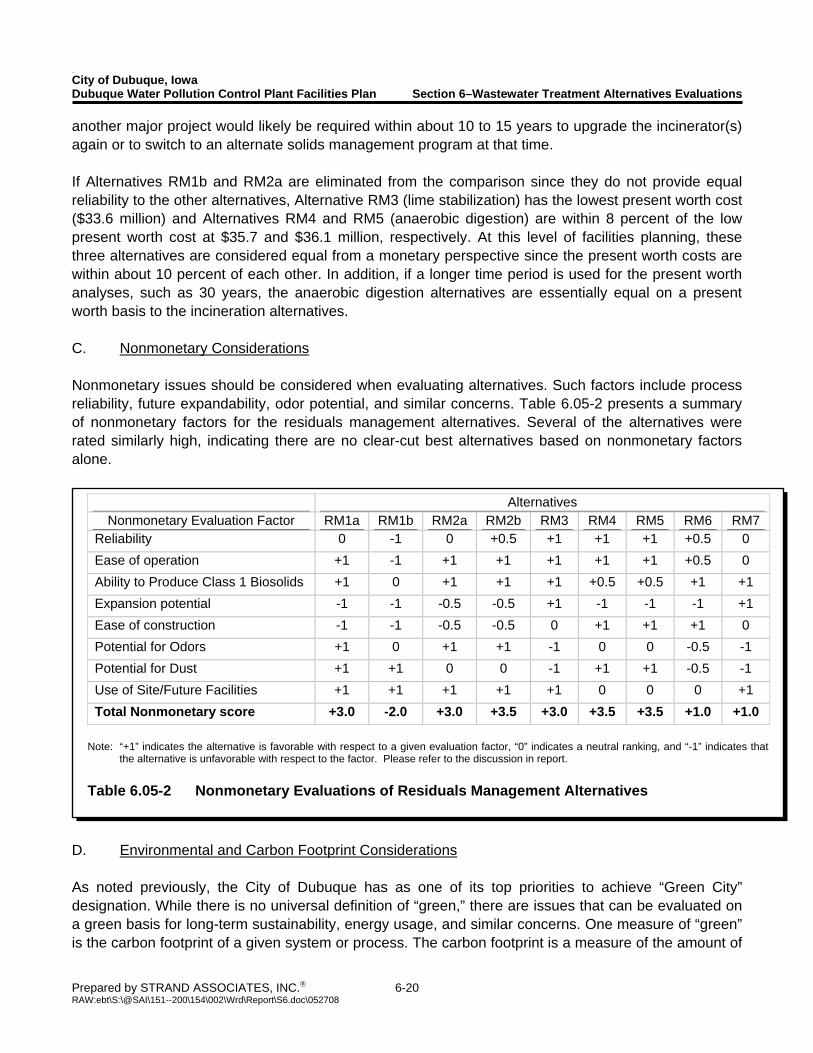
Fon
City of Dubuque, Iowa Dubuque Water Pollution Control Plant Facilities Plan Section 6–Wastewater Treatment Alternatives Evaluations
Prepared by STRAND ASSOCIATES, INC.® 6-20 RAW:ebt\S:\@SAI\151--200\154\002\Wrd\Report\S6.doc\052708
another major project would likely be required within about 10 to 15 years to upgrade the incinerator(s) again or to switch to an alternate solids management program at that time. If Alternatives RM1b and RM2a are eliminated from the comparison since they do not provide equal reliability to the other alternatives, Alternative RM3 (lime stabilization) has the lowest present worth cost ($33.6 million) and Alternatives RM4 and RM5 (anaerobic digestion) are within 8 percent of the low present worth cost at $35.7 and $36.1 million, respectively. At this level of facilities planning, these three alternatives are considered equal from a monetary perspective since the present worth costs are within about 10 percent of each other. In addition, if a longer time period is used for the present worth analyses, such as 30 years, the anaerobic digestion alternatives are essentially equal on a present worth basis to the incineration alternatives. C. Nonmonetary Considerations Nonmonetary issues should be considered when evaluating alternatives. Such factors include process reliability, future expandability, odor potential, and similar concerns. Table 6.05-2 presents a summary of nonmonetary factors for the residuals management alternatives. Several of the alternatives were rated similarly high, indicating there are no clear-cut best alternatives based on nonmonetary factors alone.
D. Environmental and Carbon Footprint Considerations As noted previously, the City of Dubuque has as one of its top priorities to achieve “Green City” designation. While there is no universal definition of “green,” there are issues that can be evaluated on a green basis for long-term sustainability, energy usage, and similar concerns. One measure of “green” is the carbon footprint of a given system or process. The carbon footprint is a measure of the amount of
Alternatives Nonmonetary Evaluation Factor RM1a RM1b RM2a RM2b RM3 RM4 RM5 RM6 RM7
Reliability 0 -1 0 +0.5 +1 +1 +1 +0.5 0 Ease of operation +1 -1 +1 +1 +1 +1 +1 +0.5 0 Ability to Produce Class 1 Biosolids +1 0 +1 +1 +1 +0.5 +0.5 +1 +1 Expansion potential -1 -1 -0.5 -0.5 +1 -1 -1 -1 +1 Ease of construction -1 -1 -0.5 -0.5 0 +1 +1 +1 0 Potential for Odors +1 0 +1 +1 -1 0 0 -0.5 -1 Potential for Dust +1 +1 0 0 -1 +1 +1 -0.5 -1 Use of Site/Future Facilities +1 +1 +1 +1 +1 0 0 0 +1 Total Nonmonetary score +3.0 -2.0 +3.0 +3.5 +3.0 +3.5 +3.5 +1.0 +1.0
Note: “+1” indicates the alternative is favorable with respect to a given evaluation factor, “0” indicates a neutral ranking, and “-1” indicates that
the alternative is unfavorable with respect to the factor. Please refer to the discussion in report. Table 6.05-2 Nonmonetary Evaluations of Residuals Management Alternatives
Fon
City of Dubuque, Iowa Dubuque Water Pollution Control Plant Facilities Plan Section 6–Wastewater Treatment Alternatives Evaluations
Prepared by STRAND ASSOCIATES, INC.® 6-21 RAW:ebt\S:\@SAI\151--200\154\002\Wrd\Report\S6.doc\052708
carbon dioxide equivalents given off or produced from a process or activity and is an indication of the impact on green house gas (GHG) emissions (larger carbon footprint = bigger impact on GHG emissions). Table 6.05-3 presents a simplified carbon footprint analysis based on estimated energy demands of the seven residuals management alternatives. The energy usage includes electricity, natural gas, and fuel oil for transportation and incinerator operation. Based on this analysis, the anaerobic digestion alternatives (RM4, RM5, RM6) have smaller energy-related carbon footprints than the other alternatives. E. Recommended Residuals Management Alternative Based on the economic, nonmonetary, and environmental comparisons of the residuals management alternatives, the City of Dubuque selected anaerobic digestion with land application (Alternative RM4). The City may elect to initiate a composting operation in the future (Alternative RM5–Anaerobic Digestion with Composting), though contract land application will be the main disposal option initially. This alternative best meets the City’s long-term sustainability and green initiatives and has the following advantages:
1. For the incineration and anaerobic digestion alternatives that are comparable on a reliability basis, the capital costs for all options were very close.
2. The anaerobic digestion alternatives provide the lowest projected annual O&M costs. 3. For comparable alternatives, the 20-year present worth values for the anaerobic
digestion alternatives are within approximately 10 percent of the low cost alternative. If a 30-year period is evaluated, the anaerobic digestion alternatives provide the lowest projected present worth costs of any of the alternatives considered.
4. The digestion process will use less energy, including electricity and auxiliary fuel. This
will provide a more stable and predictable energy demand over the life of the facilities compared to the other alternatives. Should power and fuel costs continue to increase faster than the overall rate of inflation, anaerobic digestion provides even more economic advantages since it has a lower energy use and produces a reliable source of energy in the form of biogas.
5. The digestion alternatives provide potential for utilizing excess biogas to produce
energy, which will further reduce the City of Dubuque’s energy use and carbon footprint. 6. The digestion alternatives provide a long-term solution, which sets the direction of the
Dubuque solids management program for the next 40 or 50 years. With the lower capital cost incineration alternatives, significant upgrades would be anticipated within the next 10 to 15 years, which would likely result in reconsideration of these same issues.
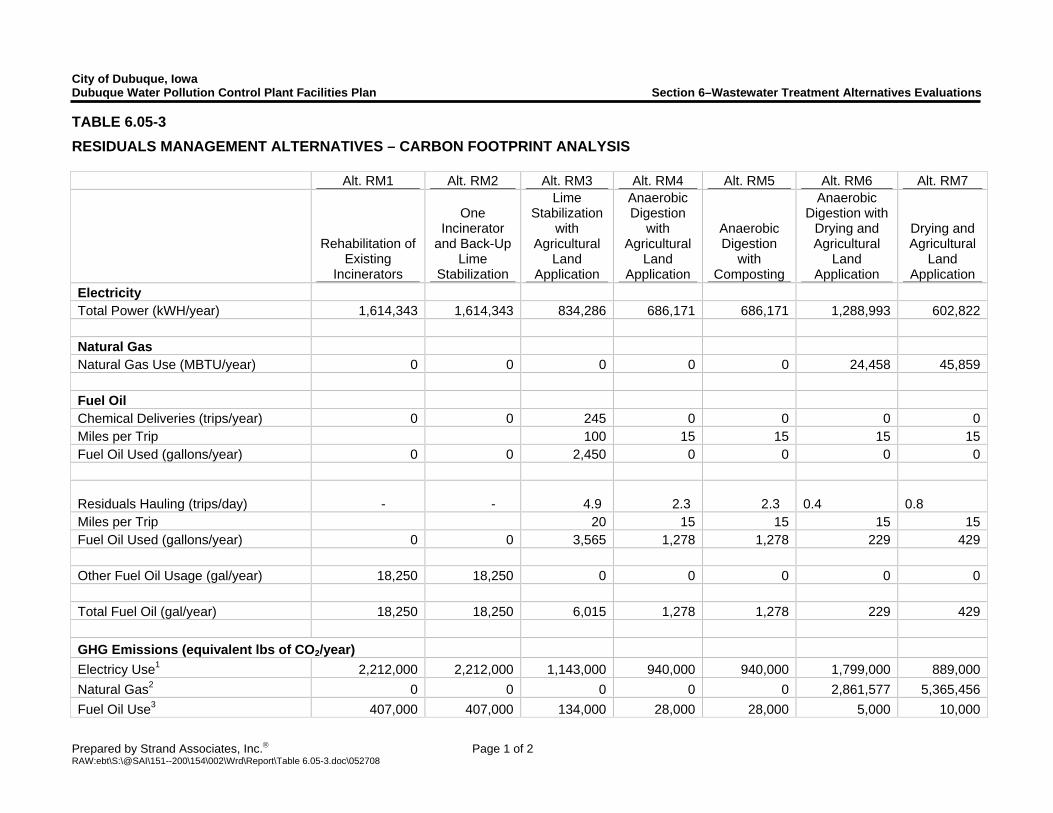
City of Dubuque, Iowa Dubuque Water Pollution Control Plant Facilities Plan Section 6–Wastewater Treatment Alternatives Evaluations
Prepared by Strand Associates, Inc.® Page 1 of 2 RAW:ebt\S:\@SAI\151--200\154\002\Wrd\Report\Table 6.05-3.doc\052708
TABLE 6.05-3
RESIDUALS MANAGEMENT ALTERNATIVES – CARBON FOOTPRINT ANALYSIS Alt. RM1 Alt. RM2 Alt. RM3 Alt. RM4 Alt. RM5 Alt. RM6 Alt. RM7
Rehabilitation of Existing
Incinerators
One Incinerator
and Back-Up Lime
Stabilization
Lime Stabilization
with Agricultural
Land Application
Anaerobic Digestion
with Agricultural
Land Application
Anaerobic Digestion
with Composting
Anaerobic Digestion with
Drying and Agricultural
Land Application
Drying and Agricultural
Land Application
Electricity Total Power (kWH/year) 1,614,343 1,614,343 834,286 686,171 686,171 1,288,993 602,822 Natural Gas Natural Gas Use (MBTU/year) 0 0 0 0 0 24,458 45,859 Fuel Oil Chemical Deliveries (trips/year) 0 0 245 0 0 0 0Miles per Trip 100 15 15 15 15Fuel Oil Used (gallons/year) 0 0 2,450 0 0 0 0
Residuals Hauling (trips/day) - - 4.9 2.3 2.3 0.4
0.8
Miles per Trip 20 15 15 15 15Fuel Oil Used (gallons/year) 0 0 3,565 1,278 1,278 229 429 Other Fuel Oil Usage (gal/year) 18,250 18,250 0 0 0 0 0 Total Fuel Oil (gal/year) 18,250 18,250 6,015 1,278 1,278 229 429 GHG Emissions (equivalent lbs of CO2/year) Electricy Use1 2,212,000 2,212,000 1,143,000 940,000 940,000 1,799,000 889,000Natural Gas2 0 0 0 0 0 2,861,577 5,365,456Fuel Oil Use3 407,000 407,000 134,000 28,000 28,000 5,000 10,000
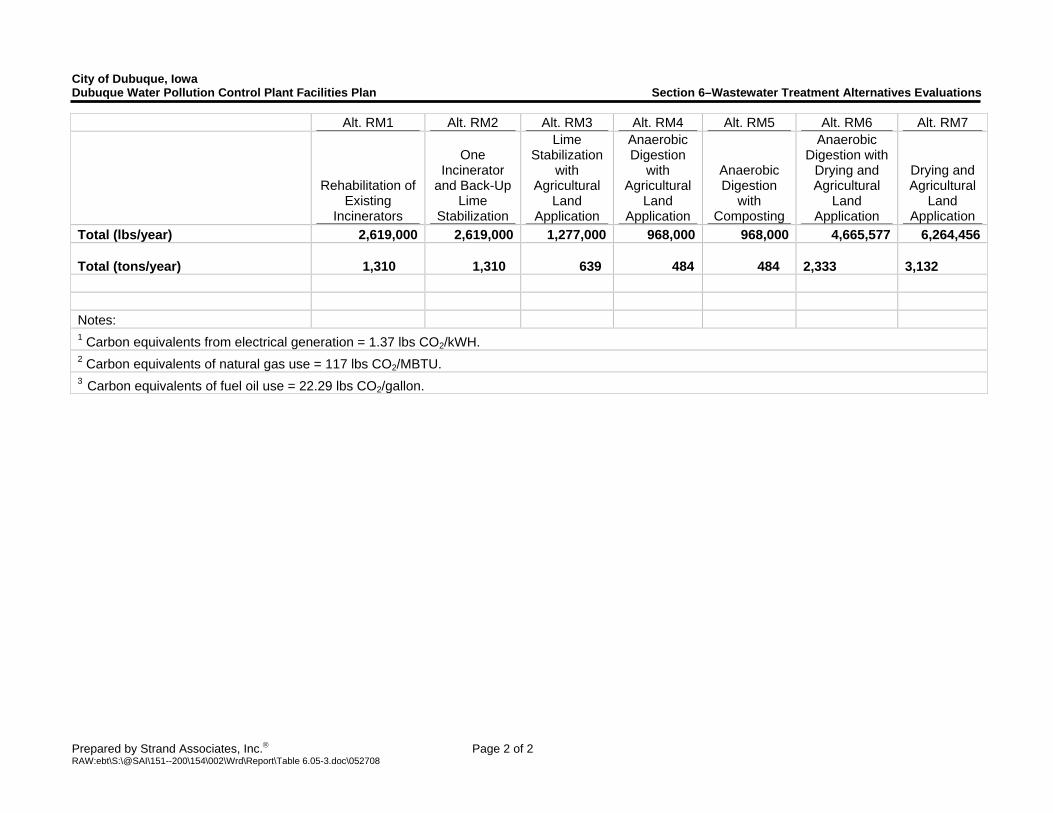
City of Dubuque, Iowa Dubuque Water Pollution Control Plant Facilities Plan Section 6–Wastewater Treatment Alternatives Evaluations
Prepared by Strand Associates, Inc.® Page 2 of 2 RAW:ebt\S:\@SAI\151--200\154\002\Wrd\Report\Table 6.05-3.doc\052708
Alt. RM1 Alt. RM2 Alt. RM3 Alt. RM4 Alt. RM5 Alt. RM6 Alt. RM7
Rehabilitation of Existing
Incinerators
One Incinerator
and Back-Up Lime
Stabilization
Lime Stabilization
with Agricultural
Land Application
Anaerobic Digestion
with Agricultural
Land Application
Anaerobic Digestion
with Composting
Anaerobic Digestion with
Drying and Agricultural
Land Application
Drying and Agricultural
Land Application
Total (lbs/year) 2,619,000 2,619,000 1,277,000 968,000 968,000 4,665,577 6,264,456
Total (tons/year) 1,310 1,310 639 484 484 2,333
3,132
Notes: 1 Carbon equivalents from electrical generation = 1.37 lbs CO2/kWH. 2 Carbon equivalents of natural gas use = 117 lbs CO2/MBTU. 3 Carbon equivalents of fuel oil use = 22.29 lbs CO2/gallon.
Fon
City of Dubuque, Iowa Dubuque Water Pollution Control Plant Facilities Plan Section 6–Wastewater Treatment Alternatives Evaluations
Prepared by STRAND ASSOCIATES, INC.® 6-22 RAW:ebt\S:\@SAI\151--200\154\002\Wrd\Report\S6.doc\052708
In addition, the potential to generate electricity using the biogas is being further investigated and may be included in the final design of the anaerobic digestion facilities. 6.06 OTHER RECOMMENDED PLAN ELEMENTS This Section reviews other recommended plan elements. These recommended improvements are based on a number of criteria, including equipment age and maintenance issues, process reliability issues, and similar concerns. The following elements are discussed:
Grit Removal Primary Treatment Final Clarification Effluent DO and pH Control Peak Flow Management Sampling Emergency Backup Power and Electrical Service Administration Building, Laboratory, and Locker Rooms Vehicle Storage and Maintenance Building Sewer Cleaning Debris Pad Odor Control Other Equipment Replacement Other Maintenance
Descriptions of each of these elements are included in the discussion below. Section 7 presents the overall opinion of cost for these improvements, as well as a staging analysis and financial impact summary for the improvements. A. Grit Removal System The existing grit removal system was installed in about 1994 and includes vortex grit removal basins, mechanical grit pumps (replaced in 2007), and grit classifiers. The classifiers are severely corroded and in need of replacement. In addition, the plant has experienced some problems with plugging of the existing grit pumps and discharge piping. The grit classifiers will be replaced with new equipment, which will be reoriented to allow discharge of grit directly to the dumpster below and eliminate the grit conveyor. In addition, an allowance for grit piping revisions is included in the recommended project. B. Primary Treatment The existing primary clarifiers are covered with domes that were installed in the 1960s and were reconditioned in the 1980s. The purpose of the domes was to minimize odor release from the primary clarifiers. In lieu of reconditioning the existing domes, we recommend eliminating the domes and installing weir/launder covers. The tanks would then be open, which would provide better access and fewer concerns with worker safety. The new weir/launder covers would still capture the majority of the
Fon
City of Dubuque, Iowa Dubuque Water Pollution Control Plant Facilities Plan Section 6–Wastewater Treatment Alternatives Evaluations
Prepared by STRAND ASSOCIATES, INC.® 6-23 RAW:ebt\S:\@SAI\151--200\154\002\Wrd\Report\S6.doc\052708
odors at the weirs for future treatment if needed. An allowance for dome removal is included in the project budget. A fourth 95-foot primary clarifier would be added to improve primary treatment performance and provide improved redundancy. The new clarifier would be constructed in the space reserved for a fourth primary and would have identical dimensions as the three existing clarifiers. The splitter structure and piping will be modified as needed to accommodate the fourth clarifier. C. Final Clarifier Modifications The final clarifiers were constructed in the 1970s and are currently being refurbished and painted. Stamford baffles were added in the 1990s to improve performance. Additional performance enhancement is recommended by replacing the energy dissipating inlets with a newer style inlet (termed the LA-EDI) designed for shallow final clarification tanks. The large stilling wells would also be replaced with smaller wells, and the inlets would be flanged to the bottom of the inlet well. D. Effluent DO and pH Control The plant will need to meet a new effluent DO limit of 5.0 mg/L, and will also need to meet a higher minimum pH level of 6.5 standard units. To better define the likelihood of meeting both of these limits, the plant should routinely monitor the wastewater DO and pH downstream of the aeration basins to determine how DO and pH change through the remaining facilities. This should be done over the winter (no disinfection) as well as during other times of the years to estimate the impact of the chlorine and bisulfite chemicals. Assuming the effluent will not meet either limit routinely, we recommend the following:
1. Because the HPO system is relatively lightly loaded at the present time, we recommend removing the final stage cover from each HPO train, which will serve to release CO2 and raise the effluent pH. Prior to implementing this, we recommend installing a temporary ventilation system to provide air to the last stage rather than oxygen. This will allow testing of the concept prior to full-scale removal of the concrete deck over the last stage.
2. To meet the effluent DO limit, install a cascade aeration system downstream of the
dechlorination basin. [Note: Cascade aeration may release adequate CO2 to raise the pH and meet the 6.5 limit. This should be investigated prior to the removal of the concrete deck over the last stage HPO basins.]
E. Peak Flow Management While the existing final clarifiers have a nominal peak flow capacity of approximately 41.5 mgd based on an overflow rate of 1,200 gpd/ft2, plant staff have indicated that solids loss from these clarifiers is evident at much lower peak flows. This is likely the result of two factors: (1) the plant maintains a relatively deep sludge blanket in the final clarifiers to temporarily store WAS and improve dewatering performance, and (2) the clarifiers are relatively shallow (12-foot SWD). This plan includes measures to
Fon
City of Dubuque, Iowa Dubuque Water Pollution Control Plant Facilities Plan Section 6–Wastewater Treatment Alternatives Evaluations
Prepared by STRAND ASSOCIATES, INC.® 6-24 RAW:ebt\S:\@SAI\151--200\154\002\Wrd\Report\S6.doc\052708
address both of those concerns. However, extended peak flows could still be problematic for the plant, so we recommend implementing off-line equalization of peak flow events by converting the two existing trickling filter structures to equalization basins. These structures were built in the late 1960s and were evaluated in early 2007 for conversion to equalization basins. That report developed a conceptual plan for the conversion but indicated that the wall-to-slab construction joint will need to be evaluated to determine if it is water-tight. If not, this joint will require some work to provide a watertight joint. The structural design of the basins was reported to be adequate to store wastewater, and the hydraulics into and out of the structures are well-suited for service as equalization basins. Wastewater would first flow through the influent screens, grit removal tanks, and primary clarifiers. A diversion structure would divert flows above an operator-adjustable maximum flow rate (e.g., flows > 20 mgd) to the equalization basins for storage, and all flows up to the maximum flow rate would continue to the HPO basins. As flows decrease below the maximum flow rate, wastewater will be pumped from the equalization basins to the forward flow. Detailed hydraulic analyses may result in gravity flow from the equalization basins to the downstream HPO basins to reduce the amount of equalized flow pumping. If peak flows were sustained long enough to fill both equalization basins, these basins would overflow to the HPO basins. The HPO basins will be modified to allow operation in the contact stabilization mode during extended peak flow events. During such events, this mode of operation reduces the solids loading to the final clarifiers and increases RAS inventory in the converted HPO basins. This modification requires the addition of splitter structures and repiping of RAS and forward flow streams. Refer to Section 5 for additional discussion. F. Sampling The existing influent and effluent samplers are suspected of collecting unrepresentative wastewater samples as noted previously. We have included two new influent samplers to replace the two existing samplers, and these will be located in the existing gaseous chlorine storage room. A new effluent sampler will also be provided and will either be located in this same room or a new dedicated sampling building (pre-engineered FRP building) will be included near the existing chlorine contact tank. G. Emergency Backup Power and Electrical Service The plant currently has two electric utility power feeds for redundancy, which has provided adequate and reliable electrical service for many years. However, the City is planning to install backup generators at the remaining lift stations that currently do not have backup generation. This will result in continued wastewater pumping to the WPCP even when a widespread power outage occurs. In this case, assuming both feeds are lost, wastewater would continue to flow through the plant, but none of the treatment equipment would have power to operate and only limited treatment would be provided. The plant currently has two electrical services, and we have included two generators (estimated at 600 to 800 kW each) to provide backup power to each service with automatic switchgear. As part of the
Fon
City of Dubuque, Iowa Dubuque Water Pollution Control Plant Facilities Plan Section 6–Wastewater Treatment Alternatives Evaluations
Prepared by STRAND ASSOCIATES, INC.® 6-25 RAW:ebt\S:\@SAI\151--200\154\002\Wrd\Report\S6.doc\052708
detailed design, an evaluation will be made to determine if the WPCP should convert to a single electrical service, which would require only one backup generator and would reduce the monthly service fees from the electric utility. In addition to backup generation and the plant’s electrical service, some of the electrical distribution gear within the plant is more than 30 years old and should be replaced. Also, the motor control center in the headworks building should be relocated or the building modified to eliminate the doorway between the electrical room and the screening and grit handling spaces. We have included electrical allowances for these modifications. H. Administration Building, Laboratory, and Locker Rooms A detailed space needs study will be provided during the design phase of the project. For the purposes of this report, we have included an allowance of approximately $125/ft2 for renovation of the existing administration building, including the office spaces, employee spaces, laboratory, and locker rooms, as well as the locker room and employee spaces in the existing solids processing building. These buildings were constructed in the late 1960s with some additions and modifications in the 1970s. The allowance includes improvements to energy efficiency, updating the finishes and furnishings, and bringing the building up to ADA standards. A laboratory addition is also recommended, and an allowance of $300/ft2 was included for additional laboratory space of approximately 700 ft2, plus a basement extension under the laboratory at $150/ft2. I. Vehicle Storage and Maintenance Building A new vehicular storage and maintenance garage is desired to address the limited storage space currently available. An allowance of $150/ft2 is included for a structure that is approximately 80 feet by 60 feet (about 4,800 ft2), which would provide three open bays plus some additional storage space. A more detailed evaluation of space needs will be included during the design phase of the project. J. Sewer Cleaning Debris Pad Currently, sewer cleaning crews use the WPCP site to store sewer cleaning/jetting debris. To improve dewatering and handling of such material, a drained concrete pad is included in the project budget. We have assumed that this pad will be located near the existing ash lagoons and will be drained back to the plant drain system. K. Odor Control We have not included new odor control systems for the WPCP since odors from the renovated plant are not anticipated to be significantly different than from the current plant. However, the design will incorporate the ability to easily and readily add odor control for the existing primary clarifiers, headworks building, and sludge dewatering areas.
Fon
City of Dubuque, Iowa Dubuque Water Pollution Control Plant Facilities Plan Section 6–Wastewater Treatment Alternatives Evaluations
Prepared by STRAND ASSOCIATES, INC.® 6-26 RAW:ebt\S:\@SAI\151--200\154\002\Wrd\Report\S6.doc\052708
L. Other Equipment Replacement Numerous pumps, compressors, gates, and related equipment throughout the plant are either very old and operating beyond their normal useful life or are known to require replacement. We have included a listing of this equipment below and have budgeted for the replacement of such equipment in Section 7:
1. Influent magnetic flow meters (two) 2. Primary clarifier drives 3. Primary scum pumps (three) 4. Primary sludge transfer pumps (three) 5. RAS pump VFD replacement (six) 6. WAS pumps 7. In-plant waste/recycle pumps (three) 8. Plant effluent/process water pump (one) 9. HVAC systems (inspection and allowance included)
M. Miscellaneous Piping, Valves, Gates, Mechanical, and Other Components Much of the interior and underground piping infrastructure at the plant was installed in the late 1960s and mid-1970s, so it is more than 30 years old. Much of the original exposed piping is in poor condition, and many valves are inoperable. The condition of the underground piping that is still in use has not been determined. Plant personnel have indicated that most of the gates are difficult to operate and should be replaced. The following list includes components that are known to require replacement or are recommended for improving operations at the plant:
1. Influent channel gates. 2. Primary clarifier splitter gates. 3. MLSS splitter gates. 4. Final clarifier influent splitter gates. 5. Rerouting in-plant waste/recycle pump discharge upstream of the influent screens. 6. New septage/hauled waste receiving station. 7. New roofs on existing buildings.
In addition to these components, other valves and piping will require replacement. We have included an allowance in the overall project cost to account for a significant amount of mechanical piping and valve replacement.

SECTION 7 RECOMMENDED PLAN AND FISCAL IMPACT ANALYSES
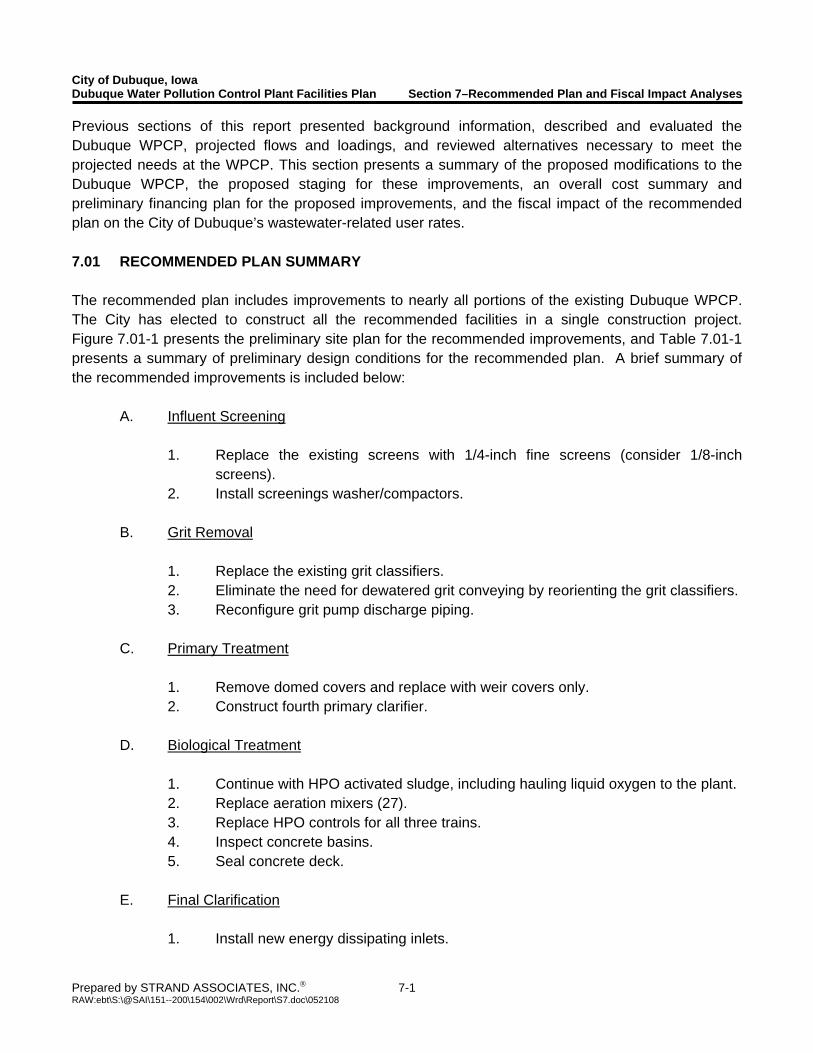
City of Dubuque, Iowa Dubuque Water Pollution Control Plant Facilities Plan Section 7–Recommended Plan and Fiscal Impact Analyses
Prepared by STRAND ASSOCIATES, INC.® 7-1 RAW:ebt\S:\@SAI\151--200\154\002\Wrd\Report\S7.doc\052108
Previous sections of this report presented background information, described and evaluated the Dubuque WPCP, projected flows and loadings, and reviewed alternatives necessary to meet the projected needs at the WPCP. This section presents a summary of the proposed modifications to the Dubuque WPCP, the proposed staging for these improvements, an overall cost summary and preliminary financing plan for the proposed improvements, and the fiscal impact of the recommended plan on the City of Dubuque’s wastewater-related user rates. 7.01 RECOMMENDED PLAN SUMMARY The recommended plan includes improvements to nearly all portions of the existing Dubuque WPCP. The City has elected to construct all the recommended facilities in a single construction project. Figure 7.01-1 presents the preliminary site plan for the recommended improvements, and Table 7.01-1 presents a summary of preliminary design conditions for the recommended plan. A brief summary of the recommended improvements is included below:
A. Influent Screening
1. Replace the existing screens with 1/4-inch fine screens (consider 1/8-inch screens).
2. Install screenings washer/compactors.
B. Grit Removal
1. Replace the existing grit classifiers. 2. Eliminate the need for dewatered grit conveying by reorienting the grit classifiers. 3. Reconfigure grit pump discharge piping.
C. Primary Treatment
1. Remove domed covers and replace with weir covers only. 2. Construct fourth primary clarifier.
D. Biological Treatment
1. Continue with HPO activated sludge, including hauling liquid oxygen to the plant. 2. Replace aeration mixers (27). 3. Replace HPO controls for all three trains. 4. Inspect concrete basins. 5. Seal concrete deck.
E. Final Clarification
1. Install new energy dissipating inlets.
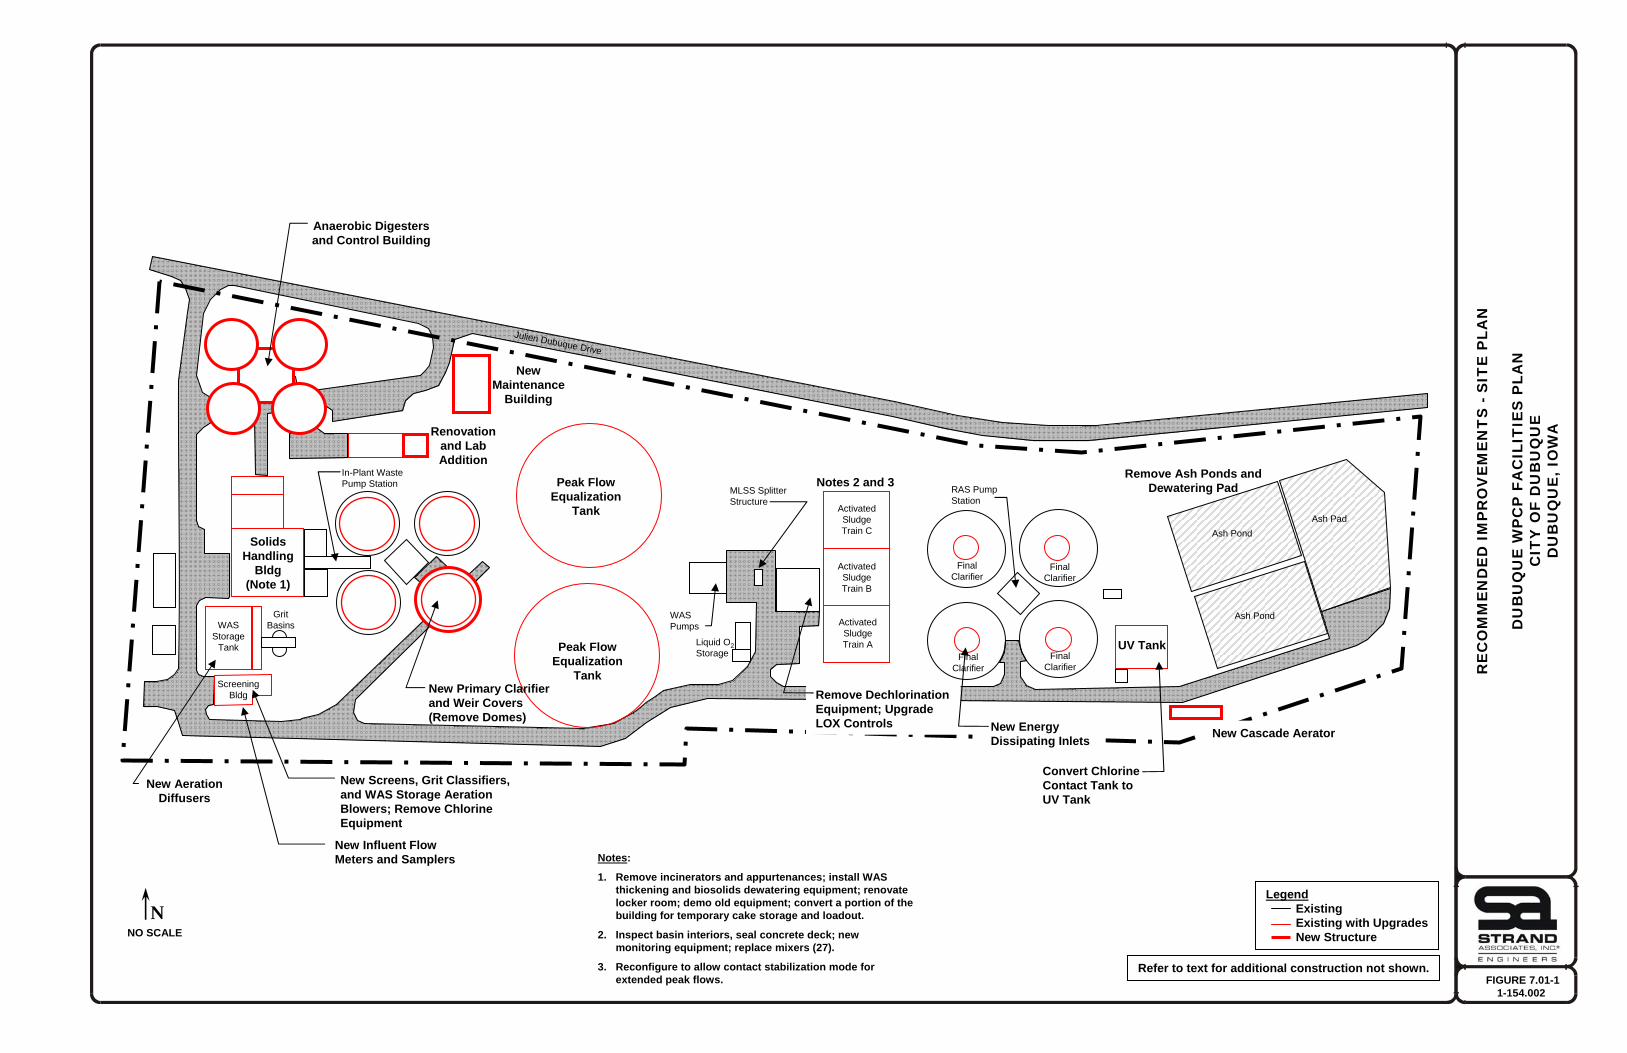
FIGURE 7.01-11-154.002
NNO SCALE
RAS Pump Station
WAS Storage
Tank
ActivatedSludgeTrain B
WAS Pumps
Grit Basins
In-Plant Waste Pump Station
Ash Pond
Ash Pond
Ash Pad
Final Clarifier
Final Clarifier
Final Clarifier
Final Clarifier
UV TankLiquid O2StoragePeak Flow
EqualizationTank
ScreeningBldg
Primary Clarifier
Primary Clarifier
Primary Clarifier
SolidsHandling
Bldg(Note 1)
Renovation and Lab Addition
ActivatedSludgeTrain C
ActivatedSludgeTrain A
MLSS Splitter Structure
New Aeration Diffusers
Julien Dubuque Drive
RE
CO
MM
EN
DE
D I
MP
RO
VE
ME
NT
S -
SIT
E P
LAN
DU
BU
QU
E W
PC
P F
AC
ILIT
IES
PLA
NC
ITY
OF
DU
BU
QU
E
DU
BU
QU
E, I
OW
A
New Screens, Grit Classifiers, and WAS Storage Aeration Blowers; Remove Chlorine Equipment
New Primary Clarifier and Weir Covers(Remove Domes)
Anaerobic Digesters and Control Building
New Influent Flow Meters and Samplers Notes:
1. Remove incinerators and appurtenances; install WAS thickening and biosolids dewatering equipment; renovate locker room; demo old equipment; convert a portion of the building for temporary cake storage and loadout.
2. Inspect basin interiors, seal concrete deck; new monitoring equipment; replace mixers (27).
3. Reconfigure to allow contact stabilization mode for extended peak flows.
Peak Flow Equalization
Tank
Remove DechlorinationEquipment; Upgrade LOX Controls New Energy
Dissipating Inlets
Convert Chlorine Contact Tank to UV Tank
Remove Ash Ponds and Dewatering PadNotes 2 and 3
New Maintenance
Building
New Cascade Aerator
Refer to text for additional construction not shown.
LegendExistingExisting with UpgradesNew Structure
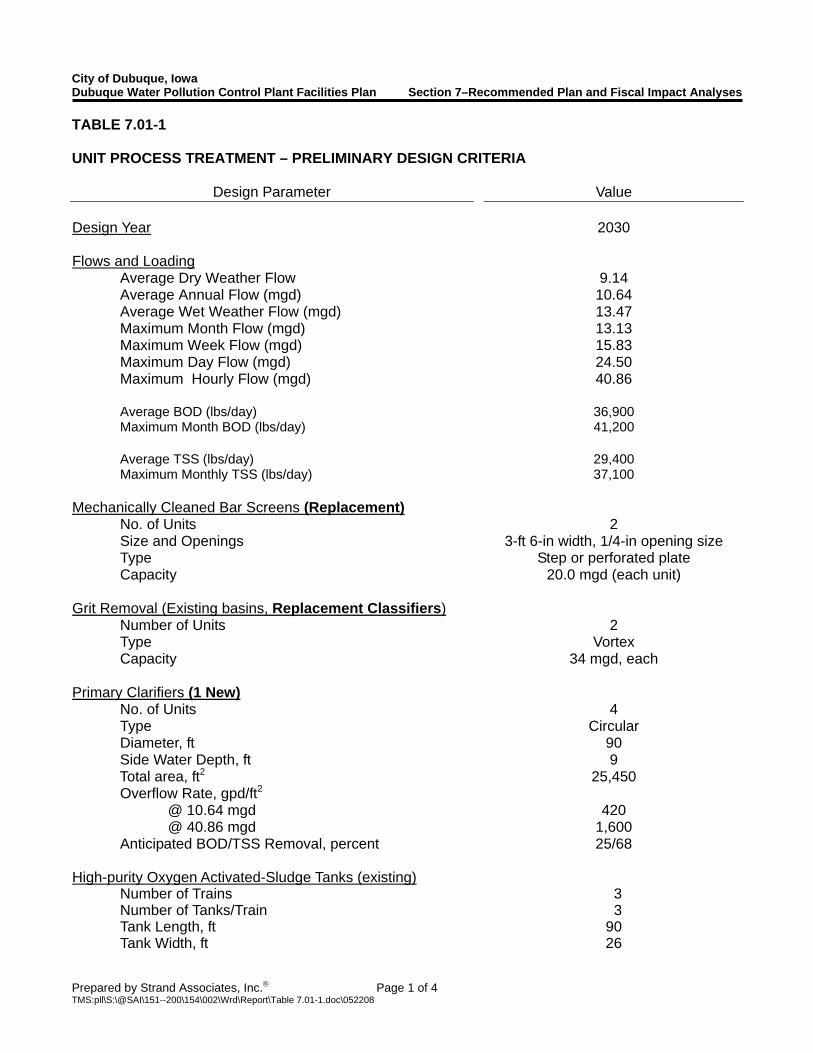
City of Dubuque, Iowa Dubuque Water Pollution Control Plant Facilities Plan Section 7–Recommended Plan and Fiscal Impact Analyses
Prepared by Strand Associates, Inc.® Page 1 of 4 TMS:pll\S:\@SAI\151--200\154\002\Wrd\Report\Table 7.01-1.doc\052208
TABLE 7.01-1 UNIT PROCESS TREATMENT – PRELIMINARY DESIGN CRITERIA
Design Parameter Value Design Year 2030 Flows and Loading Average Dry Weather Flow 9.14 Average Annual Flow (mgd) 10.64 Average Wet Weather Flow (mgd) 13.47 Maximum Month Flow (mgd) 13.13 Maximum Week Flow (mgd) 15.83 Maximum Day Flow (mgd) 24.50 Maximum Hourly Flow (mgd) 40.86 Average BOD (lbs/day) 36,900 Maximum Month BOD (lbs/day) 41,200 Average TSS (lbs/day) 29,400 Maximum Monthly TSS (lbs/day) 37,100 Mechanically Cleaned Bar Screens (Replacement) No. of Units 2 Size and Openings 3-ft 6-in width, 1/4-in opening size Type Step or perforated plate Capacity 20.0 mgd (each unit) Grit Removal (Existing basins, Replacement Classifiers) Number of Units 2 Type Vortex Capacity 34 mgd, each Primary Clarifiers (1 New) No. of Units 4 Type Circular Diameter, ft 90 Side Water Depth, ft 9
Total area, ft2 25,450 Overflow Rate, gpd/ft2 @ 10.64 mgd 420 @ 40.86 mgd 1,600 Anticipated BOD/TSS Removal, percent 25/68 High-purity Oxygen Activated-Sludge Tanks (existing) Number of Trains 3 Number of Tanks/Train 3 Tank Length, ft 90 Tank Width, ft 26

City of Dubuque, Iowa Dubuque Water Pollution Control Plant Facilities Plan Section 7–Recommended Plan and Fiscal Impact Analyses
Prepared by Strand Associates, Inc.® Page 2 of 4 TMS:pll\S:\@SAI\151--200\154\002\Wrd\Report\Table 7.01-1.doc\052208
Design Parameter Value Side Water Depth, ft 12 Volume, ft3 (total) 252,720 Design Avg. BOD Load, lb/1,000 ft3/day 122 Design HRT @ 10.64 mgd, hrs 4.3 No. of Mixers (Replacement) 27 Mixer Horsepower (each train), hp
Tank 1 Tank 2 Tank 3
30/15/10
10/7.5/7.5 5/5/5
Oxygen Storage (existing) Liquid Storage Capacity, tons 44 Vaporization Capacity, tons/day 22.8
Final Clarifiers (existing) No. of Units 4 Diameter, ft 105 Side Water Depth, ft 12 Surface Area, ft2 (total) 34,640 Volume, ft3 Each 103,920 Total 415,680 Overflow Rate, gpd/ft2 @ 10.64 mgd 307 @ 40.86 mgd 1,180 Weir Length, ft Each 312 Total 1,248 Weir Loading Rate, gpd/ft @ 13.47 mgd (avg. wet weather) 10,800
Effluent Disinfection (New; Reuse Existing Contact Tank) Type UV light; high-pressure, medium
intensity Number 2 Design Flow, mgd 40.86 Installation In existing Chlorine Contact Tank Peak Flow Equalization (Converted Trickling Filters) No. of Units 2 Diameter, feet 195 Total Volume, gal ~3,000,000 Aerated WAS Storage No. of Tanks 1 Dimensions 55 ft x 80 ft x 14.25 ft SWD Volume, gallons 469,000 Max. Month WAS, lbs/day (Yield = 0.6 lbs/lb) 18,540
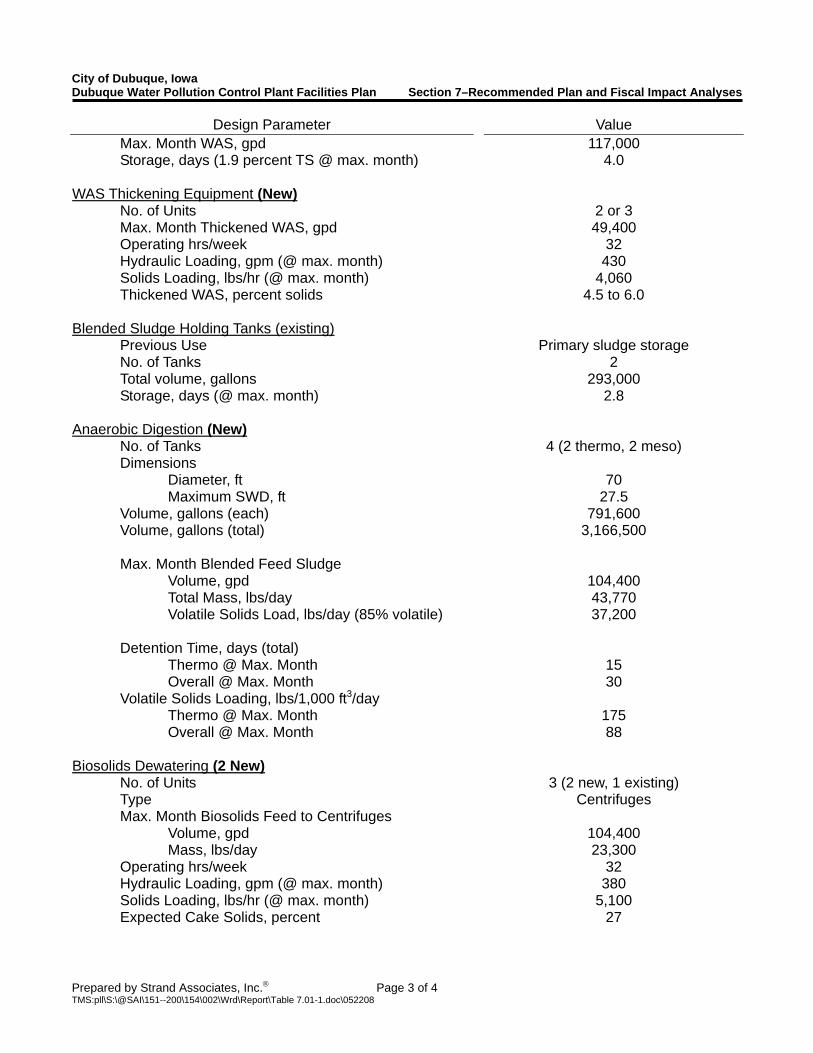
City of Dubuque, Iowa Dubuque Water Pollution Control Plant Facilities Plan Section 7–Recommended Plan and Fiscal Impact Analyses
Prepared by Strand Associates, Inc.® Page 3 of 4 TMS:pll\S:\@SAI\151--200\154\002\Wrd\Report\Table 7.01-1.doc\052208
Design Parameter Value Max. Month WAS, gpd 117,000 Storage, days (1.9 percent TS @ max. month) 4.0 WAS Thickening Equipment (New) No. of Units 2 or 3 Max. Month Thickened WAS, gpd 49,400 Operating hrs/week 32 Hydraulic Loading, gpm (@ max. month) 430 Solids Loading, lbs/hr (@ max. month) 4,060 Thickened WAS, percent solids 4.5 to 6.0 Blended Sludge Holding Tanks (existing) Previous Use Primary sludge storage No. of Tanks 2 Total volume, gallons 293,000 Storage, days (@ max. month) 2.8 Anaerobic Digestion (New) No. of Tanks 4 (2 thermo, 2 meso) Dimensions Diameter, ft 70 Maximum SWD, ft 27.5 Volume, gallons (each) 791,600 Volume, gallons (total) 3,166,500 Max. Month Blended Feed Sludge Volume, gpd 104,400 Total Mass, lbs/day 43,770 Volatile Solids Load, lbs/day (85% volatile) 37,200 Detention Time, days (total) Thermo @ Max. Month 15 Overall @ Max. Month 30 Volatile Solids Loading, lbs/1,000 ft3/day Thermo @ Max. Month 175 Overall @ Max. Month 88 Biosolids Dewatering (2 New) No. of Units 3 (2 new, 1 existing) Type Centrifuges Max. Month Biosolids Feed to Centrifuges Volume, gpd 104,400 Mass, lbs/day 23,300 Operating hrs/week 32 Hydraulic Loading, gpm (@ max. month) 380 Solids Loading, lbs/hr (@ max. month) 5,100 Expected Cake Solids, percent 27
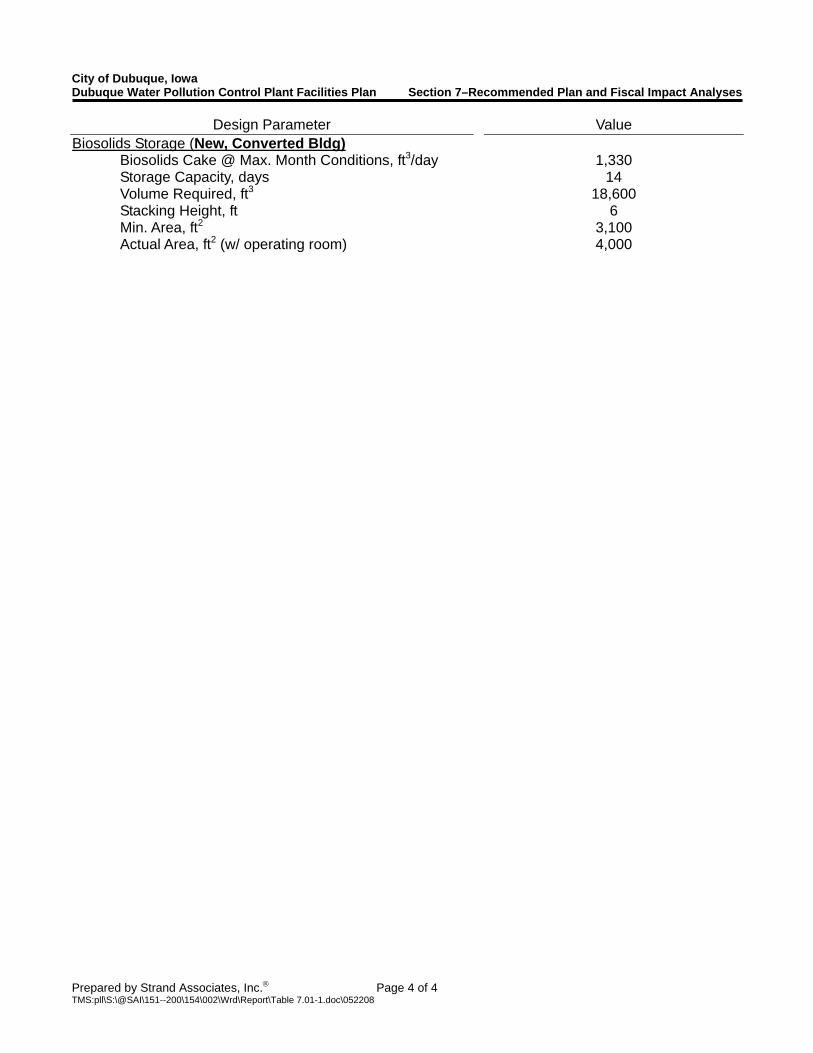
City of Dubuque, Iowa Dubuque Water Pollution Control Plant Facilities Plan Section 7–Recommended Plan and Fiscal Impact Analyses
Prepared by Strand Associates, Inc.® Page 4 of 4 TMS:pll\S:\@SAI\151--200\154\002\Wrd\Report\Table 7.01-1.doc\052208
Design Parameter Value Biosolids Storage (New, Converted Bldg) Biosolids Cake @ Max. Month Conditions, ft3/day 1,330 Storage Capacity, days 14 Volume Required, ft3 18,600 Stacking Height, ft 6 Min. Area, ft2 3,100 Actual Area, ft2 (w/ operating room) 4,000
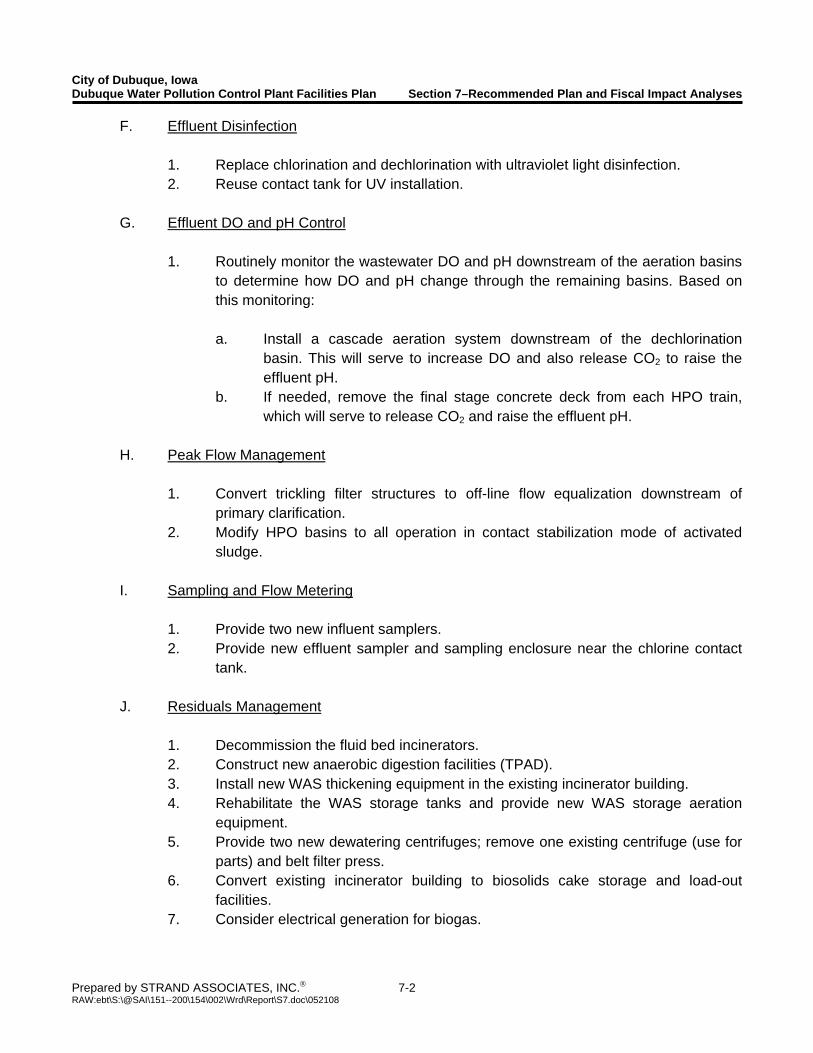
City of Dubuque, Iowa Dubuque Water Pollution Control Plant Facilities Plan Section 7–Recommended Plan and Fiscal Impact Analyses
Prepared by STRAND ASSOCIATES, INC.® 7-2 RAW:ebt\S:\@SAI\151--200\154\002\Wrd\Report\S7.doc\052108
F. Effluent Disinfection
1. Replace chlorination and dechlorination with ultraviolet light disinfection. 2. Reuse contact tank for UV installation.
G. Effluent DO and pH Control
1. Routinely monitor the wastewater DO and pH downstream of the aeration basins to determine how DO and pH change through the remaining basins. Based on this monitoring:
a. Install a cascade aeration system downstream of the dechlorination
basin. This will serve to increase DO and also release CO2 to raise the effluent pH.
b. If needed, remove the final stage concrete deck from each HPO train, which will serve to release CO2 and raise the effluent pH.
H. Peak Flow Management
1. Convert trickling filter structures to off-line flow equalization downstream of primary clarification.
2. Modify HPO basins to all operation in contact stabilization mode of activated sludge.
I. Sampling and Flow Metering
1. Provide two new influent samplers. 2. Provide new effluent sampler and sampling enclosure near the chlorine contact
tank.
J. Residuals Management
1. Decommission the fluid bed incinerators. 2. Construct new anaerobic digestion facilities (TPAD). 3. Install new WAS thickening equipment in the existing incinerator building. 4. Rehabilitate the WAS storage tanks and provide new WAS storage aeration
equipment. 5. Provide two new dewatering centrifuges; remove one existing centrifuge (use for
parts) and belt filter press. 6. Convert existing incinerator building to biosolids cake storage and load-out
facilities. 7. Consider electrical generation for biogas.
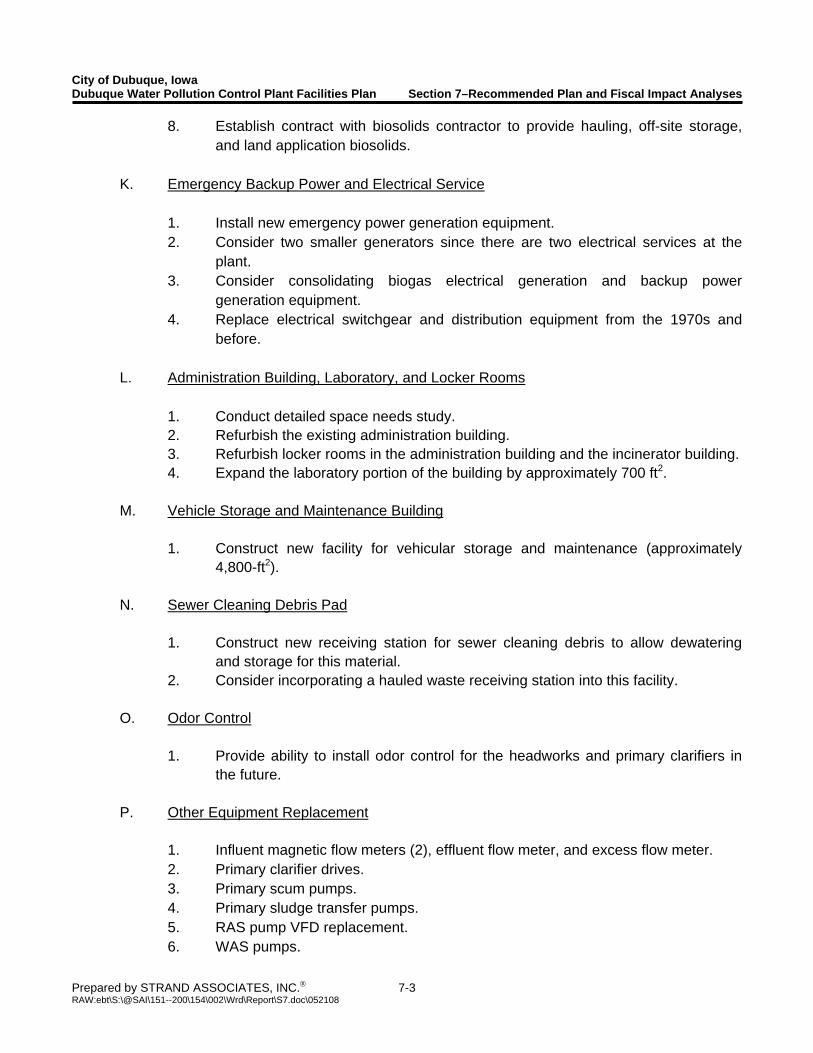
City of Dubuque, Iowa Dubuque Water Pollution Control Plant Facilities Plan Section 7–Recommended Plan and Fiscal Impact Analyses
Prepared by STRAND ASSOCIATES, INC.® 7-3 RAW:ebt\S:\@SAI\151--200\154\002\Wrd\Report\S7.doc\052108
8. Establish contract with biosolids contractor to provide hauling, off-site storage, and land application biosolids.
K. Emergency Backup Power and Electrical Service
1. Install new emergency power generation equipment. 2. Consider two smaller generators since there are two electrical services at the
plant. 3. Consider consolidating biogas electrical generation and backup power
generation equipment. 4. Replace electrical switchgear and distribution equipment from the 1970s and
before.
L. Administration Building, Laboratory, and Locker Rooms
1. Conduct detailed space needs study. 2. Refurbish the existing administration building. 3. Refurbish locker rooms in the administration building and the incinerator building. 4. Expand the laboratory portion of the building by approximately 700 ft2.
M. Vehicle Storage and Maintenance Building
1. Construct new facility for vehicular storage and maintenance (approximately 4,800-ft2).
N. Sewer Cleaning Debris Pad
1. Construct new receiving station for sewer cleaning debris to allow dewatering and storage for this material.
2. Consider incorporating a hauled waste receiving station into this facility.
O. Odor Control
1. Provide ability to install odor control for the headworks and primary clarifiers in the future.
P. Other Equipment Replacement
1. Influent magnetic flow meters (2), effluent flow meter, and excess flow meter. 2. Primary clarifier drives. 3. Primary scum pumps. 4. Primary sludge transfer pumps. 5. RAS pump VFD replacement. 6. WAS pumps.
City of Dubuque, Iowa Dubuque Water Pollution Control Plant Facilities Plan Section 7–Recommended Plan and Fiscal Impact Analyses
Prepared by STRAND ASSOCIATES, INC.® 7-4 RAW:ebt\S:\@SAI\151--200\154\002\Wrd\Report\S7.doc\052108
7. In-plant waste/recycle pumps. 8. Plant effluent/process water pump. 9. HVAC systems.
Q. Miscellaneous Piping, Valves, Mechanical and Other Components
1. Influent channel gates. 2. Primary clarifier splitter gates. 3. MLSS splitter gates. 4. Final clarifier influent splitter gates. 5. Reroute in-plant waste/recycle pump discharge upstream of the influent screens. 6. New septage/hauled waste receiving station. 7. New roofs on existing buildings.
7.02 OPINION OF CAPITAL COSTS AND PROJECT FINANCING The opinion of capital costs for the recommended improvements is approximately $48 million (December 2007 costs basis). Projecting this amount to an anticipated fall 2009 bid date, and applying a construction inflation rate of 4 percent annually, the anticipated total project costs are approximately $52.2 million. Table 7.02-1 presents a summary of the opinion of capital costs. The WPCP improvements are anticipated to be financed entirely through Iowa’s State Revolving Fund (SRF) loan program. The SRF program provides 0 percent interest financing for up to three years for planning and design services. These loans can be rolled into the SRF construction loan. Construction loans are offered at 3 percent interest, typically for 20 years although terms of up to 30 years can be accommodated. In addition to the 3 percent loan interest, an administrative fee of 0.25 percent is added each year to the outstanding principal balance for administering the loan. Also, an additional 1 percent of the loan amount is included as a loan initiation fee. Assuming a total loan amount of $52.2 million, plus the initiation fee of $522,000, the annual debt service payment is expected to be approximately $3.6 million. If cogeneration equipment (generator set, heat recovery, gas conditioning) is included in the project, the anticipated loan would be increased by approximately $1.5 to $2.0 million, and the annual debt service would increase to approximately $3.8 million. 7.03 OPINION OF OPERATION, MAINTENANCE, AND REPLACEMENT COSTS The recommended plan will have an impact on the overall operating budget for the Dubuque WPCP. Table 7.03-1 presents the proposed operating budget for fiscal year 2013 (July 2012-June 2013), which is the first full year of operation of the facilities in the recommended plan. This table presents only the key changes between the proposed 2006/2007 budget and the projected 2012/2013 budget. The remaining budget elements are anticipated to remain the same but are adjusted for inflation at an assumed inflation rate of 2.5 percent annually. Key changes in the proposed budget include a minor
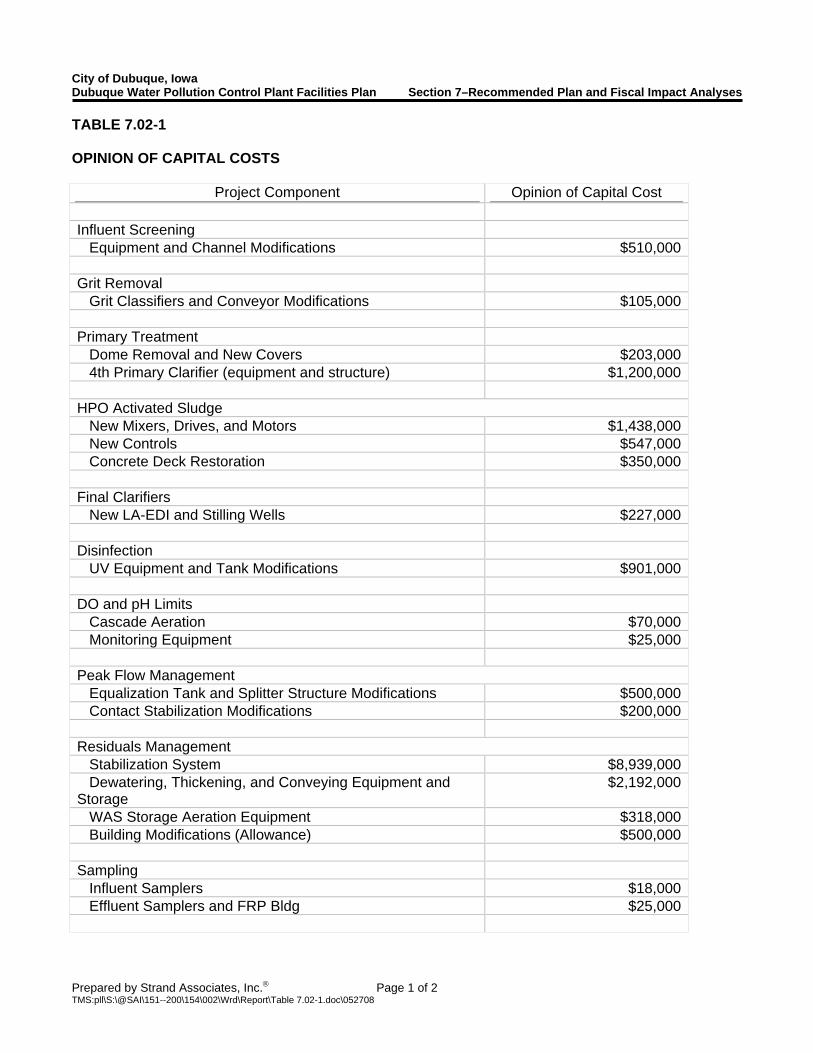
City of Dubuque, Iowa Dubuque Water Pollution Control Plant Facilities Plan Section 7–Recommended Plan and Fiscal Impact Analyses
Prepared by Strand Associates, Inc.® Page 1 of 2 TMS:pll\S:\@SAI\151--200\154\002\Wrd\Report\Table 7.02-1.doc\052708
TABLE 7.02-1 OPINION OF CAPITAL COSTS
Project Component Opinion of Capital Cost
Influent Screening Equipment and Channel Modifications $510,000
Grit Removal Grit Classifiers and Conveyor Modifications $105,000
Primary Treatment Dome Removal and New Covers $203,000 4th Primary Clarifier (equipment and structure) $1,200,000
HPO Activated Sludge New Mixers, Drives, and Motors $1,438,000 New Controls $547,000 Concrete Deck Restoration $350,000
Final Clarifiers New LA-EDI and Stilling Wells $227,000
Disinfection UV Equipment and Tank Modifications $901,000
DO and pH Limits Cascade Aeration $70,000 Monitoring Equipment $25,000
Peak Flow Management Equalization Tank and Splitter Structure Modifications $500,000 Contact Stabilization Modifications $200,000
Residuals Management Stabilization System $8,939,000 Dewatering, Thickening, and Conveying Equipment and Storage
$2,192,000
WAS Storage Aeration Equipment $318,000 Building Modifications (Allowance) $500,000
Sampling Influent Samplers $18,000 Effluent Samplers and FRP Bldg $25,000
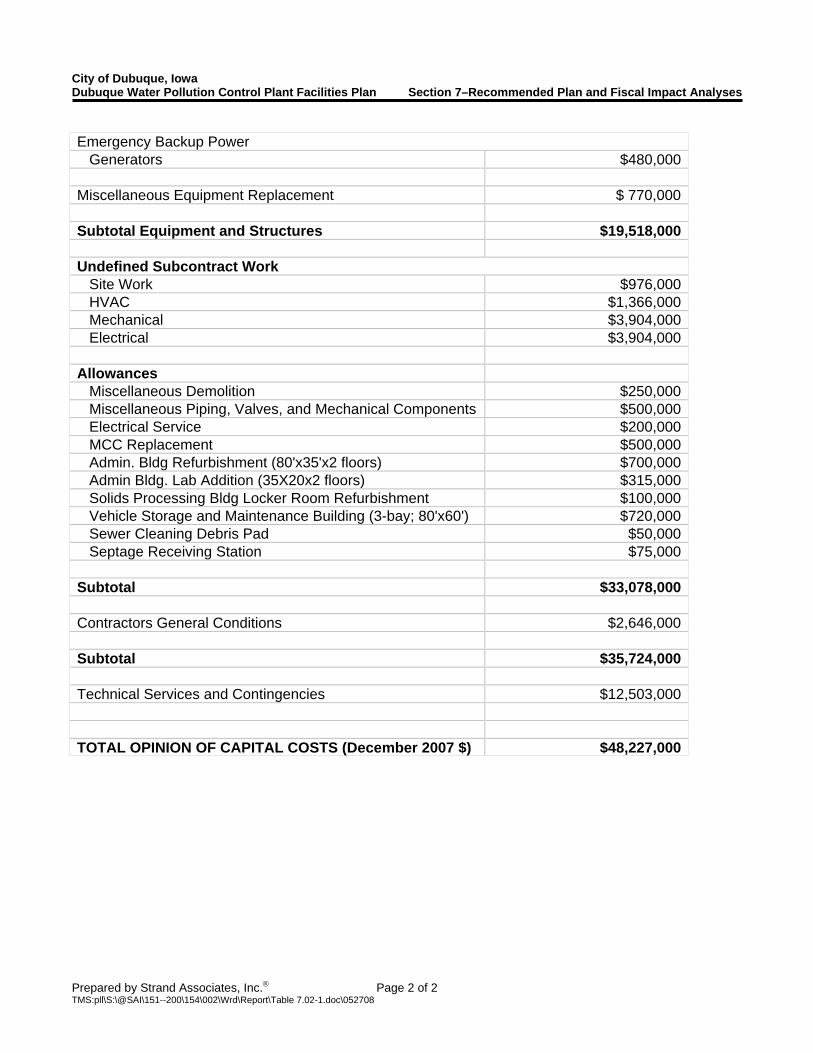
City of Dubuque, Iowa Dubuque Water Pollution Control Plant Facilities Plan Section 7–Recommended Plan and Fiscal Impact Analyses
Prepared by Strand Associates, Inc.® Page 2 of 2 TMS:pll\S:\@SAI\151--200\154\002\Wrd\Report\Table 7.02-1.doc\052708
Emergency Backup Power Generators $480,000
Miscellaneous Equipment Replacement $ 770,000
Subtotal Equipment and Structures $19,518,000
Undefined Subcontract Work Site Work $976,000 HVAC $1,366,000 Mechanical $3,904,000 Electrical $3,904,000
Allowances Miscellaneous Demolition $250,000 Miscellaneous Piping, Valves, and Mechanical Components $500,000 Electrical Service $200,000 MCC Replacement $500,000 Admin. Bldg Refurbishment (80'x35'x2 floors) $700,000 Admin Bldg. Lab Addition (35X20x2 floors) $315,000 Solids Processing Bldg Locker Room Refurbishment $100,000 Vehicle Storage and Maintenance Building (3-bay; 80'x60') $720,000 Sewer Cleaning Debris Pad $50,000 Septage Receiving Station $75,000
Subtotal $33,078,000
Contractors General Conditions $2,646,000
Subtotal $35,724,000
Technical Services and Contingencies $12,503,000
TOTAL OPINION OF CAPITAL COSTS (December 2007 $) $48,227,000
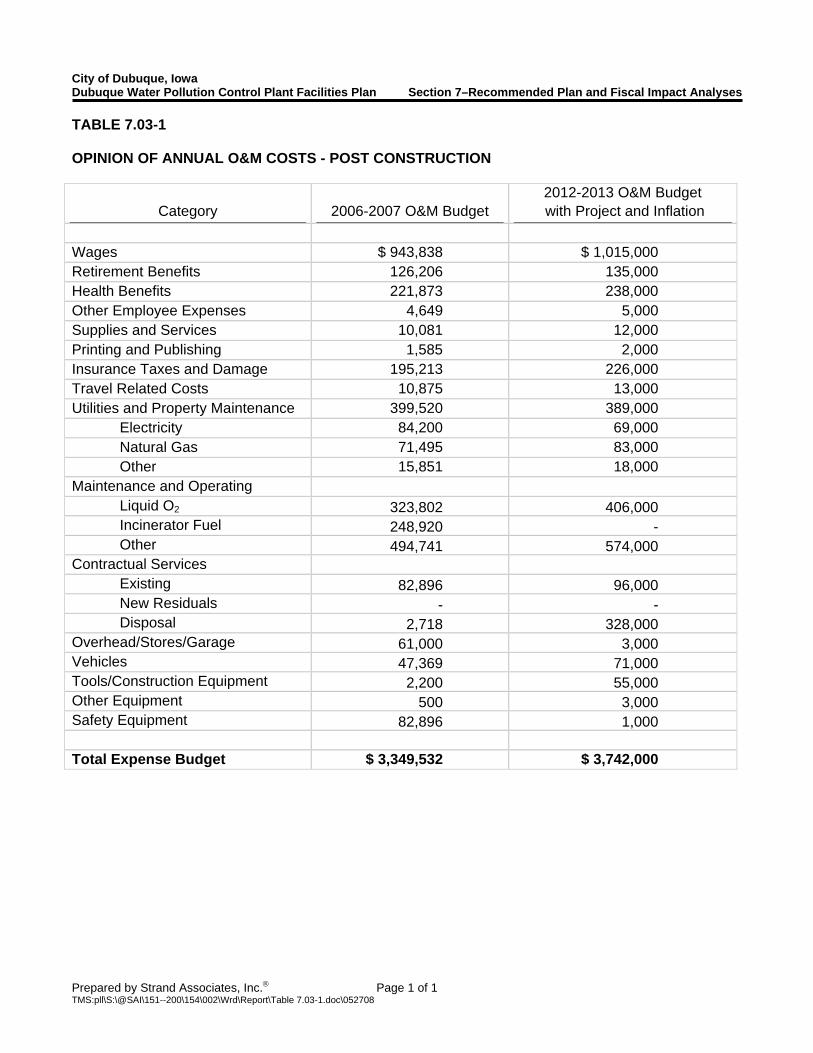
City of Dubuque, Iowa Dubuque Water Pollution Control Plant Facilities Plan Section 7–Recommended Plan and Fiscal Impact Analyses
Prepared by Strand Associates, Inc.® Page 1 of 1 TMS:pll\S:\@SAI\151--200\154\002\Wrd\Report\Table 7.03-1.doc\052708
TABLE 7.03-1 OPINION OF ANNUAL O&M COSTS - POST CONSTRUCTION
Category 2006-2007 O&M Budget 2012-2013 O&M Budget with Project and Inflation
Wages $ 943,838 $ 1,015,000 Retirement Benefits 126,206 135,000 Health Benefits 221,873 238,000 Other Employee Expenses 4,649 5,000 Supplies and Services 10,081 12,000 Printing and Publishing 1,585 2,000 Insurance Taxes and Damage 195,213 226,000 Travel Related Costs 10,875 13,000 Utilities and Property Maintenance 399,520 389,000 Electricity 84,200 69,000 Natural Gas 71,495 83,000 Other 15,851 18,000 Maintenance and Operating Liquid O2 323,802 406,000 Incinerator Fuel 248,920 - Other 494,741 574,000 Contractual Services Existing 82,896 96,000 New Residuals - - Disposal 2,718 328,000 Overhead/Stores/Garage 61,000 3,000 Vehicles 47,369 71,000 Tools/Construction Equipment 2,200 55,000 Other Equipment 500 3,000 Safety Equipment 82,896 1,000 Total Expense Budget $ 3,349,532 $ 3,742,000
City of Dubuque, Iowa Dubuque Water Pollution Control Plant Facilities Plan Section 7–Recommended Plan and Fiscal Impact Analyses
Prepared by STRAND ASSOCIATES, INC.® 7-5 RAW:ebt\S:\@SAI\151--200\154\002\Wrd\Report\S7.doc\052108
reduction in overall staffing and fringe benefits through anticipated attrition (although with inflation adjustment labor and benefits costs are still projected to be higher), a reduction in the amount of energy and fuel required for biosolids stabilization, and an increase in the costs for biosolids disposal. For fiscal year 2013, the projected annual O&M budget is approximately $3.7 million. If cogeneration equipment is included in the project, the annual O&M cost for the WPCP would decrease since the cogeneration facilities would provide electricity to be used at the plant. The annual electricity savings could be in the range of $150,000 to $200,000 less O&M costs associated with the cogeneration system. An equipment replacement fund, while not a requirement of the SRF loan program, could be initiated by the City to provide funds for future equipment replacement. Payments to this fund would be made annually from sewer fees, and these funds would then be used in the future as needed. Preliminary payment ranges to such a fund are in the range of $300,000 to $500,000 annually. However, the existing WPCP budget has significant funding already included for equipment maintenance and replacement, and some of those currently budgeted items would offset the payments noted above. The actual amount budgeted for equipment replacement will be determined by the City on an annual basis. 7.04 SEWER USE RATE IMPACT OF RECOMMENDED PLAN The current fiscal sewer use rates for the City of Dubuque are $2.26 per 100 ft3 of water used. For a typical residential connection using 800 ft3/month, the current monthly sewer bill is approximately $18/month. Based on the City’s preliminary sewer rate analyses, implementation of the recommended plan is expected to increase average sewer use rates by 50 to 55 percent above current rates to approximately $28/month. 7.05 PROJECT IMPLEMENTATION SCHEDULE The preliminary project implementation schedule is included below and assumes a single construction project. In addition, the schedule assumes an approximate two-month review and approval duration by the IDNR for the facilities plan and future design documents. Facilities Plan Submittal to DNR June 2008Public Hearing July 2008DNR Approval August 2008Begin Design August 2008Submit Design Documents to DNR Summer 2009Construction Bid Date Fall 2009Construction Completion December 2012

APPENDIX A CITY OF DUBUQUE WPCP NPDES PERMIT
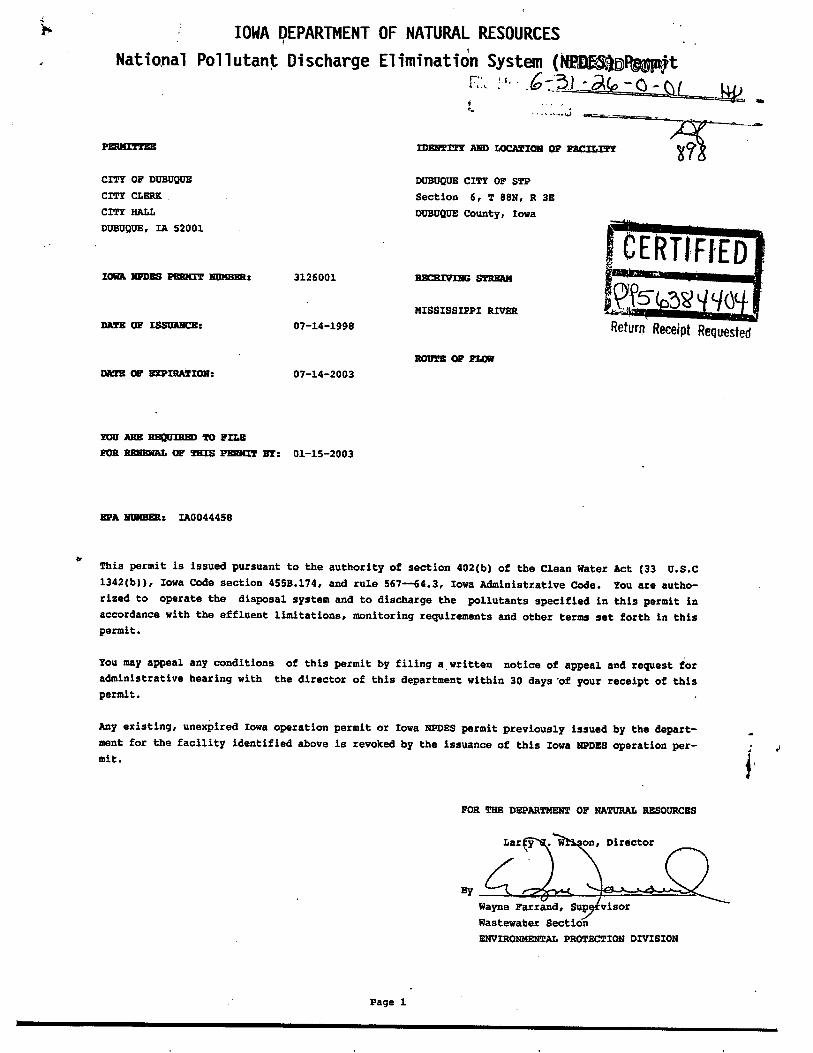
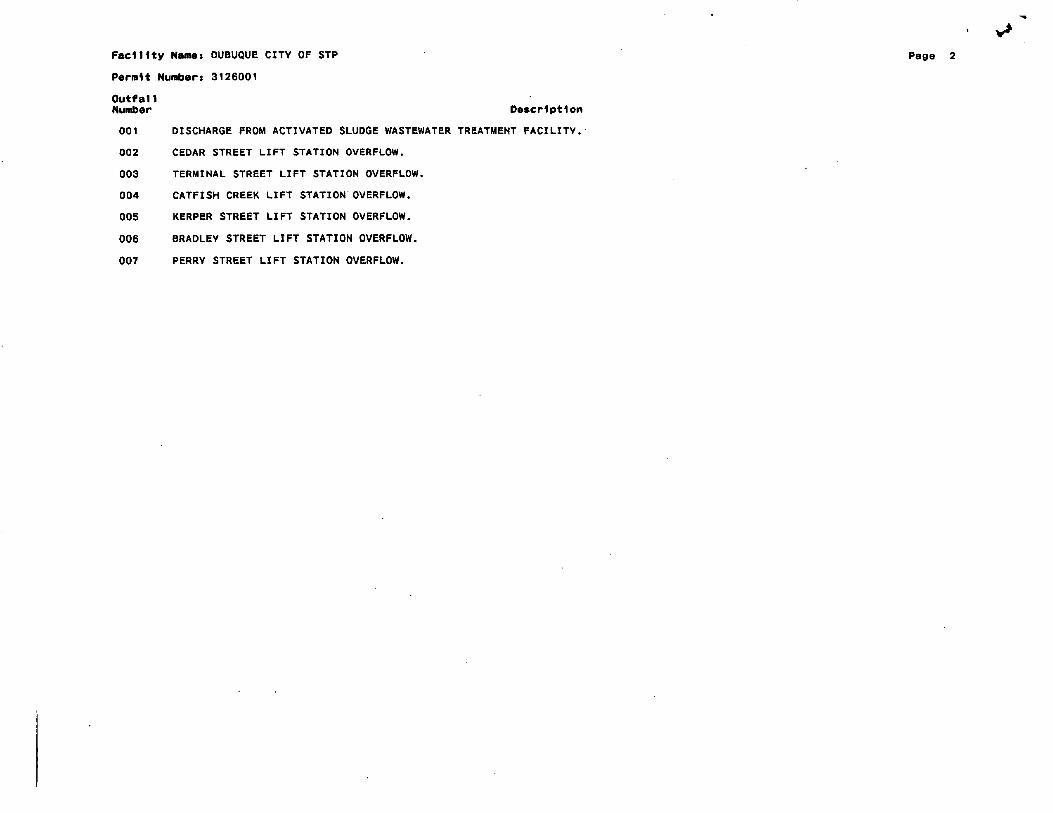
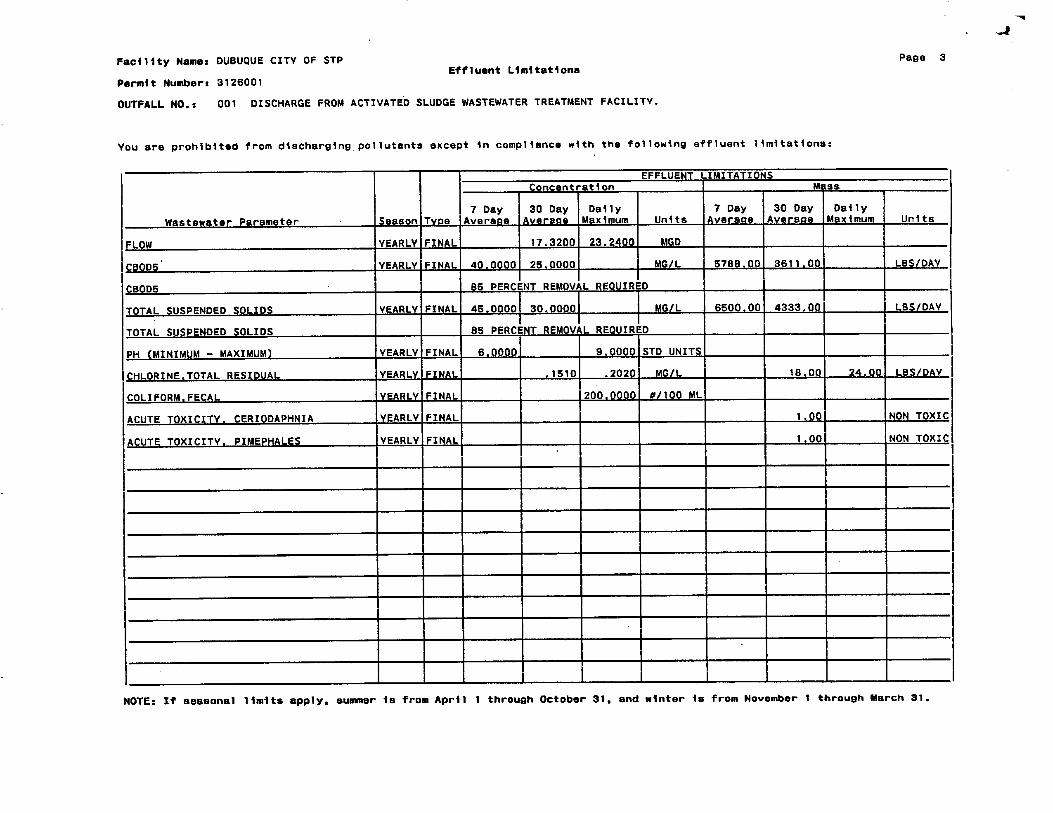
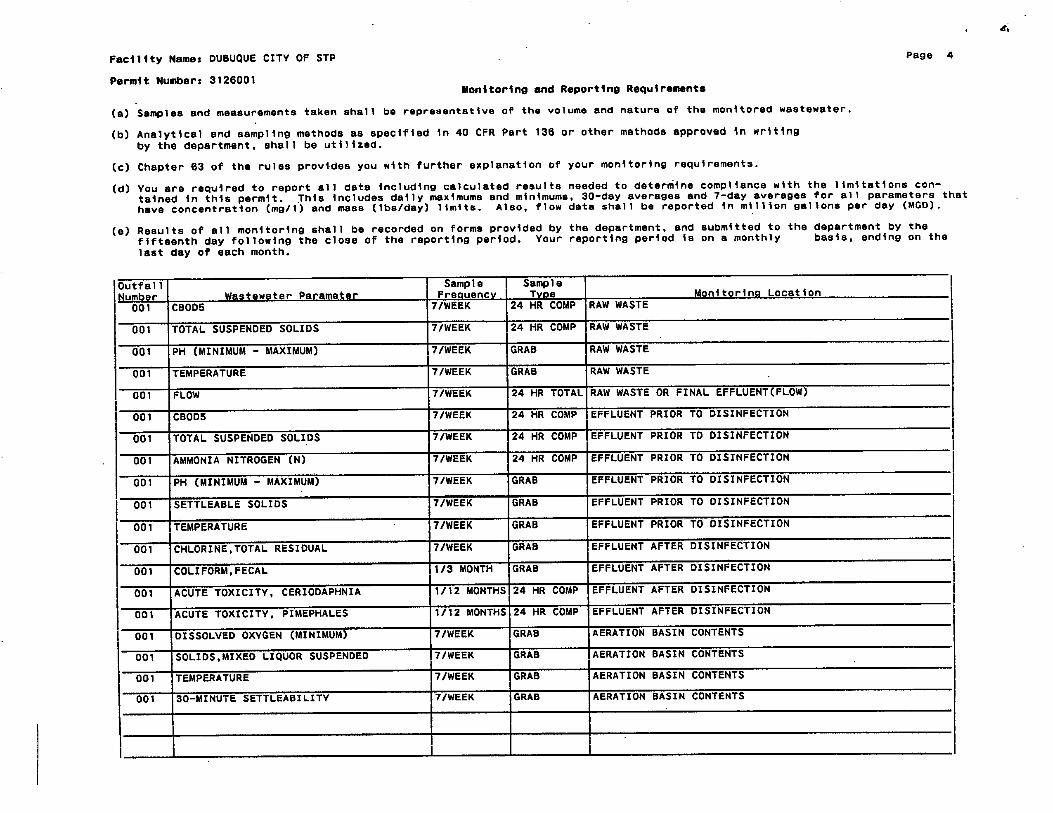
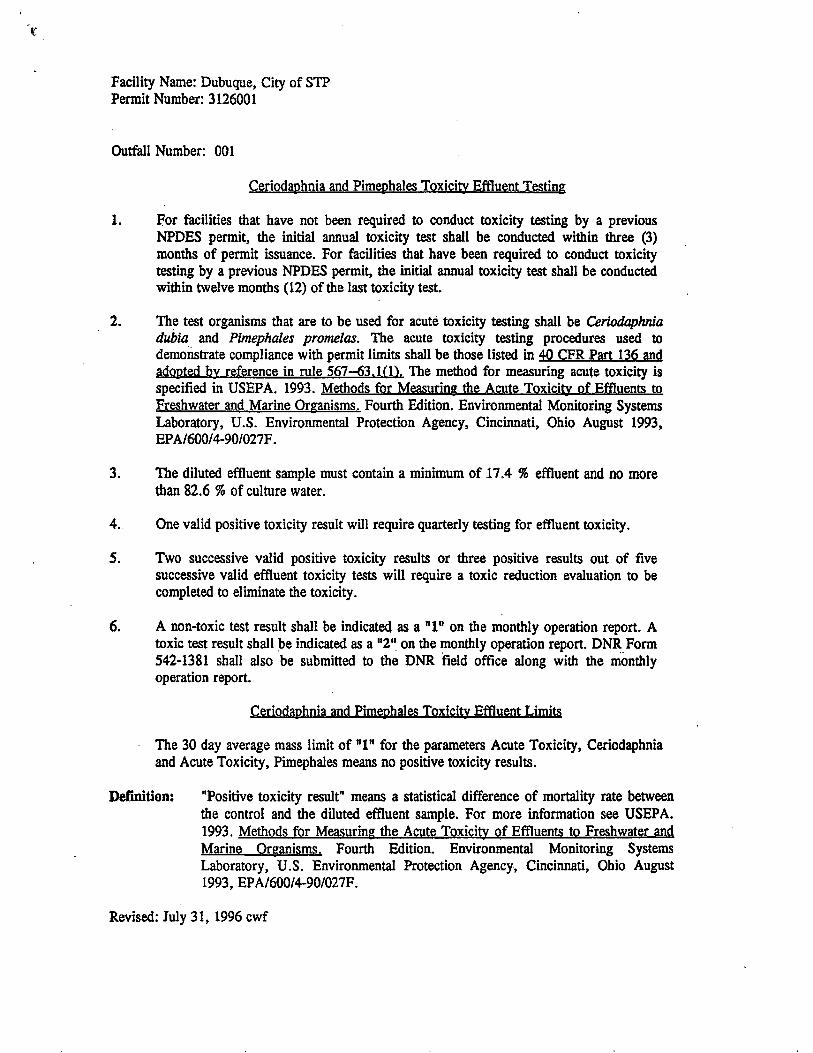
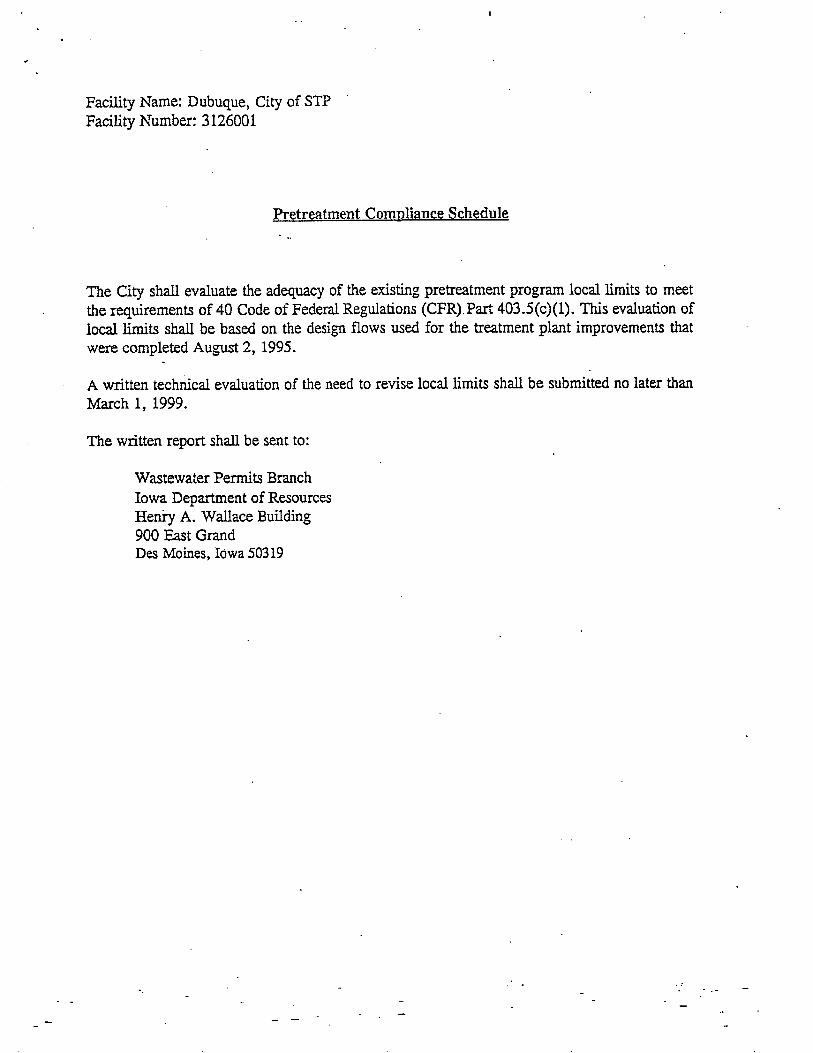
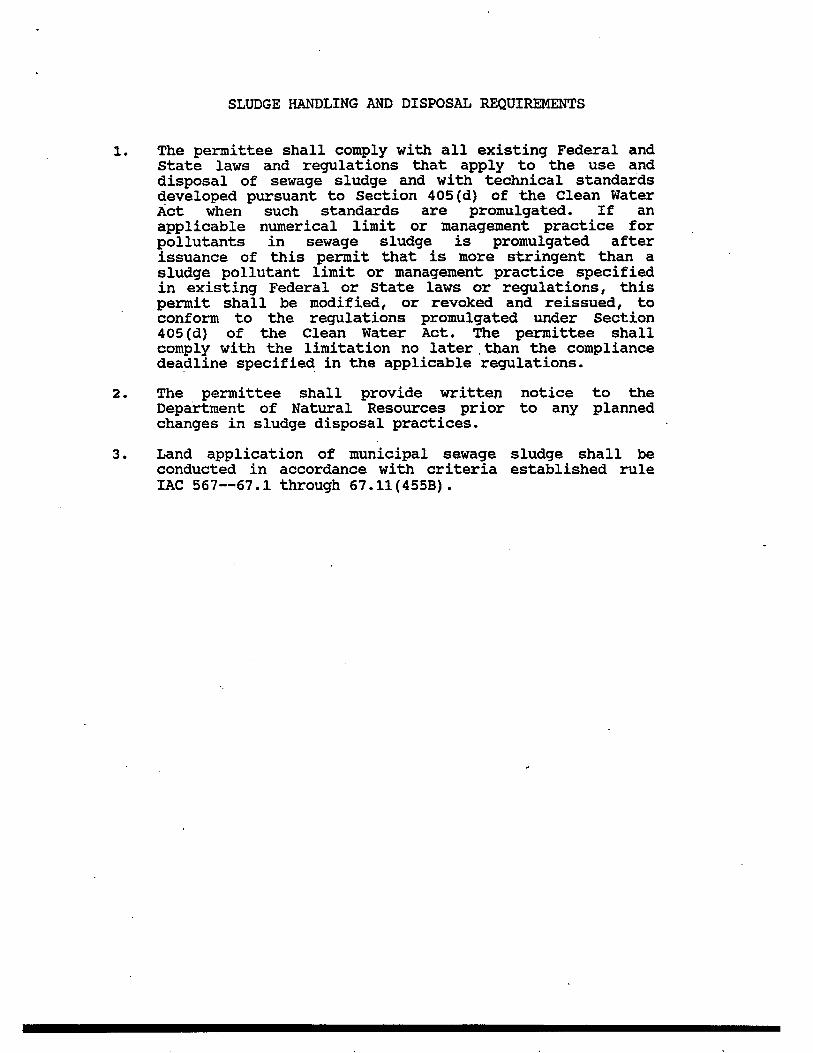
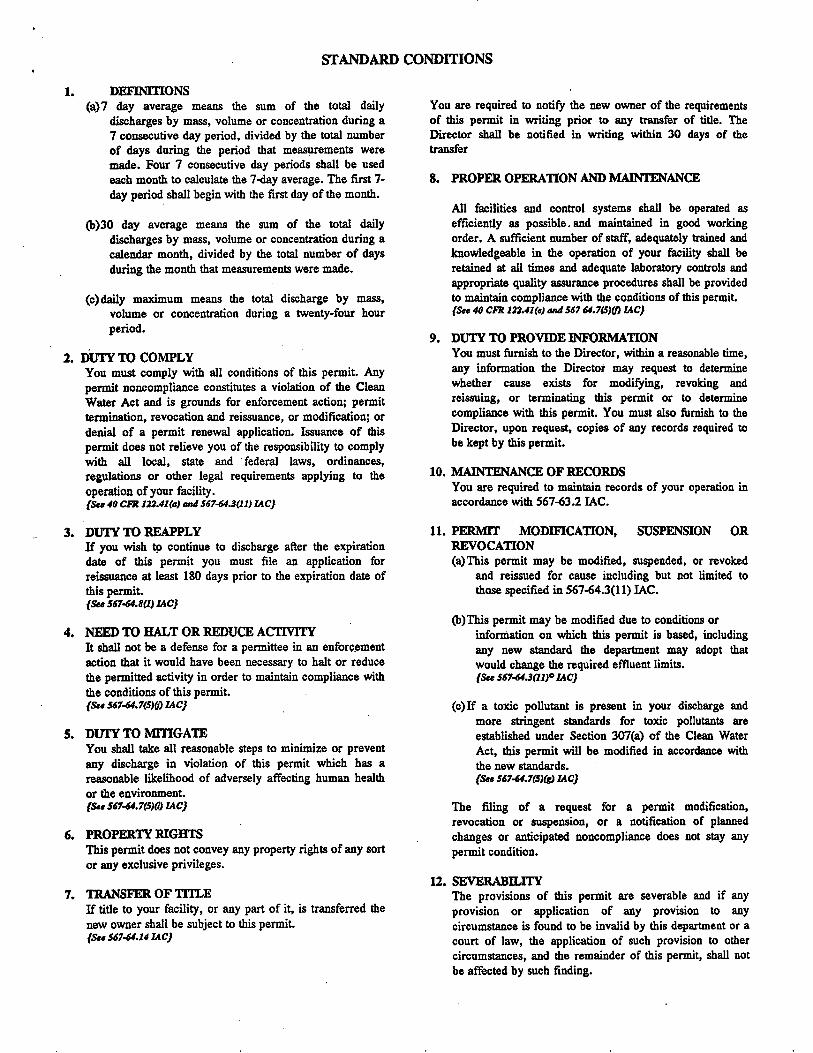
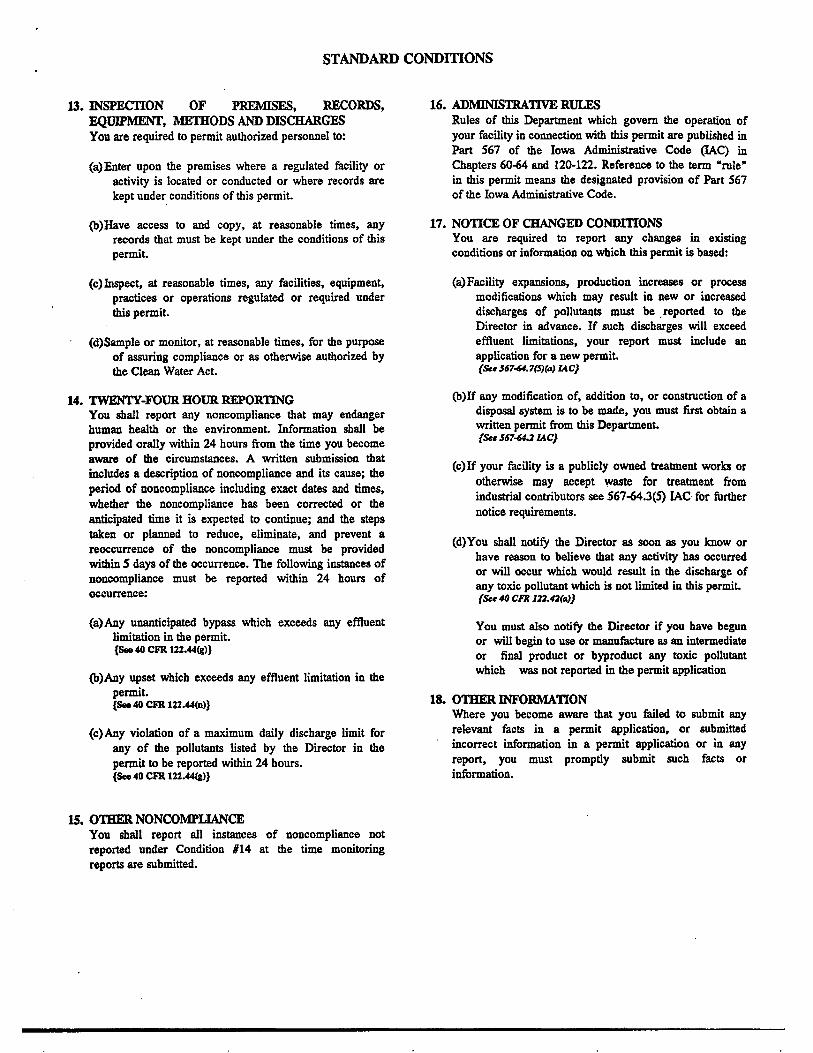
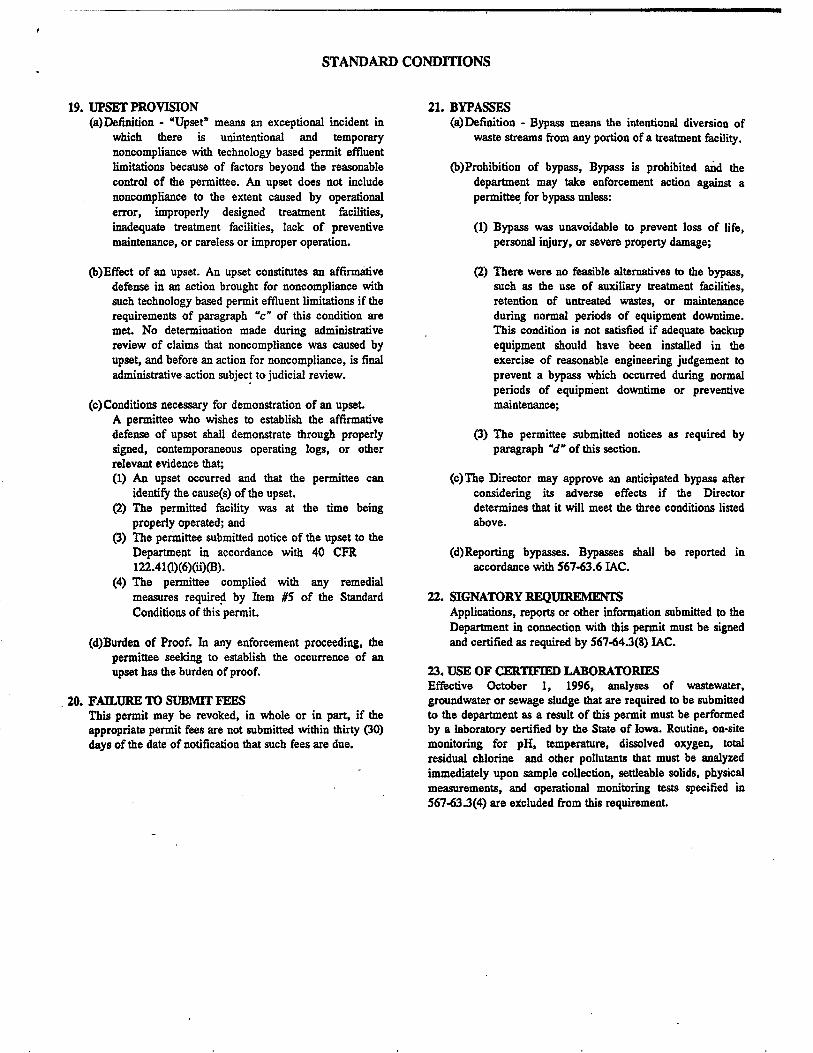

APPENDIX B ANTICIPATED WLA/PERMIT LIMITS FOR DUBUQUE WPCP
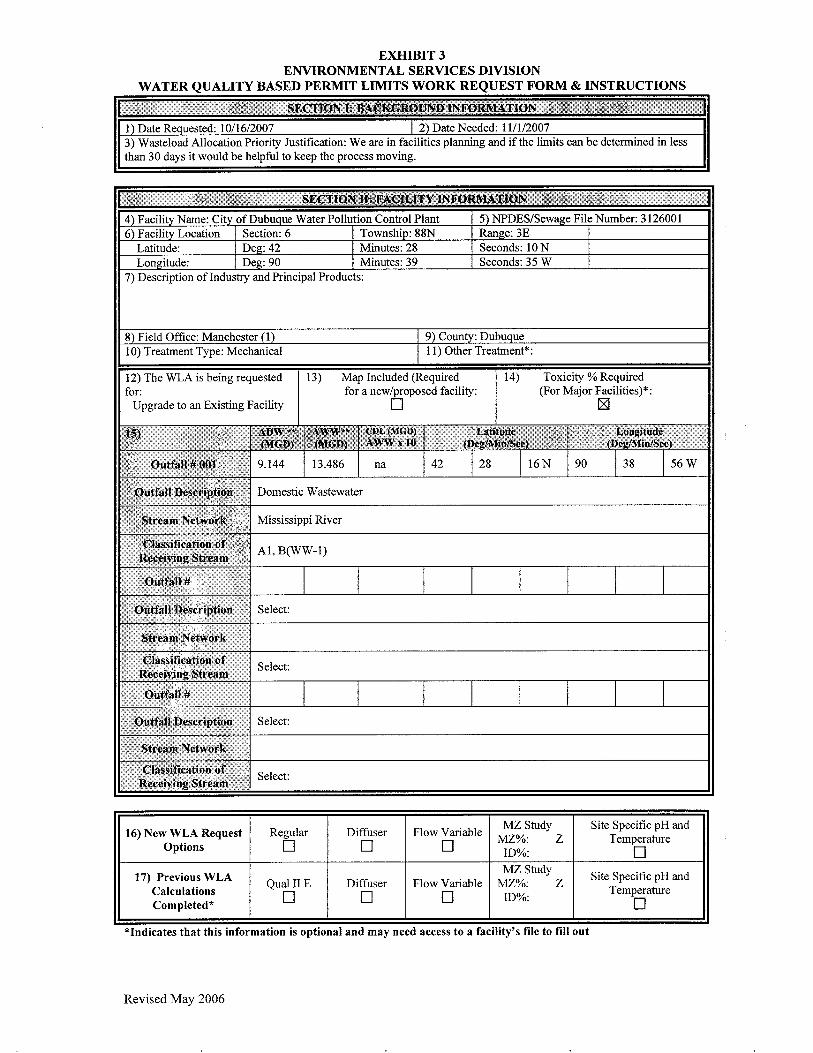
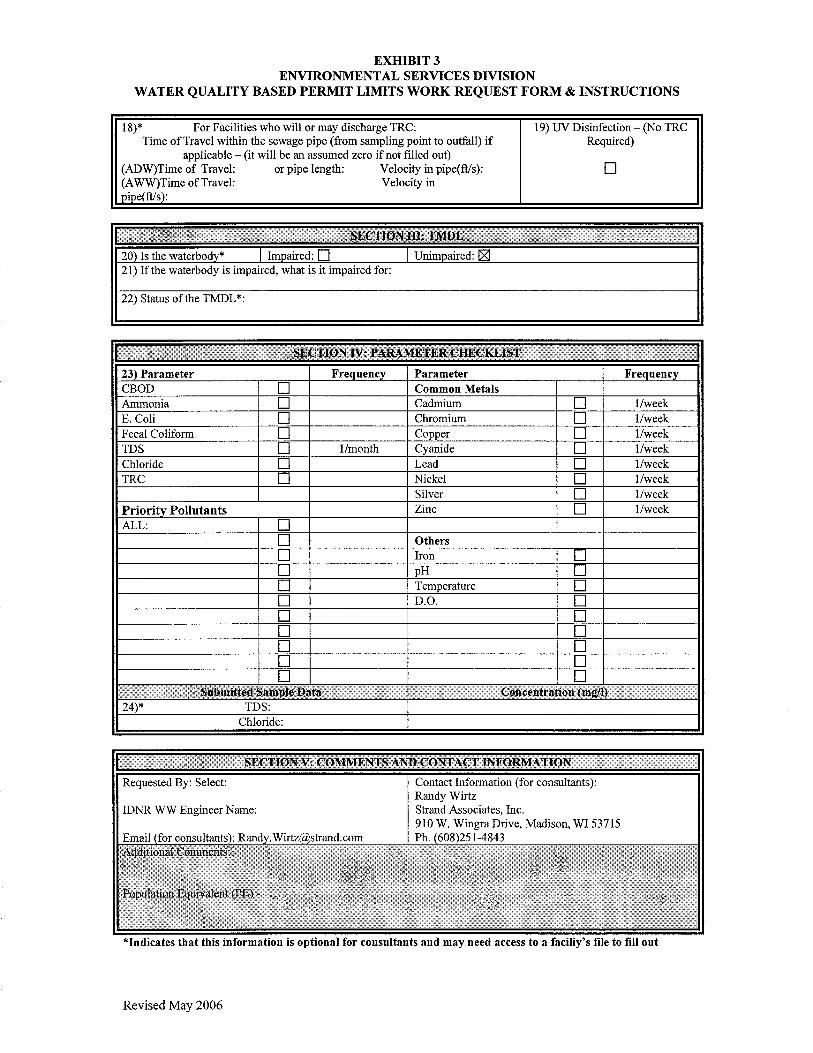
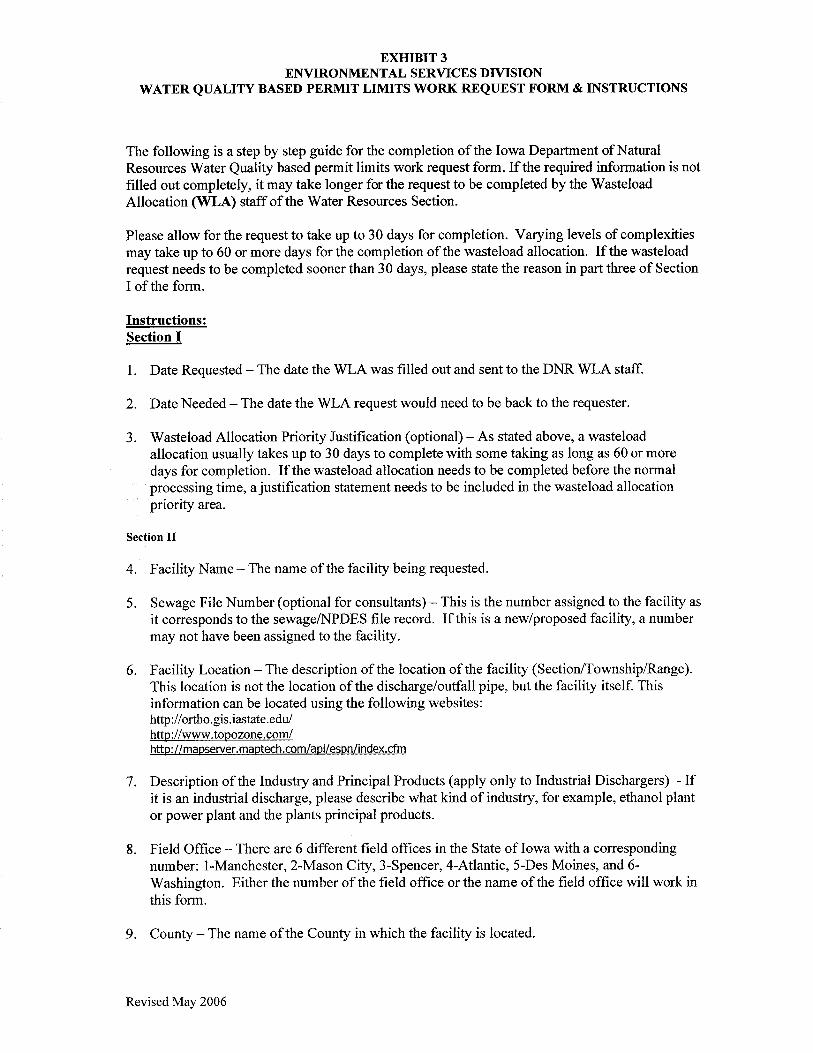
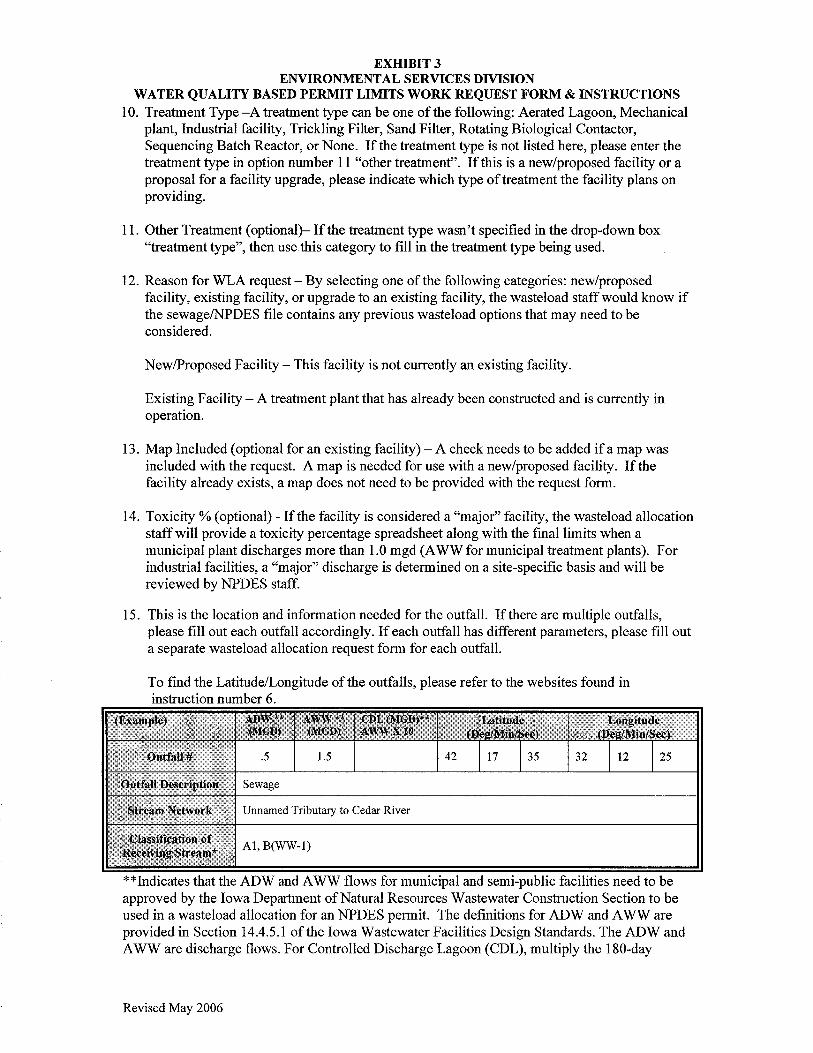

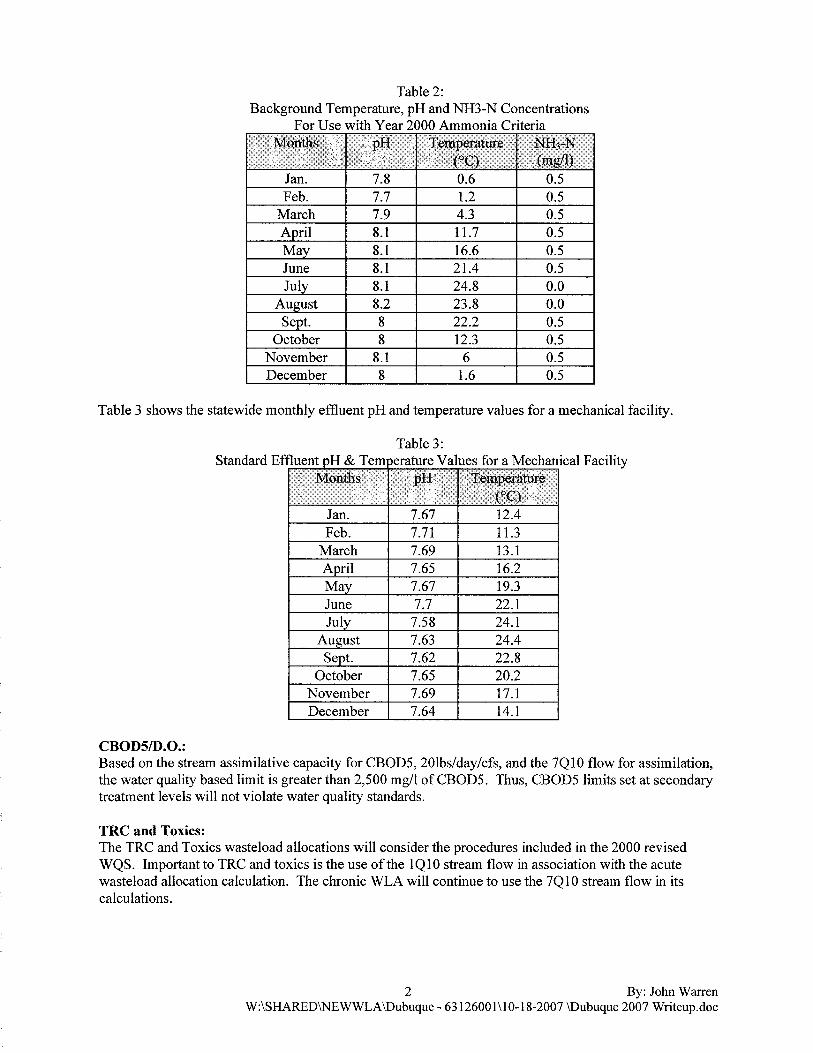
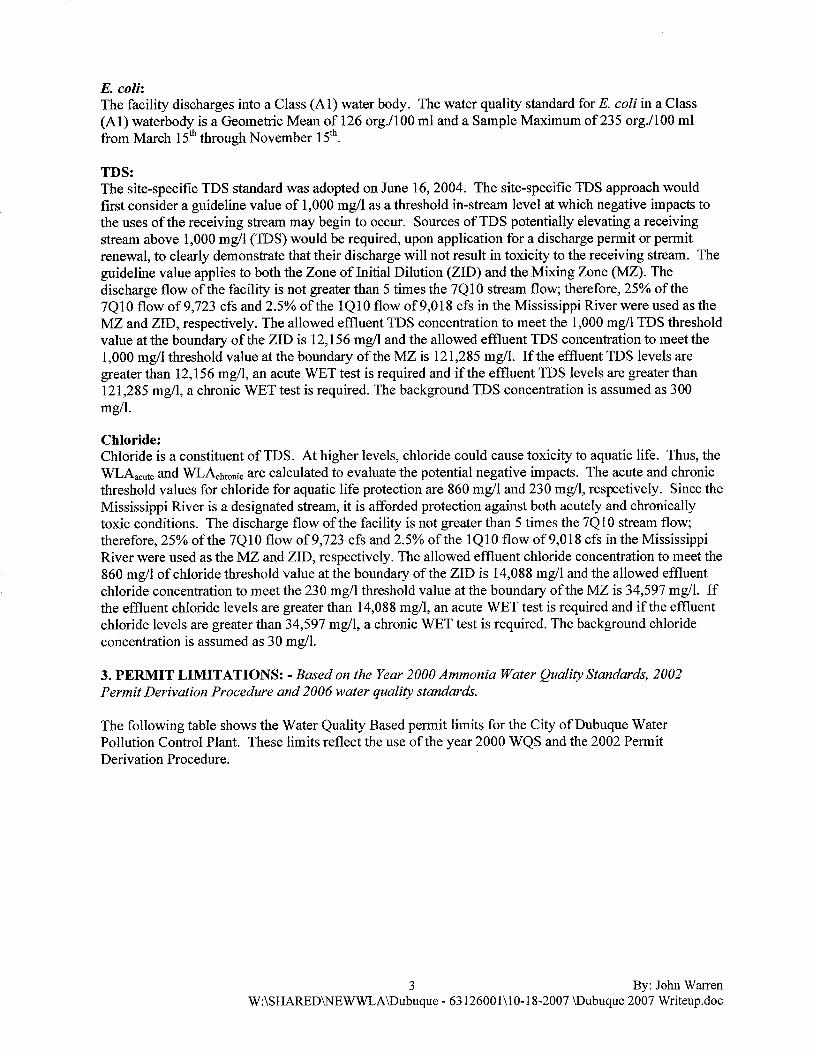
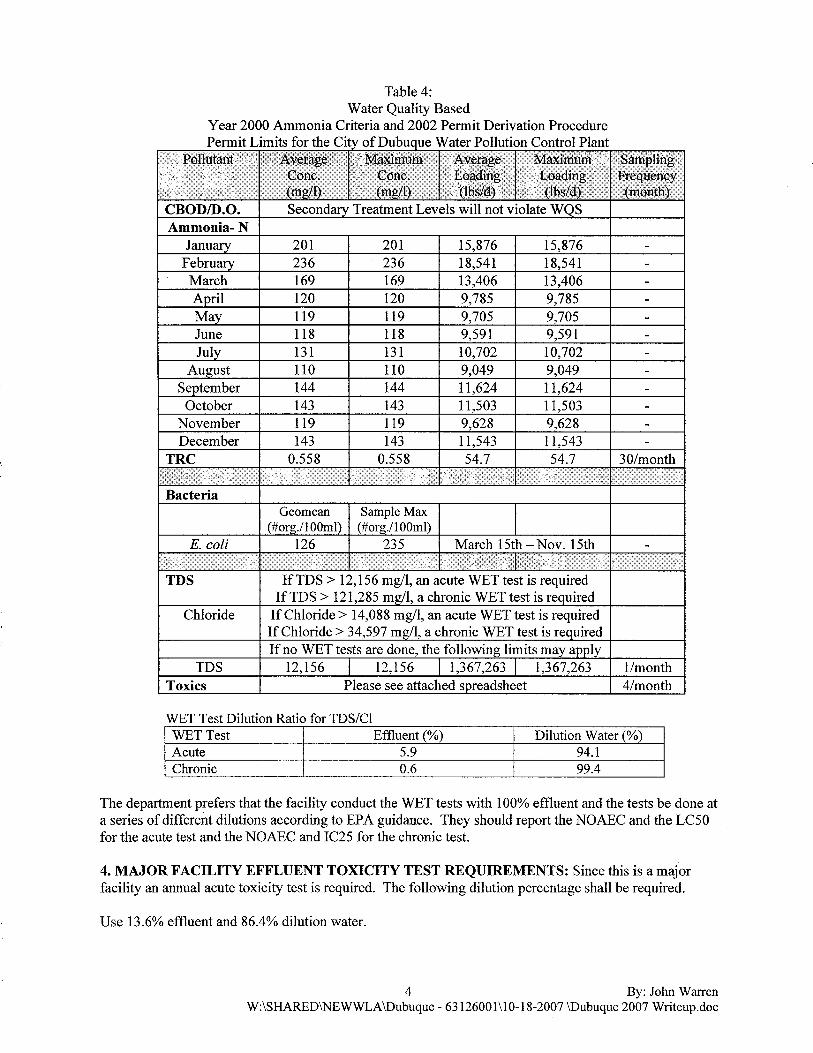
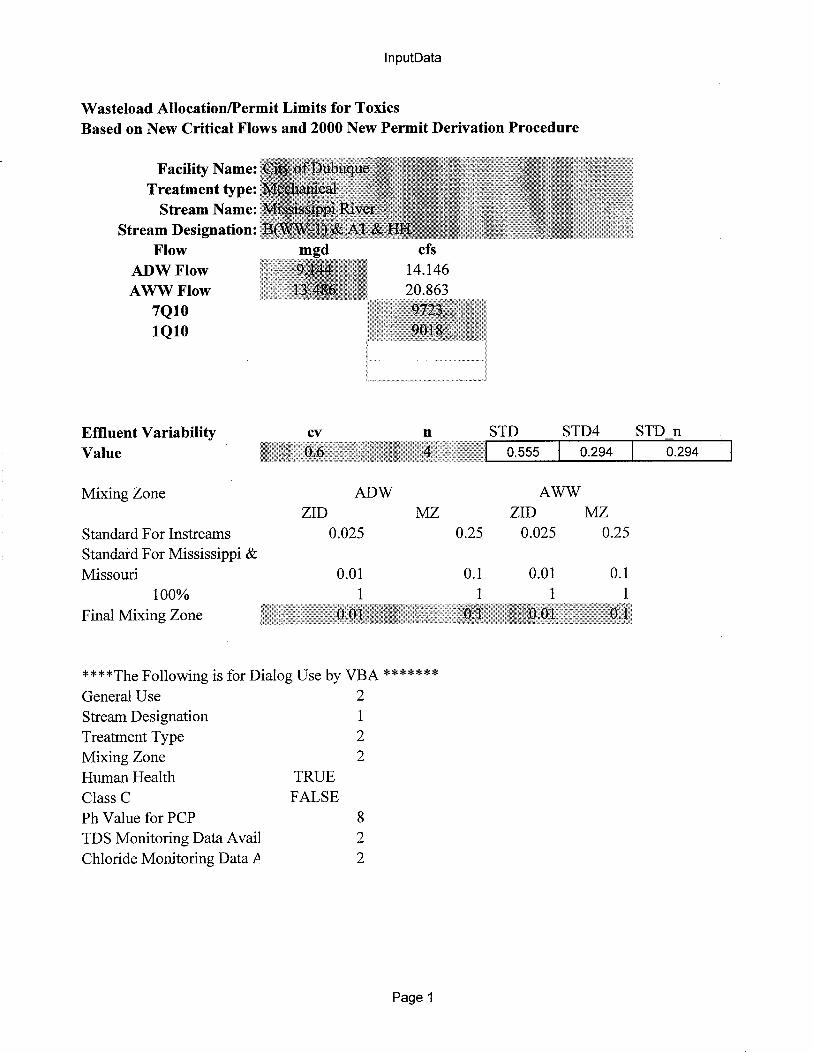
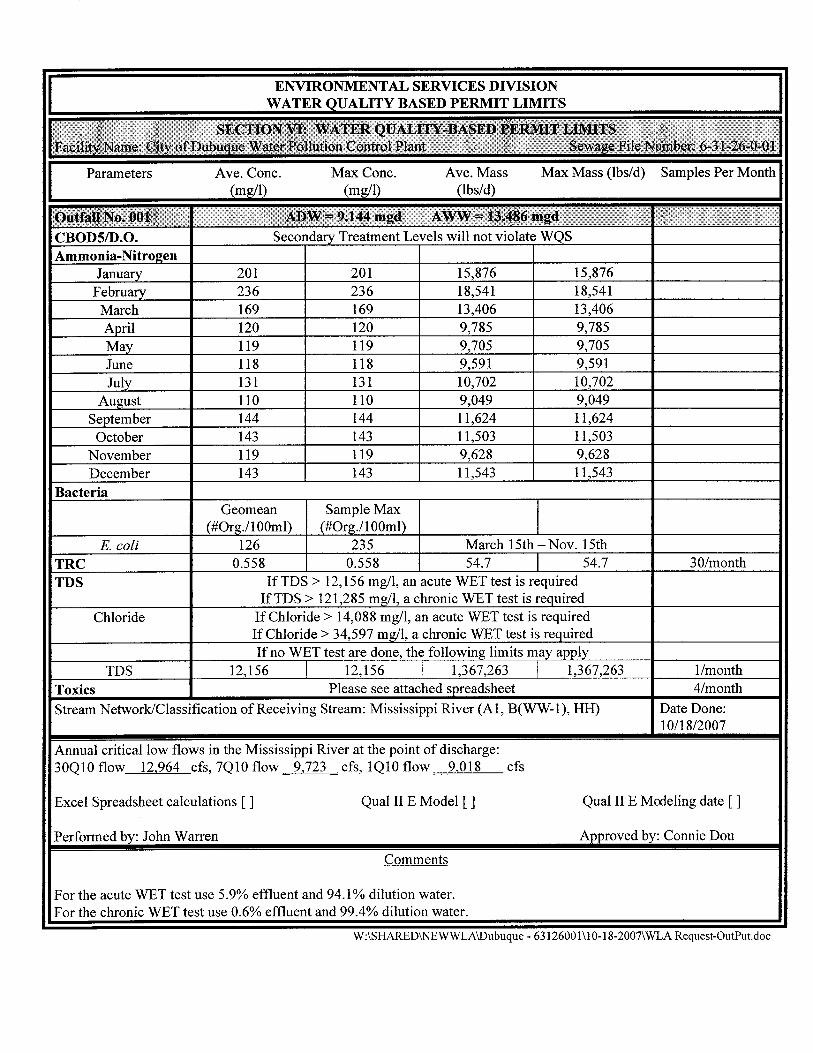
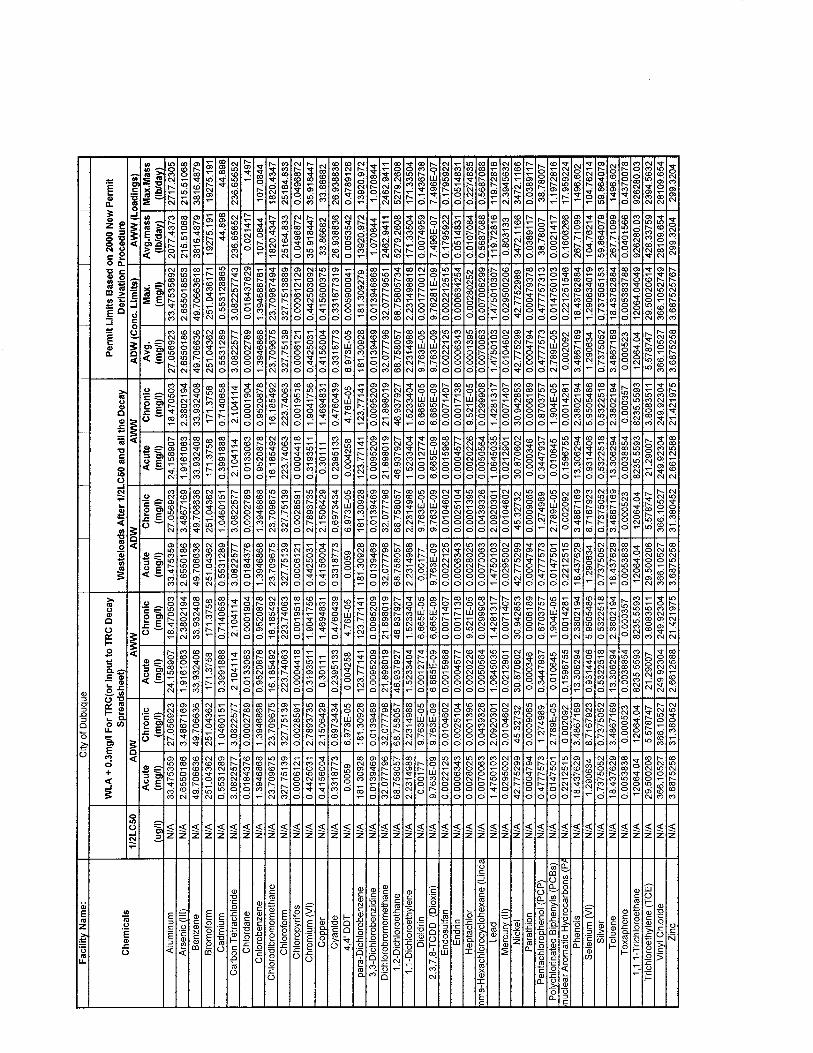
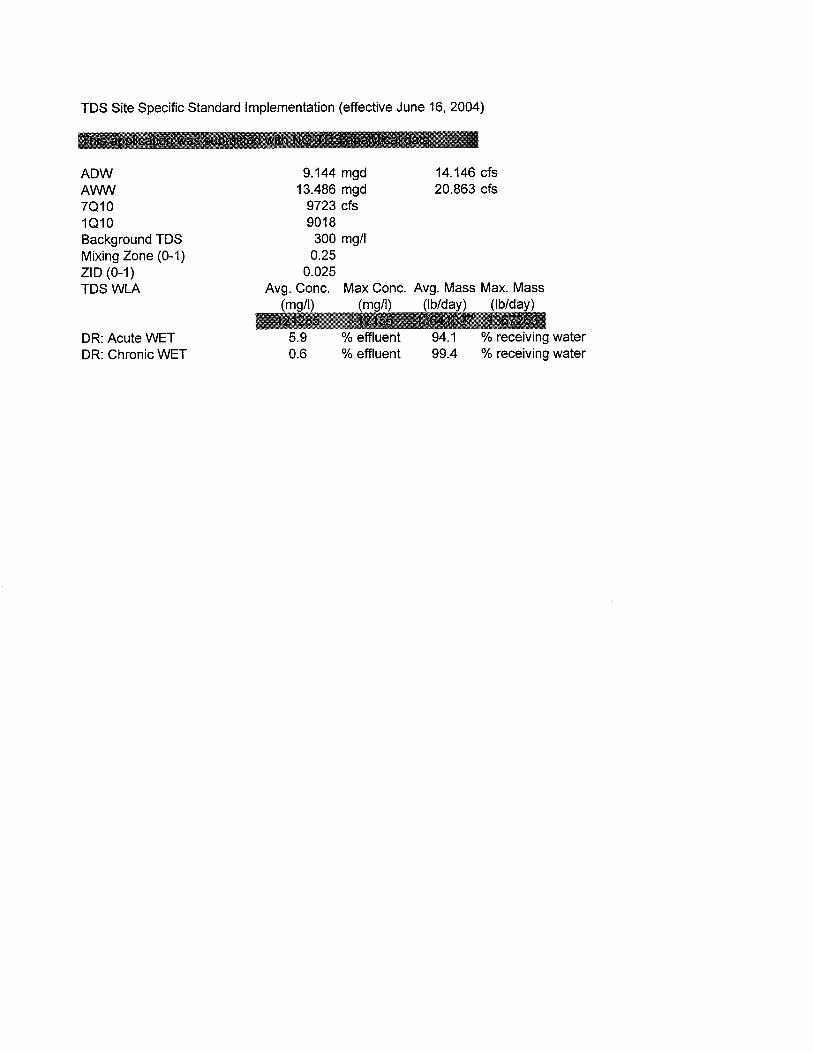
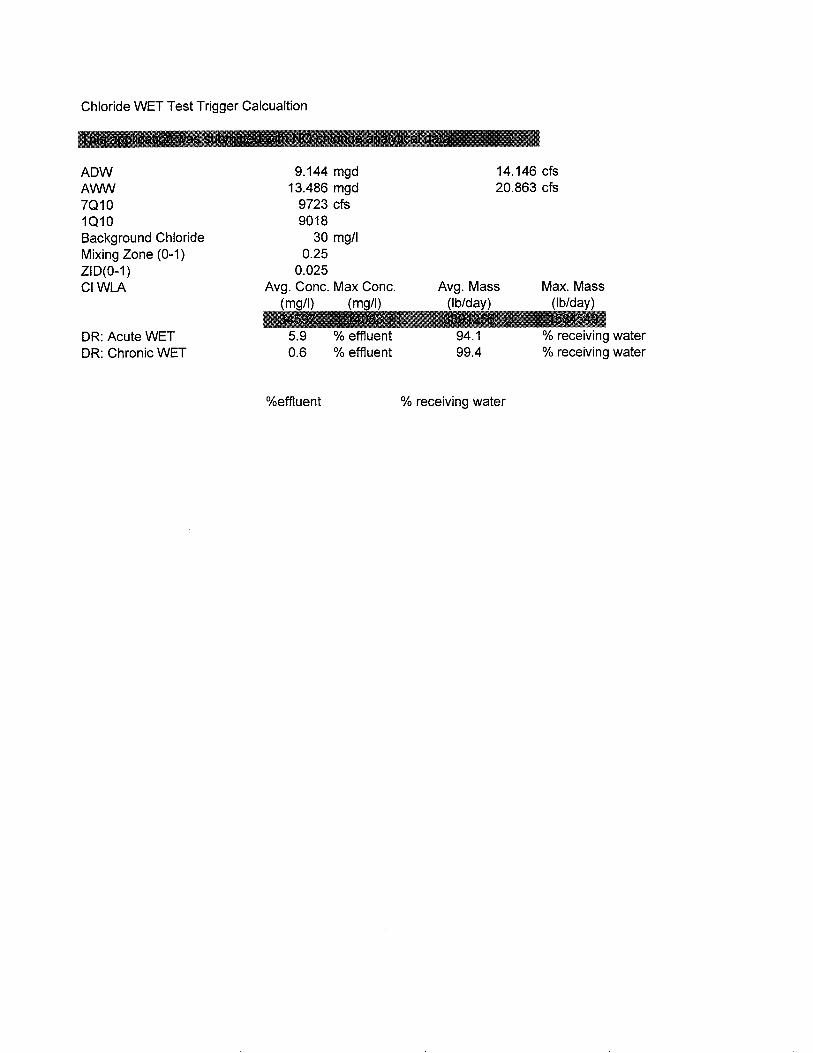


APPENDIX C PRESENT WORTH ANALYSIS
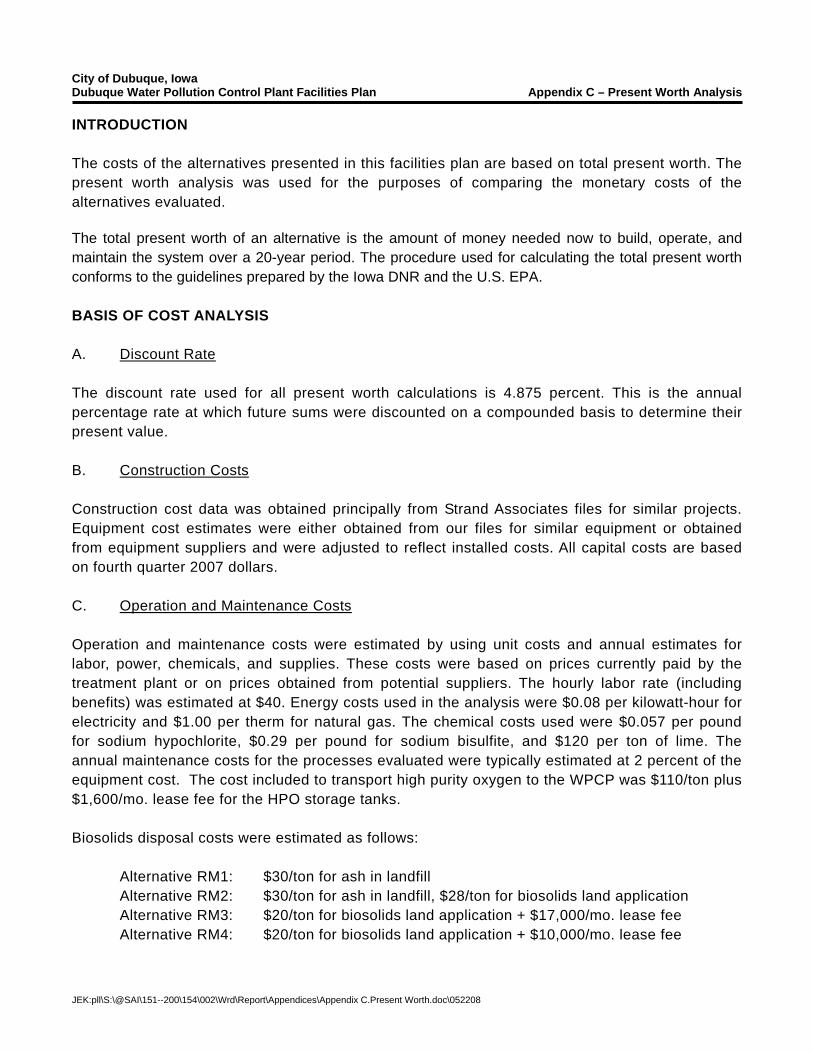
City of Dubuque, Iowa Dubuque Water Pollution Control Plant Facilities Plan Appendix C – Present Worth Analysis
JEK:pll\S:\@SAI\151--200\154\002\Wrd\Report\Appendices\Appendix C.Present Worth.doc\052208
INTRODUCTION The costs of the alternatives presented in this facilities plan are based on total present worth. The present worth analysis was used for the purposes of comparing the monetary costs of the alternatives evaluated. The total present worth of an alternative is the amount of money needed now to build, operate, and maintain the system over a 20-year period. The procedure used for calculating the total present worth conforms to the guidelines prepared by the Iowa DNR and the U.S. EPA. BASIS OF COST ANALYSIS A. Discount Rate The discount rate used for all present worth calculations is 4.875 percent. This is the annual percentage rate at which future sums were discounted on a compounded basis to determine their present value. B. Construction Costs Construction cost data was obtained principally from Strand Associates files for similar projects. Equipment cost estimates were either obtained from our files for similar equipment or obtained from equipment suppliers and were adjusted to reflect installed costs. All capital costs are based on fourth quarter 2007 dollars. C. Operation and Maintenance Costs Operation and maintenance costs were estimated by using unit costs and annual estimates for labor, power, chemicals, and supplies. These costs were based on prices currently paid by the treatment plant or on prices obtained from potential suppliers. The hourly labor rate (including benefits) was estimated at $40. Energy costs used in the analysis were $0.08 per kilowatt-hour for electricity and $1.00 per therm for natural gas. The chemical costs used were $0.057 per pound for sodium hypochlorite, $0.29 per pound for sodium bisulfite, and $120 per ton of lime. The annual maintenance costs for the processes evaluated were typically estimated at 2 percent of the equipment cost. The cost included to transport high purity oxygen to the WPCP was $110/ton plus $1,600/mo. lease fee for the HPO storage tanks. Biosolids disposal costs were estimated as follows:
Alternative RM1: $30/ton for ash in landfill Alternative RM2: $30/ton for ash in landfill, $28/ton for biosolids land application Alternative RM3: $20/ton for biosolids land application + $17,000/mo. lease fee Alternative RM4: $20/ton for biosolids land application + $10,000/mo. lease fee
City of Dubuque, Iowa Dubuque Water Pollution Control Plant Facilities Plan Appendix C – Present Worth Analysis
JEK:pll\S:\@SAI\151--200\154\002\Wrd\Report\Appendices\Appendix C.Present Worth.doc\052208
Alternative RM5: $35/ton for biosolids hauling and composting fee (does not include potential credit for compost value)
Alternative RM6: $20/ton for dried biosolids land application + $5,000/mo. lease fee Alternative RM7: $20/ton for dried biosolids land application + $7,000/mo. lease fee
D. Professional Services and Contingencies Professional services including engineering, legal, bond counsel, interest during construction, and contingencies were estimated to be 35 percent of the estimated construction cost. E. General Conditions General conditions including a bid bond, performance bond, payment bonds, and insurance costs were estimated to be 8 percent of the estimated construction cost. F. Total Present Worth Calculations The procedures for calculating total present worth are as follows:
1. Estimates were made of the total capital cost on a unit-by-unit basis including technical services and contingencies.
2. Estimates were made of the cost and timing of future capital expenditures
(replacements) in terms of current costs. The present worth of expenditures was computed by multiplying them by the single-payment present worth factors for the appropriate time period. Time periods and single-payment present worth factors used are listed as follows:
Time period (years) Present Worth Factor
5 0.7882 10 0.6213 15 0.4897 20 0.3860
3. The annual operation and maintenance expenditures were converted to a present worth
for 20 years. The present worth factor for an annuity over 20 years is 12.5954. 4. The salvage value of capital costs at the end of the 20-year planning period was
calculated by using straight-line depreciation. The salvage value at the end of the planning period was converted to present worth by multiplying it by the single-payment present worth factor of 0.3860.
City of Dubuque, Iowa Dubuque Water Pollution Control Plant Facilities Plan Appendix C – Present Worth Analysis
JEK:pll\S:\@SAI\151--200\154\002\Wrd\Report\Appendices\Appendix C.Present Worth.doc\052208
5. The total present worth was computed by subtracting the salvage value from the sum of the initial cost, present worth of future capital costs, and present worth of operation and maintenance costs.

APPENDIX D DETAILED OPINIONS OF COST FOR BIOLOGICAL TREATMENT
ALTERNATIVES
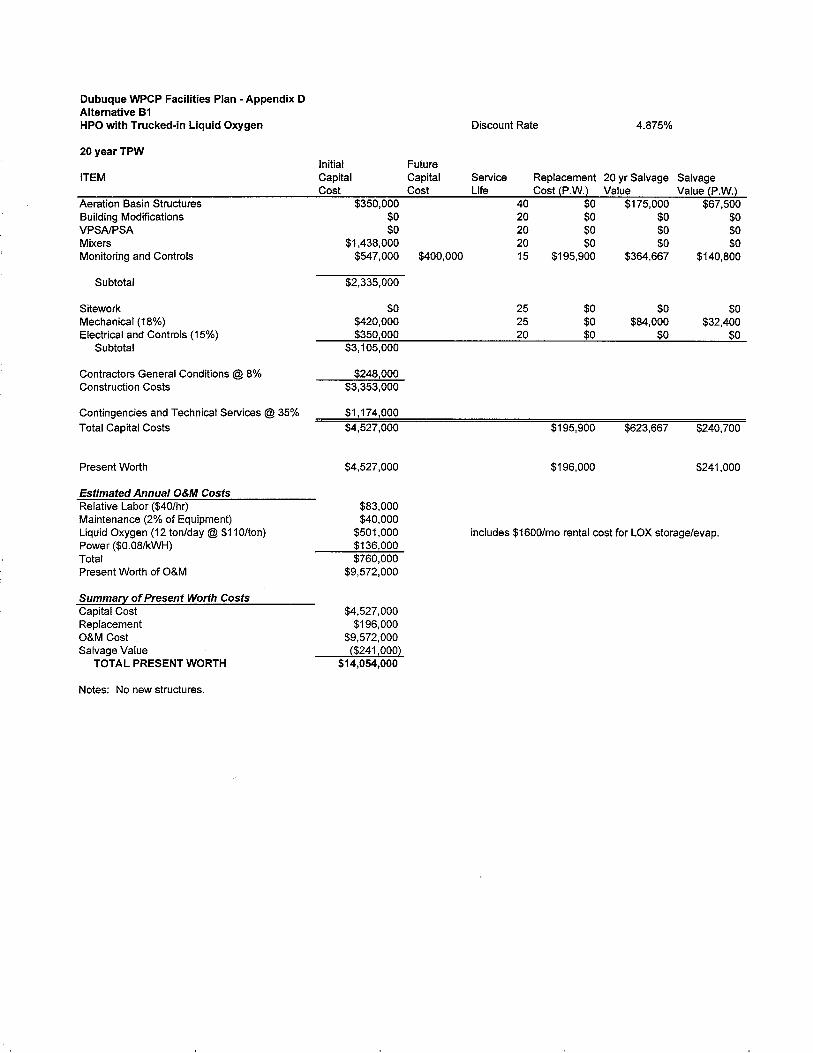
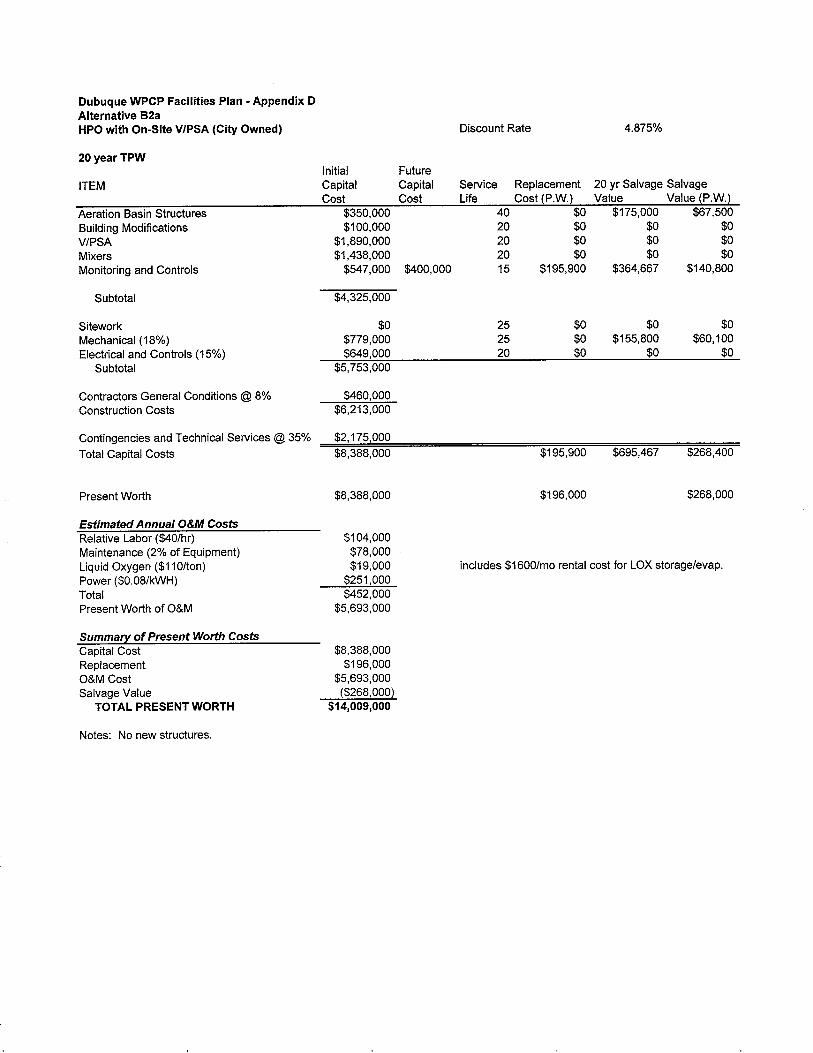
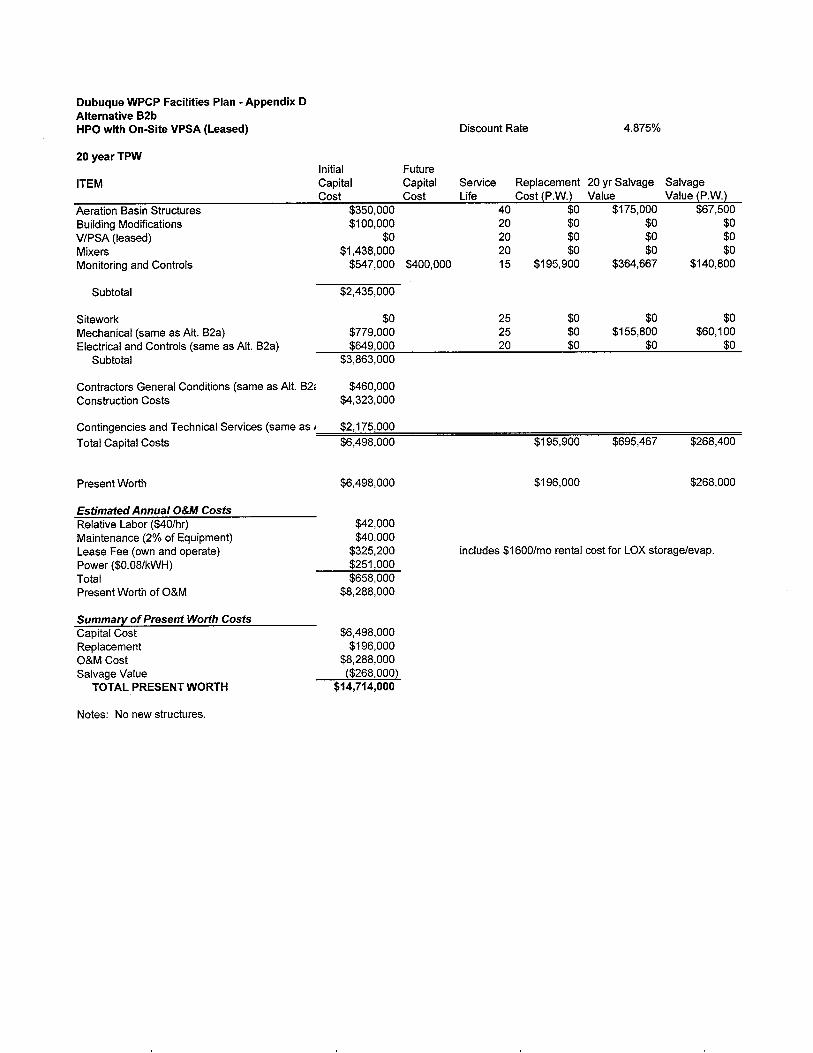
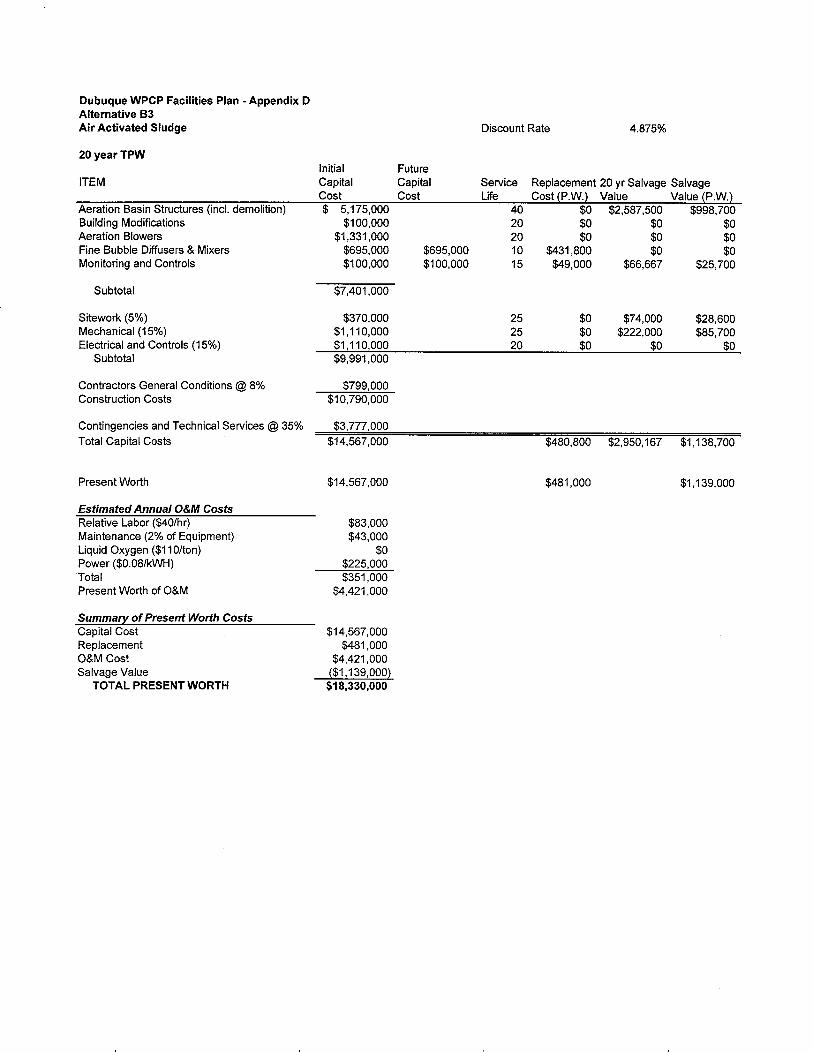
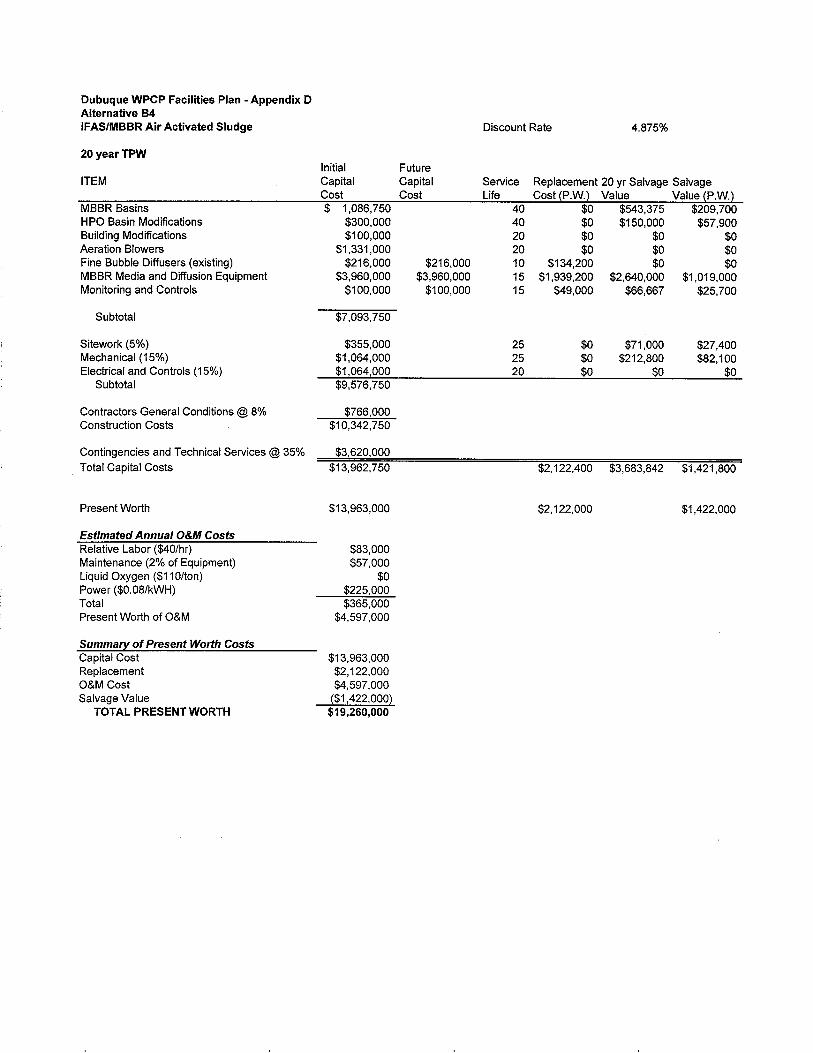

APPENDIX E DETAILED OPINIONS OF COST FOR DISINFECTION ALTERNATIVES
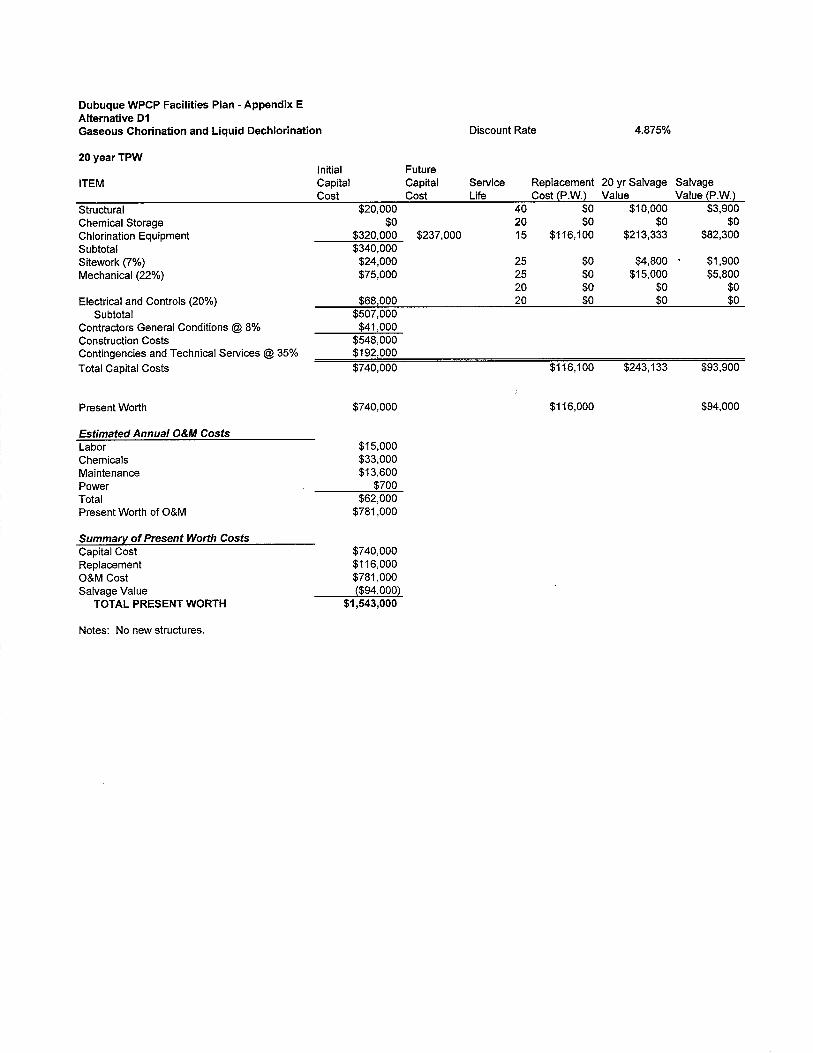
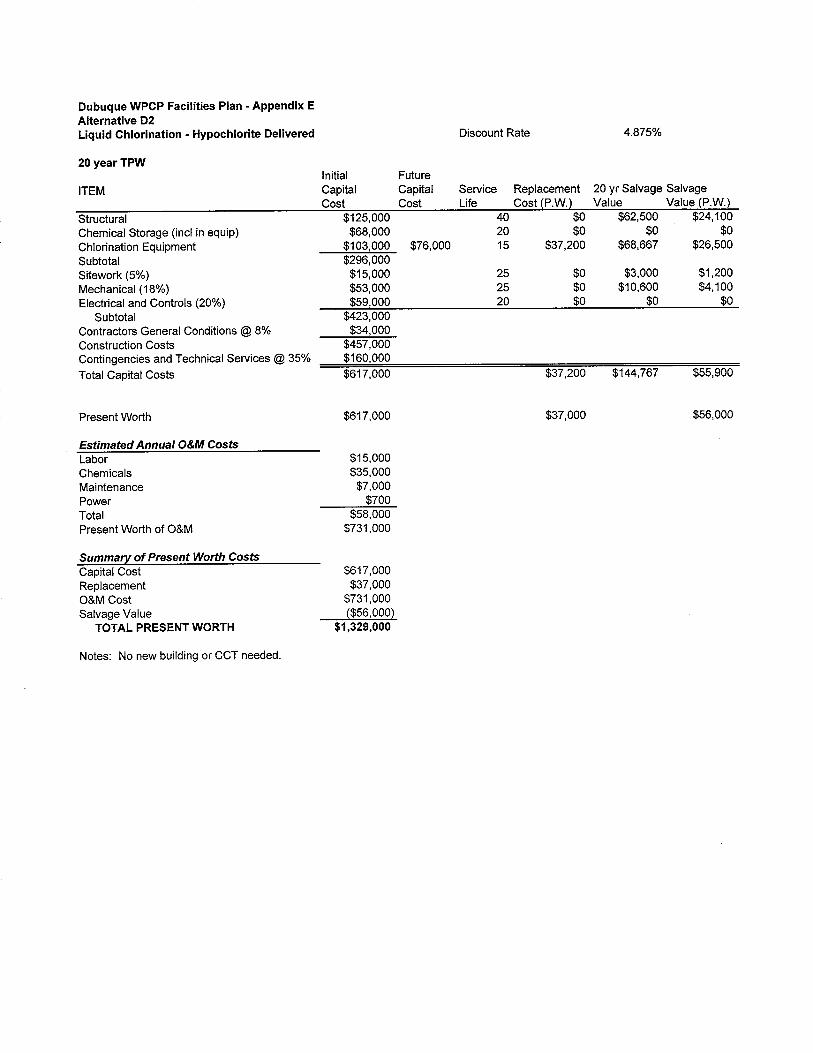
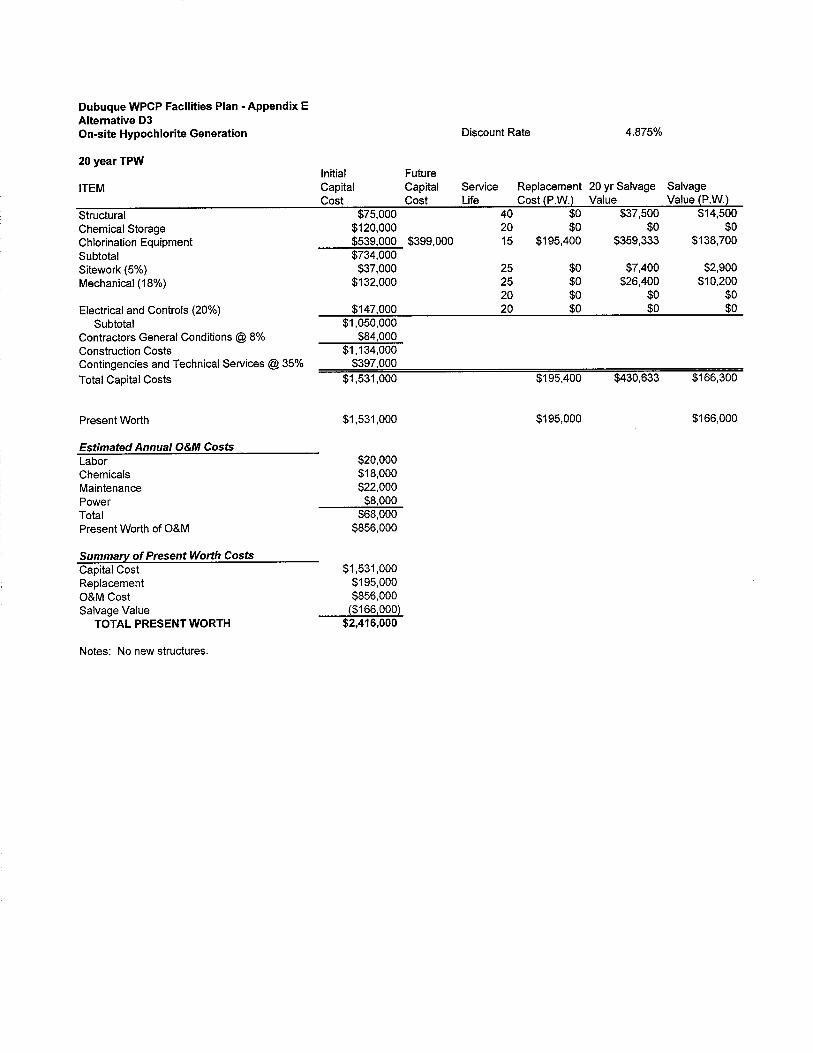


APPENDIX F DETAILED OPINIONS OF COST FOR RESIDUALS MANAGEMENT
ALTERNATIVES