Page 1
1
Announcements
• Exam grades will be posted by tomorrow• Last weekend for L.E.A.D. Mar 12th. You
must submit your summary by Mar 14th
• Extra credit movies due next Tuesday
• Pollution week!• Today: Water conservation and pollution
– Hydrological cycle– Water exploitation– Water pollution
Dust bowl: 1930 – 1936
South Dakota Oklahoma
What caused the dust bowl?
• Settlement during unusually wet period• Farming with excessive tilling and
without crop rotation• Several years of drought• Solution: Ogallala Aquifer (World’s
largest aquifer, tapped extensively after WWII)
Page 2
2
Readings
• Hogan 2014– Learn about sources of water pollutants
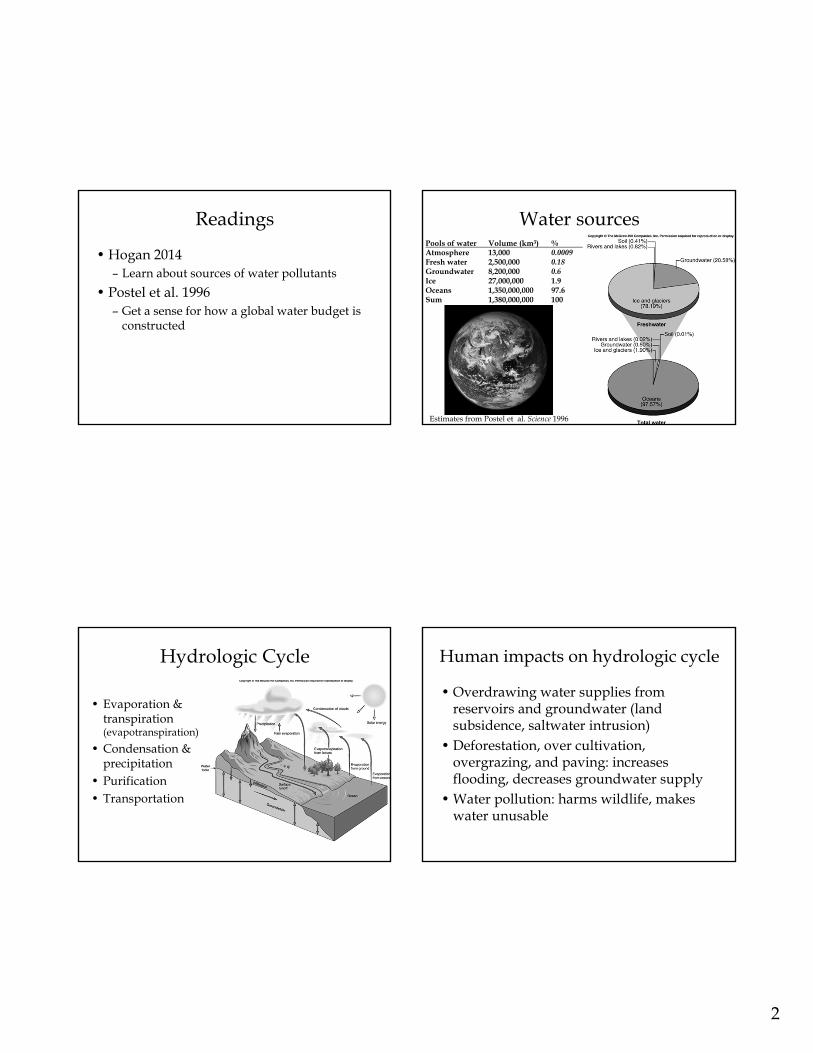
• Postel et al. 1996– Get a sense for how a global water budget is
constructed
Water sourcesPools of water Volume (km3) %Atmosphere 13,000 0.0009Fresh water 2,500,000 0.18Groundwater 8,200,000 0.6Ice 27,000,000 1.9Oceans 1,350,000,000 97.6Sum 1,380,000,000 100
Estimates from Postel et al. Science 1996
Hydrologic Cycle
• Evaporation & transpiration (evapotranspiration)
• Condensation & precipitation
• Purification• Transportation
Human impacts on hydrologic cycle
• Overdrawing water supplies from reservoirs and groundwater (land subsidence, saltwater intrusion)
• Deforestation, over cultivation, overgrazing, and paving: increases flooding, decreases groundwater supply
• Water pollution: harms wildlife, makes water unusable
Page 3
3
Human-logic cycle
• Purify water - municipal treatment plants• Use water (consume, pollute)• Purify water again – waste-water
treatment plants• Mississippi River water passes through
people 7x before it enters Gulf of Mexico
Municipalwater use andtreatment.
WWTP:- Primary- Secondary- Tertiary
Wastewater treatment:1: Remove solids (sludge)2: Break down dissolved
organic material (bacteria)3: Remove nutrients and
chlorinate effluent4: Release
Mr. Floatie’s mayoralcampaign, Victoria, BC
(P.O.O.P. party)
Water exploitation
80% of consumptive use in U.S. is for agriculture
Water exploitation• Ogallala aquifer
– Withdrawal = 5-30 x recharge rate– Lowering ~6 ft per y– Estimated life at current rates ~25 y
• What will happen in 25 y?
• Why is the water overused?
• Should Fed gov’t subsidize water use by agriculture (e.g., cotton) or water conservation?
• How can the US stop overuse?
Figure: Water-level change: Predevelopment to 2005 (Source: USGS 2007)
Page 4
4
Water markets
• AustraliaPrice and use of water varies with availability(More water in 2009 than 2007)
Water entitlements versus allocation. Allocations are tradeable.Water markets have improved efficiency of water use and allocation.
Water markets in US
• No Federal markets• States make their own rules• Rule of Capture: You can pump water
below your own land (with exceptions)• Texas is the only state with a water market
“The Texas Water Exchange”(Started in 2014 for groundwater only)www.texaswaterexchange.com
Water exploitation elsewhere
• India: Withdrawal = 2x recharge rate• China: Water table dropping 5 ft per y• Ganges, Yellow and Nile Rivers barely
reach the ocean
Water conservation
First three photos from: http://www.ers.usda.gov
Percolationloss at lowspot in furrow
Sprinklers drip systems
50% U.S. systemsgravity flow
Page 5
5
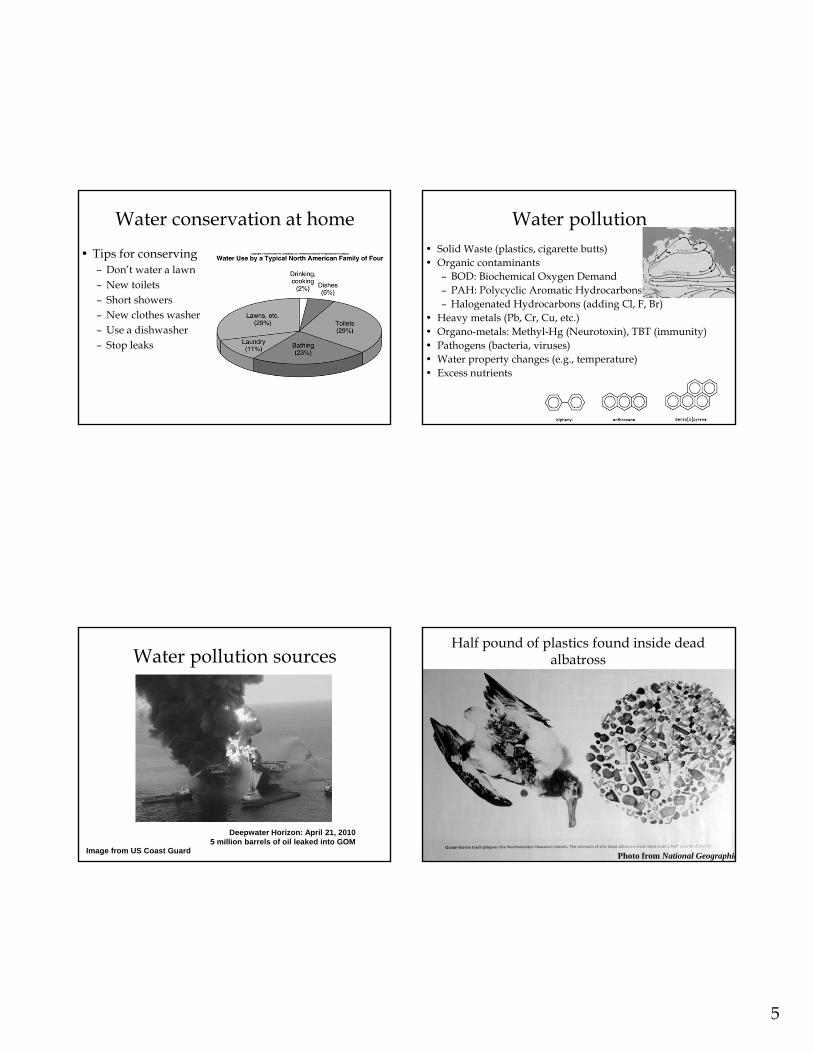
Water conservation at home
• Tips for conserving– Don’t water a lawn– New toilets– Short showers– New clothes washer– Use a dishwasher– Stop leaks
Water pollution• Solid Waste (plastics, cigarette butts)• Organic contaminants
– BOD: Biochemical Oxygen Demand– PAH: Polycyclic Aromatic Hydrocarbons– Halogenated Hydrocarbons (adding Cl, F, Br)
• Heavy metals (Pb, Cr, Cu, etc.)• Organo-metals: Methyl-Hg (Neurotoxin), TBT (immunity)• Pathogens (bacteria, viruses)• Water property changes (e.g., temperature)• Excess nutrients
46,000/mi2
Deepwater Horizon: April 21, 20105 million barrels of oil leaked into GOM
Image from US Coast Guard
Water pollution sourcesHalf pound of plastics found inside dead
albatross
Photo from National Geographic
Page 6
6
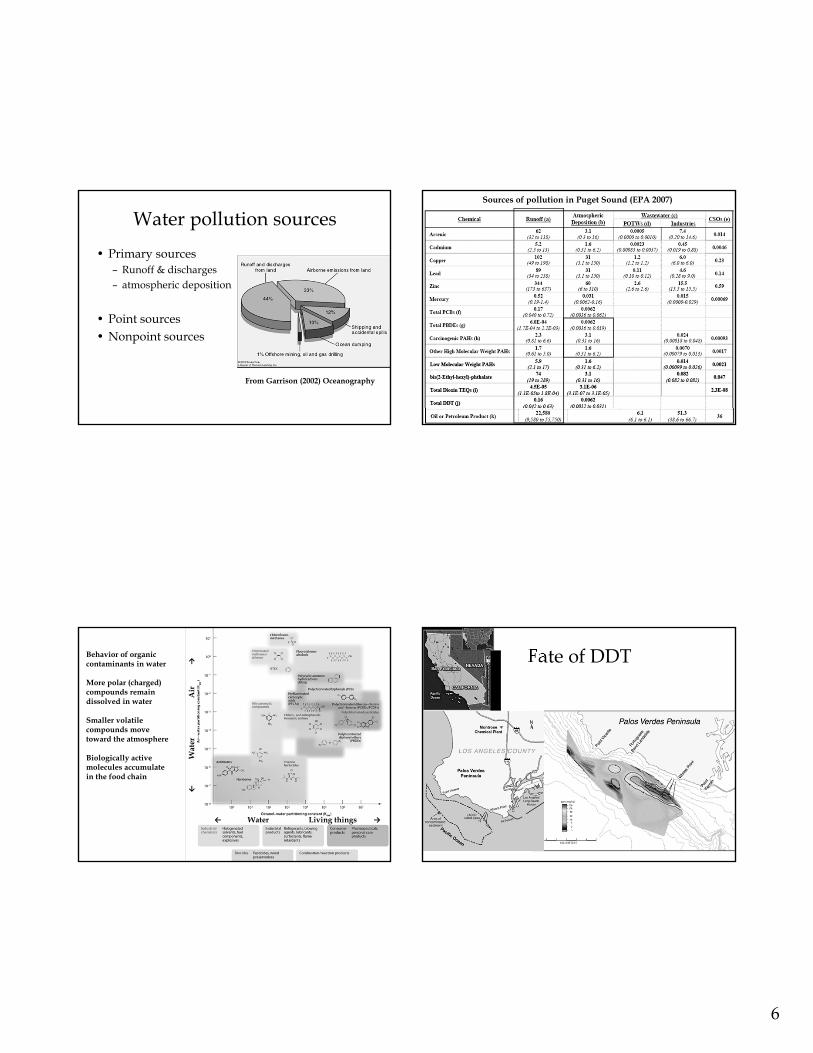
Water pollution sources
• Primary sources– Runoff & discharges– atmospheric deposition
• Point sources • Nonpoint sources
From Garrison (2002) Oceanography
Sources of pollution in Puget Sound (EPA 2007)←
Wat
er
Air
→
← Water Living things →
Behavior of organic contaminants in water
More polar (charged) compounds remain dissolved in water
Smaller volatile compounds move toward the atmosphere
Biologically active molecules accumulate in the food chain
Fate of DDT
Page 7
7
Biomagnification Puget Sound contaminantsN → S N → S
Organic contaminants in harbor seals from Ross et al. (2013)
Puget Sound contaminants
Organic contaminants in harbor seals from Ross et al. (2013)
Water pollution effects
• Nutrients and eutrophication– Nutrients limit productivity
• Key limiting nutrients: nitrogen and phosphorus– Excess nutrients act as pollutants
• Steps:– Increased N or P– Increased phytoplankton productivity– Decreased water clarity– Mixing rates low: - phytoplankton sink to bottom
- respiration consumes oxygen- aerobic organisms emigrate or die
Page 8
8
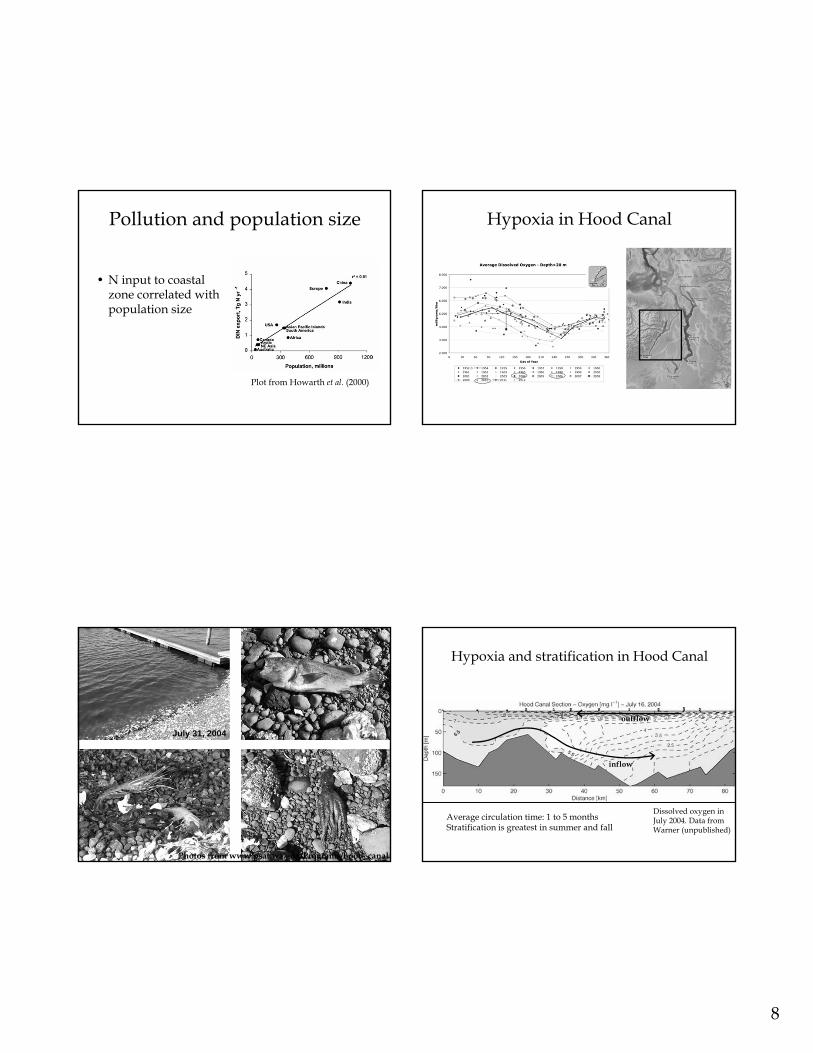
Pollution and population size
• N input to coastal zone correlated with population size
Plot from Howarth et al. (2000)
Hypoxia in Hood Canal
Photos from www.psat.wa.gov/Programs/hood_canal
July 31, 2004
Hypoxia and stratification in Hood Canal
outflow
inflow
Average circulation time: 1 to 5 monthsStratification is greatest in summer and fall
Dissolved oxygen in July 2004. Data from Warner (unpublished)
Page 9
9
Global distribution of “dead zones”
From Diaz and Rosenberg, Science 2008
Number of dead zones has doubled each decade since the 1960s
Lake Whatcom
• WWU’s Institute of Watershed Studies monitors Lake Whatcom water quality
• http://www.wwu.edu/iws• Lake Whatcom issues:
– Declining dissolved oxygen in bottom water– Increased growth of cyanobacteria– Increased concentrations of trihalomethanes
Reducing water pollution
• Clean Water Act (1972)• Use alternatives to pesticides and control erosion• Pick up after your pet• Dispose of oil and household chemicals properly
– Disposal of Toxics Facility 3505 Airport DriveBellingham 360-380-4640
Reducing water pollution