Page 1
POLY (VINYLIDENE FLUORIDE-CO-HEXAFLUORO PROPYLENE) / POLYETHYLENE OXIDE-BASED NANOPARTICLES REINFORCED GEL POLYMER
ELECTROLYTES FOR DYE-SENSITIZED SOLAR CELL
NEGAR ZEBARDASTAN
FACULTY OF SCIENCE
UNIVERSITY OF MALAYA KUALA LUMPUR
2017
Page 2
POLY (VINYLIDENE FLUORIDE-CO-HEXAFLUORO
PROPYLENE) / POLYETHYLENE OXIDE-BASED
NANOPARTICLES REINFORCED GEL POLYMER
ELECTROLYTES FOR DYE-SENSITIZED SOLAR
CELL
NEGAR ZEBARDASTAN
THESIS SUBMITTED IN FULFILMENT OF THE
REQUIREMENTS FOR THE DEGREE OF MASTER OF
SCIENCE
DEPARTMENT OF PHYSICS
FACULTY OF SCIENCE
UNIVERSITY OF MALAYA
KUALA LUMPUR
2017
Page 3
ii
UNIVERSITY OF MALAYA
ORIGINAL LITERARY WORK DECLARATION
Name of Candidate: NEGAR ZEBARDASTAN
Registration/Matric No: SGR150006
Name of Degree: MASTER OF SCIENCE
Title of Project Paper/Research Report/Dissertation/Thesis (“this Work”):
POLY (VINYLIDENE FLUORIDE-CO-HEXAFLUORO
PROPYLENE)/POLYETHYLENE OXIDE BASED NANOPARTICLE
REINFORCED GEL POLYMER ELECTROLYTES FOR DYE-SENSITIZED
SOLAR CELL
Field of Study: EXPERIMENTAL PHYSICS
I do solemnly and sincerely declare that:
(1) I am the sole author/writer of this Work;
(2) This Work is original;
(3) Any use of any work in which copyright exists was done by way of fair dealing
and for permitted purposes and any excerpt or extract from, or reference to or
reproduction of any copyright work has been disclosed expressly and
sufficiently and the title of the Work and its authorship have been
acknowledged in this Work;
(4) I do not have any actual knowledge nor do I ought reasonably to know that the
making of this work constitutes an infringement of any copyright work;
(5) I hereby assign all and every rights in the copyright to this Work to the
University of Malaya (“UM”), who henceforth shall be owner of the copyright
in this Work and that any reproduction or use in any form or by any means
whatsoever is prohibited without the written consent of UM having been first
had and obtained;
(6) I am fully aware that if in the course of making this Work I have infringed any
copyright whether intentionally or otherwise, I may be subject to legal action
or any other action as may be determined by UM.
Candidate’s Signature Date:
Subscribed and solemnly declared before,
Witness’s Signature Date:
Name:
Designation:
Page 4
iii
ABSTRACT
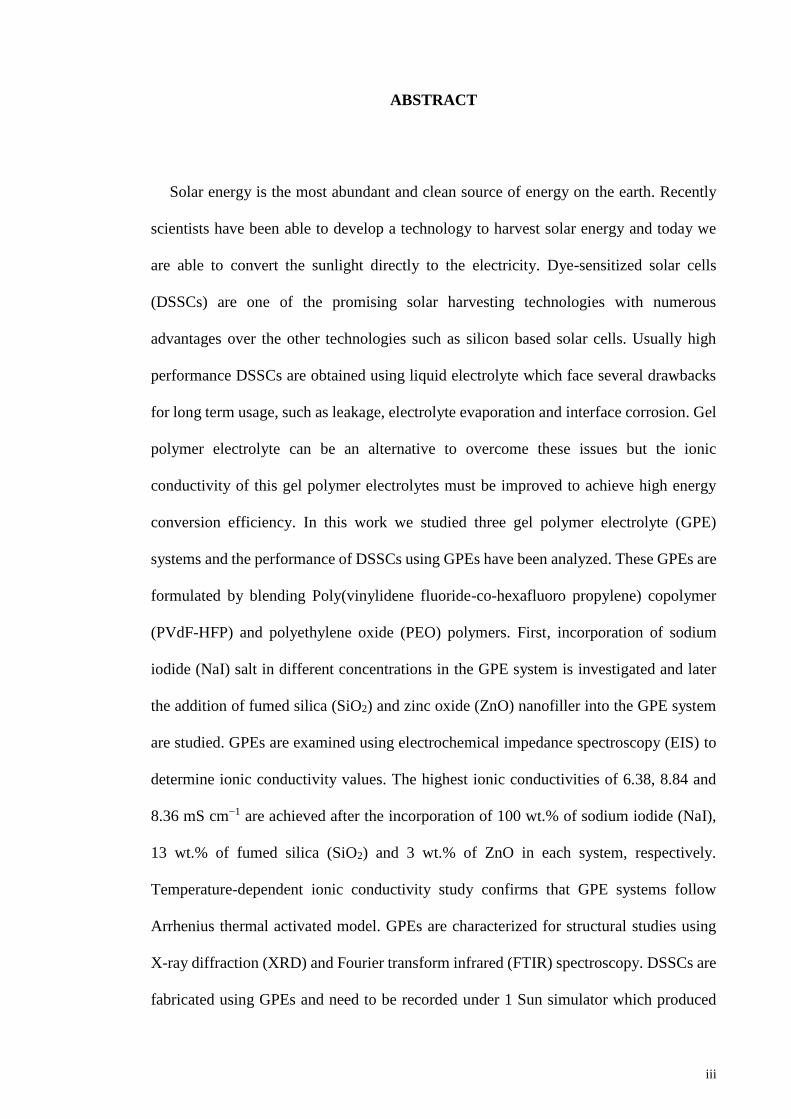
Solar energy is the most abundant and clean source of energy on the earth. Recently
scientists have been able to develop a technology to harvest solar energy and today we
are able to convert the sunlight directly to the electricity. Dye-sensitized solar cells
(DSSCs) are one of the promising solar harvesting technologies with numerous
advantages over the other technologies such as silicon based solar cells. Usually high
performance DSSCs are obtained using liquid electrolyte which face several drawbacks
for long term usage, such as leakage, electrolyte evaporation and interface corrosion. Gel
polymer electrolyte can be an alternative to overcome these issues but the ionic
conductivity of this gel polymer electrolytes must be improved to achieve high energy
conversion efficiency. In this work we studied three gel polymer electrolyte (GPE)
systems and the performance of DSSCs using GPEs have been analyzed. These GPEs are
formulated by blending Poly(vinylidene fluoride-co-hexafluoro propylene) copolymer
(PVdF-HFP) and polyethylene oxide (PEO) polymers. First, incorporation of sodium
iodide (NaI) salt in different concentrations in the GPE system is investigated and later
the addition of fumed silica (SiO2) and zinc oxide (ZnO) nanofiller into the GPE system
are studied. GPEs are examined using electrochemical impedance spectroscopy (EIS) to
determine ionic conductivity values. The highest ionic conductivities of 6.38, 8.84 and
8.36 mS cm−1 are achieved after the incorporation of 100 wt.% of sodium iodide (NaI),
13 wt.% of fumed silica (SiO2) and 3 wt.% of ZnO in each system, respectively.
Temperature-dependent ionic conductivity study confirms that GPE systems follow
Arrhenius thermal activated model. GPEs are characterized for structural studies using
X-ray diffraction (XRD) and Fourier transform infrared (FTIR) spectroscopy. DSSCs are
fabricated using GPEs and need to be recorded under 1 Sun simulator which produced
Page 5
iv
the significant highest energy conversion efficiency of 5.67, 9.44 and 9.08 % with
incorporation of 100 wt.% of sodium iodide (NaI) with respect to the total weight of
PEO:PVdF-HFP polymers, 13 wt.% of fumed silica (SiO2) and 3 wt.% of ZnO in each
system, respectively.
Page 6
v
ABSTRAK
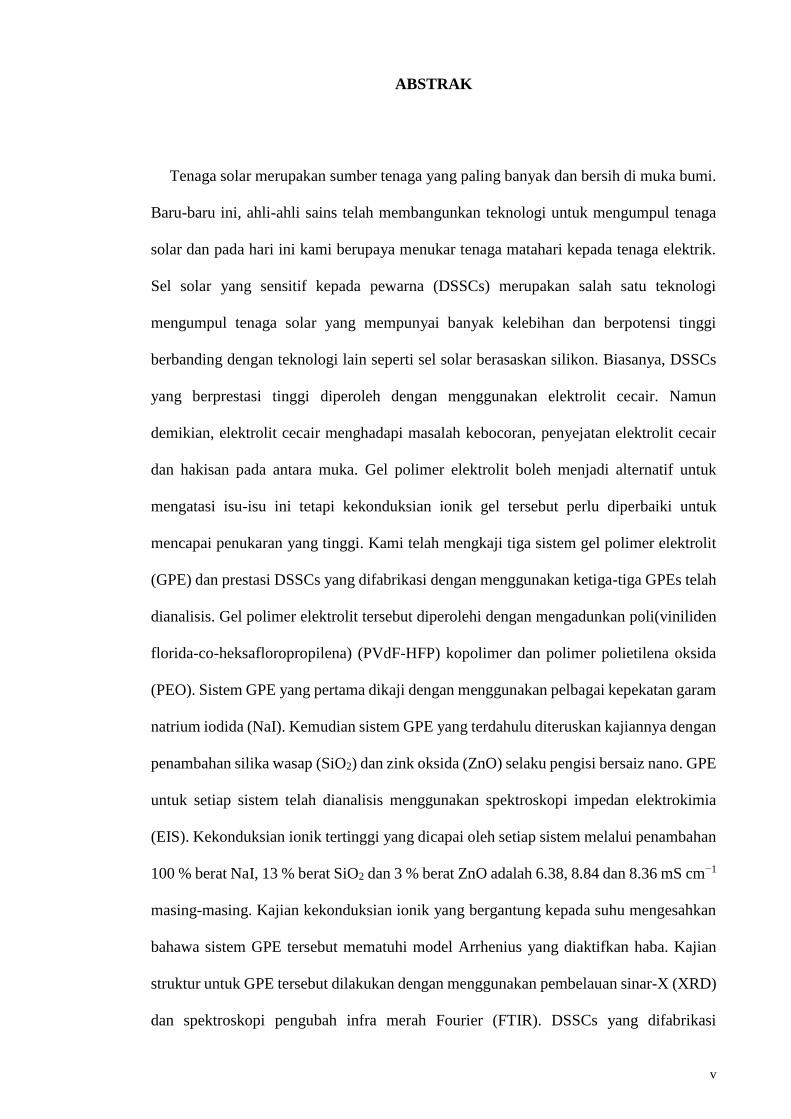
Tenaga solar merupakan sumber tenaga yang paling banyak dan bersih di muka bumi.
Baru-baru ini, ahli-ahli sains telah membangunkan teknologi untuk mengumpul tenaga
solar dan pada hari ini kami berupaya menukar tenaga matahari kepada tenaga elektrik.
Sel solar yang sensitif kepada pewarna (DSSCs) merupakan salah satu teknologi
mengumpul tenaga solar yang mempunyai banyak kelebihan dan berpotensi tinggi
berbanding dengan teknologi lain seperti sel solar berasaskan silikon. Biasanya, DSSCs
yang berprestasi tinggi diperoleh dengan menggunakan elektrolit cecair. Namun
demikian, elektrolit cecair menghadapi masalah kebocoran, penyejatan elektrolit cecair
dan hakisan pada antara muka. Gel polimer elektrolit boleh menjadi alternatif untuk
mengatasi isu-isu ini tetapi kekonduksian ionik gel tersebut perlu diperbaiki untuk
mencapai penukaran yang tinggi. Kami telah mengkaji tiga sistem gel polimer elektrolit
(GPE) dan prestasi DSSCs yang difabrikasi dengan menggunakan ketiga-tiga GPEs telah
dianalisis. Gel polimer elektrolit tersebut diperolehi dengan mengadunkan poli(viniliden
florida-co-heksafloropropilena) (PVdF-HFP) kopolimer dan polimer polietilena oksida
(PEO). Sistem GPE yang pertama dikaji dengan menggunakan pelbagai kepekatan garam
natrium iodida (NaI). Kemudian sistem GPE yang terdahulu diteruskan kajiannya dengan
penambahan silika wasap (SiO2) dan zink oksida (ZnO) selaku pengisi bersaiz nano. GPE
untuk setiap sistem telah dianalisis menggunakan spektroskopi impedan elektrokimia
(EIS). Kekonduksian ionik tertinggi yang dicapai oleh setiap sistem melalui penambahan
100 % berat NaI, 13 % berat SiO2 dan 3 % berat ZnO adalah 6.38, 8.84 dan 8.36 mS cm−1
masing-masing. Kajian kekonduksian ionik yang bergantung kepada suhu mengesahkan
bahawa sistem GPE tersebut mematuhi model Arrhenius yang diaktifkan haba. Kajian
struktur untuk GPE tersebut dilakukan dengan menggunakan pembelauan sinar-X (XRD)
dan spektroskopi pengubah infra merah Fourier (FTIR). DSSCs yang difabrikasi
Page 7
vi
menggunakan GPEs telah dianalisis dengan menggunakan 1 Sun simulasi. Penambahan
100 % berat NaI, 13 % berat SiO2 dan 3 % berat ZnO berdasarkan kepada jumlah berat
polimer PEO:PVdF-HFP menunjukkan kecekapan penukaran tenaga yang ketara iaitu
5.67 , 9.44 and 9.08 %, masing-masing.
Page 8
vii
ACKNOWLEDGEMENTS
This thesis is dedicated to my husband Reza Alizaadeh Sabeti. Without his patience
and ceaseless encouragements and support it has been infeasible to carry out this study.
I would like express my deepest gratitude to my father whose tears were welled up in
his eyes with each success I gained and to my mother whose prayers eased my path toward
success.
I owe my sincere gratitude to the most compassionate and supportive supervisors Prof
Dr Ramesh T. Subramaniam and Assoc Prof Dr Ramesh Kasi who supported me in every
single difficulty through this research. Without their unwavering supports and
encouragements it was impossible to do this study.
It is my pleasure to thank my group members and lab mates, especially Dr. Mohammad
Hassan Khanmirzaei for consoling and helping me in exigent moments of research.
I would like to show my gratitude to Center for Ionics and University of Malaya, for
providing facilities for me to do this research. This work was financially supported by
High Impact Research Grant (UM.C/625/1/HIR/MOHE/SC/21/1) and Institute of
postgraduate studies grant (UM.TNC2/IPPP/PPGP/628).
Page 9
viii
TABLE OF CONTENTS
ABSTRACT ............................................................................................................... iii
ABSTRAK ................................................................................................................... v
ACKNOWLEDGEMENTS ..................................................................................... vii
TABLE OF CONTENTS ........................................................................................ viii
LIST OF FIGURES .................................................................................................. xii
LIST OF TABLES .................................................................................................... xv
LIST OF SYMBOLS AND ABBREVIATIONS.................................................. xvii
LIST OF APPENDICES ......................................................................................... xix
CHAPTER 1: INTRODUCTION .................................................................................. 1
1.1 Introduction of Research.......................................................................................... 1
1.2 Objectives of the Research ...................................................................................... 3
1.3 Scope of Thesis ........................................................................................................ 3
CHAPTER 2: LITERATURE REVIEWS ................................................................... 5
2.1 Introduction.............................................................................................................. 5
2.2 Solar cells................................................................................................................. 5
2.3 Dye-Sensitized Solar Cells (DSSCs) ....................................................................... 7
2.3.1 Advantages of using DSSCs ........................................................................8
2.3.2 Working principles of DSSCs .....................................................................9
2.3.3 The components of DSSCs ........................................................................11
2.3.3.1 Transparent conducting films (TCFs) ....................................... 11
2.3.3.2 Photo-anode ............................................................................... 12
2.3.3.3 Sensitizing dye .......................................................................... 12
2.3.3.4 Counter electrodes ..................................................................... 15
Page 10
ix
2.3.3.5 Electrolytes ................................................................................ 16
2.4 Gel polymer electrolytes (GPEs) ........................................................................... 18
2.5 PVdF-HFP and PEO .............................................................................................. 19
2.6 Iodide salts ............................................................................................................. 22
2.7 Fillers ................................................................................................................... 23
2.8 Summary ................................................................................................................ 25
CHAPTER 3: METHODOLOGY ............................................................................... 26
3.1 Introduction............................................................................................................ 26
3.2 Materials and chemicals ........................................................................................ 26
3.3 Research design ..................................................................................................... 27
3.4 Preparation of gel polymer electrolytes ................................................................. 30
3.4.1 Preparation of gel polymer electrolytes (PVdF-HFP:PEO:EC:PC:NaI:---
I2) - First system ........................................................................................30
3.4.2 Preparation of gel polymer electrolytes (PVdF-HFP:PEO:EC:PC:NaI:---
SiO2: I2) - Second system ..........................................................................31
3.4.3 Preparation of gel polymer electrolytes in (PVdF-HFP:PEO:EC:PC:---
NaI: ZnO:I2)- Third system .......................................................................32
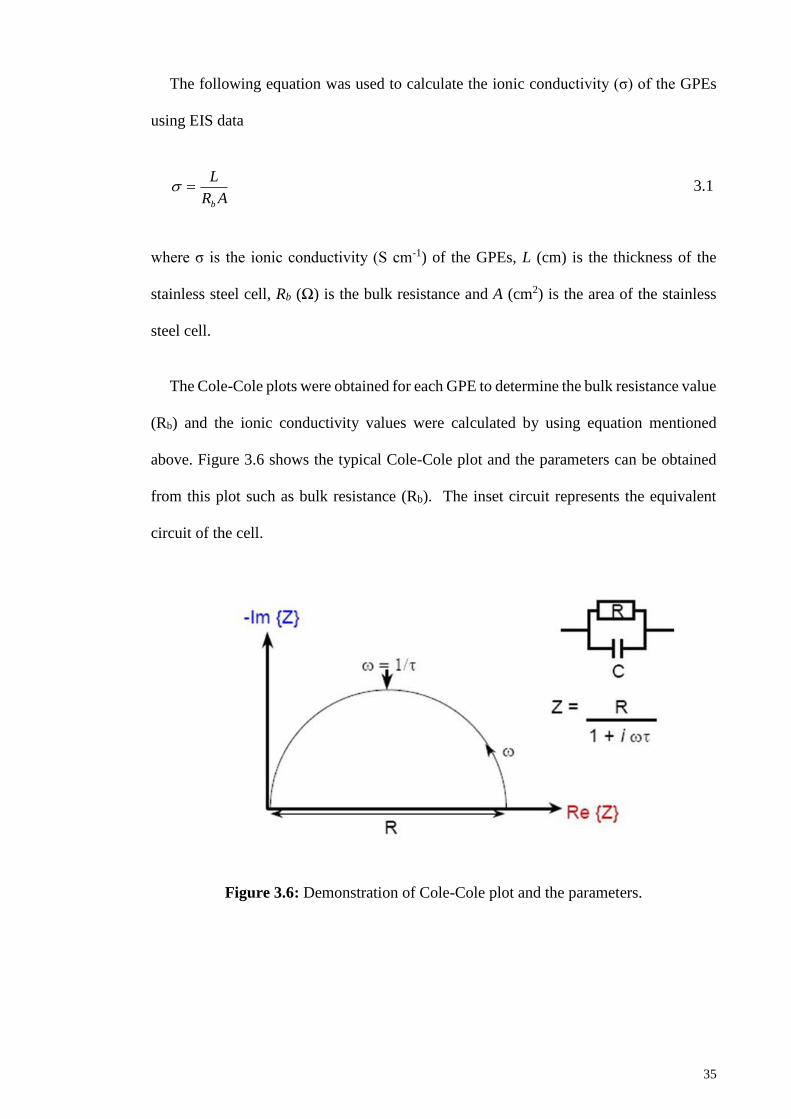
3.5 Characterizations of gel polymer electrolytes ....................................................... 33
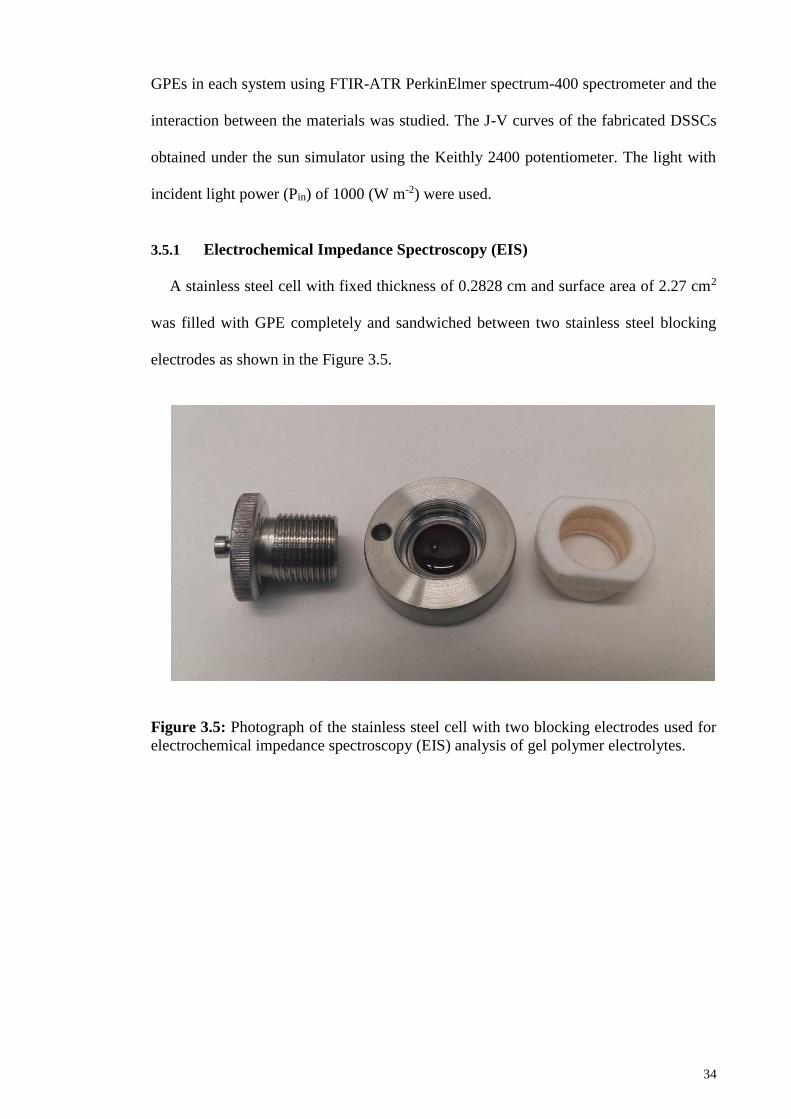
3.5.1 Electrochemical Impedance Spectroscopy (EIS) ......................................34
3.5.2 Temperature-dependent ionic conductivity ...............................................36
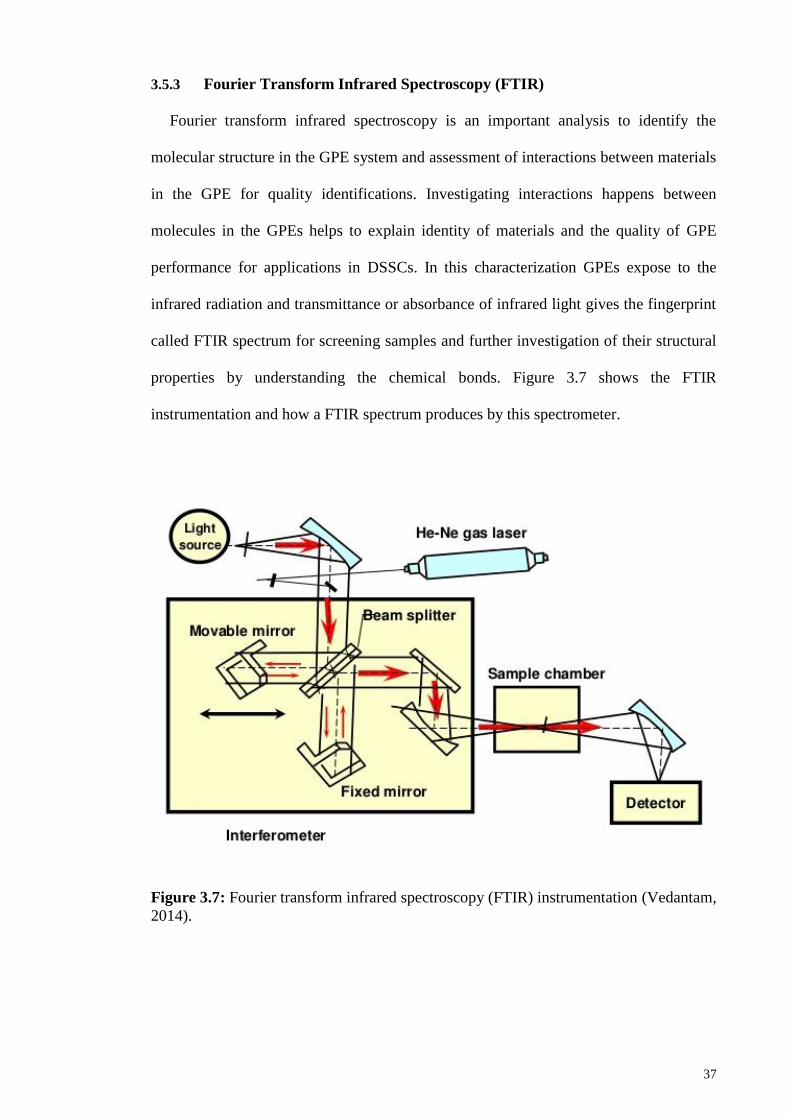
3.5.3 Fourier Transform Infrared Spectroscopy (FTIR) .....................................37
3.5.4 X-ray Diffraction Spectroscopy ................................................................39
3.6 Dye-sensitized solar cell (DSSC) fabrication ........................................................ 41
3.6.1 Preparation of photo-sensitized electrode .................................................41
3.6.1.1 Conducting glass (FTO) cleaning ............................................. 42
3.6.1.2 First layer of photo-sensitized electrode ................................... 43
3.6.1.3 Second layer of photo-sensitized electrode ............................... 44
Page 11
x
3.6.1.4 Dye solution .............................................................................. 45
3.6.2 Preparation of counter electrode ................................................................46
3.6.3 Fabrication of DSSCs ................................................................................46
3.6.4 Photovoltaic studies of DSSCs ..................................................................48
3.7 Summary ................................................................................................................ 50
CHAPTER 4: RESULTS AND DISCUSSION .......................................................... 51
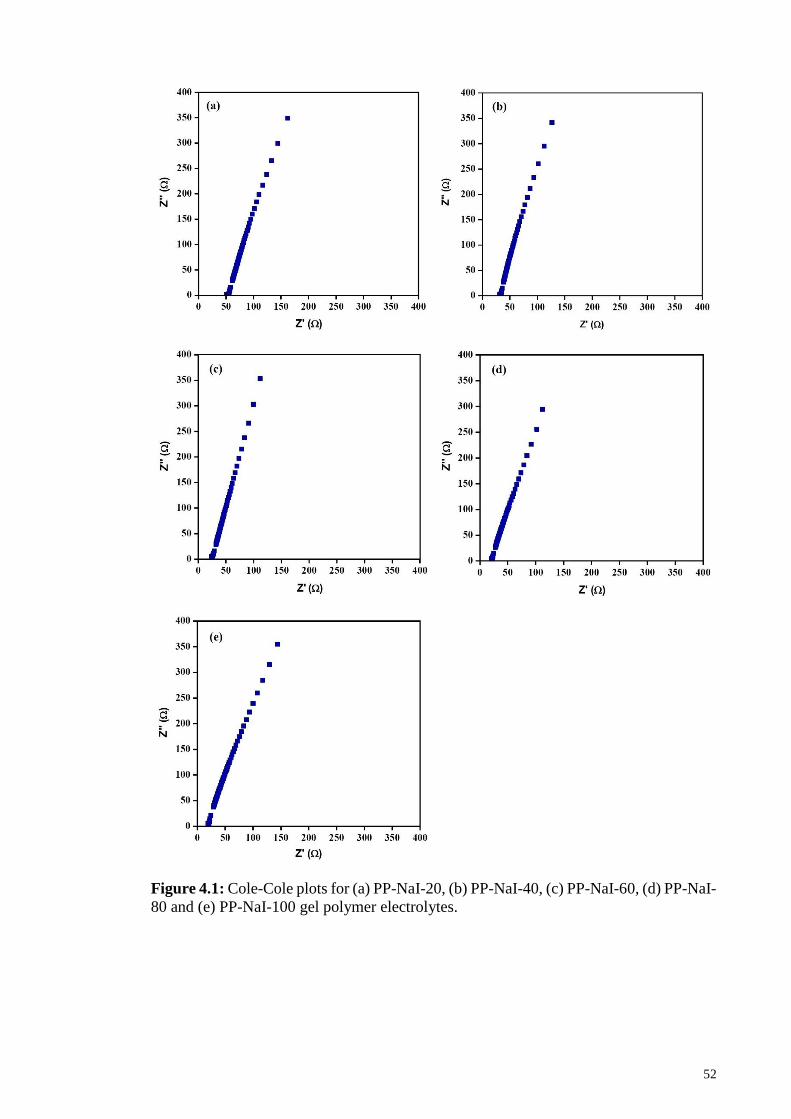
4.1 Introduction............................................................................................................ 51
4.2 PVdF-HFP:PEO:EC:PC:NaI:I2 gel polymer electrolytes ...................................... 51
4.2.1 Ionic conductivity studies at ambient temperature ....................................51
4.2.2 Temperature-dependent ionic conductivity studies ...................................54
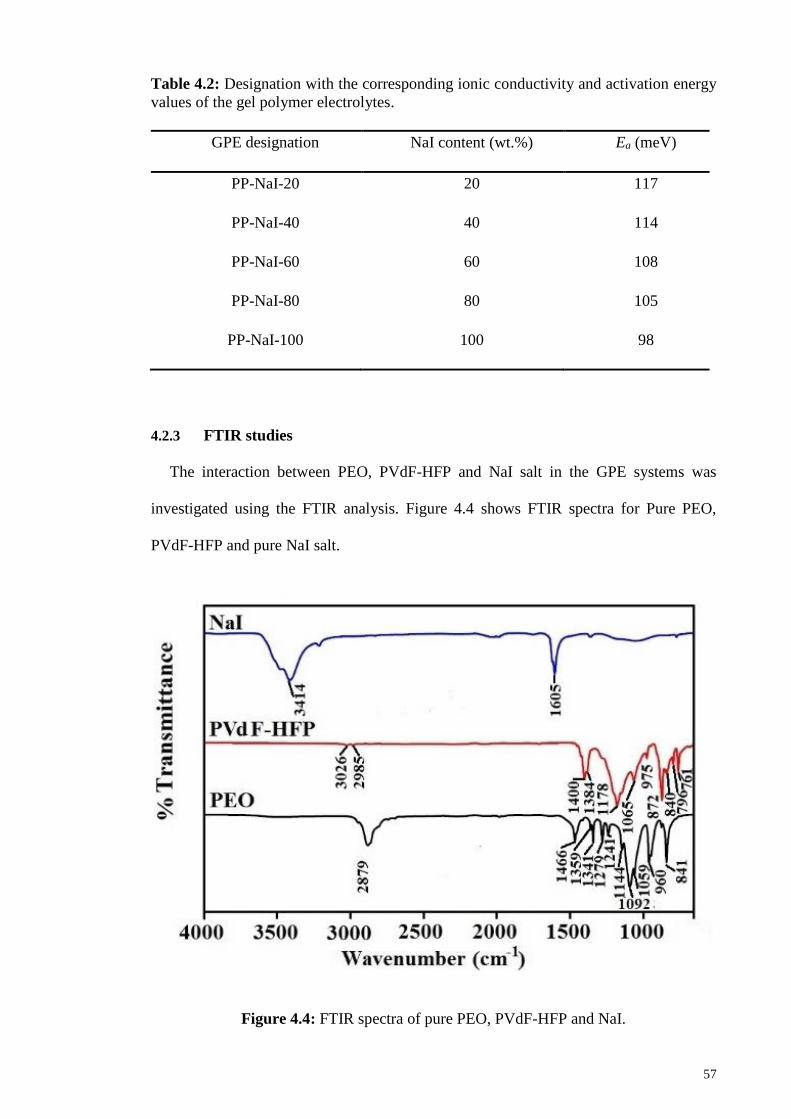
4.2.3 FTIR studies ..............................................................................................57
4.2.4 X-ray Diffraction (XRD) studies ...............................................................60
4.2.5 Photocurrent density vs voltage characteristics (J-V) ...............................64
4.3 PVdF-HFP:PEO:EC:PC:NaI:SiO2:I2 gel polymer electrolytes ............................. 66
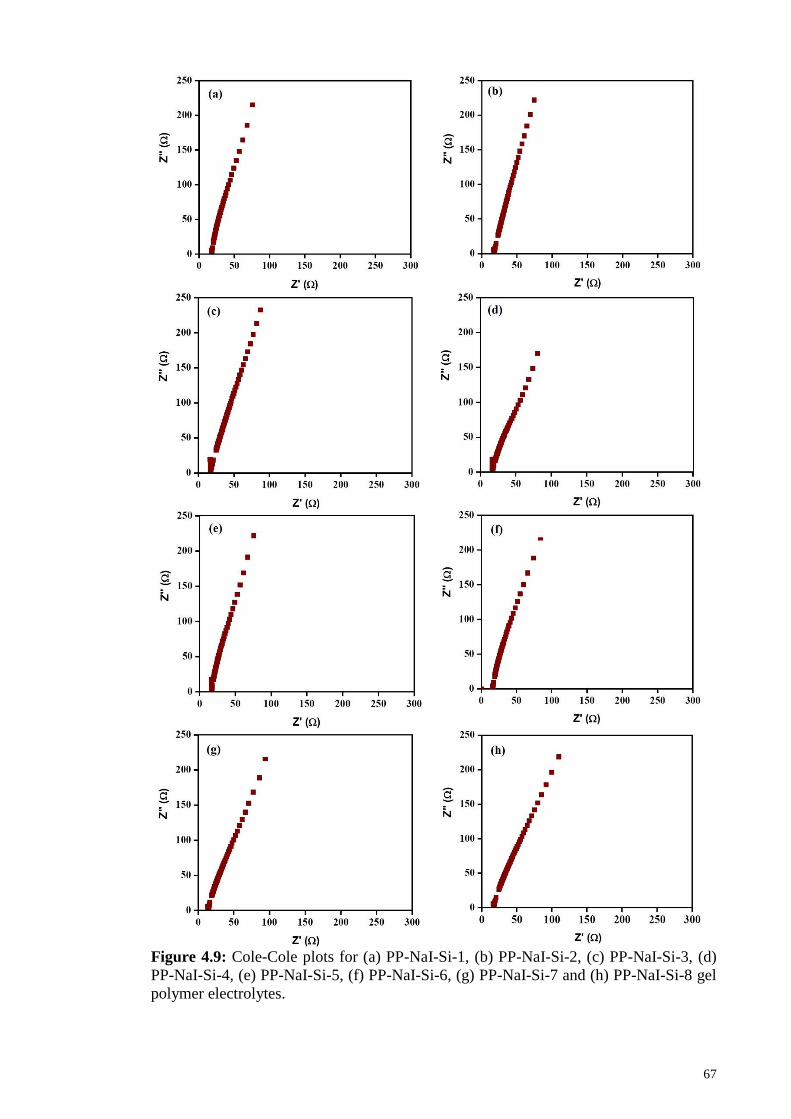
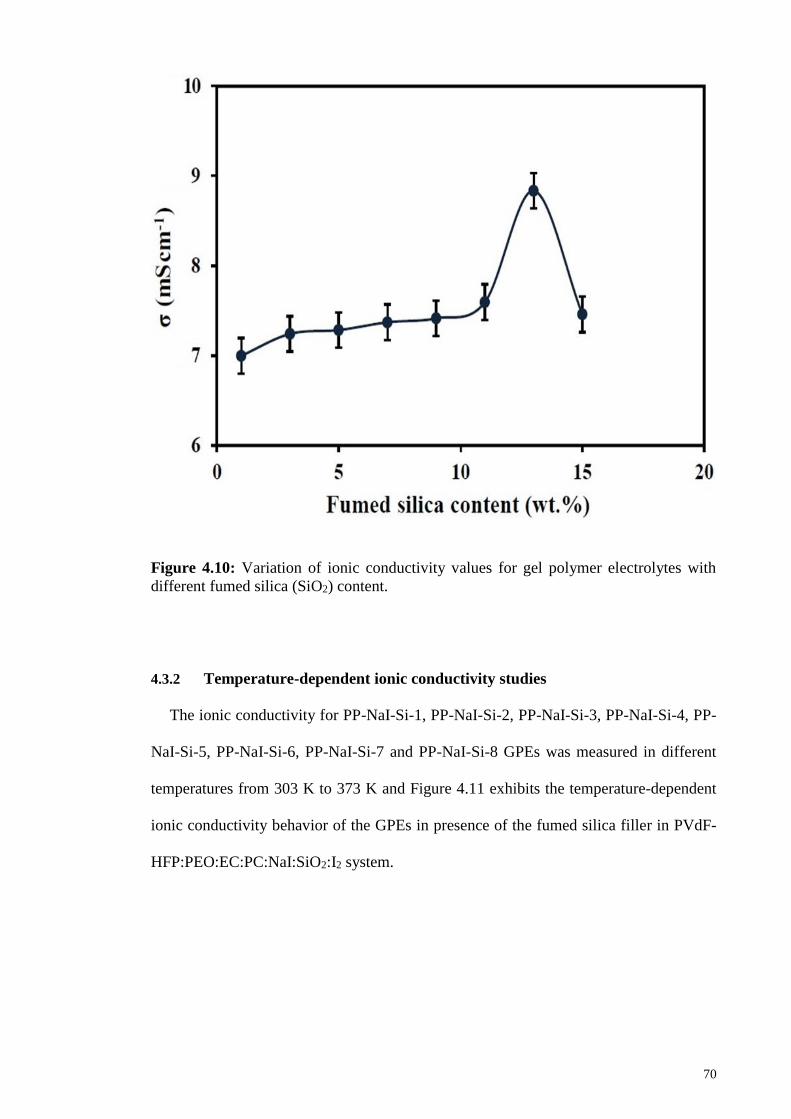
4.3.1 Ionic conductivity studies in ambient temperature ....................................66
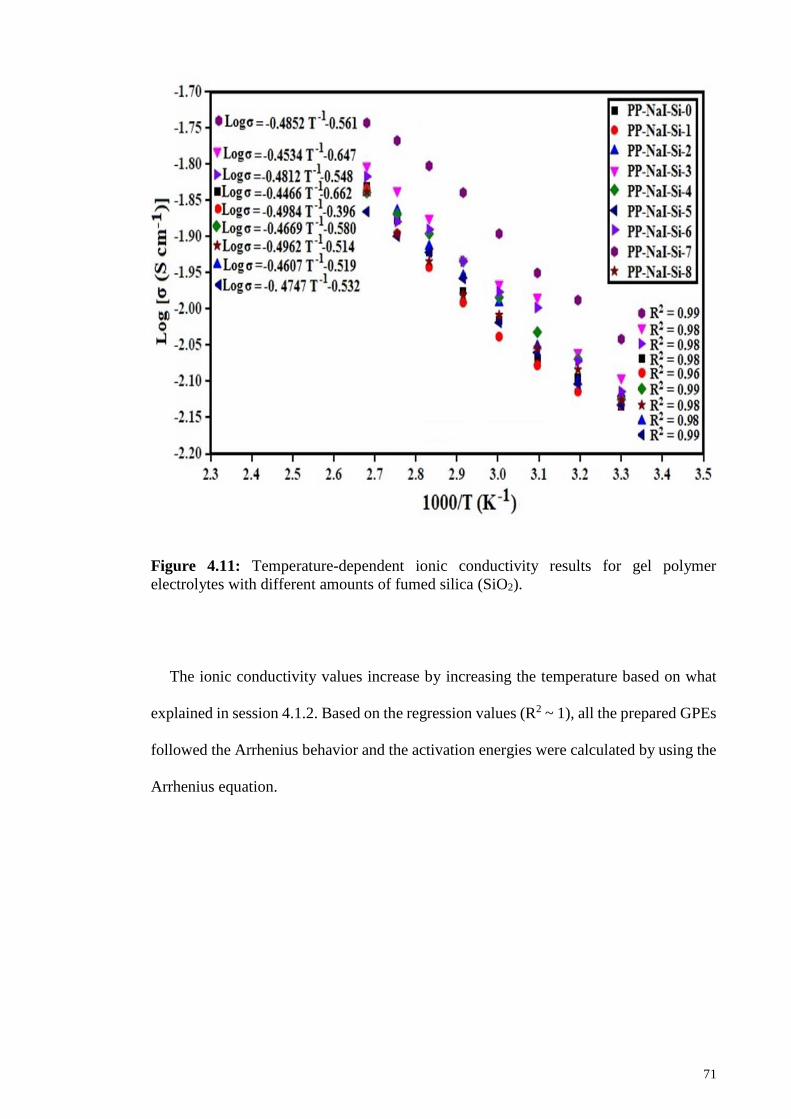
4.3.2 Temperature-dependent ionic conductivity studies ...................................70
4.3.3 FTIR studies ..............................................................................................72
4.3.4 X-ray Diffraction (XRD) studies ...............................................................77
4.3.5 Photocurrent density vs voltage characteristics (J-V) ...............................79
4.4 PVdF-HFP:PEO:EC:PC:NaI:ZnO:I2 gel polymer electrolytes ............................. 82
4.4.1 Ionic conductivity studies in ambient temperature ....................................82
4.4.2 Temperature-dependent ionic conductivity studies ...................................85
4.4.3 FTIR studies ..............................................................................................87
4.4.4 X-ray Diffraction (XRD) studies ...............................................................91
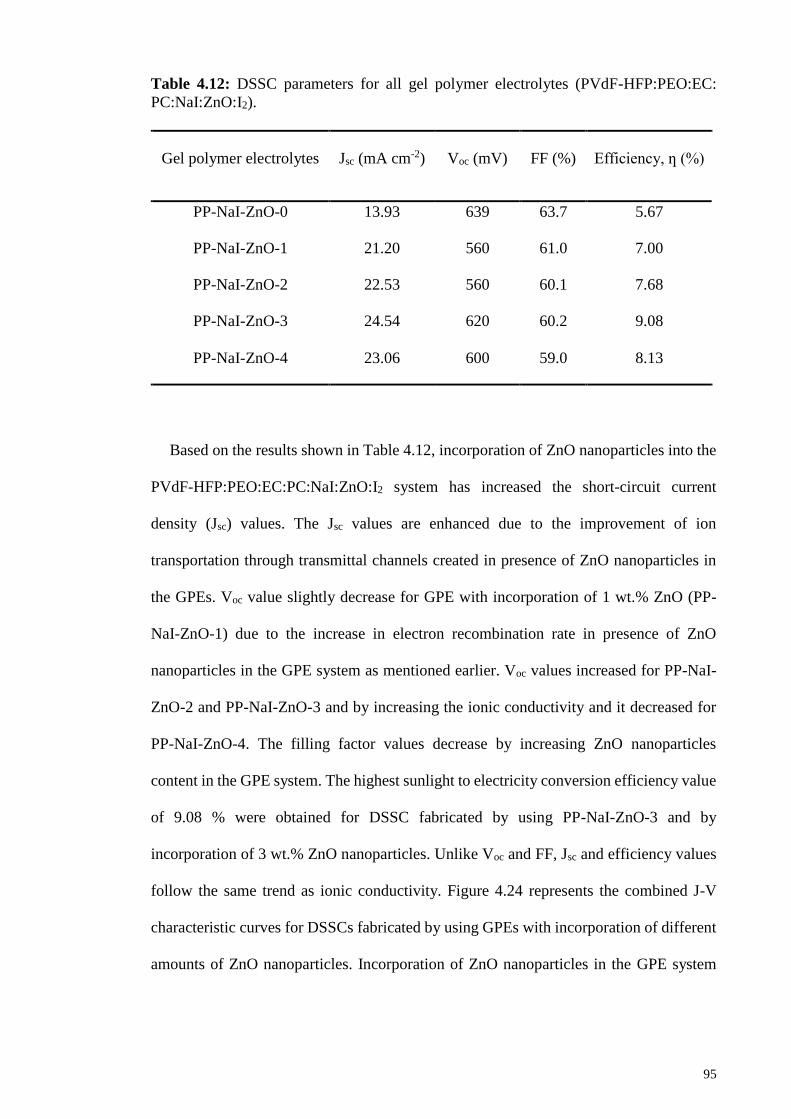
4.4.5 Photocurrent density vs voltage characteristics (J-V) ...............................94
4.5 Summary ................................................................................................................ 96
Page 12
xi
CHAPTER 5: SUMMARY OF THE RESEARCH ................................................... 98
CHAPTER 6: CONCLUSIONS AND FUTURE WORKS ..................................... 101
6.1 Conclusions ......................................................................................................... 101
6.2 Future works ........................................................................................................ 101
REFERENCES ....................................................................................................... 103
LIST OF PUBLICATIONS AND PAPERS PRESENTED ................................ 113
APPENDIX A ......................................................................................................... 114
APPENDIX B .......................................................................................................... 115
APPENDIX C ......................................................................................................... 116
Page 13
xii
LIST OF FIGURES
Figure.2.1:.Variation of solar panel price per watt and global solar panel installation---
by time. (Source: Earth Policy Institute). ....................................................... 7
Figure 2.2: Dye-sensitized solar cell configuration. ......................................................... 9
Figure 2.3: Operating principle of dye-sensitized solar cell (Miki, 2013). ..................... 10
Figure 2.4: Structure of Poly (ethylene oxide). ............................................................... 20
Figure.2.5:.Structure of Poly(vinylidenefluoride-co-hexafluoropropylene) (PVdF----
HFP) ............................................................................................................. 21
Figure 2.6: Sodium iodide (NaI) structure. (Lide, June 17, 1999) .................................. 23
Figure.3.1:.Steps of preparation of three GPE system that investigated in this-.--
research......................................................................................................... 28
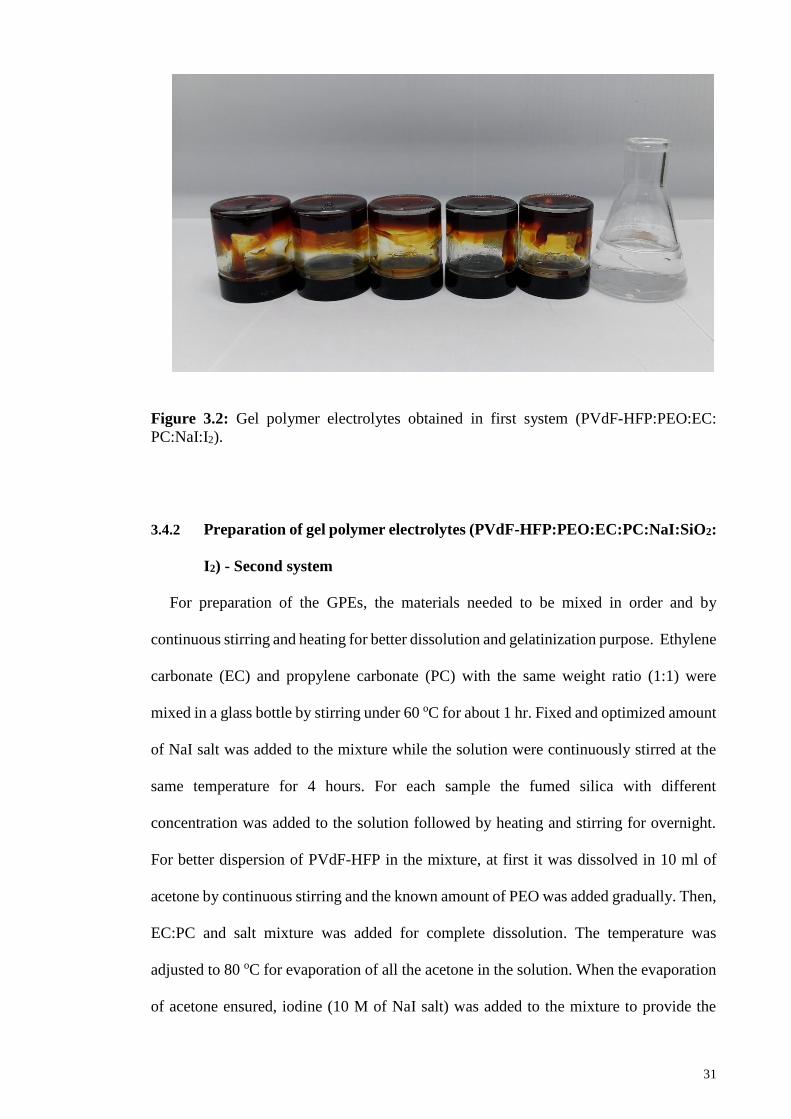
Figure.3.2:.Gel polymer electrolytes obtained in first system (PVdF-HFP:PEO:EC:---
PC:NaI:I2). .................................................................................................... 31
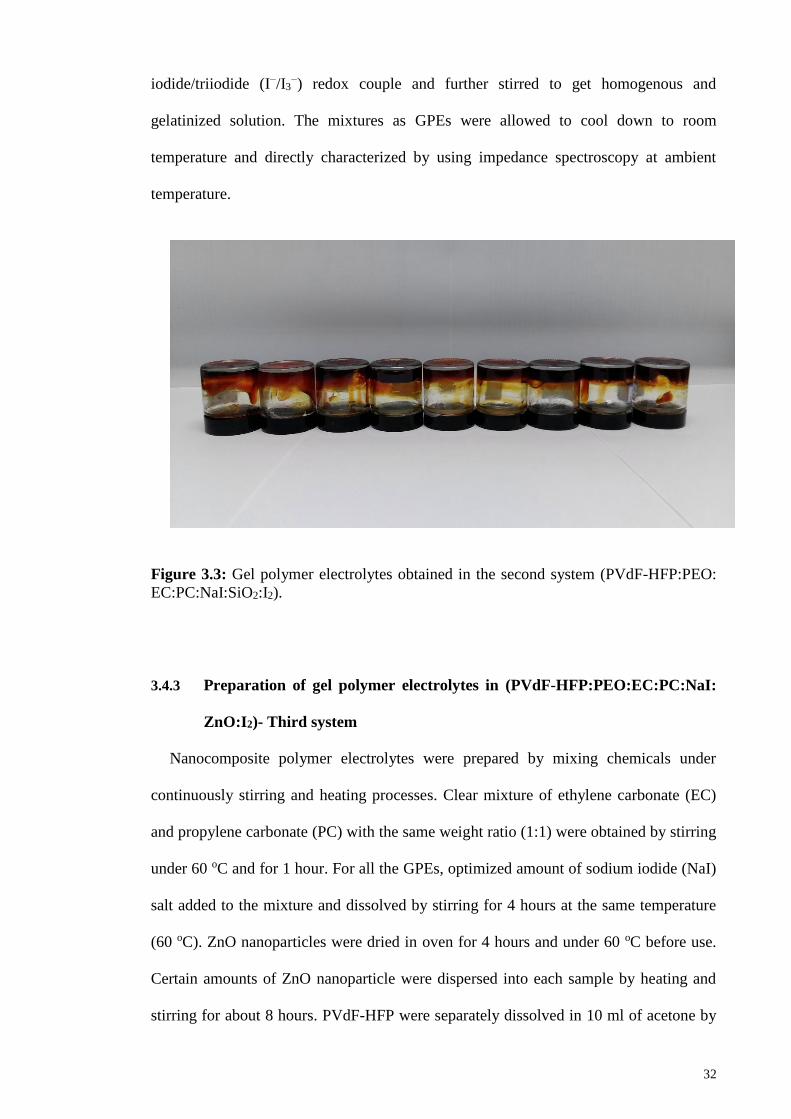
Figure.3.3:.Gel polymer electrolytes obtained in the second system (PVdF-HFP:---
PEO:EC:PC:NaI:SiO2:I2). ............................................................................ 32
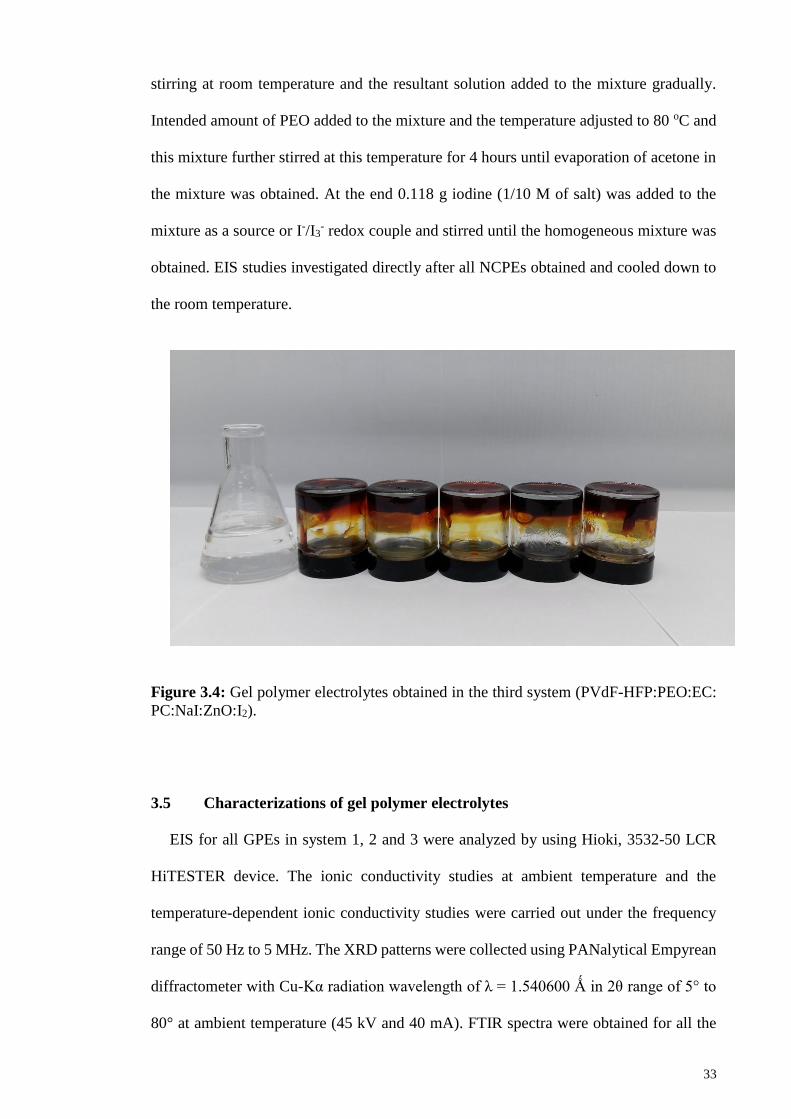
Figure.3.4:.Gel polymer electrolytes obtained in the third system (PVdF-HFP:PEO:---
EC:PC:NaI:ZnO:I2). ..................................................................................... 33
Figure.3.5:.Photograph of the stainless steel cell with two blocking electrodes used---
for electrochemical impedance spectroscopy (EIS) analysis of gel---
polymer electrolytes. .................................................................................... 34
Figure 3.6: Demonstration of Cole-Cole plot and the parameters. ................................. 35
Figure.3.7:.Fourier transform infrared spectroscopy (FTIR) instrumentation---
(Vedantam, 2014). ........................................................................................ 37
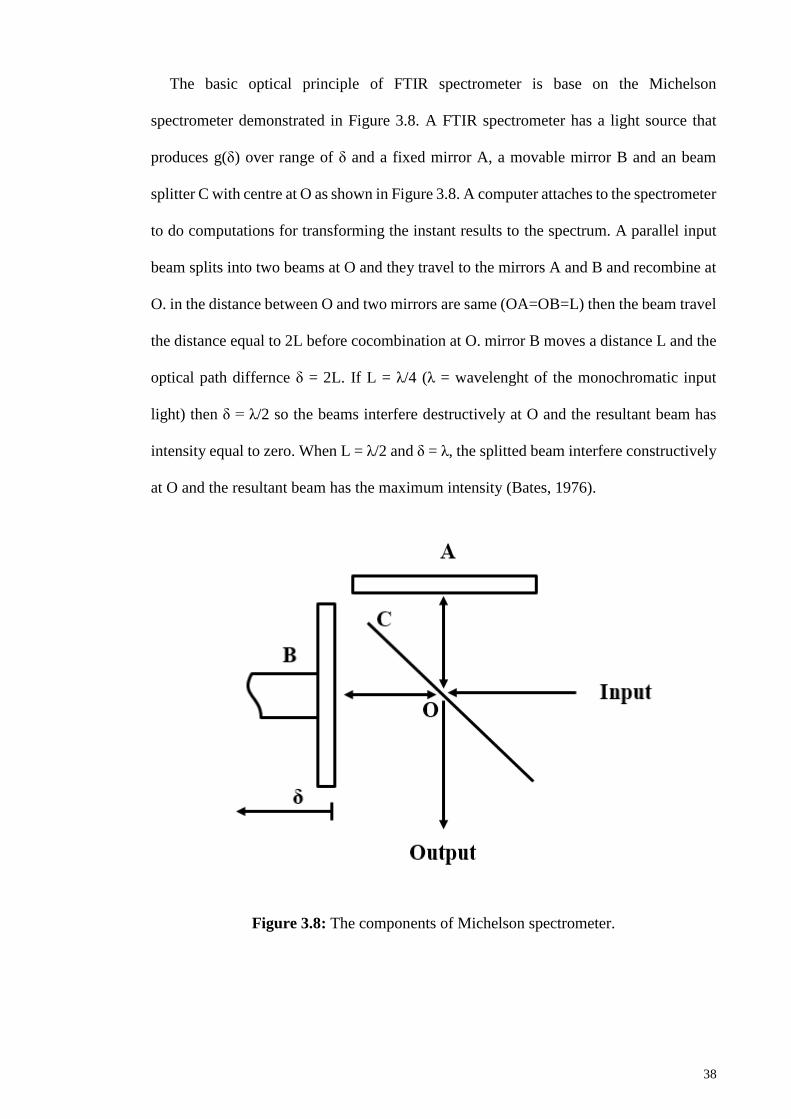
Figure 3.8: The components of Michelson spectrometer. ............................................... 38
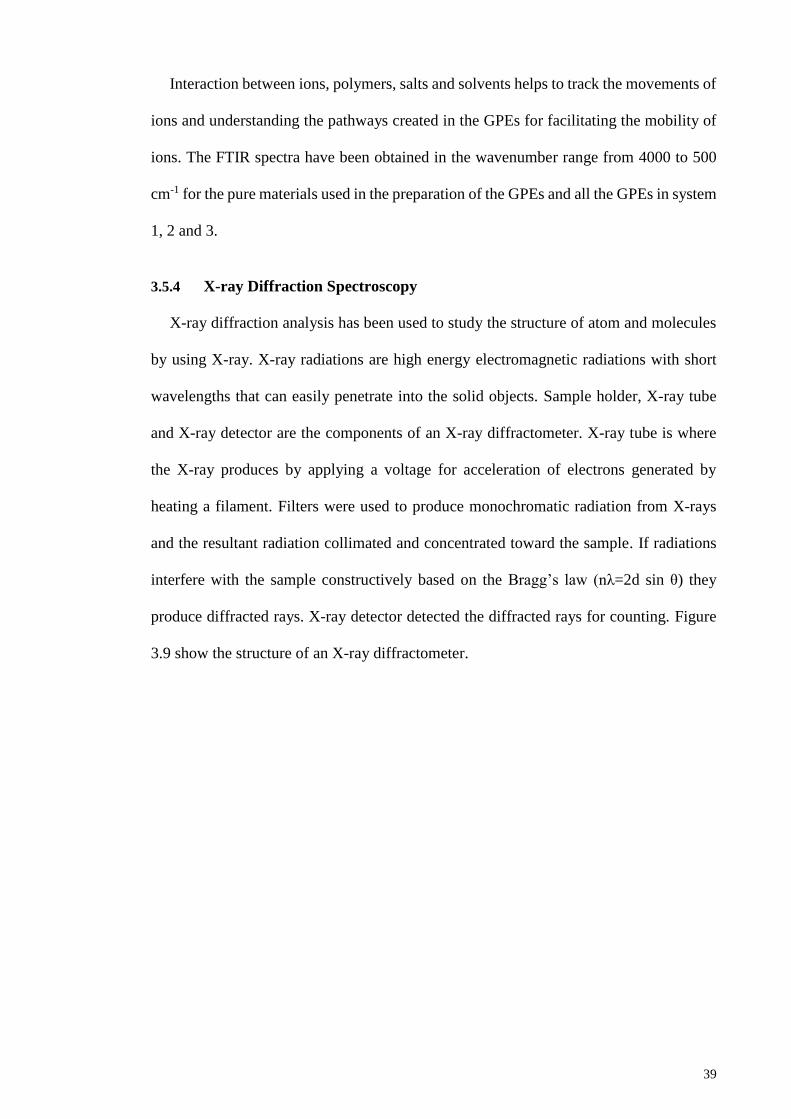
Figure 3.9: X-ray diffractometer. (He et al., 2000) ......................................................... 40
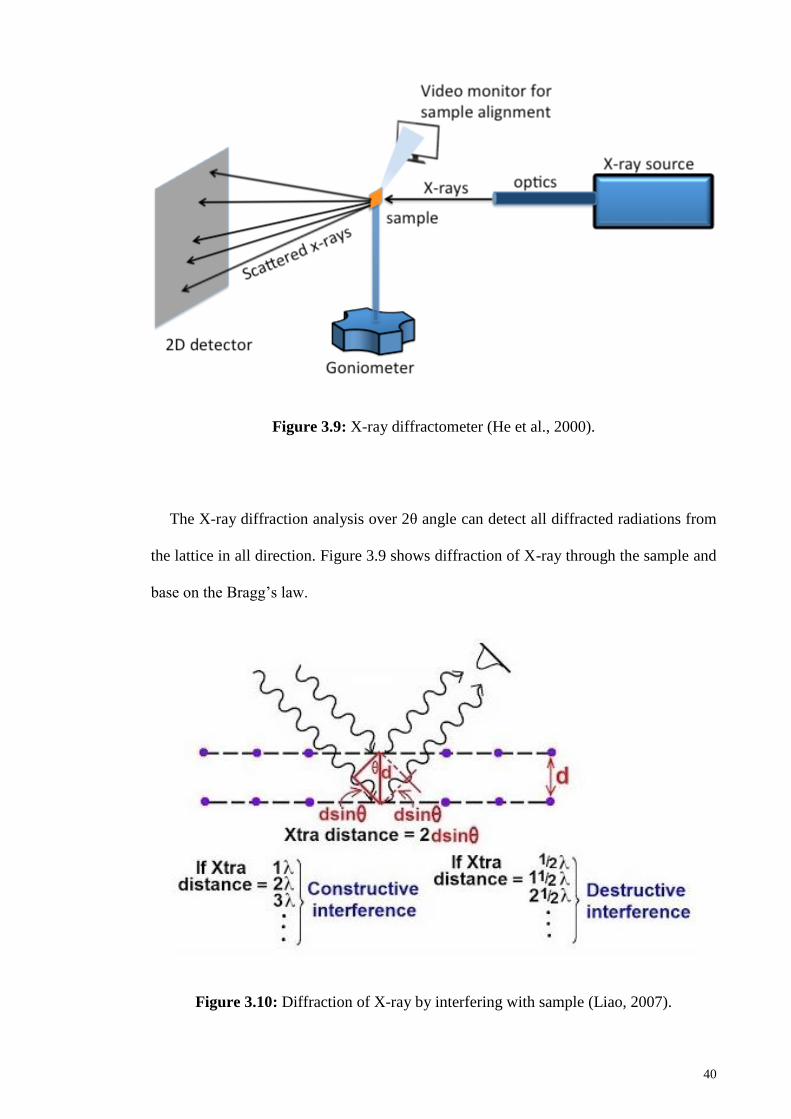
Figure 3.10:.Diffraction of X-ray by interfering with sample.(Liao, 2007) ................... 40
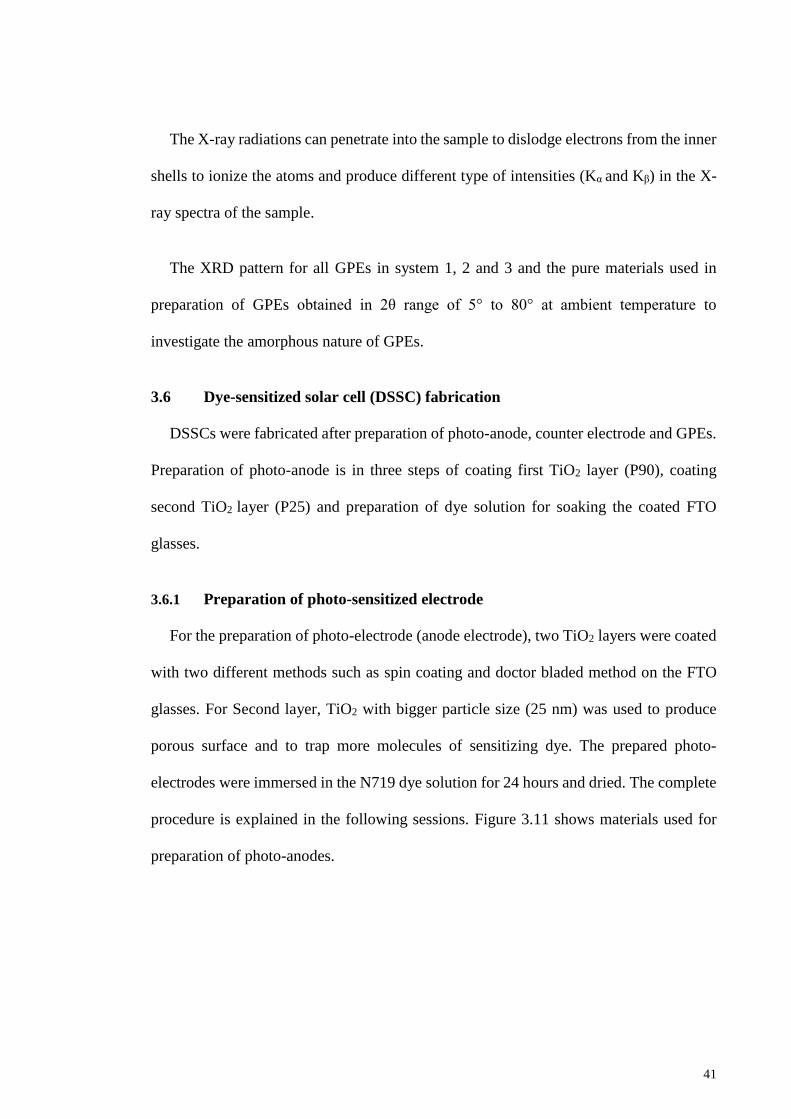
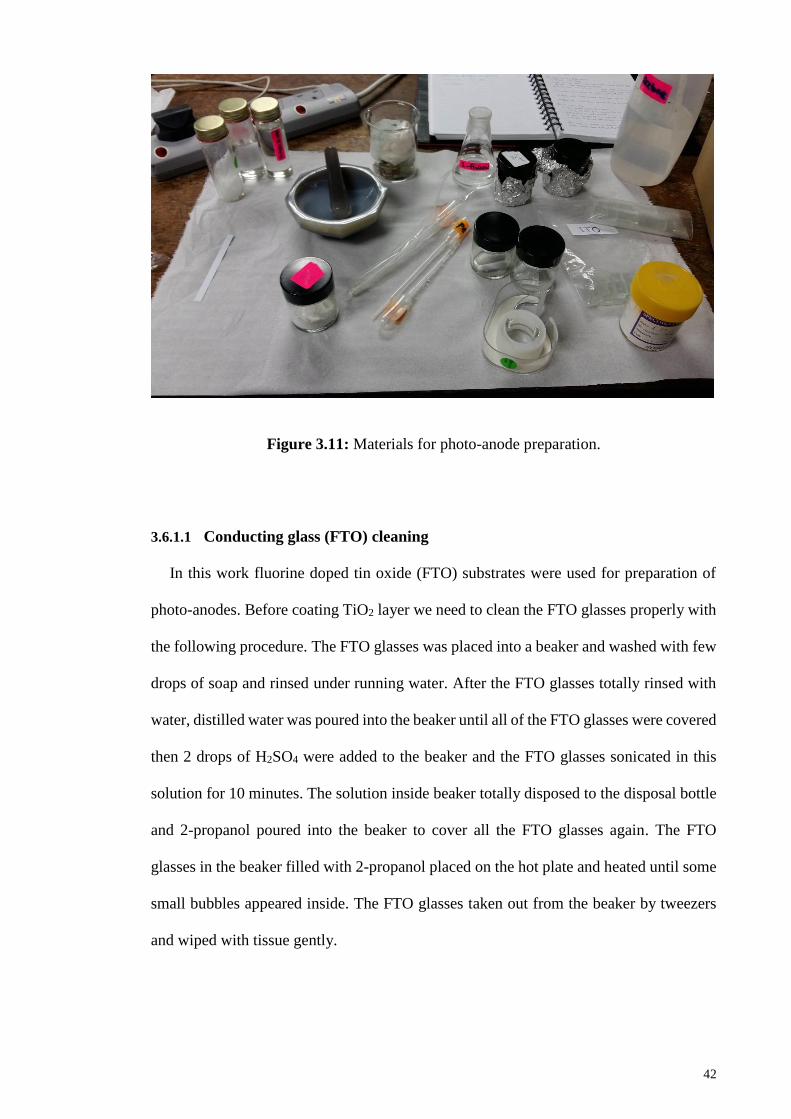
Figure 3.11:.Materials for photo-anode preparation. ...................................................... 42
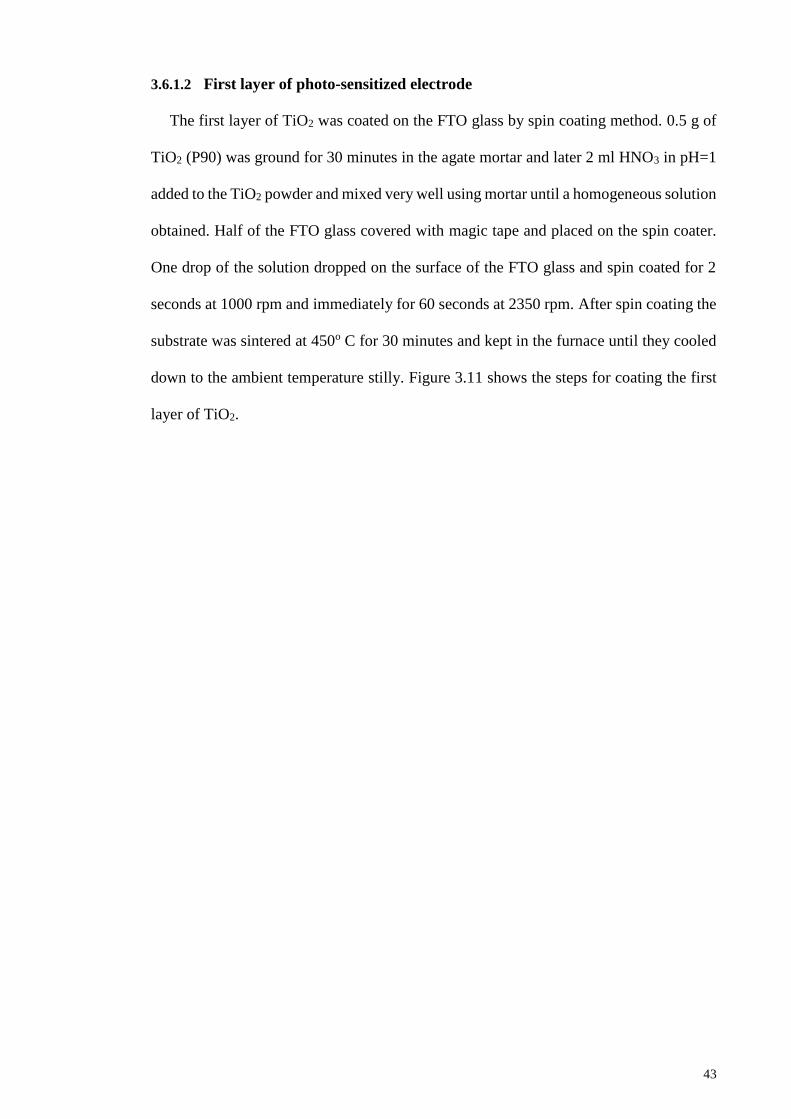
Figure 3.12:.Procedures of coating the first layer of TiO2 (P90). ................................... 44
Page 14
xiii
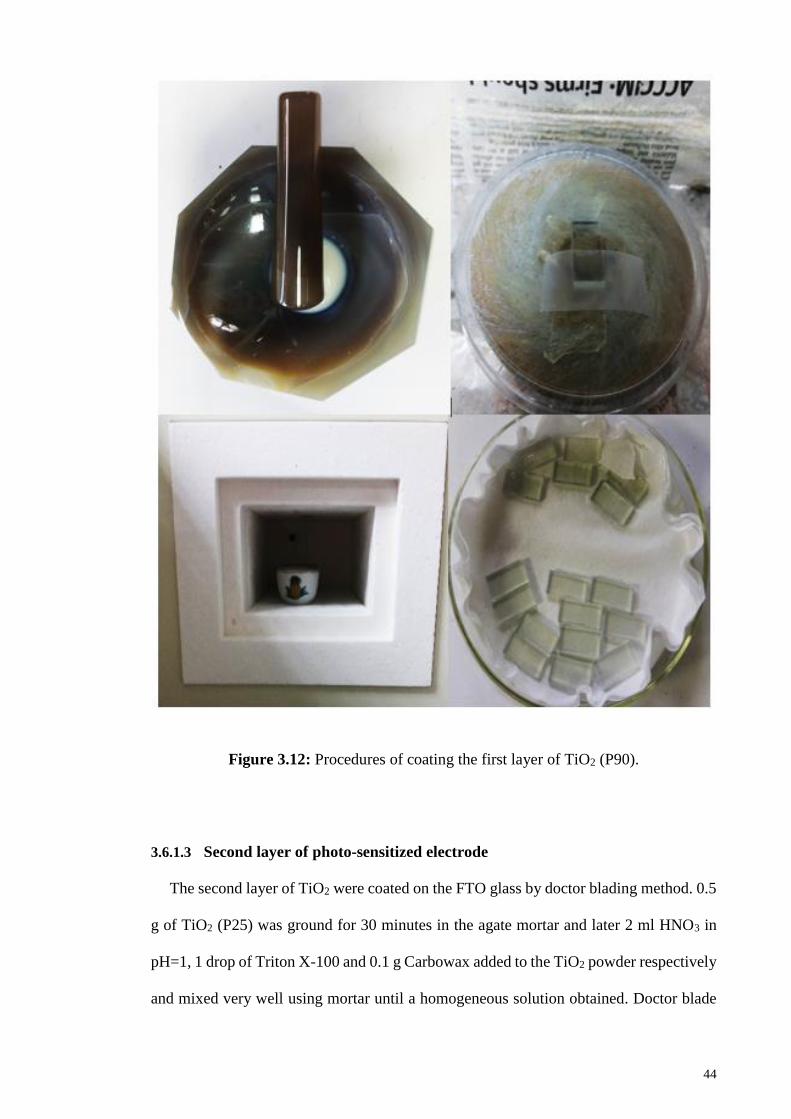
Figure 3.13: Coating the second layer of TiO2 by doctor blade method......................... 45
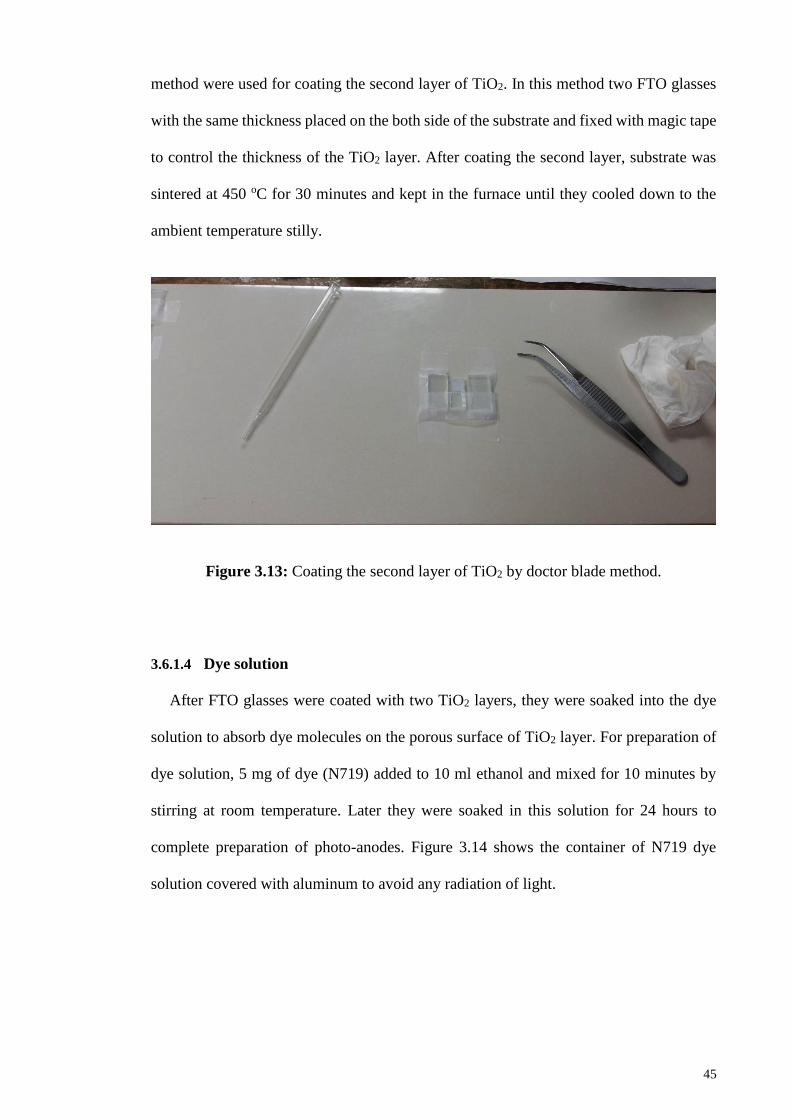
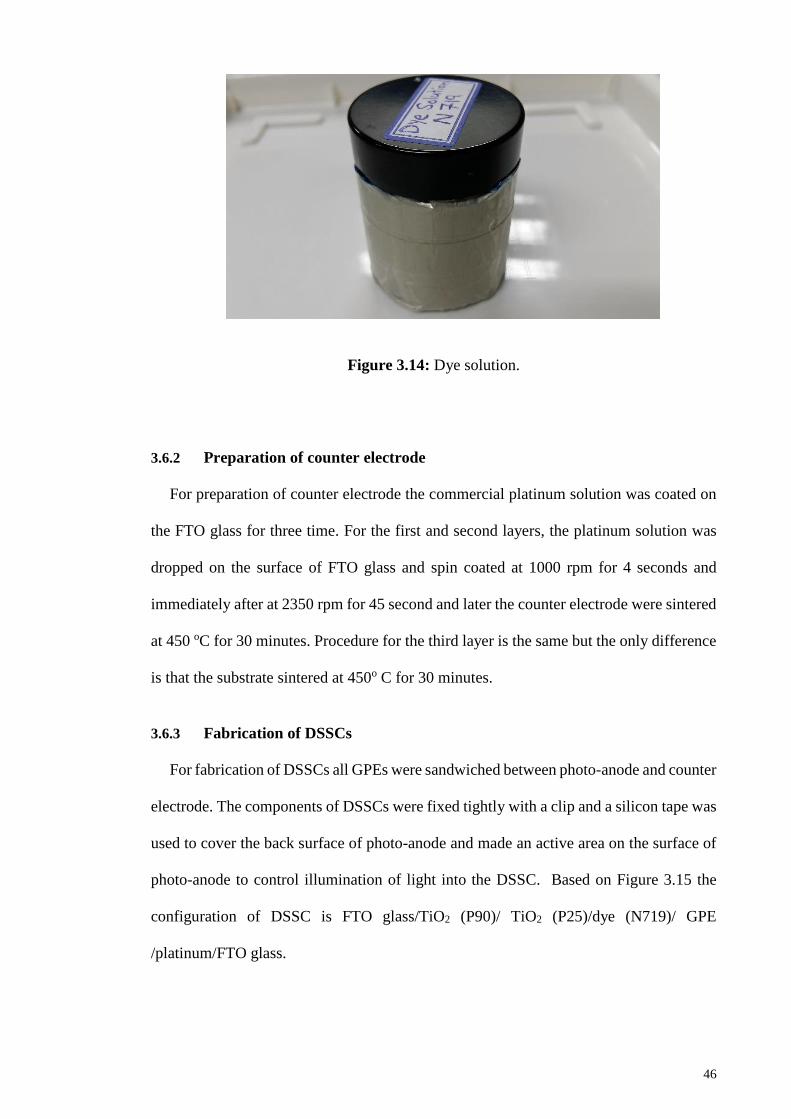
Figure 3.14: Dye solution. ............................................................................................... 46
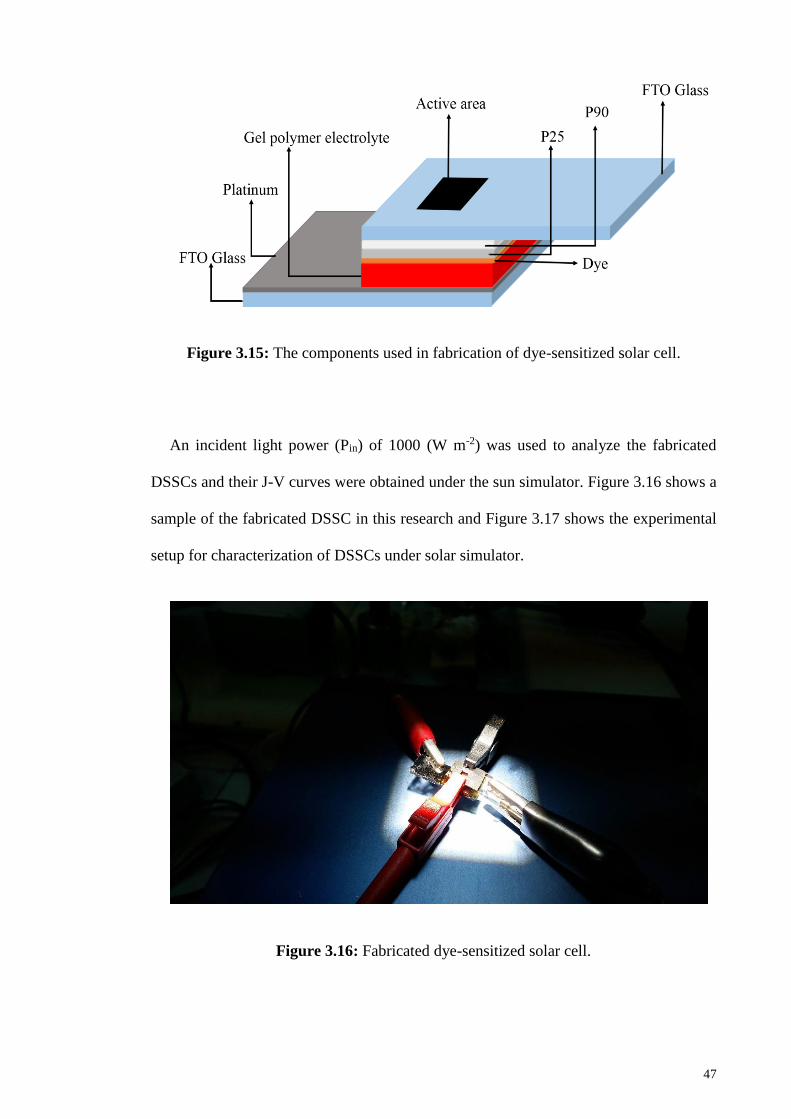
Figure 3.15: The components used in fabrication of dye-sensitized solar cell. .............. 47
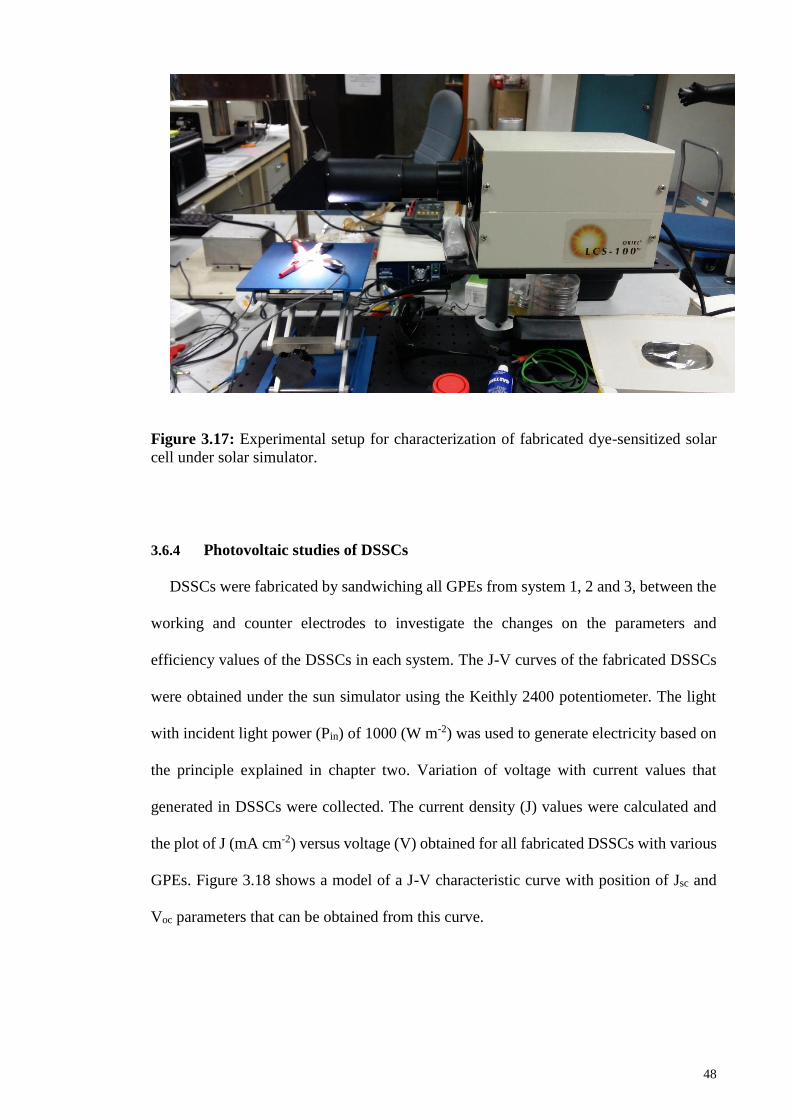
Figure 3.16: Fabricated dye-sensitized solar cell. ........................................................... 47
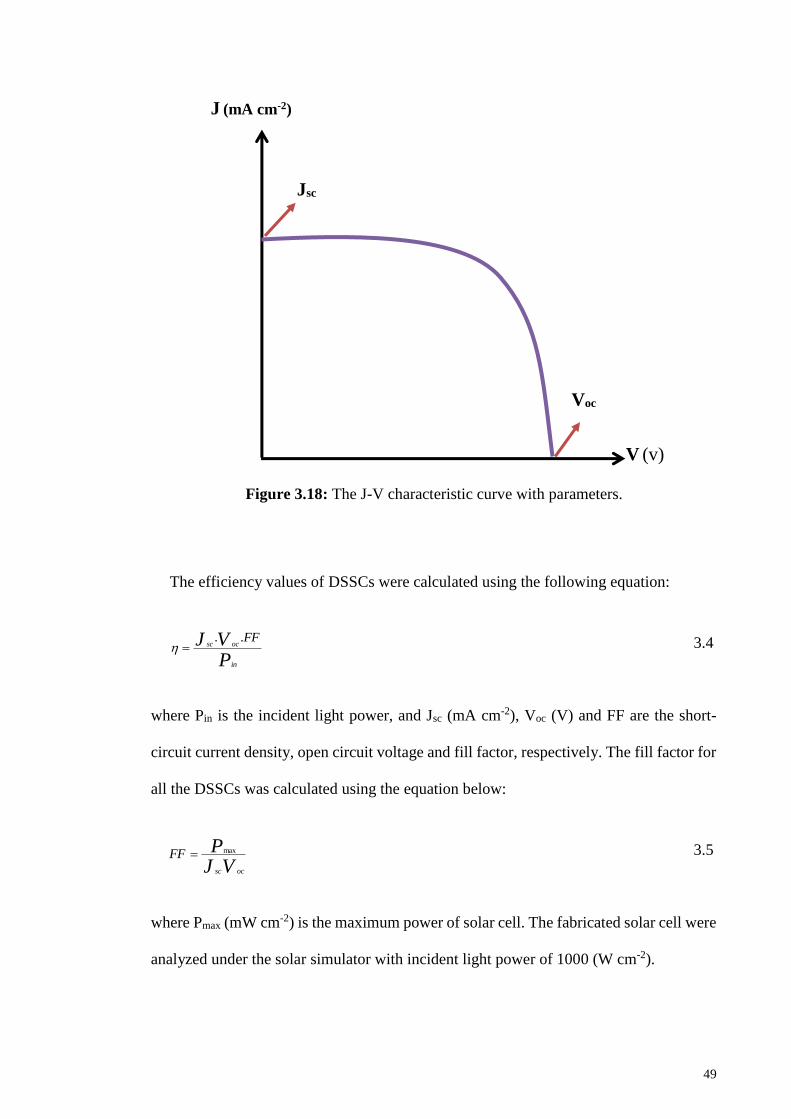
Figure 3.17: Experimental setup for characterization of fabricated dye-sensitized solar---
cell under solar simulator. .......................................................................... 48
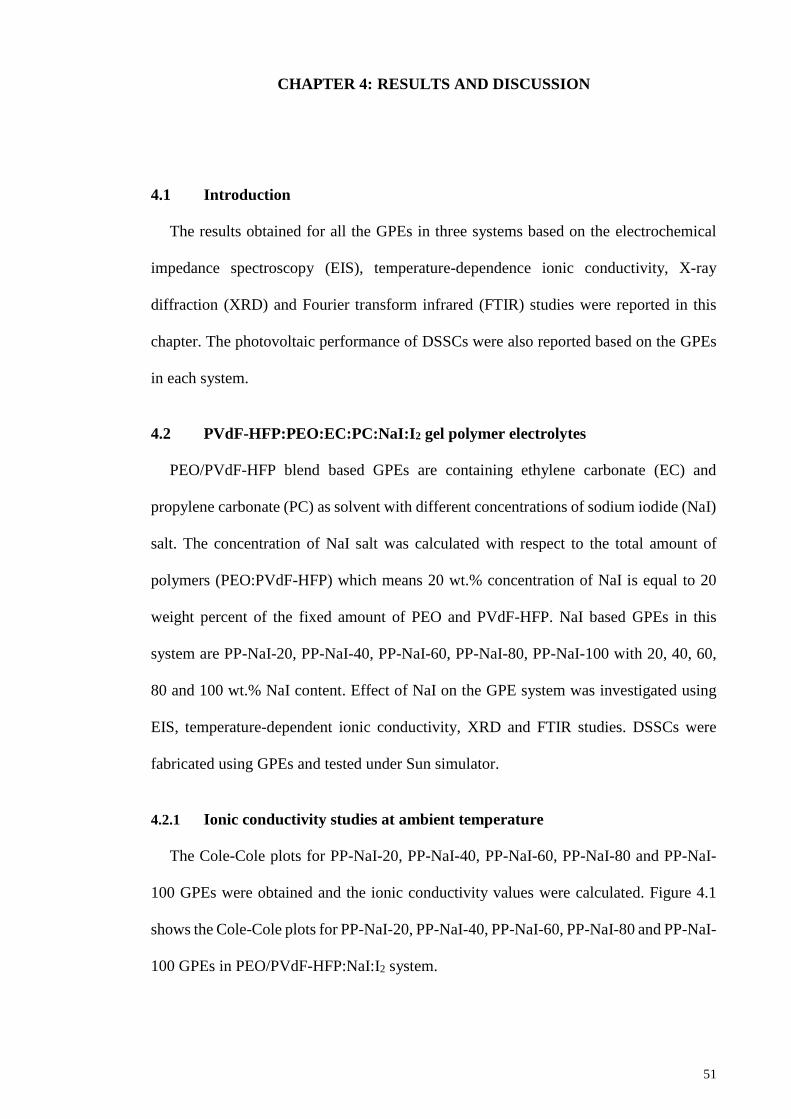
Figure 3.18: The J-V characteristic curve with parameters. ........................................... 49
Figure 4.1: Cole-Cole plots for (a) PP-NaI-20, (b) PP-NaI-40, (c) PP-NaI-60, (d) PP----
NaI-80 and (e) PP-NaI-100 gel polymer electrolytes. ............................... 52
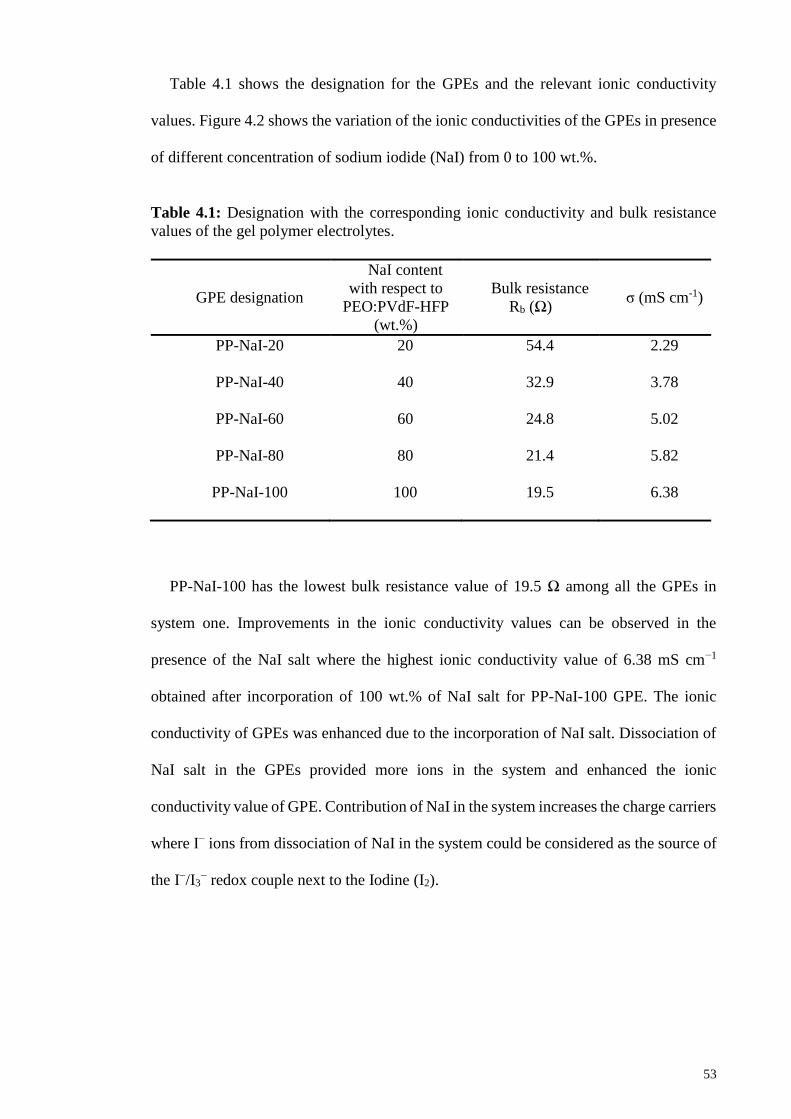
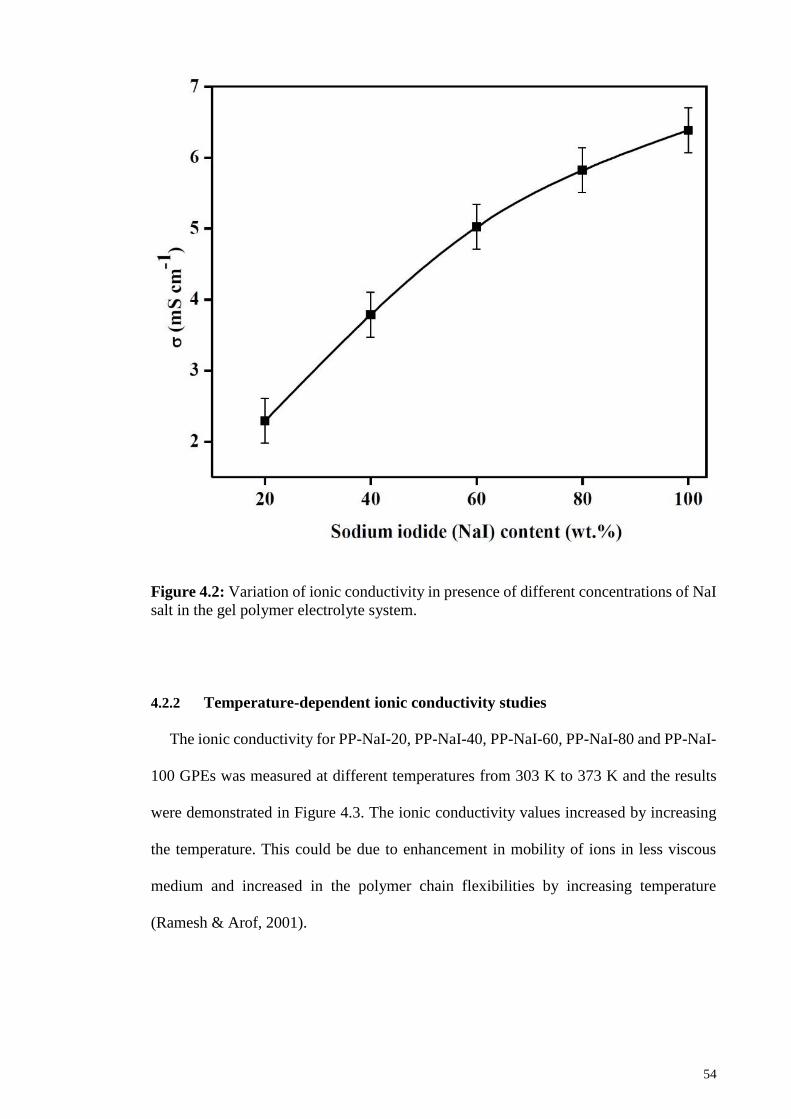
Figure 4.2: .Variation of ionic conductivity in presence of different concentrations of---
NaI salt in the gel polymer electrolyte system. .......................................... 54
Figure 4.3: Temperature-dependent ionic conductivity results for PP-NaI-20, PP-NaI---
-40, PP-NaI-60, PP-NaI-80 and PP-NaI-100 gel polymer electrolytes. .... 55
Figure 4.4: FTIR spectra of pure PEO, PVdF-HFP and NaI. ....................................... 57
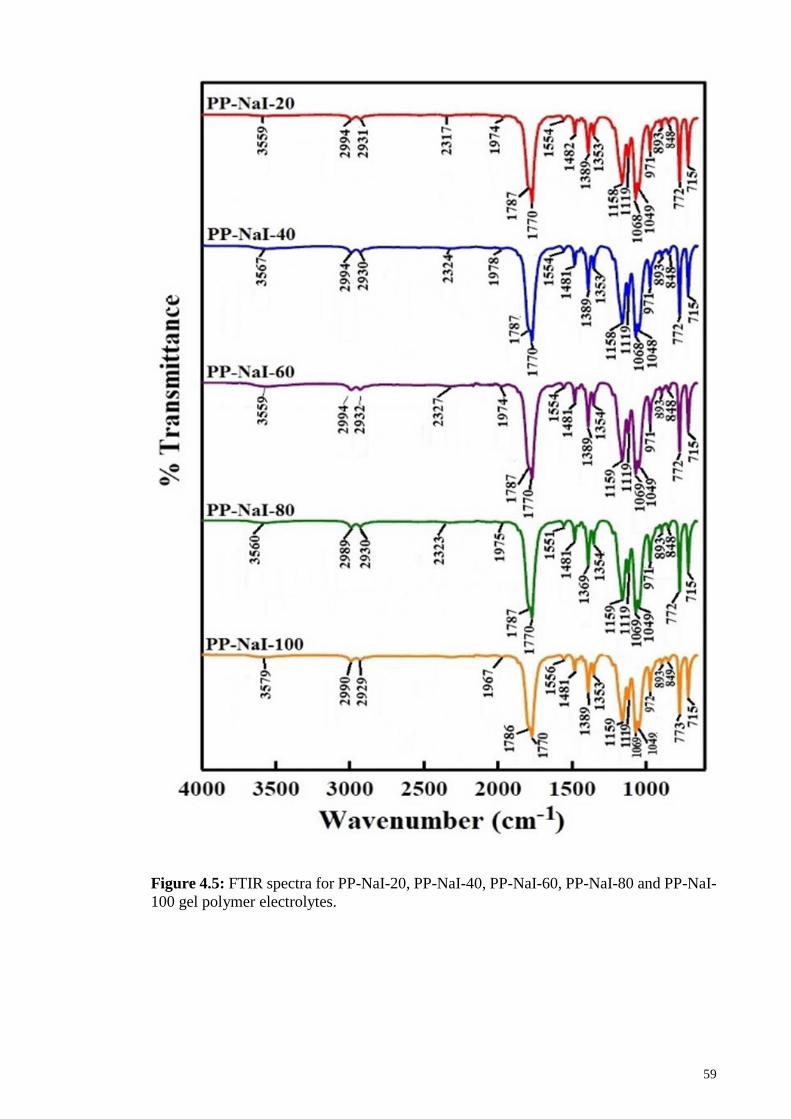
Figure 4.5: FTIR spectra for PP-NaI-20, PP-NaI-40, PP-NaI-60, PP-NaI-80 and PP----
NaI-100 gel polymer electrolytes. ............................................................. 59
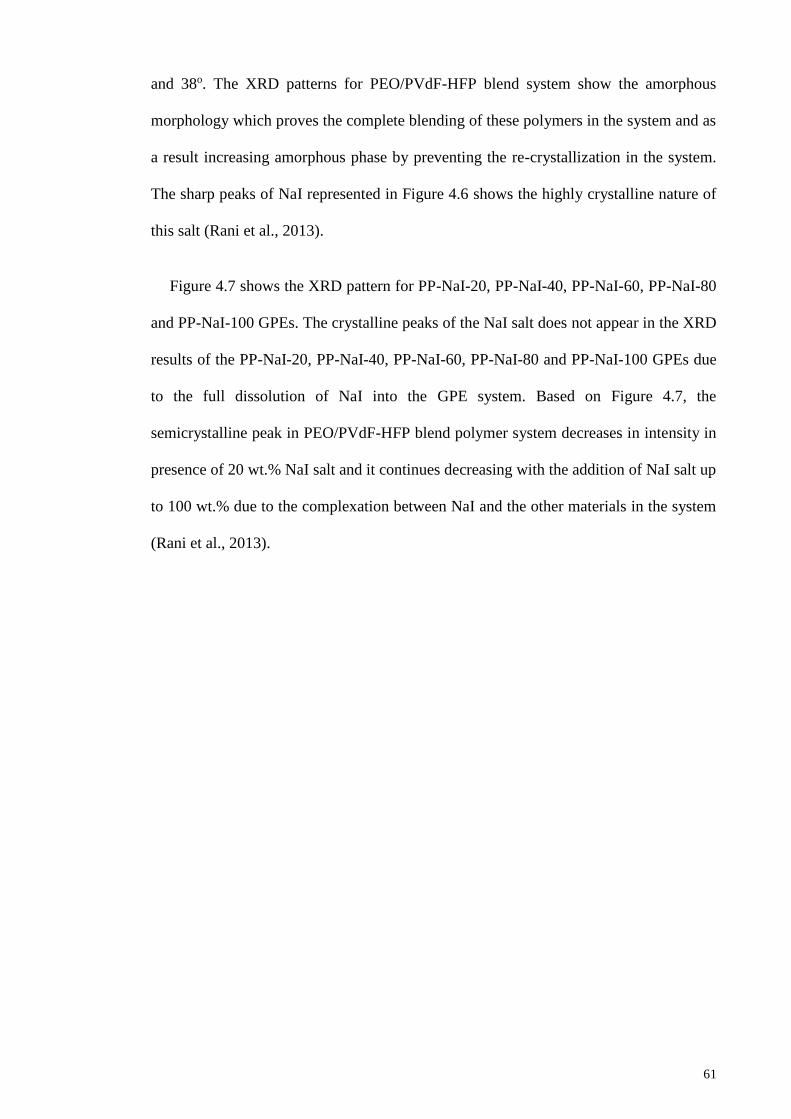
Figure.4.6: .XRD patterns for NaI salt, PEO, PVdF-HFP and PEO/PVdF-HFP---
polymers. .................................................................................................... 62
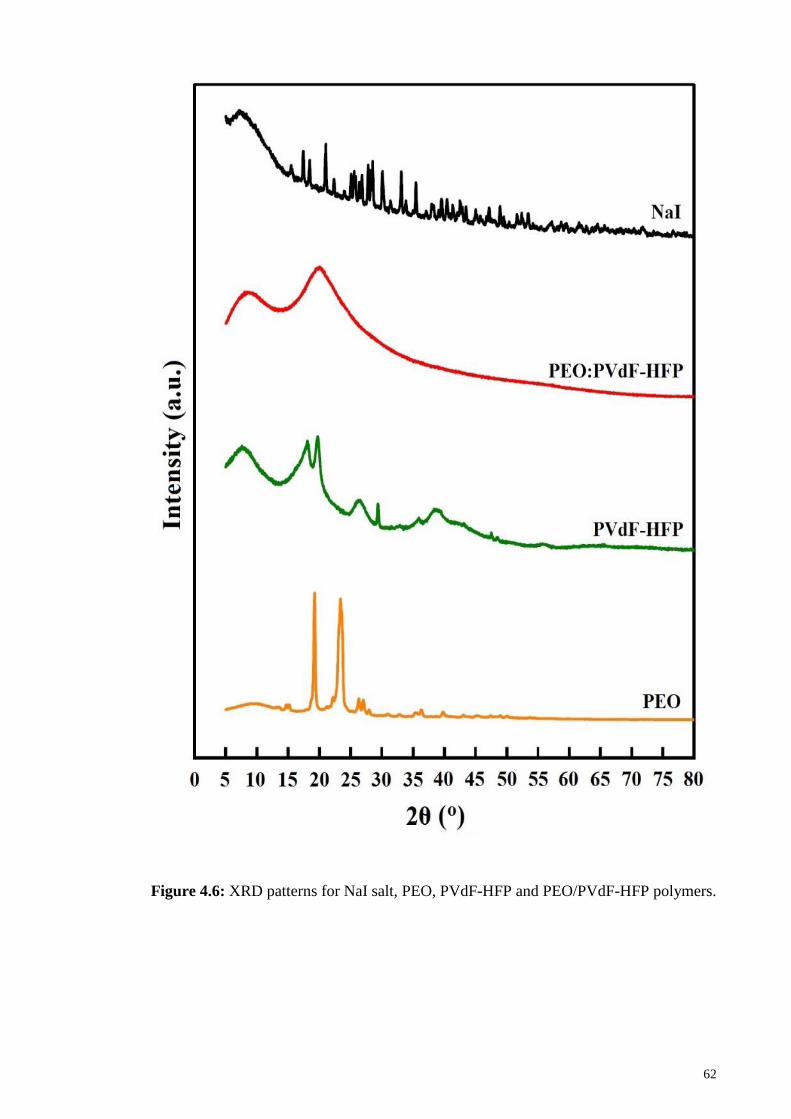
Figure 4.7: XRD patterns for PEO/PVdF-HFP and PP-NaI-20, PP-NaI-40, PP-NaI----
60, PP-NaI-80 and PP-NaI-100 gel polymer electrolytes. ......................... 63
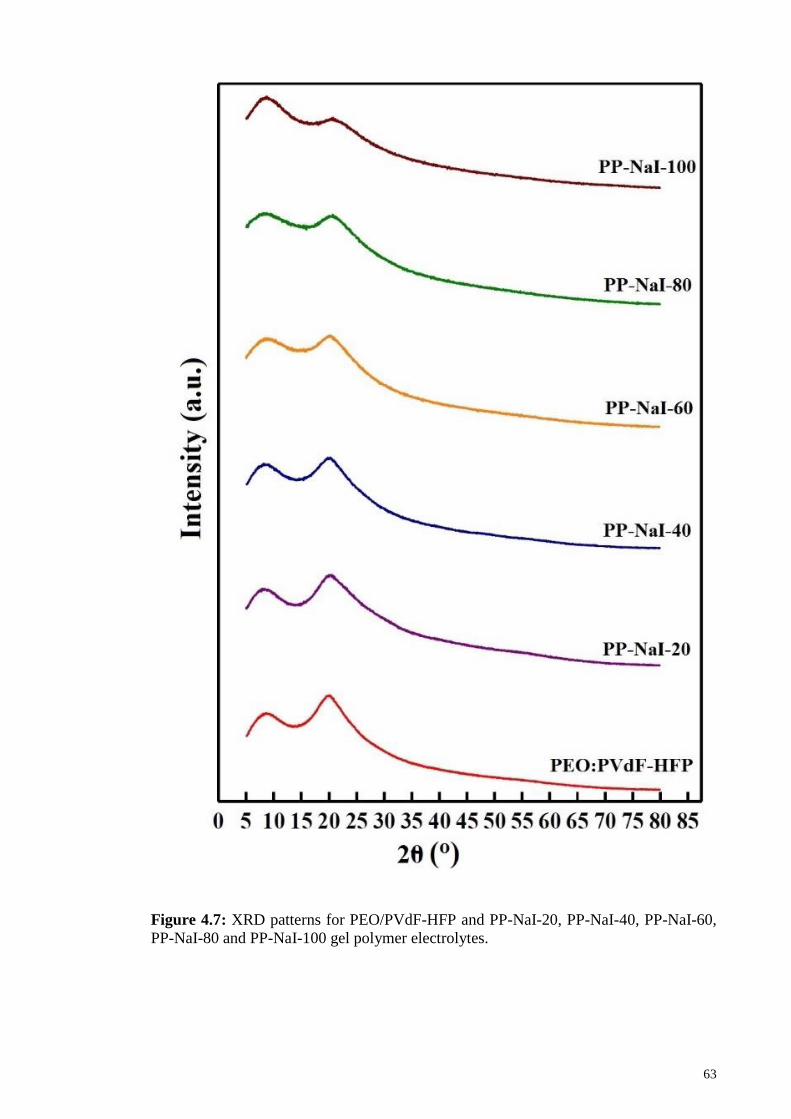
Figure 4.8: J-V characteristic curves for the DCCSs fabricated using PP-NaI-20, PP----
NaI-40, PP-NaI-60, PP-NaI-80 and PP-NaI-100 gel polymer electrolytes.---
................................................................................................................... 64
Figure 4.9: Cole-Cole plots for (a) PP-NaI-Si-1, (b) PP-NaI-Si-2, (c) PP-NaI-Si-3,---
(d) PP-NaI-Si-4, (e) PP-NaI-Si-5, (f) PP-NaI-Si-6, (g) PP-NaI-Si-7 and---
(h) PP-NaI-Si-8 gel polymer electrolytes. ................................................. 67
Figure.4.10: Variation of ionic conductivity values for gel polymer electrolytes with---
different fumed silica (SiO2) content. ........................................................ 70
Figure.4.11:.Temperature-dependent ionic conductivity results for gel polymer---
electrolytes with different amounts of fumed silica (SiO2). ...................... 71
Page 15
xiv
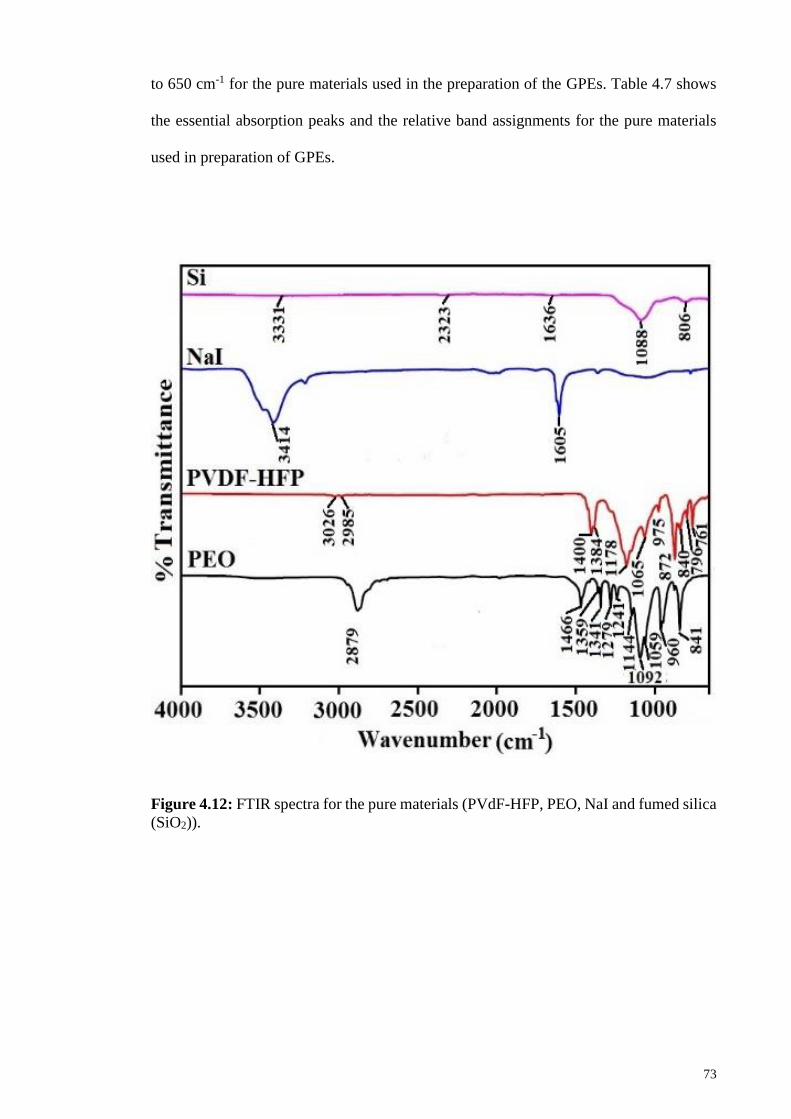
Figure.4.12: FTIR spectra for the pure materials (PVdF-HFP, PEO, NaI and fumed---
silica (SiO2)). ............................................................................................. 73
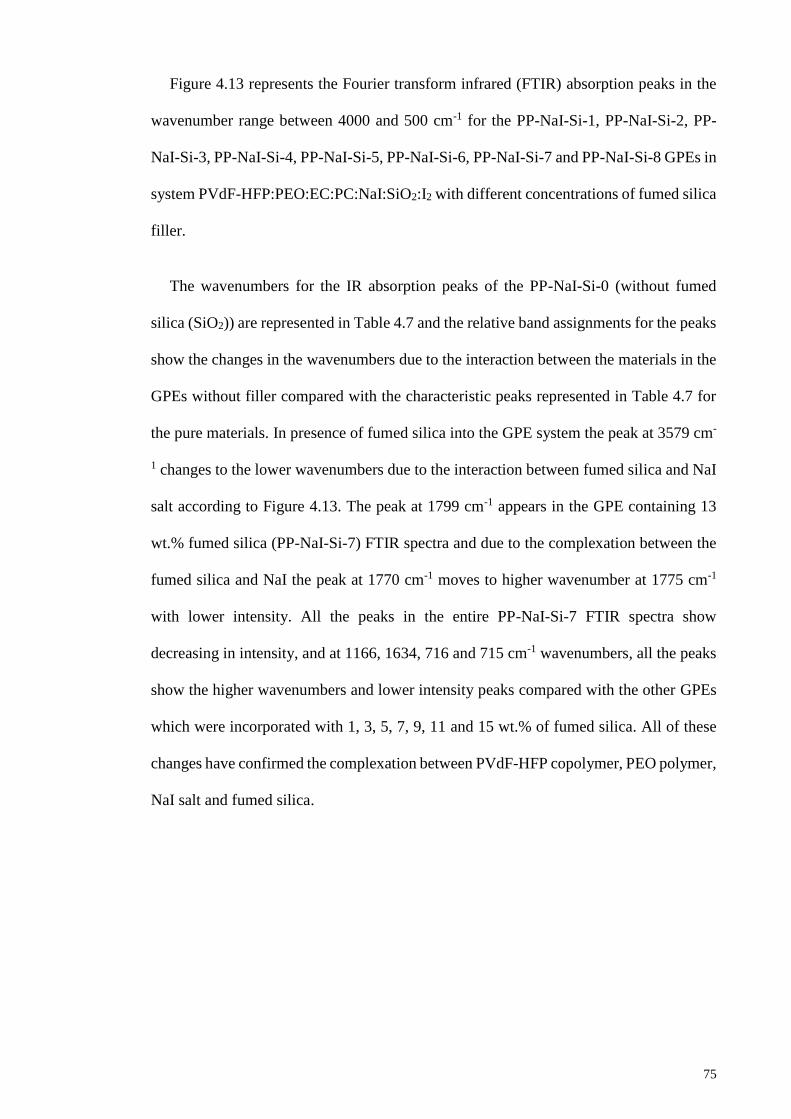
Figure 4.13: FTIR spectra for PVdF-HFP:PEO:EC:PC:NaI:SiO2:I2 system. ................. 76
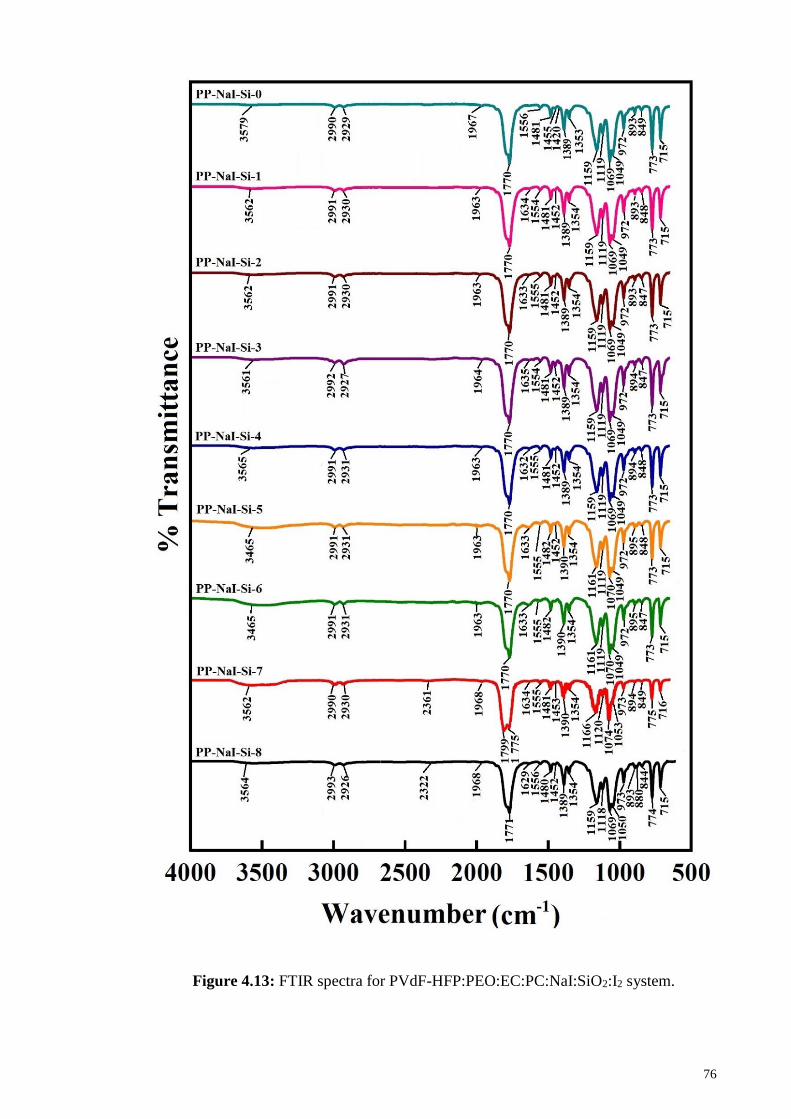
Figure 4.14: XRD patterns for pure materials (PVdF-HFP, PEO, NaI and fumed silica---
(SiO2)) used in preparation of gel polymer electrolytes in PVdF-HFP:---
PEO:EC:PC:NaI:SiO2:I2 system. ............................................................... 78
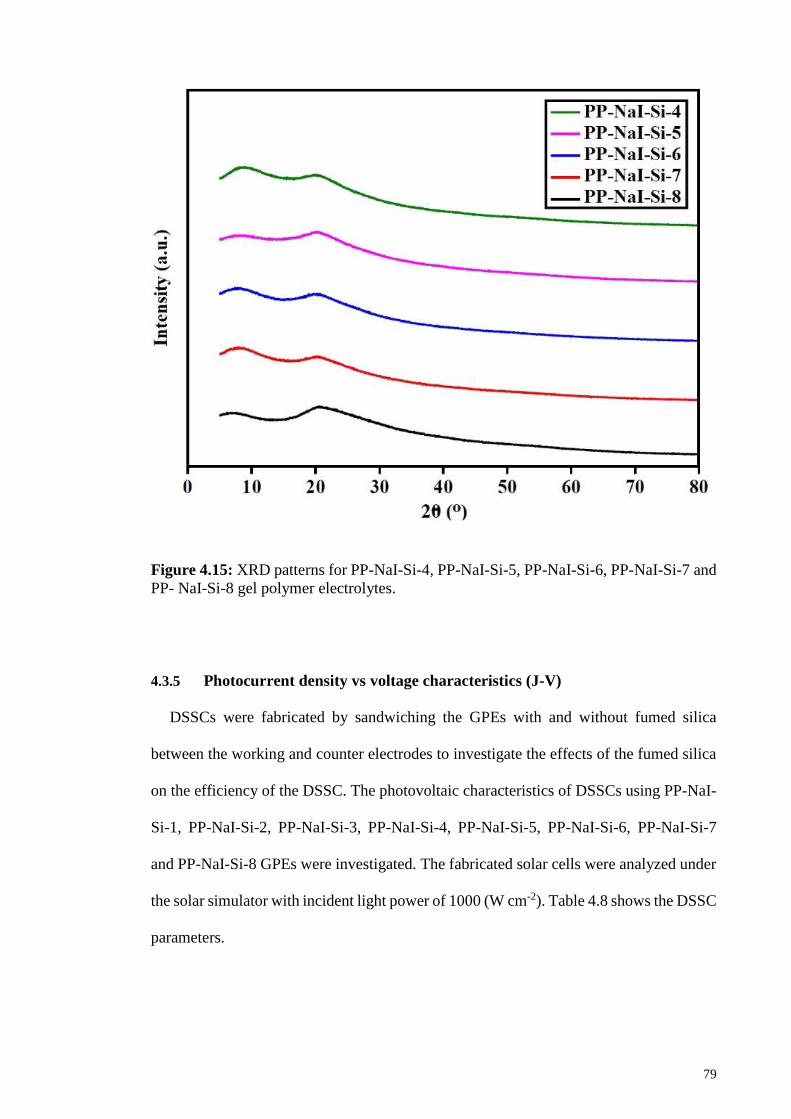
Figure.4.15: XRD patterns for PP-NaI-Si-4, PP-NaI-Si-5, PP-NaI-Si-6, PP-NaI-Si-7---
and PP- NaI-Si-8 gel polymer electrolytes. ............................................... 79
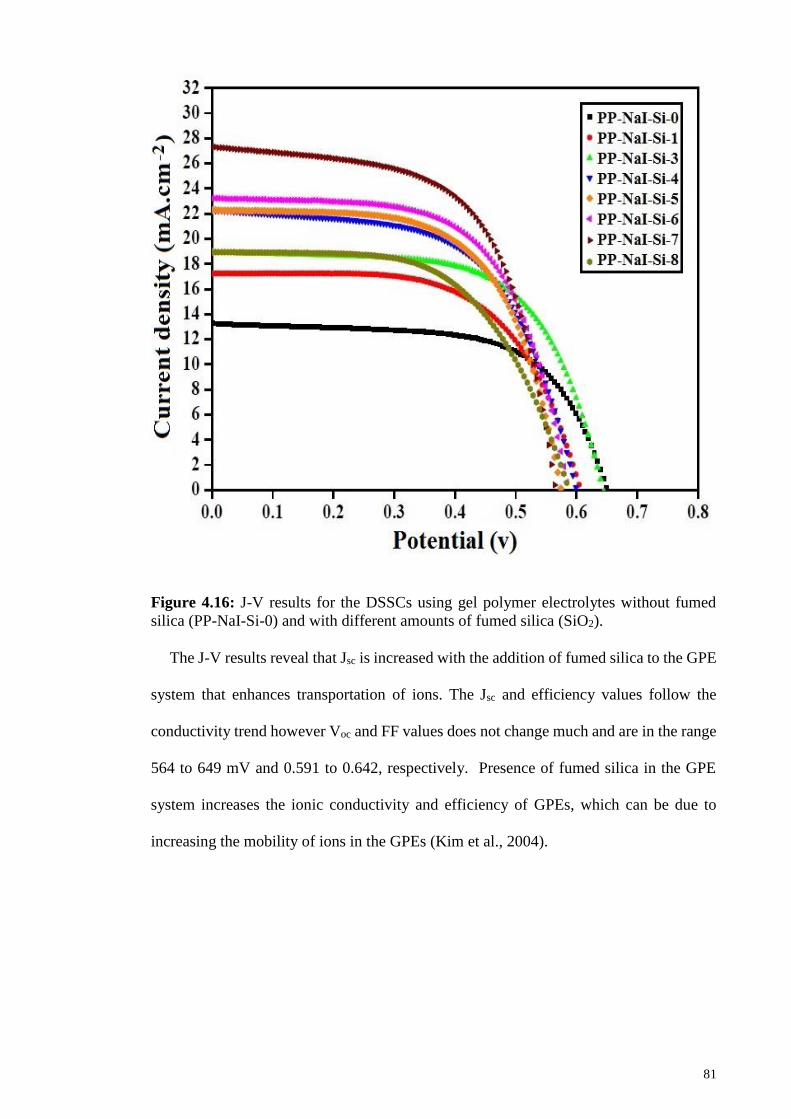
Figure 4.16: J-V results for the DSSCs using gel polymer electrolytes without fumed---
silica (PP-NaI-Si-0) and with different amounts of fumed silica (SiO2). .. 81
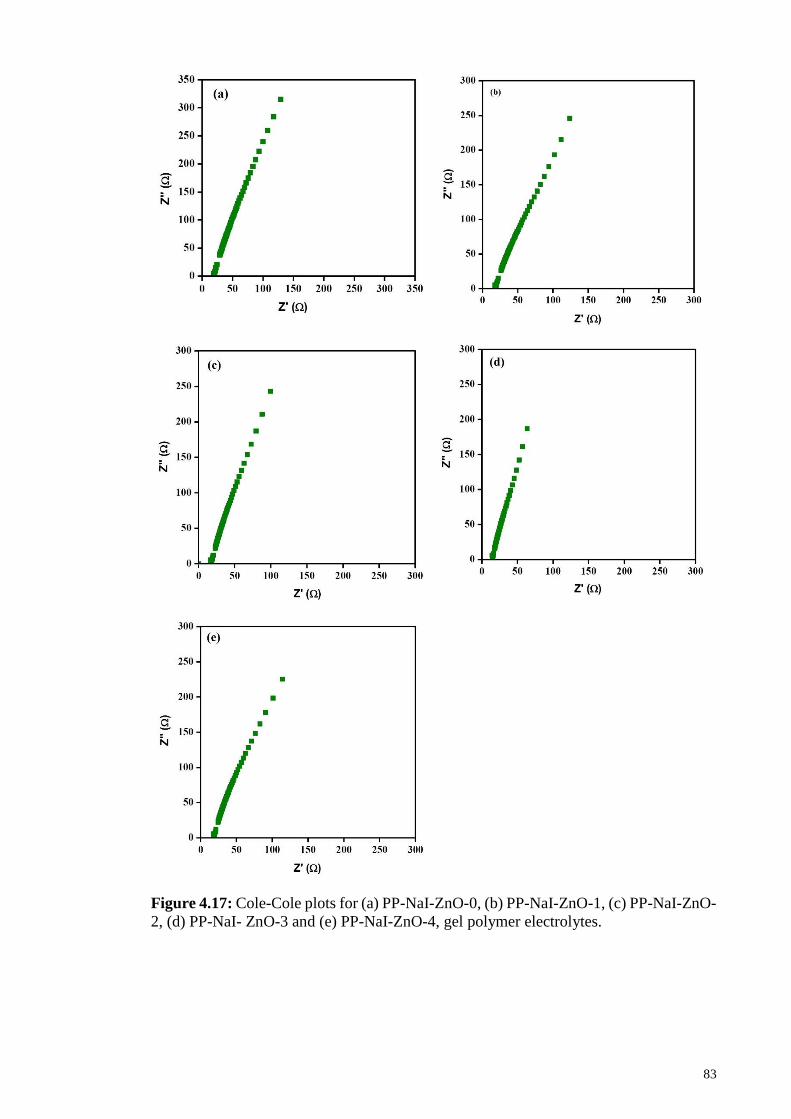
Figure.4.17: Cole-Cole plots for (a) PP-NaI-ZnO-0, (b) PP-NaI-ZnO-1, (c) PP-NaI----
ZnO-2, (d) PP-NaI- ZnO-3 and (e) PP-NaI-ZnO-4, gel polymer---
electrolytes. ................................................................................................ 83
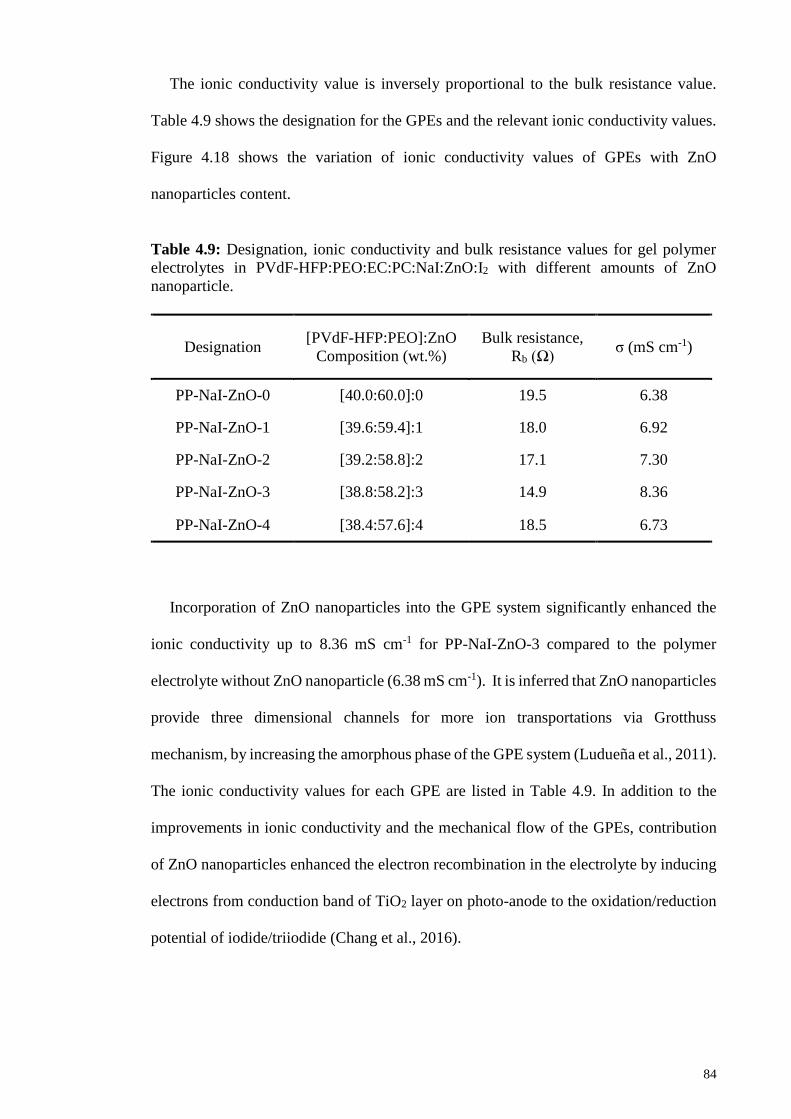
Figure.4.18: .Ionic conductivity values for each gel polymer electrolyte in PEO/PVdF----
HFP:NaI:I2:ZnO system with different ZnO content. ............................... 85
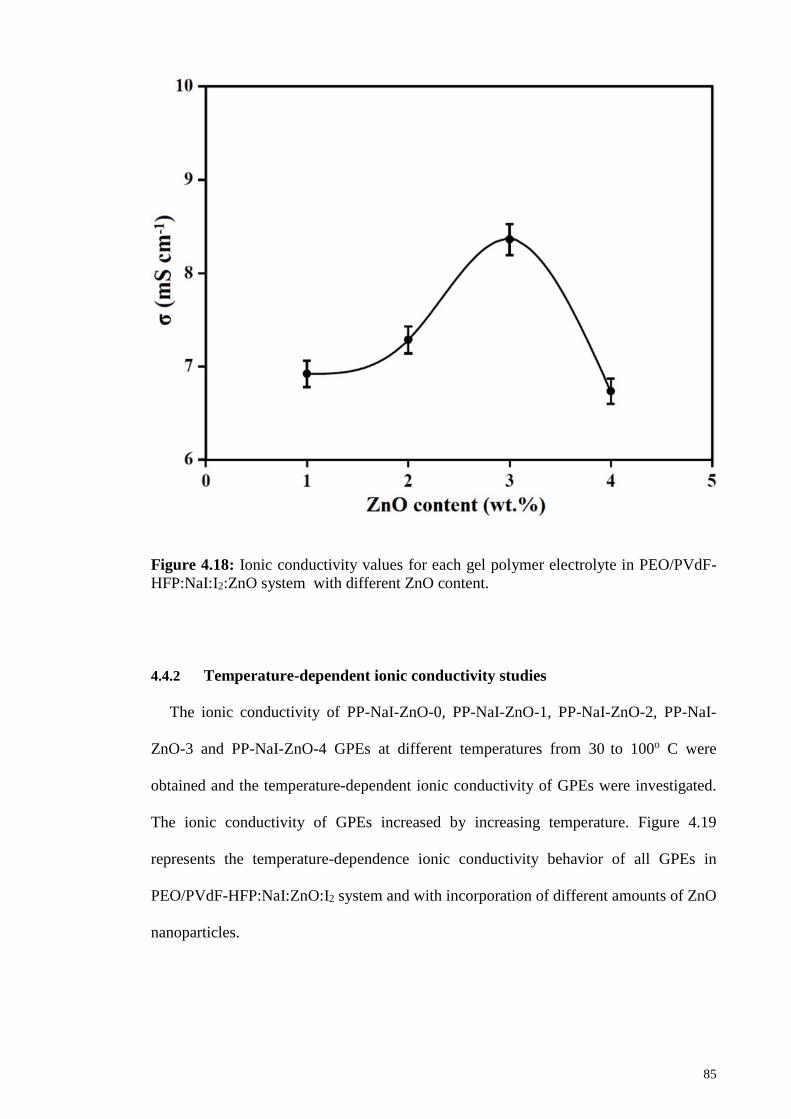
Figure 4.19: Temperature-dependence ionic conductivity for gel polymer electrolytes---
in PVdF-HFP:PEO:EC:PC:NaI:ZnO:I2 system with different ZnO---
content. ....................................................................................................... 86
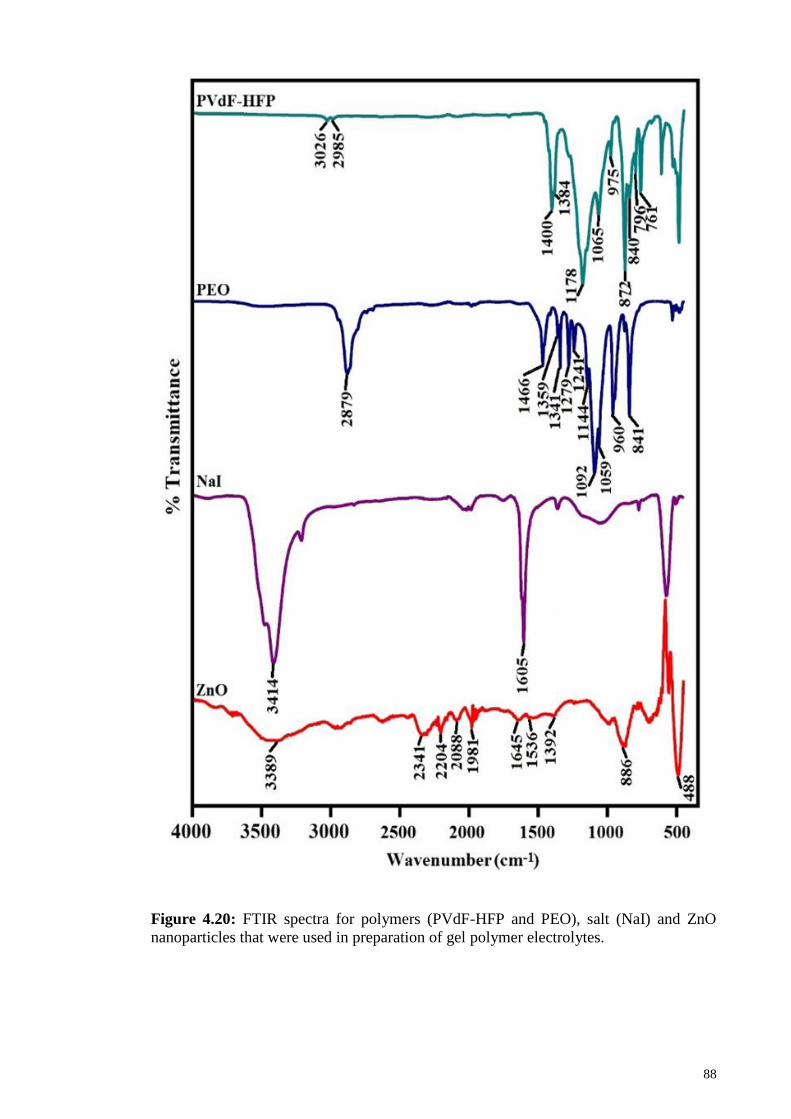
Figure.4.20: FTIR spectra for polymers (PVdF-HFP and PEO), salt (NaI) and ZnO---
nanoparticles that were used in preparation of gel polymer electrolytes. .. 88
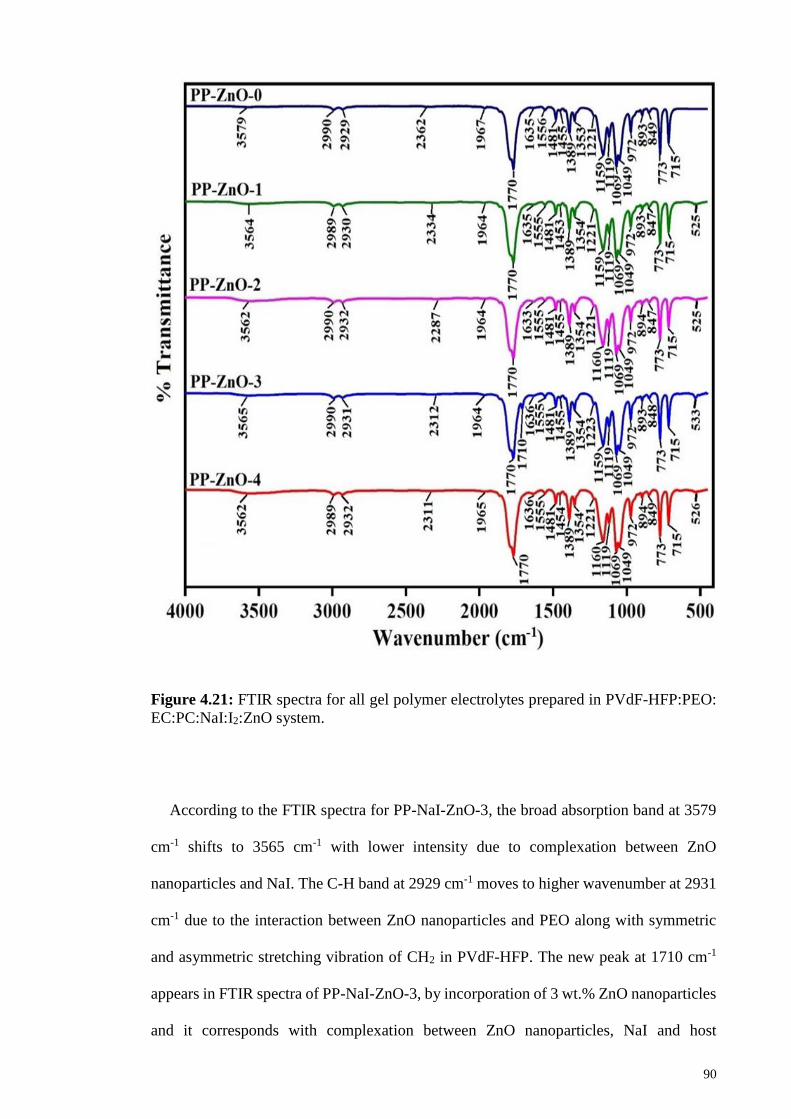
Figure.4.21: FTIR spectra for all gel polymer electrolytes prepared in PVdF-HFP:---
PEO:EC:PC:NaI:I2:ZnO system. ............................................................... 90
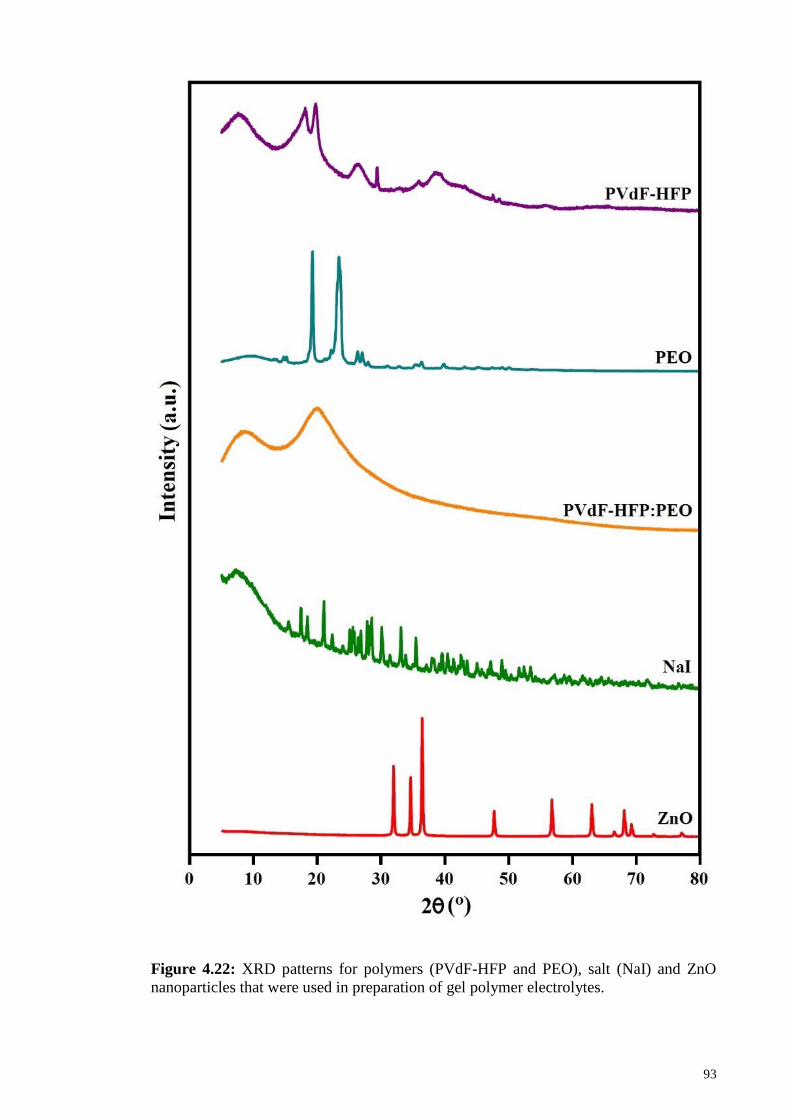
Figure.4.22: XRD patterns for polymers (PVdF-HFP and PEO), salt (NaI) and ZnO---
nanoparticles that were used in preparation of gel polymer electrolytes. .. 93
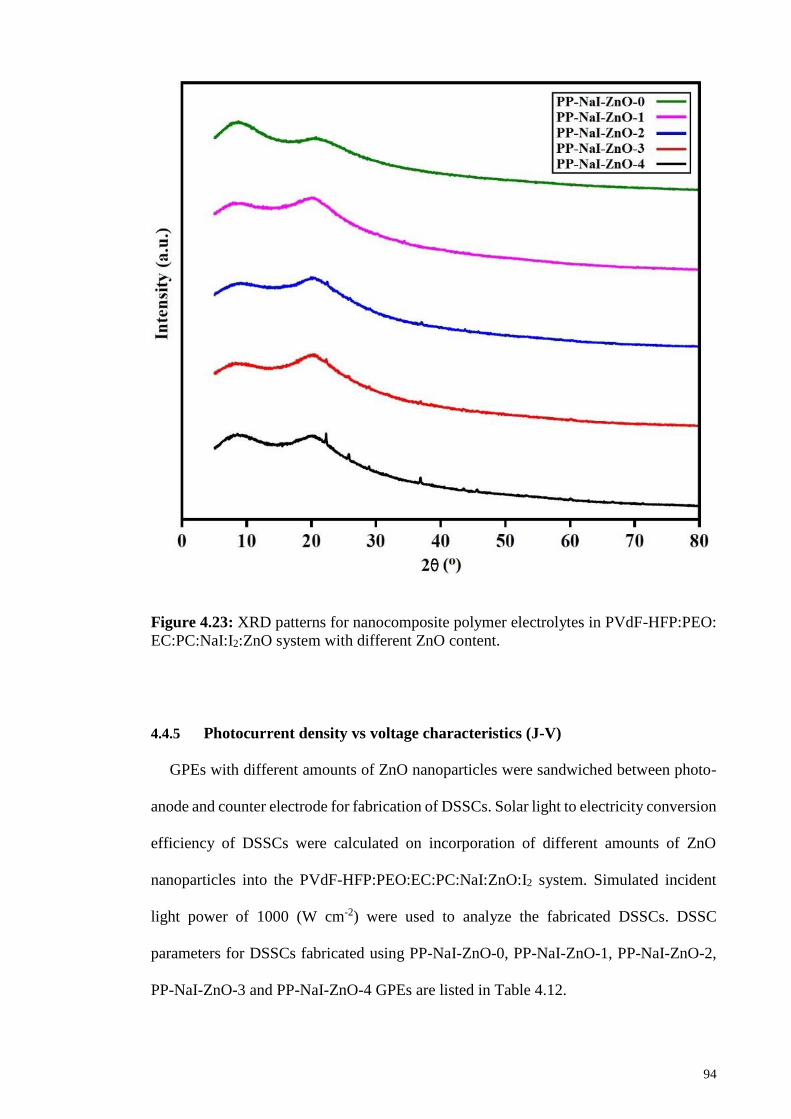
Figure.4.23: XRD patterns for nanocomposite polymer electrolytes in PVdF-HFP:---
PEO:EC:PC:NaI:I2:ZnO system with different ZnO content. ................... 94
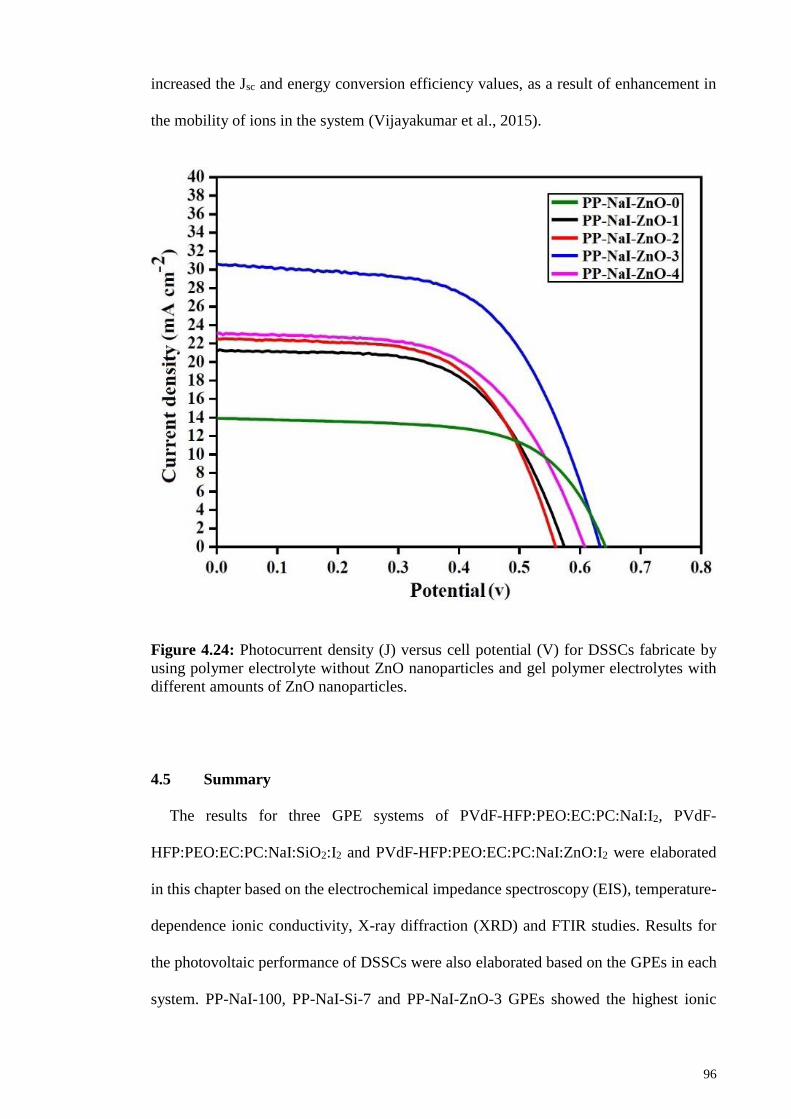
Figure 4.24: Photocurrent density (J) versus cell potential (V) for DSSCs fabricate by---
using polymer electrolyte without ZnO nanoparticles and gel polymer---
electrolytes with different amounts of ZnO nanoparticles. ........................ 96
Page 16
xv
LIST OF TABLES
Table 2.1: Some ruthenium based and natural dyes with their corresponding structure.---
...................................................................................................................... 13
Table 2.2 (continued): Some ruthenium based and natural dyes with their---
corresponding structure. ............................................................................... 14
Table 3.1: Materials used in preparation of GPEs. ........................................................ 26
Table 3.2: Materials used in preparation of photo-anode. ............................................. 27
Table 3.3: Designation of first gel polymer electrolyte system with NaI content. The ---
amount of NaI is in compare to the total amount of PVdF-HFP and PEO---
polymers. ...................................................................................................... 29
Table 3.4: Designation of second gel polymer electrolyte system in corporation of---
fumed silica (SiO2) nanofiller. ..................................................................... 29
Table 3.5: Designation of third gel polymer electrolyte system in corporation of zinc---
oxide (ZnO) nanofiller. ................................................................................ 30
Table 4.1: Designation with the corresponding ionic conductivity and bulk resistance---
values of the gel polymer electrolytes. ......................................................... 53
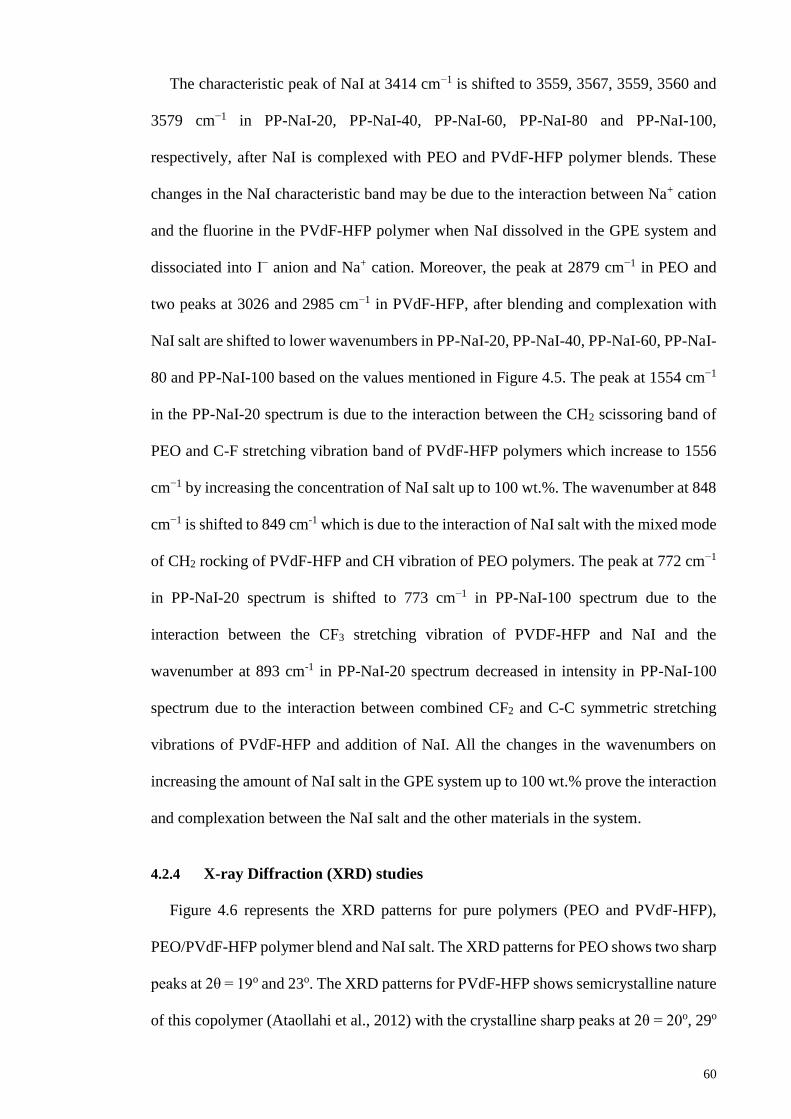
Table.4.2: Designation with the corresponding ionic conductivity and activation---
energy values of the gel polymer electrolytes. ............................................. 57
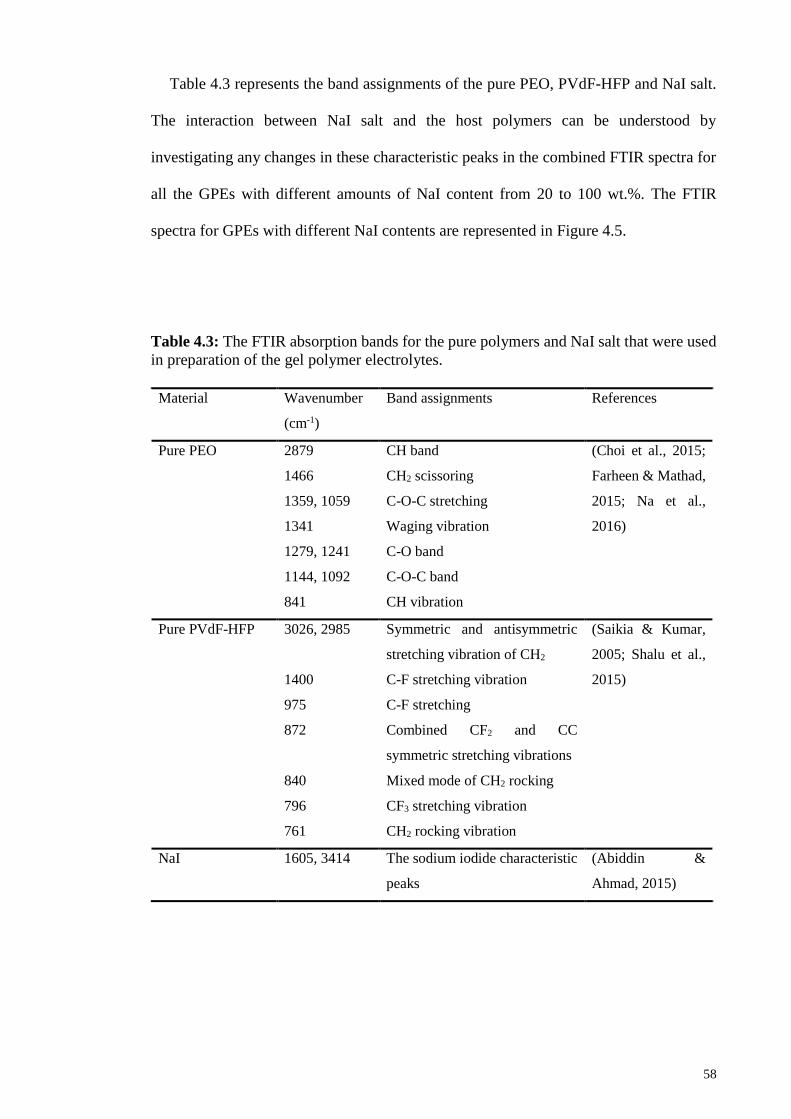
Table.4.3: The FTIR absorption bands for the pure polymers and NaI salt that were---
used in preparation of the gel polymer electrolytes. .................................... 58
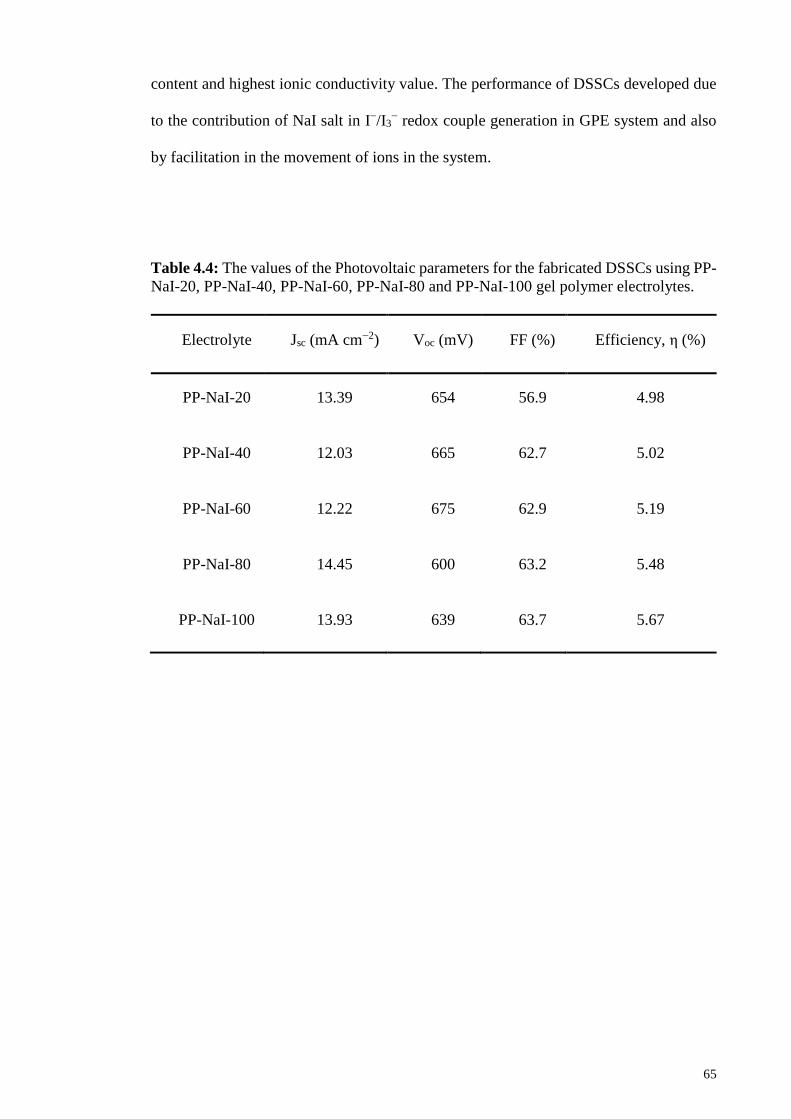
Table 4.4: The values of the Photovoltaic parameters for the fabricated DSSCs using---
PP- NaI-20, PP-NaI-40, PP-NaI-60, PP-NaI-80 and PP-NaI-100 gel---
polymer electrolytes. .................................................................................... 65
Table.4.5:..Designation, ionic conductivity and bulk resistance values for gel---
electrolyte system in presence of fumed silica (SiO2) nanofiller. ................ 68
Table.4.6: Designation, ionic conductivity and activation energy for gel polymer---
electrolyte system in presence of fumed silica (SiO2) nanofiller. ................ 72
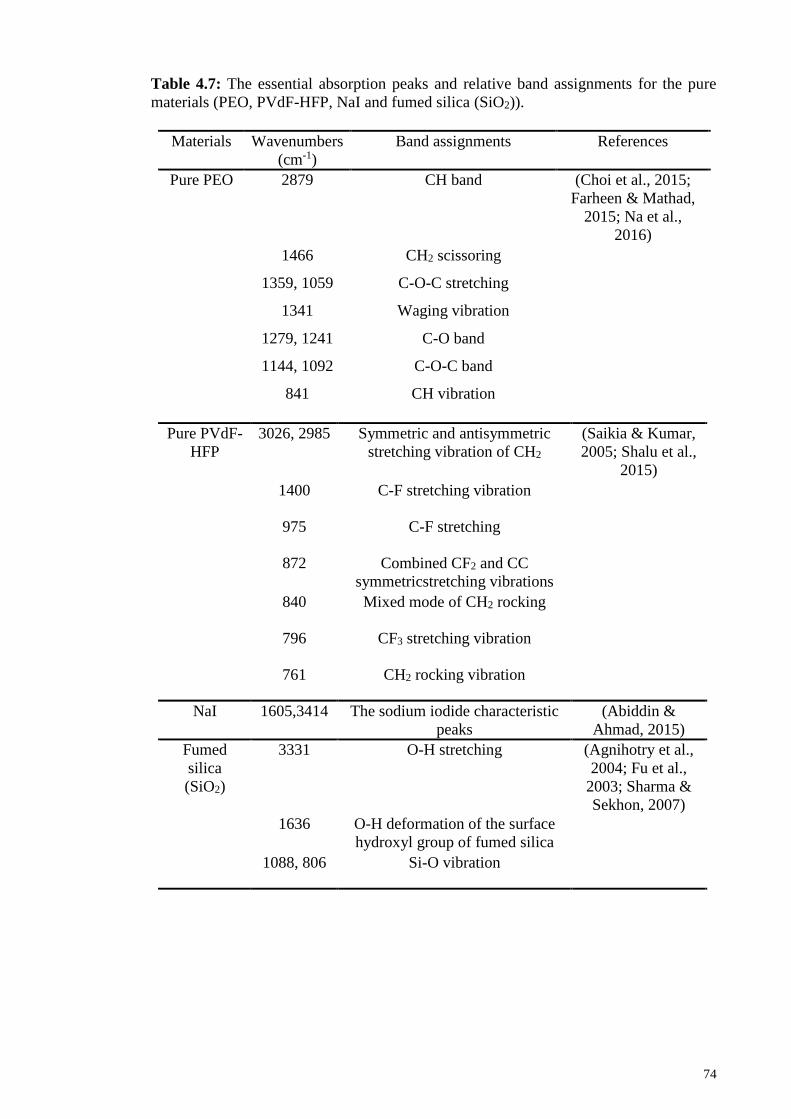
Table.4.7: The essential absorption peaks and relative band assignments for the pure---
materials (PEO, PVdF-HFP, NaI and fumed silica (SiO2)). ........................ 74
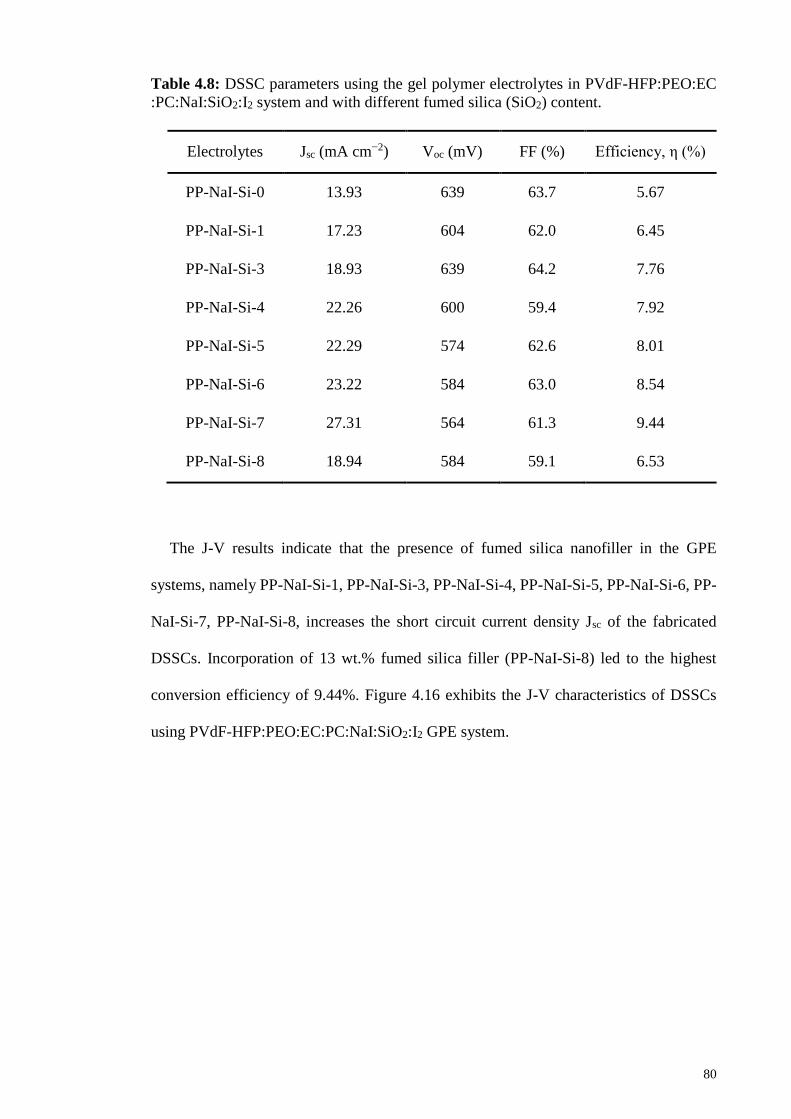
Table.4.8: DSSC parameters using the gel polymer electrolytes in PVdF-HFP:PEO:---
EC:PC:NaI:SiO2:I2 system and with different fumed silica (SiO2) content. 80
Page 17
xvi
Table 4.9: Designation, ionic conductivity and bulk resistance values for gel polymer---
electrolytes in PVdF-HFP:PEO:EC:PC:NaI:ZnO:I2 with different amounts---
of ZnO nanoparticle. .................................................................................... 84
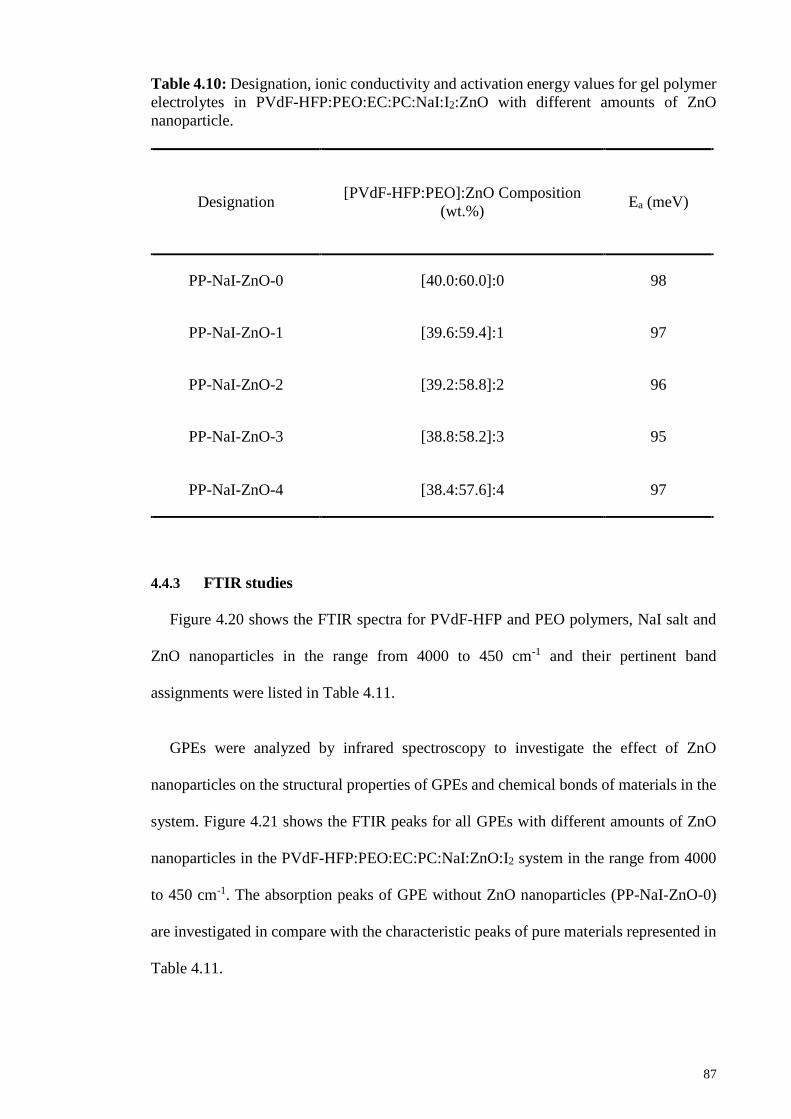
Table.4.10:.Designation, ionic conductivity and activation energy values for gel---
polymer electrolytes in PVdF-HFP:PEO:EC:PC:NaI:I2:ZnO with different---
amounts of ZnO nanoparticle. ...................................................................... 87
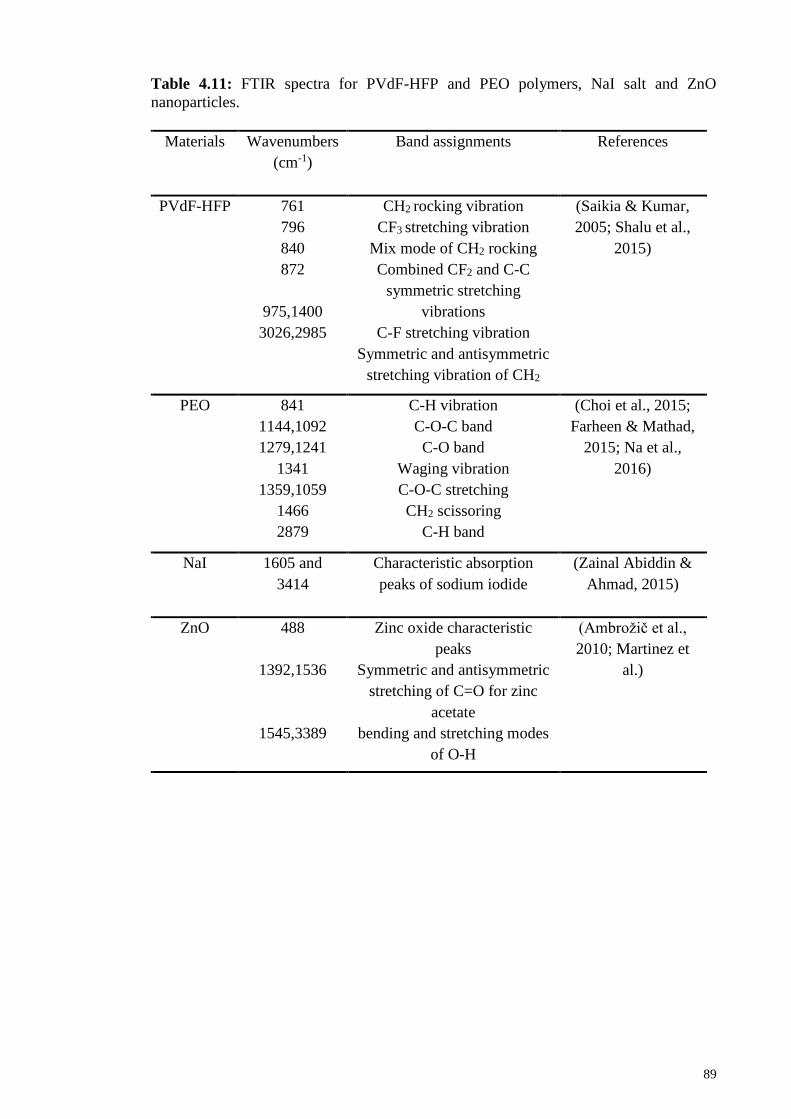
Table.4.11:.FTIR spectra for PVdF-HFP and PEO polymers, NaI salt and ZnO---
nanoparticles................................................................................................. 89
Table.4.12:.DSSC parameters for all gel polymer electrolytes (PVdF-HFP:PEO:EC:---
PC:NaI:ZnO:I2). ........................................................................................... 95
Page 18
xvii
LIST OF SYMBOLS AND ABBREVIATIONS
A Area (cm2)
DSSC : Dye-Sensitized Solar Cell
EIS : Electrochemical Impedance Spectroscopy
Ea : Activation Energy (meV)
FF : Fill Factor (%)
FTIR : Fourier Transform Infrared
FTO : Fluorine-Doped Tin Oxide
GPE : Gel Polymer Electrolyte
HOMO : Highest Occupied Molecular Orbital
σ : Ionic Conductivity (S cm-1)
I2 : Iodine
ITO : Indium Tin Oxide
Jsc : Short Circuit Current Density (mA cm-2)
k : Boltzmann constant (8.61×10⁻⁵ eV K-1)
L Thickness (cm)
LUMO : Lowest Unoccupied Molecular Orbital
NaI : Sodium Iodide
OLED Organic Light Emitting Diode
PEO : Polyethylene Oxide
PVdF-HFP : Poly (vinylidene fluoride-co-hexafluoro propylene)
Pt : Platinum
ƞ : Photovoltaic Energy Conversion Efficiency (%)
σo : Pre-exponential factor
Rb : Bulk Resistance (Ω)
Page 19
xviii
SiO2 : Fumed Silica
SPE : Solid Polymer Electrolyte
TiO2 : Titanium Dioxide
Voc : Open Circuit Voltage (mV)
XRD : X-ray Diffraction
ZnO : Zinc Oxide
Page 20
xix
LIST OF APPENDICES
Appendix A: …………………………………………………………….............. 114
Appendix B: ………………………………………………………...................... 115
Appendix C: ………………………………………………………...................... 116
Page 21
1
CHAPTER 1: INTRODUCTION
1.1 Introduction of Research
Development of technology has affected every single household appliance to use
electricity and it shows the intense human needs for energy. The total production of
energy from various energy sources in 2014 was 22433 TWh. So far the non-renewable
conventional energy resources such as fossil fuels such as oil, coal and gas obviated
human demands for energy but they are not human preference due to their contributions
to environmental pollution and global warming. 31% of deaths caused by air pollution
are due to the power generation (Schillerby, 2015) and the year 2015 was the hottest year
in the historical record (Gillis, 2016). Burning fossil fuels begets acidic rain and extraction
of crude oil damages the marine ecosystem which kills many animals each year. So
humans are looking for a clean, cheap and safe method to produce and store for their
unlimited energy consumption. Solar cells are one of the latest green technologies for
converting and storing the vast sun light to electricity. One hour of the sun light at the
atmosphere has the power equal to the electrical power to turn on 120 trillion of 60 W
light bulbs. Many researchers are working to improve the performance of solar cells by
using environmental friendly and cheap materials because they believe on the capacity of
solar cells for providing clean worldwide energy needs.
By using dye-sensitized solar cells (DSSCs), we can store the clean and lifelong energy
of Sun with high efficiency and even without direct sunlight. This technology invented
on 1991 by Michael Gratzel and Brian O’Regan and it is able to catch a wide spectral
range of sunlight from near Infrared to ultraviolet. DSSCs can be easily fabricated from
low cost materials and they could reach up to 12% sunlight energy conversion efficiency.
DSSCs can be obtained by fabricating three parts of photo-anode, electrolyte and counter
Page 22
2
electrode which are conducting glass commonly coated with TiO2 and sensitized by dyes,
electrolyte containing iodide/triiodide redox couples and a conducting glass which
generally coated with Platinum (Pt) respectively. DSSCs are not an elaborate technology
that are easy to fabricate and utilize as well as being cost effective and able to operate
under indirect sunlight and cloudy weather hence these characteristics make them a
reliable alternative for the silicon based solar cells.
Many research groups are working on each parts of DSSC nowadays in order to
develop a more efficient and high performance system. Utilization of liquid electrolyte
based DSSCs faces many problems, for instance potential instability, sealing defects
caused by leakage and reacting to the temperature variations and also evaporation.
Researchers could develop safe and more stable DSSCs using gel polymer electrolytes
(GPEs). Although application of GPEs in DSSCs decrease the energy conversion
efficiencies of DSSCs compare with the Gratzel liquid type of electrolyte but GPEs are
safe, stable and have high ionic conductivity. Fabrication of DSSCs by using GPEs helps
to overcome their long term usage drawbacks specially photo-corrosion and desorption
of dyes and corrosion of platinum coating of counter electrode. GPEs can be obtained
using polymers, gelling agents, iodine, alkali metal iodides, ionic liquids and plasticizers.
Mobility of iodide/triiodide ions in the polymer matrix improves in presence of organic
and inorganic nanoparticles as a filler into the GPE system. Moreover the efficiency of
DSSCs that were fabricated using these GPEs will be enhanced as a result of enhanced
ionic conductivity of GPE system.
In this study, we attempted to enhance the ionic conductivity of the GPEs for
application in DSSC. Accordingly, iodide salt and two inorganic fillers were used in
different GPE systems. DSSCs were fabricated by using GPEs that obtained in different
systems and the performance of DSSCs were investigated. GPE systems are developed
Page 23
3
by blending PEO and PVdF-HFP polymers as the host polymers. Ionic conductivity of
GPE system is optimized in presence of sodium iodide (NaI) salt into the PEO/PVdF-
HFP:NaI:I2 system and furthermore, effect of fumed silica (SiO2) and zinc oxide (ZnO)
nanoparticles on the ionic conductivity of optimized PEO/PVdF-HFP:NaI:I2 system are
investigated in two different systems respectively.
1.2 Objectives of the Research
1. To prepare and optimize GPEs based on PVdF/HFP:PEO polymers and NaI salt
for application of DSSCs as well as enhancing the ionic conductivity of GPEs in
corporation of fumed silica (SiO2) and ZnO nanoparticles as fillers into the
optimized GPE system.
2. To characterize the GPEs using electrochemical impedance spectroscopy (EIS),
X-ray diffraction (XRD) and Fourier-transform infrared (FTIR) studies.
3. To investigate the performance of fabricated DSSCs using GPEs.
1.3 Scope of Thesis
This thesis intends to report the development process of GPE systems for fabrication
of high performance and efficient DSSCs by focusing on enhancement in the ionic
conductivity values of the GPEs. Chapter 1 explicitly explains need of the usage of
sunlight as a source of energy and the advantages of using DSSCs as our preference and
how we can develop this system. Chapter 2 is the literature review about the
characteristics of DSSCs and its working principles, different types of polymer
electrolytes, GPEs and their advantages and the properties of materials that are used in
preparation of GPEs in this research.
Preparation of GPEs and their characterization methods is represented in Chapter 3.
Chapter 3 also contains the informations about fabrication of DSSCs, preparation of their
components and their photovoltaic studies. PVdF-HFP/PEO blended polymers were
Page 24
4
chosen to enhance the mobility of ions in the intended GPE system. Chapter 4 contains
the characterizations and discussions for three systems prepared in this work. NaI salt has
been incorporated into the GPE system to provide more ions, especially I- anions in the
system and to increase the ionic conduction and facilitating I-/I3- reduction process of the
GPE. The amount of NaI salt was optimized in the PVdF-HFP:PEO:NaI:I2 system and
the electrochemical and structural properties GPEs were investigated. Effect of two
different types of fumed silica (SiO2) and ZnO nanoparticles on the electrochemical and
structural properties of GPEs were studied and the photovoltaic performance of fabricated
DSSCs using these GPEs was investigated. In chapter 5, the comparison between the
electrochemical (EIS) and structural properties (XRD and FTIR) of GPEs in three systems
was explained and the energy conversion efficiencies for fabricated DSSCs using GPEs
in each system were also compared. The last chapter is allocated to the conclusions of
this research and some ideas for the future studies.
Page 25
5
CHAPTER 2: LITERATURE REVIEWS
2.1 Introduction
In this chapter, the literature reviews will be discussed for solar cells, DSSCs and their
advantages and components. Different types of polymer electrolytes specially GPEs and
their benefits, background of all the materials that were used for preparation of GPEs in
this research, have also been reviewed. Various factors affecting the performance of
DSSCs and ionic conductivity of GPEs have been reported.
2.2 Solar cells
Humans have been reached to a point that using a clean and unlimited source of energy
is essential for their huge energy consumptions and preventing environmental pollutions.
The limited and unrenewable source of energy especially oil resources are going to finish
soon due to the heavy consumptions. Many scientists have worked hard for years to find
a new unlimited source of energy which does not damage the earth environment and can
be replaced to the conventional fossil fuels. Solar energy is the best candidate for our
source of energy as it is unlimited, safe, powerful and it is available everywhere.
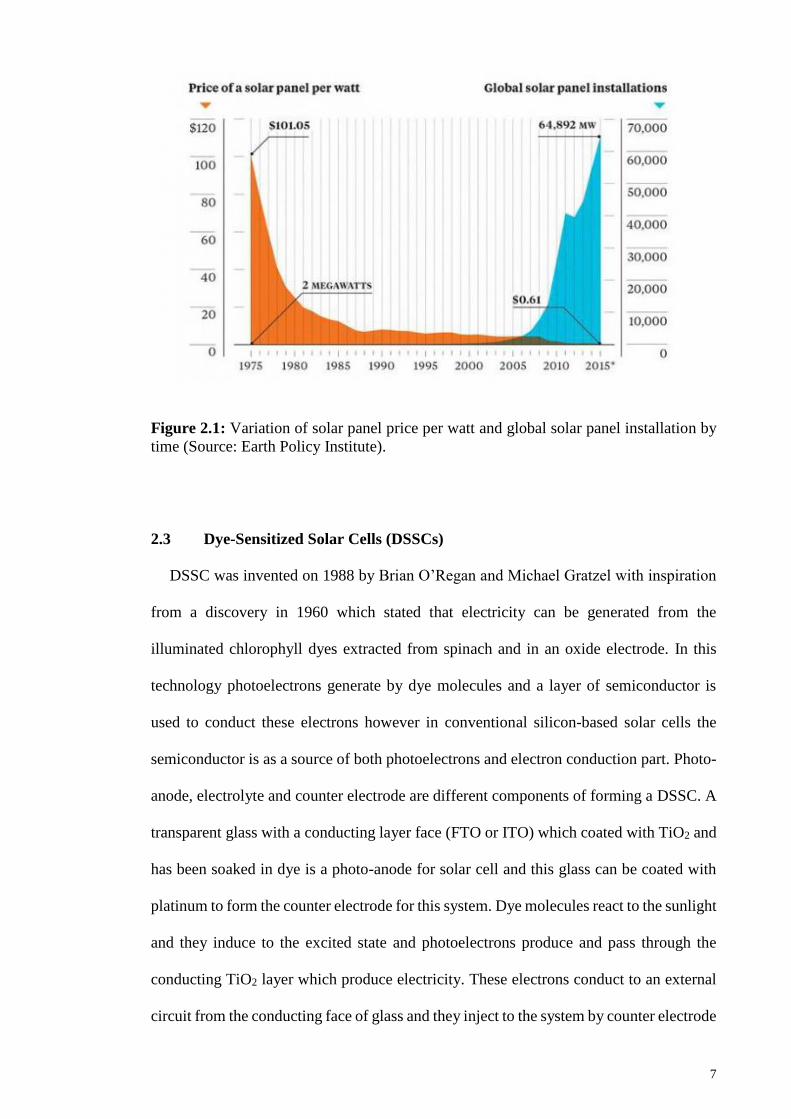
According to Figure 2.1 energy consumption using solar cells has been grown worldwide
and the price of electricity generated from solar panels has been reduced. In 1975, the
price of electricity generated by photovoltaic cells was $100/W which has been highly
reduced to $0.60/W in 2015 with 65,000 MW globally installed solar panels. So far many
types of solar technologies exist with different mechanisms, costs and power efficiencies.
Different categories of solar cells are briefly explained as bellow:
Single-junction GaAs: single crystal, concentrator and thin-film crystal solar
cells are in this category. These types of solar cells have efficiencies between
Page 26
6
27.5 to 29.1 %. This is the most fundamental type of solar cell which use one
p-n junction to produce electricity (Green et al., 2015).
Multi-junction cells: two-junction (concentrator), two-junction (non-
concentrator), three-junction (concentrator), three-junction (non-concentrator),
four-junction or more (concentrator), four-junction or more (non-concentrator)
solar cells are in this category. Their efficiencies vary between 31.6 to 46%.
These types of solar cells have made by using several semiconductor materials
with different P-N junctions and they have high energy conversion efficiencies
due to the absorption of a wide range of sunlight wavelengths (Siddiki et al.,
2010).
Crystalline Si cells: single-crystal (concentrator), single-crystal (non-
concentrator), multicrystalline, silicon heterostructures (HIT), thin-film crystal
solar cells are in this category. Their energy conversion efficiencies varies
between 21.2 to 27.6%. They are made of semicrystalline silicon which
produce electricity when they absorb light and the electrons of silica
atoms/molecules go to the excited state and go back to the orbital (Ndiaye et
al., 2013).
Thin-film technologies: CIGS (concentrator), CIGS, CdTe, amorphous Si:H
(stabilized) solar cells are in this category. Their energy conversion efficiencies
are between 13.6 to 23.3%. In this system sunlight make electrons to move
between two n and p-type semiconductors (Suryawanshi et al., 2013).
Emerging photovoltaic: DSSCs, perovskite cells, organic cells, organic tandem
cells, inorganic cells and quantum dot solar cells are in this category. Their
photovoltaic efficiencies are between 10.6 to 22.1%. these technologies are
developed to increase the energy conversion efficiency of solar cells by using
cost-effective materials (Park, 2015).
Page 27
7
Figure 2.1: Variation of solar panel price per watt and global solar panel installation by
time (Source: Earth Policy Institute).
2.3 Dye-Sensitized Solar Cells (DSSCs)
DSSC was invented on 1988 by Brian O’Regan and Michael Gratzel with inspiration
from a discovery in 1960 which stated that electricity can be generated from the
illuminated chlorophyll dyes extracted from spinach and in an oxide electrode. In this
technology photoelectrons generate by dye molecules and a layer of semiconductor is
used to conduct these electrons however in conventional silicon-based solar cells the
semiconductor is as a source of both photoelectrons and electron conduction part. Photo-
anode, electrolyte and counter electrode are different components of forming a DSSC. A
transparent glass with a conducting layer face (FTO or ITO) which coated with TiO2 and
has been soaked in dye is a photo-anode for solar cell and this glass can be coated with
platinum to form the counter electrode for this system. Dye molecules react to the sunlight
and they induce to the excited state and photoelectrons produce and pass through the
conducting TiO2 layer which produce electricity. These electrons conduct to an external
circuit from the conducting face of glass and they inject to the system by counter electrode
Page 28
8
and then the oxidation and reduction process by I-/I3- ions helps to give back those missed
electrons of dye molecules and this process repeats for generating electricity. All three
components effect on the performance and energy conversion efficiency DSSC (Hagfeldt
et al., 2010).
2.3.1 Advantages of using DSSCs
DSSCs have been made of many materials and changing or processing each material
can help us to optimize the performance of this solar cell. The performance of this solar
cell is highly influenced by dye molecules which absorb sunlight and also the redox
couples and their movements in the electrolyte. Many researches can be done on finding
and applying variety of materials in this technology.
The materials used in DSSCs are usually cheap and green which reduce the cost of
manufacturing and keeps our environment safe. DSSCs can be made of hazardous-free
and bio materials which can be abundant in nature and cost effective. DSSCs can be very
light and flexible since commercialy they can be made by coating materials on the
flexible, cheap and light plastic substrate and this method makes them robust for long
term usage. Moreover DSSCs do not need any protection for controlling their internal
temperature in compare to the conventional silicon based solar cells and even under direct
sunlight heat can easily pass through the transparent components of DSSC and the
temperature of device will be controlled. All these properties help us in easy and
inexpensive manufacturing process.
DSSCs have high efficiency in converting sunlight to electricity among the other types
of solar cells and in compare to their price and this attributes makes them a superior choice
for home or low-density application. Among all types of solar cells, DSSCs are the only
ones which can produce electricity under indirect sunlight and cloudy weather because
they have this ability to absorb a wide range of wavelengths of light spectrum, diffused
Page 29
9
sunlight from objects and also fluorescent lights hence they are suitable even for the
places with cloudy weather and no direct sunlight.
2.3.2 Working principles of DSSCs
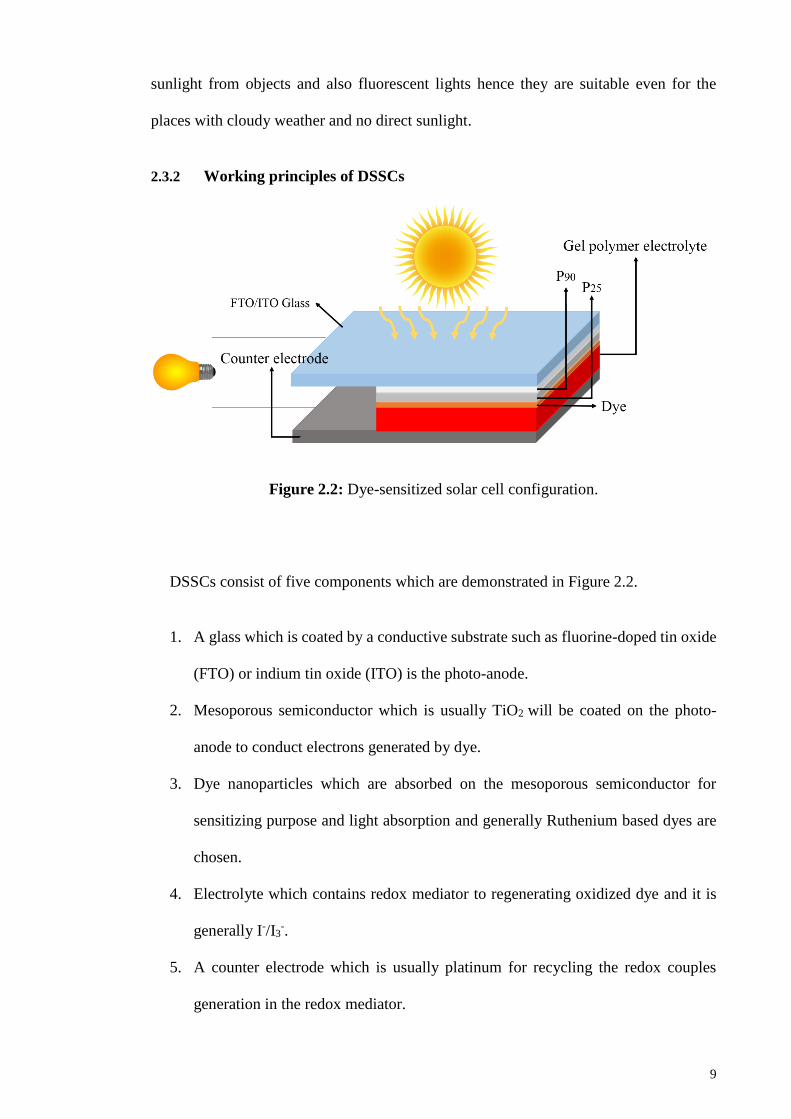
Figure 2.2: Dye-sensitized solar cell configuration.
DSSCs consist of five components which are demonstrated in Figure 2.2.
1. A glass which is coated by a conductive substrate such as fluorine-doped tin oxide
(FTO) or indium tin oxide (ITO) is the photo-anode.
2. Mesoporous semiconductor which is usually TiO2 will be coated on the photo-
anode to conduct electrons generated by dye.
3. Dye nanoparticles which are absorbed on the mesoporous semiconductor for
sensitizing purpose and light absorption and generally Ruthenium based dyes are
chosen.
4. Electrolyte which contains redox mediator to regenerating oxidized dye and it is
generally I-/I3-.
5. A counter electrode which is usually platinum for recycling the redox couples
generation in the redox mediator.
Page 30
10
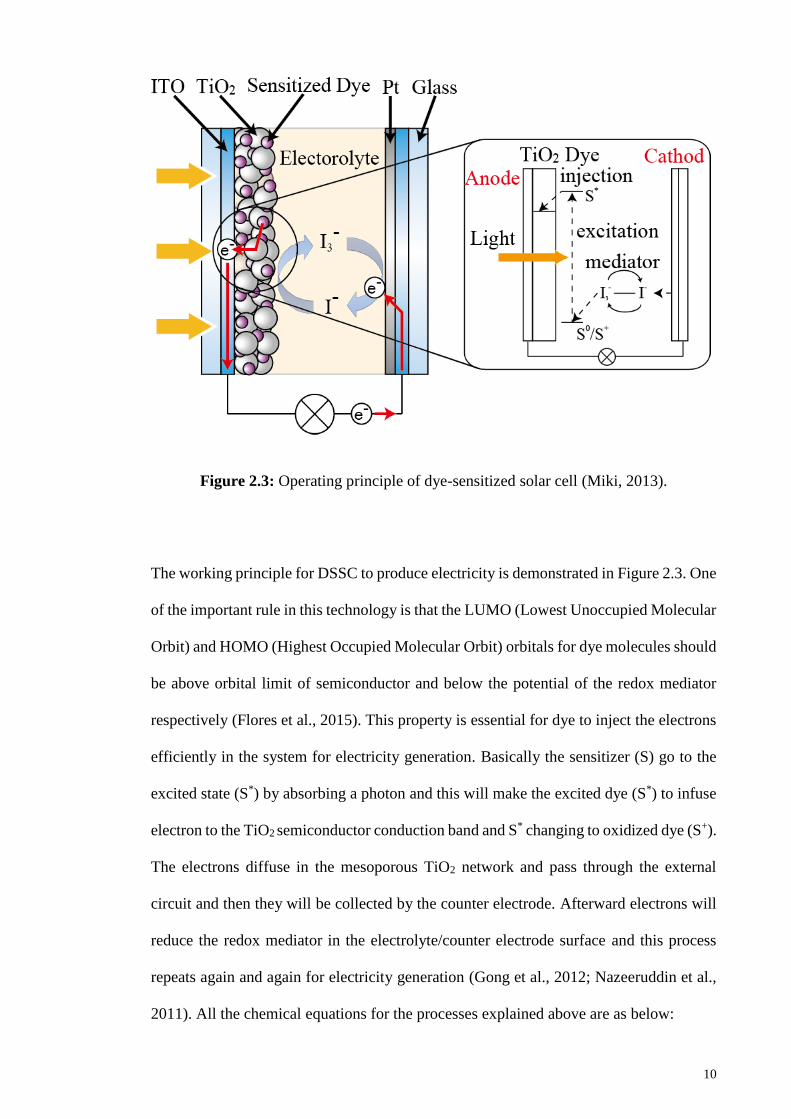
Figure 2.3: Operating principle of dye-sensitized solar cell (Miki, 2013).
The working principle for DSSC to produce electricity is demonstrated in Figure 2.3. One
of the important rule in this technology is that the LUMO (Lowest Unoccupied Molecular
Orbit) and HOMO (Highest Occupied Molecular Orbit) orbitals for dye molecules should
be above orbital limit of semiconductor and below the potential of the redox mediator
respectively (Flores et al., 2015). This property is essential for dye to inject the electrons
efficiently in the system for electricity generation. Basically the sensitizer (S) go to the
excited state (S*) by absorbing a photon and this will make the excited dye (S*) to infuse
electron to the TiO2 semiconductor conduction band and S* changing to oxidized dye (S+).
The electrons diffuse in the mesoporous TiO2 network and pass through the external
circuit and then they will be collected by the counter electrode. Afterward electrons will
reduce the redox mediator in the electrolyte/counter electrode surface and this process
repeats again and again for electricity generation (Gong et al., 2012; Nazeeruddin et al.,
2011). All the chemical equations for the processes explained above are as below:
Page 31
11
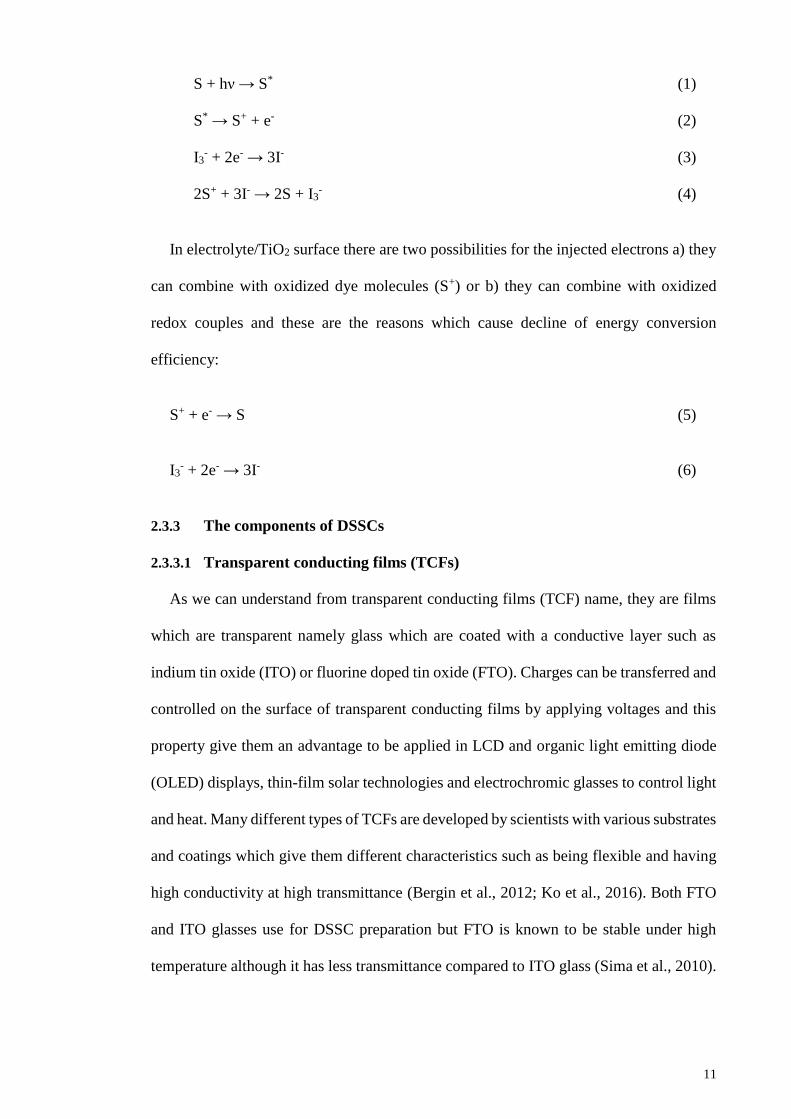
S + hν → S* (1)
S* → S+ + e- (2)
I3- + 2e- → 3I- (3)
2S+ + 3I- → 2S + I3- (4)
In electrolyte/TiO2 surface there are two possibilities for the injected electrons a) they
can combine with oxidized dye molecules (S+) or b) they can combine with oxidized
redox couples and these are the reasons which cause decline of energy conversion
efficiency:
S+ + e- → S (5)
I3- + 2e- → 3I- (6)
2.3.3 The components of DSSCs
2.3.3.1 Transparent conducting films (TCFs)
As we can understand from transparent conducting films (TCF) name, they are films
which are transparent namely glass which are coated with a conductive layer such as
indium tin oxide (ITO) or fluorine doped tin oxide (FTO). Charges can be transferred and
controlled on the surface of transparent conducting films by applying voltages and this
property give them an advantage to be applied in LCD and organic light emitting diode
(OLED) displays, thin-film solar technologies and electrochromic glasses to control light
and heat. Many different types of TCFs are developed by scientists with various substrates
and coatings which give them different characteristics such as being flexible and having
high conductivity at high transmittance (Bergin et al., 2012; Ko et al., 2016). Both FTO
and ITO glasses use for DSSC preparation but FTO is known to be stable under high
temperature although it has less transmittance compared to ITO glass (Sima et al., 2010).
Page 32
12
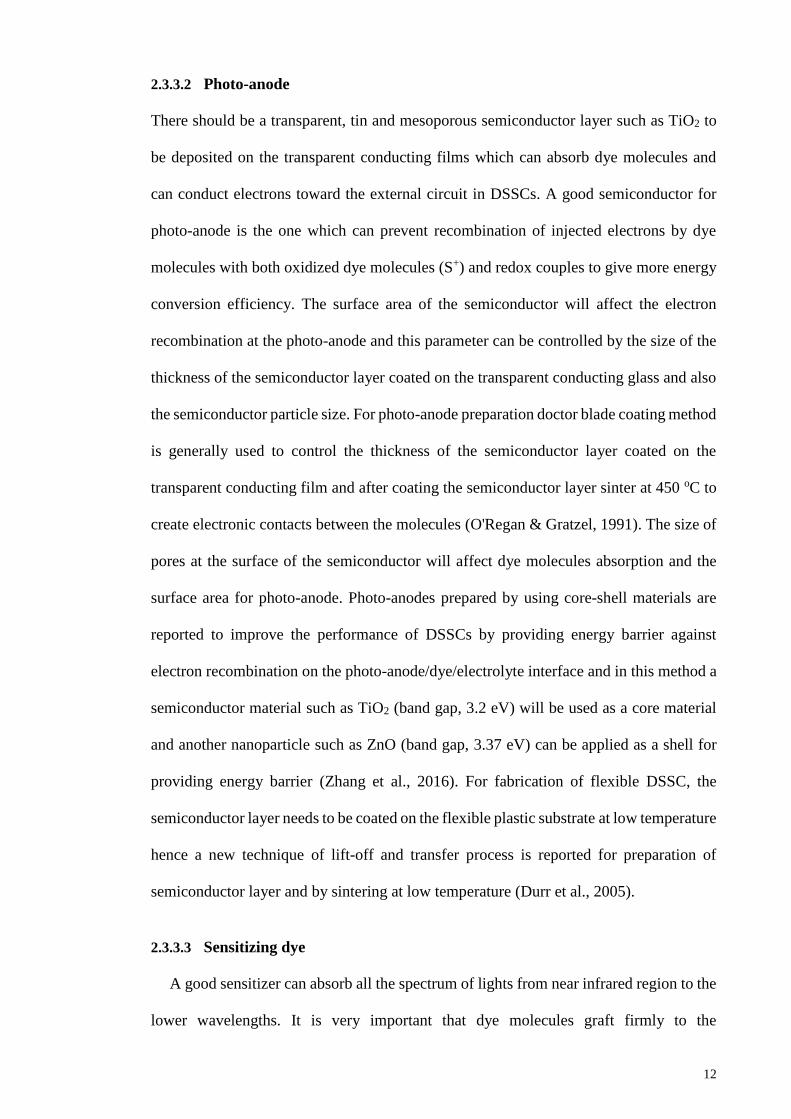
2.3.3.2 Photo-anode
There should be a transparent, tin and mesoporous semiconductor layer such as TiO2 to
be deposited on the transparent conducting films which can absorb dye molecules and
can conduct electrons toward the external circuit in DSSCs. A good semiconductor for
photo-anode is the one which can prevent recombination of injected electrons by dye
molecules with both oxidized dye molecules (S+) and redox couples to give more energy
conversion efficiency. The surface area of the semiconductor will affect the electron
recombination at the photo-anode and this parameter can be controlled by the size of the
thickness of the semiconductor layer coated on the transparent conducting glass and also
the semiconductor particle size. For photo-anode preparation doctor blade coating method
is generally used to control the thickness of the semiconductor layer coated on the
transparent conducting film and after coating the semiconductor layer sinter at 450 oC to
create electronic contacts between the molecules (O'Regan & Gratzel, 1991). The size of
pores at the surface of the semiconductor will affect dye molecules absorption and the
surface area for photo-anode. Photo-anodes prepared by using core-shell materials are
reported to improve the performance of DSSCs by providing energy barrier against
electron recombination on the photo-anode/dye/electrolyte interface and in this method a
semiconductor material such as TiO2 (band gap, 3.2 eV) will be used as a core material
and another nanoparticle such as ZnO (band gap, 3.37 eV) can be applied as a shell for
providing energy barrier (Zhang et al., 2016). For fabrication of flexible DSSC, the
semiconductor layer needs to be coated on the flexible plastic substrate at low temperature
hence a new technique of lift-off and transfer process is reported for preparation of
semiconductor layer and by sintering at low temperature (Durr et al., 2005).
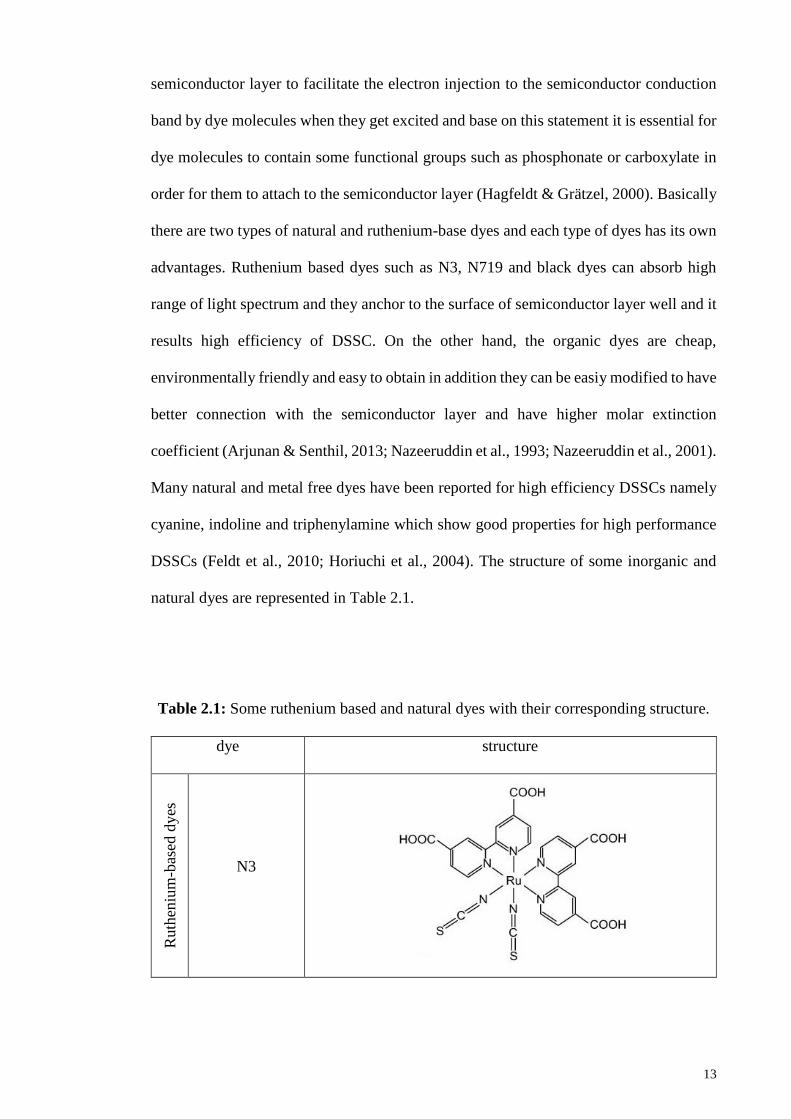
2.3.3.3 Sensitizing dye
A good sensitizer can absorb all the spectrum of lights from near infrared region to the
lower wavelengths. It is very important that dye molecules graft firmly to the
Page 33
13
semiconductor layer to facilitate the electron injection to the semiconductor conduction
band by dye molecules when they get excited and base on this statement it is essential for
dye molecules to contain some functional groups such as phosphonate or carboxylate in
order for them to attach to the semiconductor layer (Hagfeldt & Grätzel, 2000). Basically
there are two types of natural and ruthenium-base dyes and each type of dyes has its own
advantages. Ruthenium based dyes such as N3, N719 and black dyes can absorb high
range of light spectrum and they anchor to the surface of semiconductor layer well and it
results high efficiency of DSSC. On the other hand, the organic dyes are cheap,
environmentally friendly and easy to obtain in addition they can be easiy modified to have
better connection with the semiconductor layer and have higher molar extinction
coefficient (Arjunan & Senthil, 2013; Nazeeruddin et al., 1993; Nazeeruddin et al., 2001).
Many natural and metal free dyes have been reported for high efficiency DSSCs namely
cyanine, indoline and triphenylamine which show good properties for high performance
DSSCs (Feldt et al., 2010; Horiuchi et al., 2004). The structure of some inorganic and
natural dyes are represented in Table 2.1.
Table 2.1: Some ruthenium based and natural dyes with their corresponding structure.
dye structure
Ruth
eniu
m-b
ased
dyes
N3
Page 34
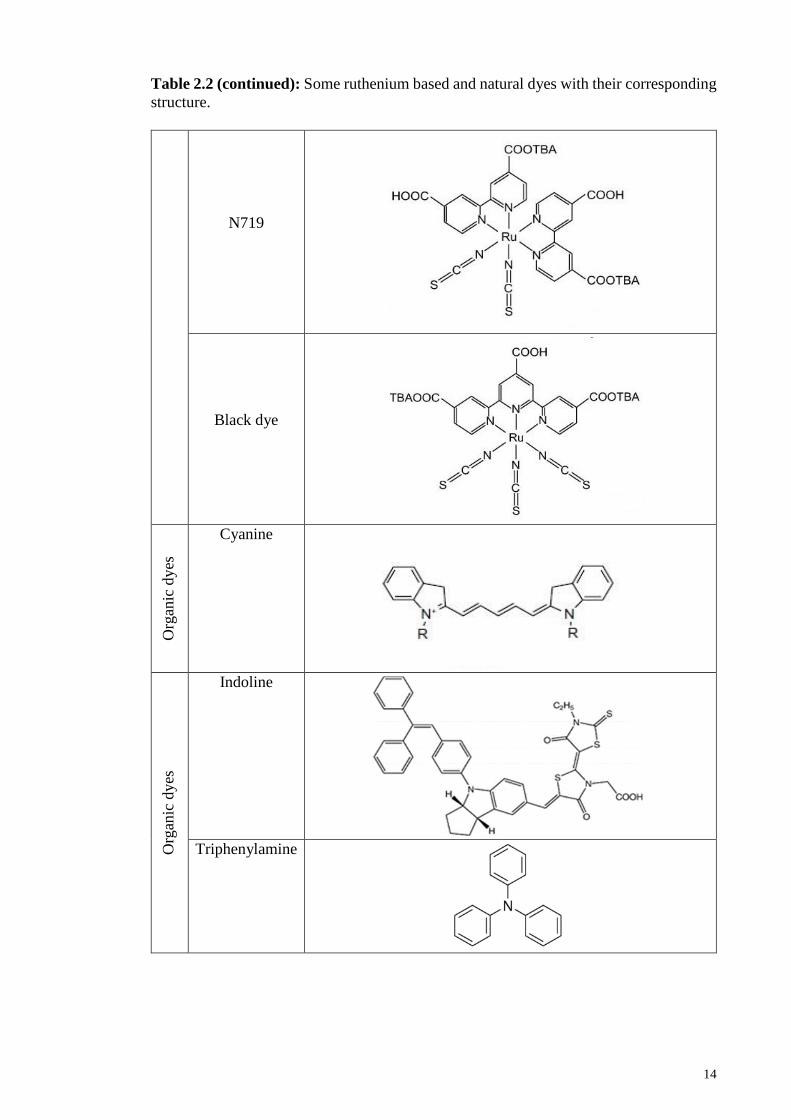
14
Table 2.2 (continued): Some ruthenium based and natural dyes with their corresponding
structure.
N719
Black dye
Org
anic
dyes
Cyanine
Org
anic
dyes
Indoline
Triphenylamine
Page 35
15
2.3.3.4 Counter electrodes
Based on the working principle of DSSC explained earlier, the counter electrode plays
an important role in reducing the triiodides in the electrolyte and producing iodide
molecules. Generally platinum has been used as an efficient counter electrode for DSSC
which is a costly material. Several types of counter electrodes have been developed using
different materials for fabrication of DSSCs such as carbon-based, conducting polymer-
based, transition metal nitrides and carbides-based, metal oxide-based, metal sulfide-
based and the counter electrodes prepared by using composite materials. The best
properties for a good counter electrode is to be cheap, environmental friendly and having
high catalytic activity and conductivity for reduction of triiodide. There are different
methods for preparation of platinum counter electrode in order to increase the active
surface area for catalytic activity enhancement and also to make the preparation process
easier and inexpensive (Dao & Choi, 2016). It is reported that composite materials with
combination of two materials with high electrical conductivity and catalytic activity such
as mesoporous carbon (MC) and VC as VC-MC composite electrode produce higher
energy conversion efficiency compared to the common platinum (Wu et al., 2012).
Carbon-based counter electrodes are quite promising as platinum-free counter electrodes
for DSSCs by showing high energy conversion efficiencies, being cheap, highly
conductive and corrosion resistant when they exposed to iodine. Many types of carbons
such as carbon nanotubes, carbon black, graphite, graphene and grapheme oxide have
been used for counter electrodes and among all of them graphene and mesoporour carbon
counter electrodes shows very good performance especially for reducing triiodide and
showing high energy conversion efficiencies for DSSCs which are comparable with
platinum counter electrode (Chen et al., 2009; Hong et al., 2008; Imoto et al., 2003; Lee
et al., 2012; Xu et al., 2013). Conductive polymers such as polyaniline (PANI), poly(3,4-
ethylenedioxythiophene) (PEDOT) and polypyrrole (PPY) can be a good candidate for
Page 36
16
preparation of inexpensive, stable and highly catalytic active counter electrodes for
DSSCs (Bu et al., 2013; Li et al., 2008).
2.3.3.5 Electrolytes
Electrolytes are one of the most important parts of DSSCs that contain redox couples
for capturing electrons from counter electrode and giving those electrons back to the
oxidized dyes for electricity generation. The traditional electrolyte for DSSC is the liquid
electrolyte of organic acetonitrile containing I-/I3- redox couple used by Gratzel. Kinetic
properties of I-/I3- makes fast injection of electrons to the TiO2 conduction band as well
as fast interaction between iodide and oxidized dye which does not allow high rate of
electron recombination in the TiO2/dye/electrolyte surface. Other types of redox couples
have been tested in the electrolyte such as Co (II)/Co (III), Br-/Br3-, SeCN-/(SeCN)3
- and
SCN-/(SCN)2. Traditional liquid electrolytes show many unfavorable behavior which
deters production of stable, safe and efficient DSSCs for long term utilization. Corrosion
of dye molecules and counter electrode, leakage, low stability and diminution of volatile
ions concentration caused by evaporation are the undesirable results for fabrication of
DSSCs by using liquid electrolytes. Many types of materials can be used for making
liquid electrolyte and each of them can effect different parameters of DSSC so choosing
the right materials and optimizing their concentration in the electrolyte system are
essential for making a suitable electrolyte for high performance DSSC. Ionic liquids and
different types of iodide salts with different cation sizes are the additives for providing
more ions in the liquid electrolyte, enhancing thermal and chemical stability and
effectively influence the DSSC parameters.
Besides liquid electrolytes there are two more types of solid-state and quasi solid
electrolyte systems, have been developed to overcome the imperfections of using liquid
electrolytes for fabrication of DSSCs. Although quasi solid and solid state electrolytes
Page 37
17
have lower ionic conductivity compared to the liquid electrolytes but they have higher
stability and are easy to handle for fabrication of DSSCs and each type of systems has its
own advantages.
Solid state electrolyte: researchers have been developing solid polymer
electrolytes by using a suitable p-type semiconductor concordant with
conduction band of TiO2 and HOMO level of dye as electrolyte beside the n-
type sensitizer dye which reminds the conventional silicon based solar cells
with p-n junction. Dimension of crystals for the p-type semiconductor is very
important for filling the TiO2 pores and enhancing the energy conversion
efficiency of DSSCs. These types of electrolytes are stable and safe for
fabrication of DSSCs although they promote low energy conversion
efficiencies (<5%) (Snaith & Mende, 2007).
Quasi-solid electrolytes (gel electrolyte): quasi-solid or gel electrolytes are
obtained by gelatinizing the liquid electrolytes by using gelling agents or using
conductive polymers to have the high mobility of ions like liquid electrolyte as
well as the cohesiveness of solid electrolyte. GPEs are a quasi-solid electrolyte
where polymers are creating the gel networks and they can be dry standing film
or wet semi solid polymer electrolyte obtained by using plasticizers to
plasticize the polymer (Kubo et al., 2002). Composite polymer electrolytes are
another type of quasi-solid polymer electrolyte where polymer electrolytes
contain fillers namely metal oxides (SiO2, TiO2, ZnO, ZrO2, etc.) to improve
the mobility of ions and stability of the electrolyte (Wang, et al., 2003).
Quasi-solid polymer electrolytes have many advantages in compare to the other types
of electrolytes which help to enhance the performance of DSSCs and manufacturing
DSSCs in larger scale. They have high ionic conductivity in the room temperature,
Page 38
18
they show high stability, very good contact with TiO2 semiconductor layer, preventing
leakage and evaporation of dye, preventing corrosion and dissolution of dye when they
expose to electrolyte, being flexible and cost effective all are advantages of using
quasi-solid/gel electrolyte for fabrication of DSSCs (Wu et al., 2007).
2.4 Gel polymer electrolytes (GPEs)
This type of electrolytes are obtained by plasticizing the polymers using different types
of plasticizers and additives such as ionic liquids. Salts and fillers are used to increase the
ionic conductivity of GPE system and make them suitable for application in DSSCs.
Many different types of polymers have been used for preparation of GPEs such as
poly(ethylene oxide) (PEO), poly(methylmethacrylate) (PMMA), poly(vinylidene
fluoride) (PVdF), polyacrylonitrile (PAN), poly (vinyl chloride) (PVC), etc. (Ahn et al.,
2010; Ren et al., 2002; Wang et al., 2004; Wu et al., 2006a; Yang et al., 2008). Many
types of polymer electrolytes are obtained using the biopolymers consist of starch,
cellulose derivatives, Chitosan and pectin (Andrade et al., 2009; Khiar & Arof, 2010;
Sudhakar & Selvakumar, 2012; Xiao et al., 2014). Presence of copolymers obtained from
different methods including electron beam radiation polymerization, UV, thermal
radiation or photo-polymerization and using low molecular weight monomers in the GPE
system show very high ionic conductivity and mechanical performance (Machado et al.,
2005; Musil et al., 2015). DSSCs fabricated using polymer electrolytes generally have
higher open circuit voltage (Voc) since obstruction of recombination sites by polymer
chains put off electron recombination with I3- ions in the TiO2/dye/electrolyte interface.
Basically the movements and diffusion of redox couple in the electrolyte is effecting the
efficiency of DSSCs while the ionic conductivity value for polymer electrolytes show
both anionic and cationic conductions in the system, so we can understand that in GPEs,
solvents and plasticizers play an important role in mobility on anions rather than polymers
(de Freitas et al., 2009). Since the approach in preparation of electrolyte for DSSCs is
Page 39
19
facile mobility of anions which helps to enhance the performance of DSSCs, using
alkaline salts with larger cations enhances mobility of ions in the GPE (Wang, et al.,
2003). Properties of plasticizers and their concentration directly affect ionic conductivity
of GPEs and need to be optimized in the system (Kang et al., 2003). Viscosity of GPEs
need to be controlled in presence of additives since penetration of electrolyte in the pores
of TiO2 reduces by increasing viscosity of the GPE and reduction in the movements of
polymer chains segments that causes decrease in the Voc value of DSSC. Presence of
nanoparticles in the GPEs increases the energy conversion efficiency of DSSC by
controlling the recombination rate of electrons in the TiO2/dye/electrolyte interface in
addition to enhancing the stability and ionic mobility of GPEs (Stathatos et al., 2003).
2.5 PVdF-HFP and PEO
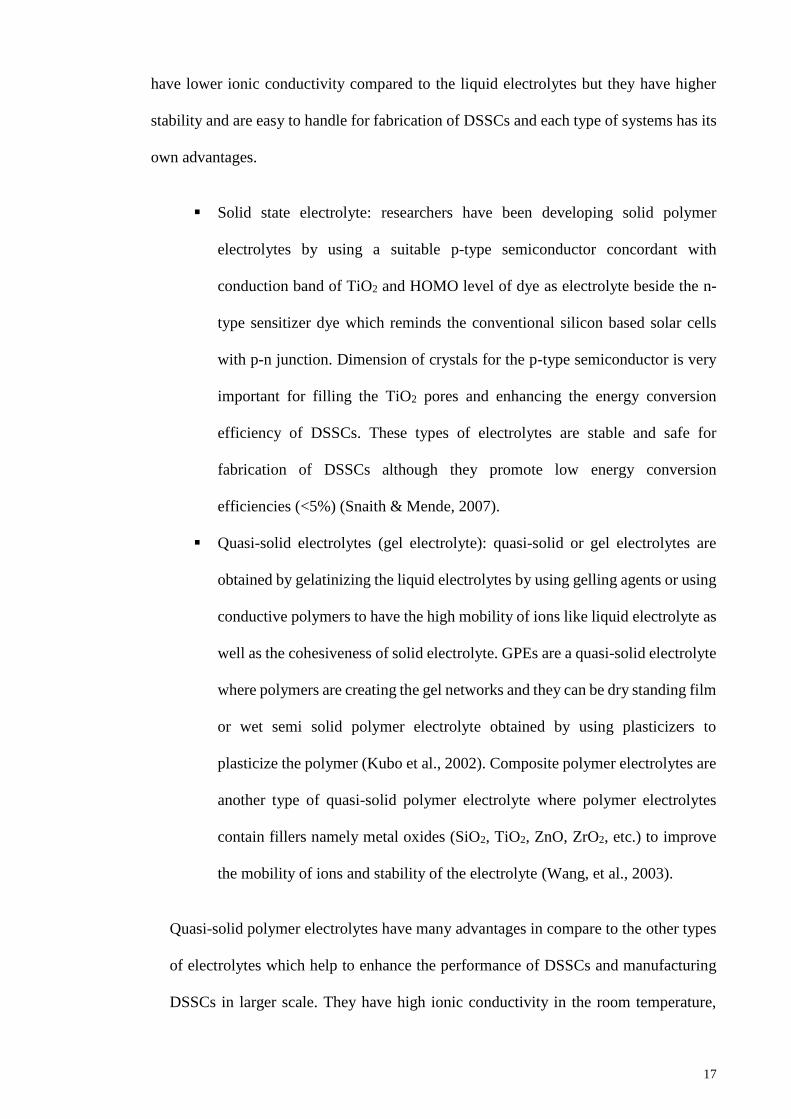
Figure 2.4 shows the structure of Poly (ethylene oxide) (PEO). PEO has been widely
used in polymer electrolytes and for electrochemical applications since it has high
mechanical and chemical stability and it is efficient for diffusion of ions in the polymer
electrolyte system by being polar moiety and acting as a solvent for metal salts.
Application of PEO-based polymer electrolytes in DSSCs enhances the mobility of I- in
the system due to the interaction between the ether oxygen and the dissociated cations in
the polymer electrolyte system (Xia et al., 2006). Although PEO has semicrystalline
nature and shows low ionic conductivity (~10-6 S cm-1), many methods has been reported
to reduce crystallinity of PEO and increase the conductivity to make this polymer
idoneous for preparation of polymer electrolytes for DSSC application such as blending
with other polymers, using nanoparticles and plasticizers. The energy conversion
efficiency for N3-dye sensitized solar cell using PEO, PEO:EC, PEO:PC as electrolyte is
0.6%, 2.9% and 3.6%, respectively (Ileperuma, 2013). Addition of 2-Mercapto
benzimidazole (MB) small rubber molecules in the PEO:I2 system increased the ionic
conductivity of the system as the amorphous phase of polymer electrolyte increased and
Page 40
20
application of this polymer electrolyte in DSSC improved both Jsc and Voc and the energy
conversion efficiency (Muthuraaman et al., 2013). GPE based on PEO blended with 2-
(2-methoxyethoxy)ethyl glycidyl ether) (P(EO/EM)) and with different concentration of
γ-butyrolactone (GBL) shows high thermal stability and ionic conductivity enhance ment
dye to the interaction between GBL, polymers and Li ions (Benedetti et al., 2014).
Crystallinity of Poly(ethylene oxide)/poly(vinylidenefluoride-hexafluoropropylene)
blend polymer based GPE system reduced in presence of tetraethylammonium tetra-
fluoroborate (Et4NBF4) salt, the ionic conductivity and diffusion of redox couples
increased in the system and the energy conversion efficiency of 6.2% have been reported
for DSSC fabricated by using such GPE (Cui et al., 2013). Presence of fillers with large
surface area in the PEO- based polymer electrolyte system prevents recrystallization of
PEO in the system and decreases the crystalline phase of polymer electrolyte
(Stergiopoulos et al., 2002).
Figure 2.4: Structure of Poly (ethylene oxide).
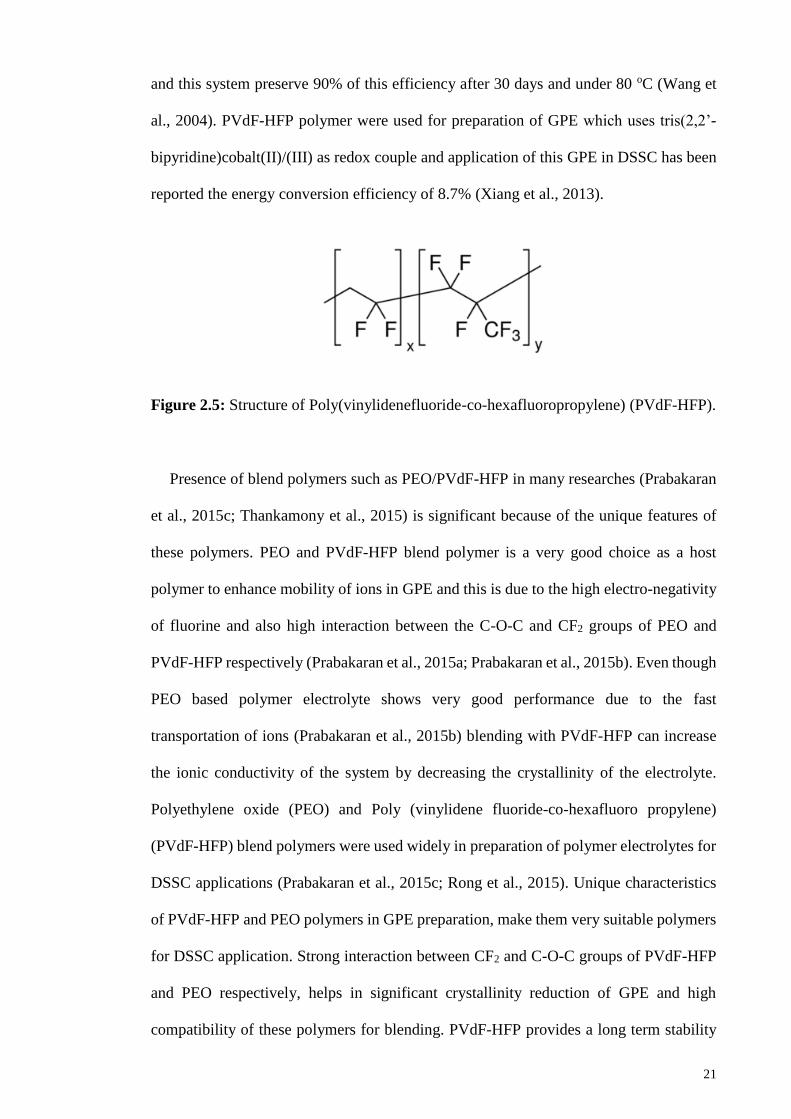
Figure 2.5 shows the structure of PVdF-HFP. It is noteworthy that
Poly(vinylidenefluoride-co-hexafluoropropylene) (PVdF-HFP) has high ionic
conductivity in compare with other polymers (between 10−8 to 10−10 S cm-1) and high
dielectric constant (ɛ = 8.4) that helps in dissociation of salt into ions in the polymer
electrolyte system and results in ionic conductivity improvement (Prabakaran et al.,
2015a). PVdF-HFP based GPE with incorporation of silica nanoparticles and 1-methyl-
3-propylimidazolium iodide ionic liquid show high energy conversion efficiency of 6.7%
Page 41
21
and this system preserve 90% of this efficiency after 30 days and under 80 oC (Wang et
al., 2004). PVdF-HFP polymer were used for preparation of GPE which uses tris(2,2’-
bipyridine)cobalt(II)/(III) as redox couple and application of this GPE in DSSC has been
reported the energy conversion efficiency of 8.7% (Xiang et al., 2013).
Figure 2.5: Structure of Poly(vinylidenefluoride-co-hexafluoropropylene) (PVdF-HFP).
Presence of blend polymers such as PEO/PVdF-HFP in many researches (Prabakaran
et al., 2015c; Thankamony et al., 2015) is significant because of the unique features of
these polymers. PEO and PVdF-HFP blend polymer is a very good choice as a host
polymer to enhance mobility of ions in GPE and this is due to the high electro-negativity
of fluorine and also high interaction between the C-O-C and CF2 groups of PEO and
PVdF-HFP respectively (Prabakaran et al., 2015a; Prabakaran et al., 2015b). Even though
PEO based polymer electrolyte shows very good performance due to the fast
transportation of ions (Prabakaran et al., 2015b) blending with PVdF-HFP can increase
the ionic conductivity of the system by decreasing the crystallinity of the electrolyte.
Polyethylene oxide (PEO) and Poly (vinylidene fluoride-co-hexafluoro propylene)
(PVdF-HFP) blend polymers were used widely in preparation of polymer electrolytes for
DSSC applications (Prabakaran et al., 2015c; Rong et al., 2015). Unique characteristics
of PVdF-HFP and PEO polymers in GPE preparation, make them very suitable polymers
for DSSC application. Strong interaction between CF2 and C-O-C groups of PVdF-HFP
and PEO respectively, helps in significant crystallinity reduction of GPE and high
compatibility of these polymers for blending. PVdF-HFP provides a long term stability
Page 42
22
of DSSC for practical usage due to its electrochemical stability beside TiO2 and Platinum
(Pt). High electronegative fluorine in PVdF-HFP and high number of channels between
electrodes of DSSC provided by PEO polymer helps in highly conductive GPE
preparation as a result of fast ion transportations (Prabakaran et al., 2015a) .
2.6 Iodide salts
Basically electrolytes for DSSCs contain iodide salt as a source of I- and they
effectively influence DSSC parameters. The size of cations in iodide salts effect the
energy conversion efficiency of DSSCs as well as concentration of iodide in the
electrolyte system.
Two different types of iodide salts have been used in preparation of electrolytes of
DSSCs which are organic and inorganic iodide salts. The organic salts such as N-methyl
pyridine iodide and 1-hexadecyl-3-methyl imidazolium iodide (C16MImI) have better
dissociation in organic solvents (Li et al., 2014; Wu et al., 2006b). Inorganic iodide salts
such as potassium iodide (KI) and sodium iodide (NaI), lithium iodide (LiI) have been
obtained by reaction between alkaline metal hydroxide or alkaline earth metal hydroxide
and acidic iodide. It is reported that N-methyl pyridine iodide salt with large cations easily
dissociated in γ-butyrolactone (γ-BL) organic solvent and release I- anions in the
electrolyte (Lan et al., 2007). PVdF polymer based GPE with tetrapropylammonium
iodide (Pr4NI) salt for DSSC showed better performance compared to the ZnI2 and KI
salts. It was reported that the Voc of the DSSC fabricated by using GPE mentioned above
increased since the big size Pr4N cations palliate the movements of I3- ions in the
electrolyte and reduce electron recombination rate at the TiO2/dye/electrolyte interface
(Madhushani et al., 2016). Polyphosphazene-based electrolyte with 1-methyl-3-
propylimidazolium (PMII) content shows relatively higher anionic conductivity in
compare to the equivalent electrolyte with NH4I, NaI and LiI contents respectively and it
Page 43
23
also shows a better performance as applied in DSSC (Lee et al., 2010). Interaction
between ether-oxygen of PEO in PEO based polymer electrolyte and alkaline salt with
larger cation facilitates dissociation of the iodide salts in the system and increase the open
circuit voltage and energy conversion efficiency of DSSC (Shen et al., 2008).
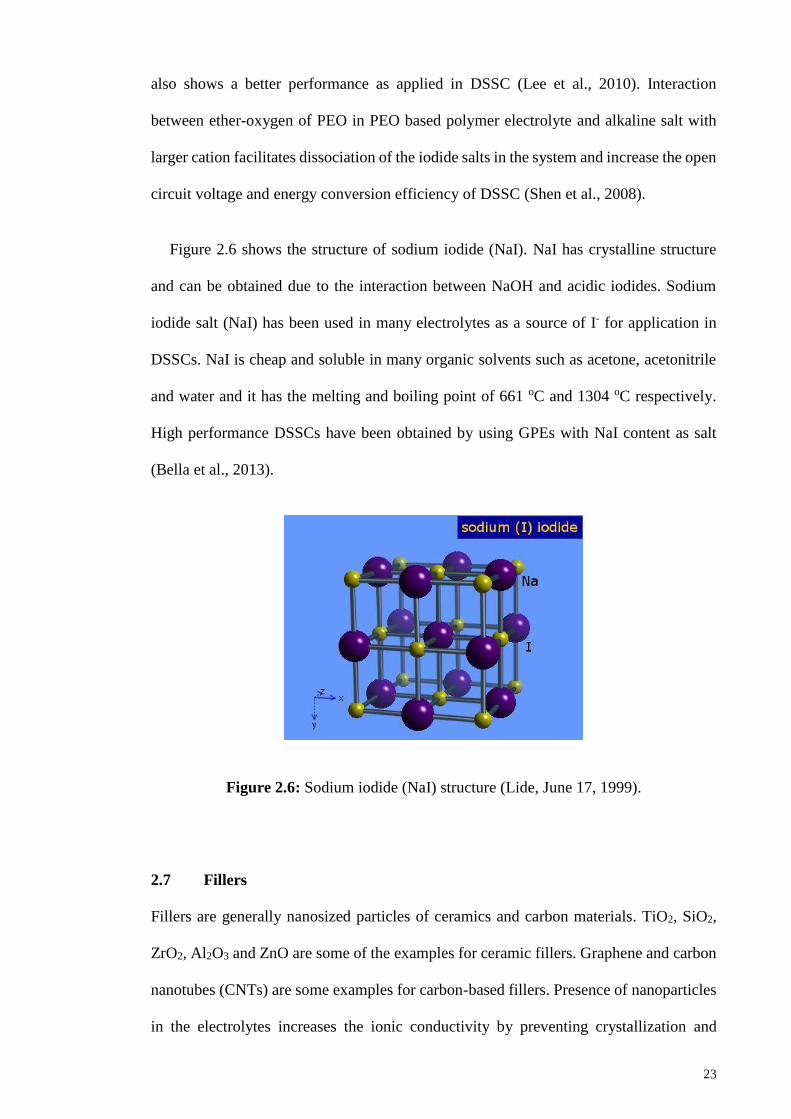
Figure 2.6 shows the structure of sodium iodide (NaI). NaI has crystalline structure
and can be obtained due to the interaction between NaOH and acidic iodides. Sodium
iodide salt (NaI) has been used in many electrolytes as a source of I- for application in
DSSCs. NaI is cheap and soluble in many organic solvents such as acetone, acetonitrile
and water and it has the melting and boiling point of 661 oC and 1304 oC respectively.
High performance DSSCs have been obtained by using GPEs with NaI content as salt
(Bella et al., 2013).
Figure 2.6: Sodium iodide (NaI) structure (Lide, June 17, 1999).
2.7 Fillers
Fillers are generally nanosized particles of ceramics and carbon materials. TiO2, SiO2,
ZrO2, Al2O3 and ZnO are some of the examples for ceramic fillers. Graphene and carbon
nanotubes (CNTs) are some examples for carbon-based fillers. Presence of nanoparticles
in the electrolytes increases the ionic conductivity by preventing crystallization and
Page 44
24
increasing the amorphous phase in the system and these nanoparticles also promote
electrolytes with high physical and electrochemical stability (Dissanayake et al., 2014).
Addition of fillers to the electrolytes for application in DSSCs enhances the mobility of
redox couples (I-/I3-) and diffusion of ions in the system and enhances the performance
and long-term stability of this device. Incorporation of graphene nanoparticles as filler
into the PMMA-GPE enhances the ion diffusivity and the energy conversion efficiency
of the relevant DSSC to 8.5% (Kang & Moon, 2015). GPE with TiO2 content reported to
have enhancement in ionic conductivity, stability and reduction in electron transfer
resistance in the counter electrode/electrolyte interface of relevant DSSC where TiO2
nanoparticles absorb on the platinum surface and draw out electrons into the GPE system
(Venkatesan et al., 2016). Incorporation of TiO2 nanoparticles into the poly(acrylonitrile-
co-vinyl acetate) (PAN-co-VA) based GPE increased the gelation of the system and
enhanced the energy conversion efficiency of pertaining DSSC from 8% to 8.3%
(Venkatesan et al., 2015). In PAN based GPE containing activated carbon, space-charge
layers as interfacial regions with electric field created in the system due to the interaction
between activated carbon nanoparticles and the absorbed ionic liquid and these regions
are responsible for enhancement in mobility of ions. Ionic conductivity of GPEs can be
increased by reducing ion paring due to the Lewis acid surface groups of some fillers such
SiO2 nanofillers (Mohan et al., 2013). SiO2 nanofibers provide feasible ion pathways by
creating free volume and decreasing the viscosity of GPE in order to enhance the ionic
conductivity of the system and applying this GPE in DSSC increasing recombination time
of electrons and charge collection efficiency ( Zhao et al., 2014).
Page 45
25
2.8 Summary
Literature review has been discussed in this chapter. General informations about solar
cells, DSSCs, their working principle and their advantages are discussed. The literature
about components of DSSCs and effects of materials on the working principle and energy
conversion efficiencies are provided. The literature background for materials used in this
research are also discussed.
Page 46
26
CHAPTER 3: METHODOLOGY
3.1 Introduction
In this chapter, materials and chemicals used for the preparation of GPEs and photo-
anodes are discussed. The methodology for preparation of GPEs and photo-anodes,
electrochemical and structural characterizations of GPEs, fabrication and characterization
of DSSCs have also been explained.
3.2 Materials and chemicals
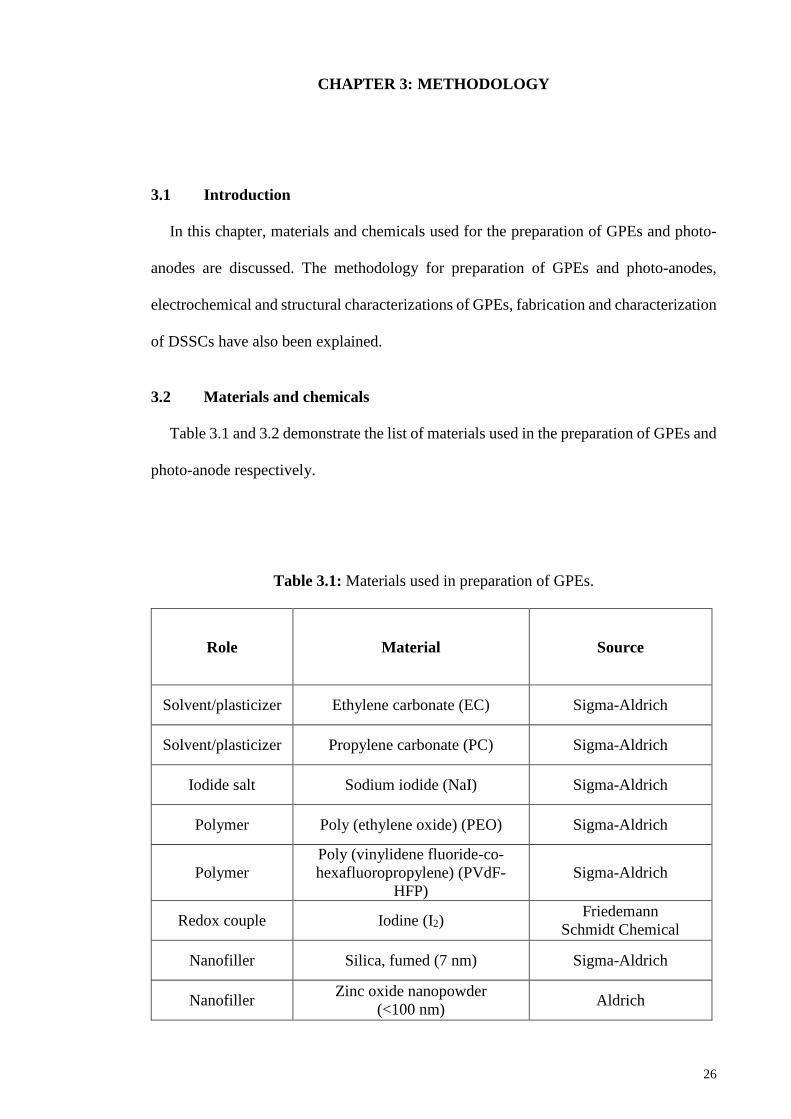
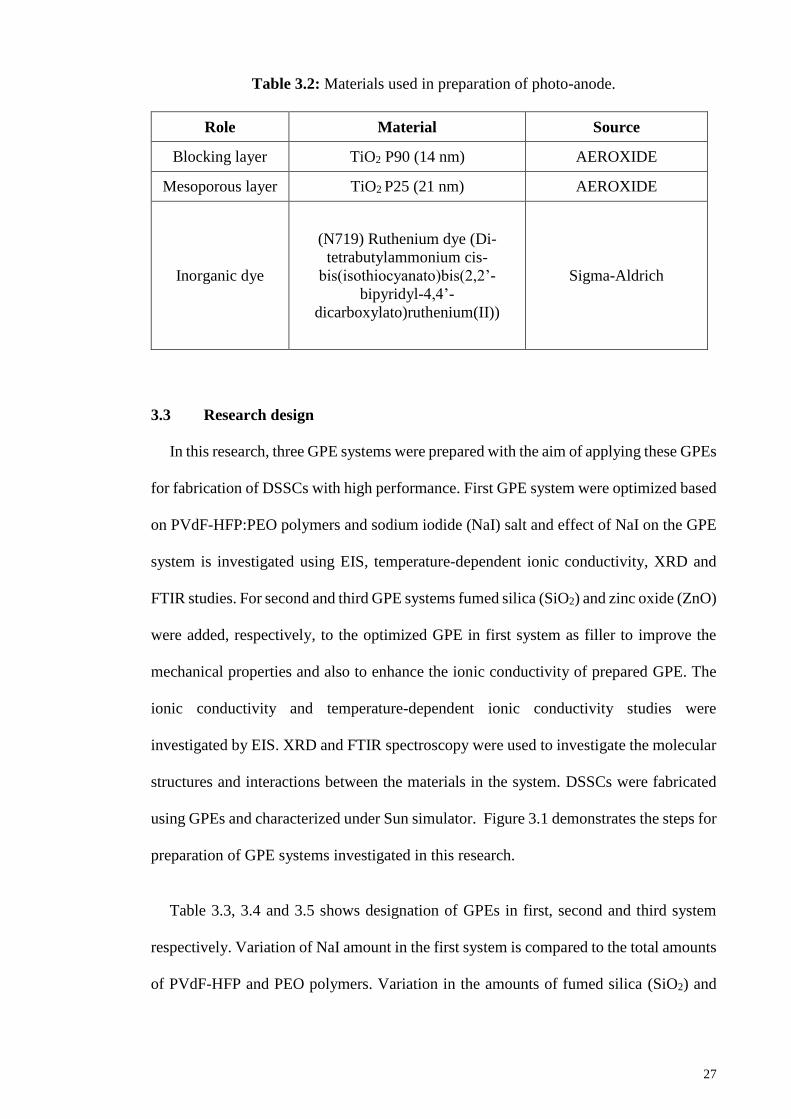
Table 3.1 and 3.2 demonstrate the list of materials used in the preparation of GPEs and
photo-anode respectively.
Table 3.1: Materials used in preparation of GPEs.
Role Material Source
Solvent/plasticizer Ethylene carbonate (EC) Sigma-Aldrich
Solvent/plasticizer Propylene carbonate (PC) Sigma-Aldrich
Iodide salt Sodium iodide (NaI) Sigma-Aldrich
Polymer Poly (ethylene oxide) (PEO) Sigma-Aldrich
Polymer
Poly (vinylidene fluoride-co-
hexafluoropropylene) (PVdF-
HFP)
Sigma-Aldrich
Redox couple Iodine (I2) Friedemann
Schmidt Chemical
Nanofiller Silica, fumed (7 nm) Sigma-Aldrich
Nanofiller Zinc oxide nanopowder
(<100 nm) Aldrich
Page 47
27
Table 3.2: Materials used in preparation of photo-anode.
Role Material Source
Blocking layer TiO2 P90 (14 nm) AEROXIDE
Mesoporous layer TiO2 P25 (21 nm) AEROXIDE
Inorganic dye
(N719) Ruthenium dye (Di-
tetrabutylammonium cis-
bis(isothiocyanato)bis(2,2’-
bipyridyl-4,4’-
dicarboxylato)ruthenium(II))
Sigma-Aldrich
3.3 Research design
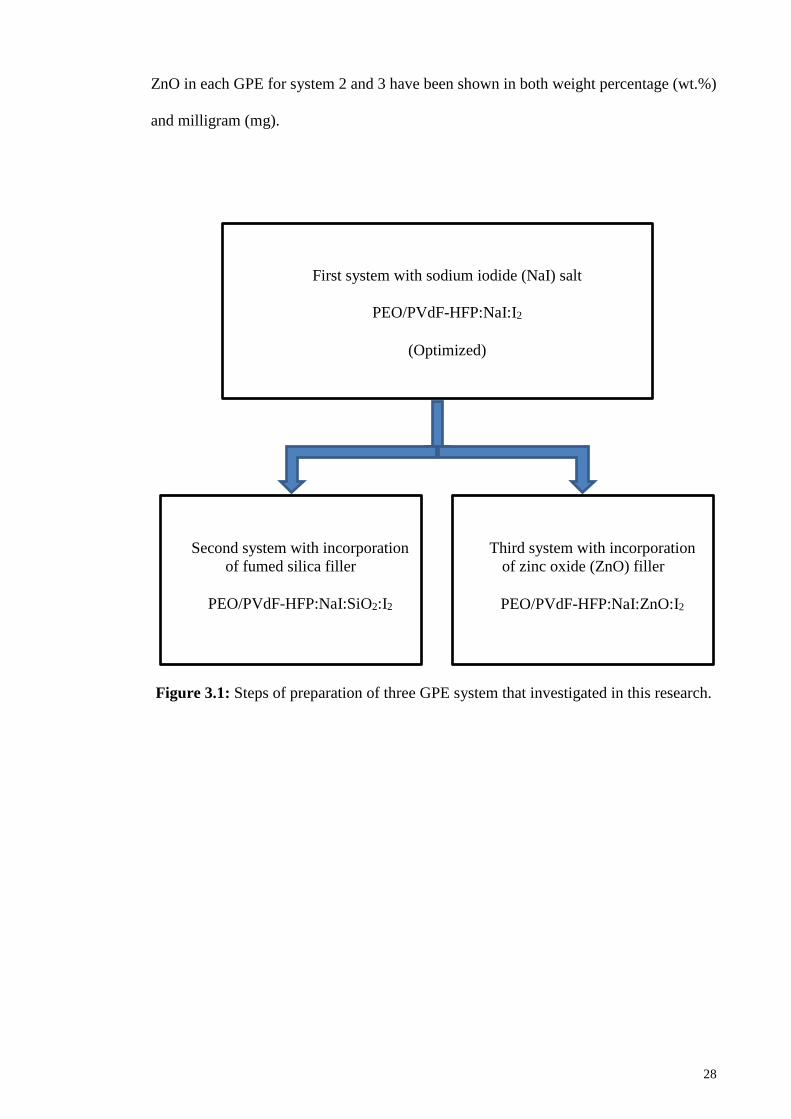
In this research, three GPE systems were prepared with the aim of applying these GPEs
for fabrication of DSSCs with high performance. First GPE system were optimized based
on PVdF-HFP:PEO polymers and sodium iodide (NaI) salt and effect of NaI on the GPE
system is investigated using EIS, temperature-dependent ionic conductivity, XRD and
FTIR studies. For second and third GPE systems fumed silica (SiO2) and zinc oxide (ZnO)
were added, respectively, to the optimized GPE in first system as filler to improve the
mechanical properties and also to enhance the ionic conductivity of prepared GPE. The
ionic conductivity and temperature-dependent ionic conductivity studies were
investigated by EIS. XRD and FTIR spectroscopy were used to investigate the molecular
structures and interactions between the materials in the system. DSSCs were fabricated
using GPEs and characterized under Sun simulator. Figure 3.1 demonstrates the steps for
preparation of GPE systems investigated in this research.
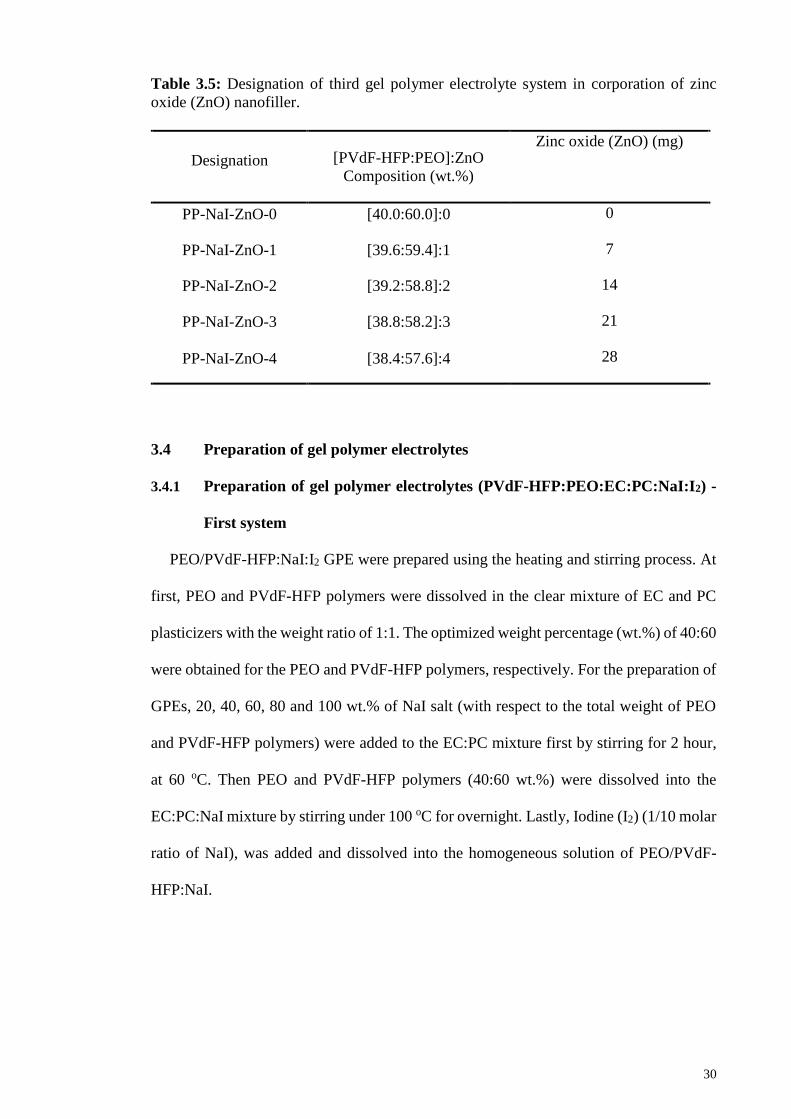
Table 3.3, 3.4 and 3.5 shows designation of GPEs in first, second and third system
respectively. Variation of NaI amount in the first system is compared to the total amounts
of PVdF-HFP and PEO polymers. Variation in the amounts of fumed silica (SiO2) and
Page 48
28
ZnO in each GPE for system 2 and 3 have been shown in both weight percentage (wt.%)
and milligram (mg).
Figure 3.1: Steps of preparation of three GPE system that investigated in this research.
First system with sodium iodide (NaI) salt
PEO/PVdF-HFP:NaI:I2
(Optimized)
Second system with incorporation
of fumed silica filler
PEO/PVdF-HFP:NaI:SiO2:I2
Third system with incorporation
of zinc oxide (ZnO) filler
PEO/PVdF-HFP:NaI:ZnO:I2
Page 49
29
Table 3.3: Designation of first gel polymer electrolyte system with NaI content. The ---
amount of NaI is in compare to the total amount of PVdF-HFP and PEO polymers.
GPE designation NaI (wt.%) NaI (g)
PP-NaI-20 20 1.4
PP-NaI-40 40 2.8
PP-NaI-60 60 4.2
PP-NaI-80 80 5.6
PP-NaI-100 100 7
Table 3.4: Designation of second gel polymer electrolyte system in corporation of fumed
silica (SiO2) nanofiller.
Designation [PVdF-HFP:PEO]:SiO2
Composition (wt.%)
Fumed silica (SiO2)
(mg)
PP-NaI-Si-0 [40.0:60.0]:0 0
PP-NaI-Si-1 [39.6:59.4]:1 7
PP-NaI-Si-2 [38.8:58.2]:3 21
PP-NaI-Si-3 [38.0:57.0]:5 35
PP-NaI-Si-4 [37.2:55.8]:7 49
PP-NaI-Si-5 [36.4:54.6]:9 63
PP-NaI-Si-6 [35.6:53.4]:11 77
PP-NaI-Si-7 [34.8:52.2]:13 91
PP-NaI-Si-8 [34.0:51.0]:15 105
Page 50
30
Table 3.5: Designation of third gel polymer electrolyte system in corporation of zinc
oxide (ZnO) nanofiller.
Designation [PVdF-HFP:PEO]:ZnO
Composition (wt.%)
Zinc oxide (ZnO) (mg)
PP-NaI-ZnO-0 [40.0:60.0]:0 0
PP-NaI-ZnO-1 [39.6:59.4]:1 7
PP-NaI-ZnO-2 [39.2:58.8]:2 14
PP-NaI-ZnO-3 [38.8:58.2]:3 21
PP-NaI-ZnO-4 [38.4:57.6]:4 28
3.4 Preparation of gel polymer electrolytes
3.4.1 Preparation of gel polymer electrolytes (PVdF-HFP:PEO:EC:PC:NaI:I2) -
First system
PEO/PVdF-HFP:NaI:I2 GPE were prepared using the heating and stirring process. At
first, PEO and PVdF-HFP polymers were dissolved in the clear mixture of EC and PC
plasticizers with the weight ratio of 1:1. The optimized weight percentage (wt.%) of 40:60
were obtained for the PEO and PVdF-HFP polymers, respectively. For the preparation of
GPEs, 20, 40, 60, 80 and 100 wt.% of NaI salt (with respect to the total weight of PEO
and PVdF-HFP polymers) were added to the EC:PC mixture first by stirring for 2 hour,
at 60 oC. Then PEO and PVdF-HFP polymers (40:60 wt.%) were dissolved into the
EC:PC:NaI mixture by stirring under 100 oC for overnight. Lastly, Iodine (I2) (1/10 molar
ratio of NaI), was added and dissolved into the homogeneous solution of PEO/PVdF-
HFP:NaI.
Page 51
31
Figure 3.2: Gel polymer electrolytes obtained in first system (PVdF-HFP:PEO:EC:
PC:NaI:I2).
3.4.2 Preparation of gel polymer electrolytes (PVdF-HFP:PEO:EC:PC:NaI:SiO2:
I2) - Second system
For preparation of the GPEs, the materials needed to be mixed in order and by
continuous stirring and heating for better dissolution and gelatinization purpose. Ethylene
carbonate (EC) and propylene carbonate (PC) with the same weight ratio (1:1) were
mixed in a glass bottle by stirring under 60 oC for about 1 hr. Fixed and optimized amount
of NaI salt was added to the mixture while the solution were continuously stirred at the
same temperature for 4 hours. For each sample the fumed silica with different
concentration was added to the solution followed by heating and stirring for overnight.
For better dispersion of PVdF-HFP in the mixture, at first it was dissolved in 10 ml of
acetone by continuous stirring and the known amount of PEO was added gradually. Then,
EC:PC and salt mixture was added for complete dissolution. The temperature was
adjusted to 80 oC for evaporation of all the acetone in the solution. When the evaporation
of acetone ensured, iodine (10 M of NaI salt) was added to the mixture to provide the
Page 52
32
iodide/triiodide (I−/I3−) redox couple and further stirred to get homogenous and
gelatinized solution. The mixtures as GPEs were allowed to cool down to room
temperature and directly characterized by using impedance spectroscopy at ambient
temperature.
Figure 3.3: Gel polymer electrolytes obtained in the second system (PVdF-HFP:PEO:
EC:PC:NaI:SiO2:I2).
3.4.3 Preparation of gel polymer electrolytes in (PVdF-HFP:PEO:EC:PC:NaI:
ZnO:I2)- Third system
Nanocomposite polymer electrolytes were prepared by mixing chemicals under
continuously stirring and heating processes. Clear mixture of ethylene carbonate (EC)
and propylene carbonate (PC) with the same weight ratio (1:1) were obtained by stirring
under 60 oC and for 1 hour. For all the GPEs, optimized amount of sodium iodide (NaI)
salt added to the mixture and dissolved by stirring for 4 hours at the same temperature
(60 oC). ZnO nanoparticles were dried in oven for 4 hours and under 60 oC before use.
Certain amounts of ZnO nanoparticle were dispersed into each sample by heating and
stirring for about 8 hours. PVdF-HFP were separately dissolved in 10 ml of acetone by
Page 53
33
stirring at room temperature and the resultant solution added to the mixture gradually.
Intended amount of PEO added to the mixture and the temperature adjusted to 80 oC and
this mixture further stirred at this temperature for 4 hours until evaporation of acetone in
the mixture was obtained. At the end 0.118 g iodine (1/10 M of salt) was added to the
mixture as a source or I-/I3- redox couple and stirred until the homogeneous mixture was
obtained. EIS studies investigated directly after all NCPEs obtained and cooled down to
the room temperature.
Figure 3.4: Gel polymer electrolytes obtained in the third system (PVdF-HFP:PEO:EC:
PC:NaI:ZnO:I2).
3.5 Characterizations of gel polymer electrolytes
EIS for all GPEs in system 1, 2 and 3 were analyzed by using Hioki, 3532-50 LCR
HiTESTER device. The ionic conductivity studies at ambient temperature and the
temperature-dependent ionic conductivity studies were carried out under the frequency
range of 50 Hz to 5 MHz. The XRD patterns were collected using PANalytical Empyrean
diffractometer with Cu-Kα radiation wavelength of λ = 1.540600 Ǻ in 2θ range of 5° to
80° at ambient temperature (45 kV and 40 mA). FTIR spectra were obtained for all the
Page 54
34
GPEs in each system using FTIR-ATR PerkinElmer spectrum-400 spectrometer and the
interaction between the materials was studied. The J-V curves of the fabricated DSSCs
obtained under the sun simulator using the Keithly 2400 potentiometer. The light with
incident light power (Pin) of 1000 (W m-2) were used.
3.5.1 Electrochemical Impedance Spectroscopy (EIS)
A stainless steel cell with fixed thickness of 0.2828 cm and surface area of 2.27 cm2
was filled with GPE completely and sandwiched between two stainless steel blocking
electrodes as shown in the Figure 3.5.
Figure 3.5: Photograph of the stainless steel cell with two blocking electrodes used for
electrochemical impedance spectroscopy (EIS) analysis of gel polymer electrolytes.
Page 55
35
The following equation was used to calculate the ionic conductivity (σ) of the GPEs
using EIS data
AR
L
b
3.1
where σ is the ionic conductivity (S cm-1) of the GPEs, L (cm) is the thickness of the
stainless steel cell, Rb (Ω) is the bulk resistance and A (cm2) is the area of the stainless
steel cell.
The Cole-Cole plots were obtained for each GPE to determine the bulk resistance value
(Rb) and the ionic conductivity values were calculated by using equation mentioned
above. Figure 3.6 shows the typical Cole-Cole plot and the parameters can be obtained
from this plot such as bulk resistance (Rb). The inset circuit represents the equivalent
circuit of the cell.
Figure 3.6: Demonstration of Cole-Cole plot and the parameters.
Page 56
36
3.5.2 Temperature-dependent ionic conductivity
Measuring ionic conductivity of GPEs in different temperatures known as
temperature-dependent ionic conductivity helps to investigate thermal behaviour of the
GPEs based on two generic thermal activated models of Arrhenius and Vogel-Tammann-
Fulcher (VTF) thermal models as well as calculation of activation energies for each GPE
in different system of this research (Angell & Smith, 1982).
The Arrhenius model which express the thermal behaviour of GPEs based on their
ionic conductivity values at various temperatures shown below:
kT
Eaexp0 3.2
where σ0, Ea and k allude to the pre-exponential factor, activation energy (eV) and
Boltzmann constant (eV/K), respectively. Activation energy values for each GPE
calculated by using log σ versus 1000/T plot and equation 3.2.
Thermal behaviour of GPEs for VTF model should fit the following equation:
)(exp
0
2/1
TTk
EAT
B
a 3.3
where T, A and T0 are the temperature, pre-exponential factor and reference temperature
(K) related to glass transition temperature (Tg), respectively.
Based on the regression values (R2 ~ 1) obtained from log σ versus 1000/T plot, all the
prepared GPEs in system 1,2 and 3 followed the Arrhenius thermal behaviour and the
activation energies calculated by using equation 3.2. The ionic conductivity of all GPEs
in each system were obtained at temperatures between 30 to 100 oC and by 10 oC
difference by using Hioki, 3532-50 LCR HiTESTER device.
Page 57
37
3.5.3 Fourier Transform Infrared Spectroscopy (FTIR)
Fourier transform infrared spectroscopy is an important analysis to identify the
molecular structure in the GPE system and assessment of interactions between materials
in the GPE for quality identifications. Investigating interactions happens between
molecules in the GPEs helps to explain identity of materials and the quality of GPE
performance for applications in DSSCs. In this characterization GPEs expose to the
infrared radiation and transmittance or absorbance of infrared light gives the fingerprint
called FTIR spectrum for screening samples and further investigation of their structural
properties by understanding the chemical bonds. Figure 3.7 shows the FTIR
instrumentation and how a FTIR spectrum produces by this spectrometer.
Figure 3.7: Fourier transform infrared spectroscopy (FTIR) instrumentation (Vedantam,
2014).
Page 58
38
The basic optical principle of FTIR spectrometer is base on the Michelson
spectrometer demonstrated in Figure 3.8. A FTIR spectrometer has a light source that
produces g(δ) over range of δ and a fixed mirror A, a movable mirror B and an beam
splitter C with centre at O as shown in Figure 3.8. A computer attaches to the spectrometer
to do computations for transforming the instant results to the spectrum. A parallel input
beam splits into two beams at O and they travel to the mirrors A and B and recombine at
O. in the distance between O and two mirrors are same (OA=OB=L) then the beam travel
the distance equal to 2L before cocombination at O. mirror B moves a distance L and the
optical path differnce δ = 2L. If L = λ/4 (λ = wavelenght of the monochromatic input
light) then δ = λ/2 so the beams interfere destructively at O and the resultant beam has
intensity equal to zero. When L = λ/2 and δ = λ, the splitted beam interfere constructively
at O and the resultant beam has the maximum intensity (Bates, 1976).
Figure 3.8: The components of Michelson spectrometer.
Page 59
39
Interaction between ions, polymers, salts and solvents helps to track the movements of
ions and understanding the pathways created in the GPEs for facilitating the mobility of
ions. The FTIR spectra have been obtained in the wavenumber range from 4000 to 500
cm-1 for the pure materials used in the preparation of the GPEs and all the GPEs in system
1, 2 and 3.
3.5.4 X-ray Diffraction Spectroscopy
X-ray diffraction analysis has been used to study the structure of atom and molecules
by using X-ray. X-ray radiations are high energy electromagnetic radiations with short
wavelengths that can easily penetrate into the solid objects. Sample holder, X-ray tube
and X-ray detector are the components of an X-ray diffractometer. X-ray tube is where
the X-ray produces by applying a voltage for acceleration of electrons generated by
heating a filament. Filters were used to produce monochromatic radiation from X-rays
and the resultant radiation collimated and concentrated toward the sample. If radiations
interfere with the sample constructively based on the Bragg’s law (nλ=2d sin θ) they
produce diffracted rays. X-ray detector detected the diffracted rays for counting. Figure
3.9 show the structure of an X-ray diffractometer.
Page 60
40
Figure 3.9: X-ray diffractometer (He et al., 2000).
The X-ray diffraction analysis over 2θ angle can detect all diffracted radiations from
the lattice in all direction. Figure 3.9 shows diffraction of X-ray through the sample and
base on the Bragg’s law.
Figure 3.10: Diffraction of X-ray by interfering with sample (Liao, 2007).
Page 61
41
The X-ray radiations can penetrate into the sample to dislodge electrons from the inner
shells to ionize the atoms and produce different type of intensities (Kα and Kβ) in the X-
ray spectra of the sample.
The XRD pattern for all GPEs in system 1, 2 and 3 and the pure materials used in
preparation of GPEs obtained in 2θ range of 5° to 80° at ambient temperature to
investigate the amorphous nature of GPEs.
3.6 Dye-sensitized solar cell (DSSC) fabrication
DSSCs were fabricated after preparation of photo-anode, counter electrode and GPEs.
Preparation of photo-anode is in three steps of coating first TiO2 layer (P90), coating
second TiO2 layer (P25) and preparation of dye solution for soaking the coated FTO
glasses.
3.6.1 Preparation of photo-sensitized electrode
For the preparation of photo-electrode (anode electrode), two TiO2 layers were coated
with two different methods such as spin coating and doctor bladed method on the FTO
glasses. For Second layer, TiO2 with bigger particle size (25 nm) was used to produce
porous surface and to trap more molecules of sensitizing dye. The prepared photo-
electrodes were immersed in the N719 dye solution for 24 hours and dried. The complete
procedure is explained in the following sessions. Figure 3.11 shows materials used for
preparation of photo-anodes.
Page 62
42
Figure 3.11: Materials for photo-anode preparation.
3.6.1.1 Conducting glass (FTO) cleaning
In this work fluorine doped tin oxide (FTO) substrates were used for preparation of
photo-anodes. Before coating TiO2 layer we need to clean the FTO glasses properly with
the following procedure. The FTO glasses was placed into a beaker and washed with few
drops of soap and rinsed under running water. After the FTO glasses totally rinsed with
water, distilled water was poured into the beaker until all of the FTO glasses were covered
then 2 drops of H2SO4 were added to the beaker and the FTO glasses sonicated in this
solution for 10 minutes. The solution inside beaker totally disposed to the disposal bottle
and 2-propanol poured into the beaker to cover all the FTO glasses again. The FTO
glasses in the beaker filled with 2-propanol placed on the hot plate and heated until some
small bubbles appeared inside. The FTO glasses taken out from the beaker by tweezers
and wiped with tissue gently.
Page 63
43
3.6.1.2 First layer of photo-sensitized electrode
The first layer of TiO2 was coated on the FTO glass by spin coating method. 0.5 g of
TiO2 (P90) was ground for 30 minutes in the agate mortar and later 2 ml HNO3 in pH=1
added to the TiO2 powder and mixed very well using mortar until a homogeneous solution
obtained. Half of the FTO glass covered with magic tape and placed on the spin coater.
One drop of the solution dropped on the surface of the FTO glass and spin coated for 2
seconds at 1000 rpm and immediately for 60 seconds at 2350 rpm. After spin coating the
substrate was sintered at 450o C for 30 minutes and kept in the furnace until they cooled
down to the ambient temperature stilly. Figure 3.11 shows the steps for coating the first
layer of TiO2.
Page 64
44
Figure 3.12: Procedures of coating the first layer of TiO2 (P90).
3.6.1.3 Second layer of photo-sensitized electrode
The second layer of TiO2 were coated on the FTO glass by doctor blading method. 0.5
g of TiO2 (P25) was ground for 30 minutes in the agate mortar and later 2 ml HNO3 in
pH=1, 1 drop of Triton X-100 and 0.1 g Carbowax added to the TiO2 powder respectively
and mixed very well using mortar until a homogeneous solution obtained. Doctor blade
Page 65
45
method were used for coating the second layer of TiO2. In this method two FTO glasses
with the same thickness placed on the both side of the substrate and fixed with magic tape
to control the thickness of the TiO2 layer. After coating the second layer, substrate was
sintered at 450 oC for 30 minutes and kept in the furnace until they cooled down to the
ambient temperature stilly.
Figure 3.13: Coating the second layer of TiO2 by doctor blade method.
3.6.1.4 Dye solution
After FTO glasses were coated with two TiO2 layers, they were soaked into the dye
solution to absorb dye molecules on the porous surface of TiO2 layer. For preparation of
dye solution, 5 mg of dye (N719) added to 10 ml ethanol and mixed for 10 minutes by
stirring at room temperature. Later they were soaked in this solution for 24 hours to
complete preparation of photo-anodes. Figure 3.14 shows the container of N719 dye
solution covered with aluminum to avoid any radiation of light.
Page 66
46
Figure 3.14: Dye solution.
3.6.2 Preparation of counter electrode
For preparation of counter electrode the commercial platinum solution was coated on
the FTO glass for three time. For the first and second layers, the platinum solution was
dropped on the surface of FTO glass and spin coated at 1000 rpm for 4 seconds and
immediately after at 2350 rpm for 45 second and later the counter electrode were sintered
at 450 oC for 30 minutes. Procedure for the third layer is the same but the only difference
is that the substrate sintered at 450o C for 30 minutes.
3.6.3 Fabrication of DSSCs
For fabrication of DSSCs all GPEs were sandwiched between photo-anode and counter
electrode. The components of DSSCs were fixed tightly with a clip and a silicon tape was
used to cover the back surface of photo-anode and made an active area on the surface of
photo-anode to control illumination of light into the DSSC. Based on Figure 3.15 the
configuration of DSSC is FTO glass/TiO2 (P90)/ TiO2 (P25)/dye (N719)/ GPE
/platinum/FTO glass.
Page 67
47
Figure 3.15: The components used in fabrication of dye-sensitized solar cell.
An incident light power (Pin) of 1000 (W m-2) was used to analyze the fabricated
DSSCs and their J-V curves were obtained under the sun simulator. Figure 3.16 shows a
sample of the fabricated DSSC in this research and Figure 3.17 shows the experimental
setup for characterization of DSSCs under solar simulator.
Figure 3.16: Fabricated dye-sensitized solar cell.
Page 68
48
Figure 3.17: Experimental setup for characterization of fabricated dye-sensitized solar
cell under solar simulator.
3.6.4 Photovoltaic studies of DSSCs
DSSCs were fabricated by sandwiching all GPEs from system 1, 2 and 3, between the
working and counter electrodes to investigate the changes on the parameters and
efficiency values of the DSSCs in each system. The J-V curves of the fabricated DSSCs
were obtained under the sun simulator using the Keithly 2400 potentiometer. The light
with incident light power (Pin) of 1000 (W m-2) was used to generate electricity based on
the principle explained in chapter two. Variation of voltage with current values that
generated in DSSCs were collected. The current density (J) values were calculated and
the plot of J (mA cm-2) versus voltage (V) obtained for all fabricated DSSCs with various
GPEs. Figure 3.18 shows a model of a J-V characteristic curve with position of Jsc and
Voc parameters that can be obtained from this curve.
Page 69
49
The efficiency values of DSSCs were calculated using the following equation:
PVJ
in
ocscFF..
3.4
where Pin is the incident light power, and Jsc (mA cm-2), Voc (V) and FF are the short-
circuit current density, open circuit voltage and fill factor, respectively. The fill factor for
all the DSSCs was calculated using the equation below:
VJ
Pocsc
FF max 3.5
where Pmax (mW cm-2) is the maximum power of solar cell. The fabricated solar cell were
analyzed under the solar simulator with incident light power of 1000 (W cm-2).
J (mA cm-2)
V (v)
Jsc
Voc
Figure 3.18: The J-V characteristic curve with parameters.
Page 70
50
3.7 Summary
In this chapter, the materials and chemicals that were used in this research and their
roles and also the research design were discussed. The experimental methods for
preparation of GPEs and electrodes and also the characterization methods for both GPEs
and fabricated DSSCs were discussed.
Page 71
51
CHAPTER 4: RESULTS AND DISCUSSION
4.1 Introduction
The results obtained for all the GPEs in three systems based on the electrochemical
impedance spectroscopy (EIS), temperature-dependence ionic conductivity, X-ray
diffraction (XRD) and Fourier transform infrared (FTIR) studies were reported in this
chapter. The photovoltaic performance of DSSCs were also reported based on the GPEs
in each system.
4.2 PVdF-HFP:PEO:EC:PC:NaI:I2 gel polymer electrolytes
PEO/PVdF-HFP blend based GPEs are containing ethylene carbonate (EC) and
propylene carbonate (PC) as solvent with different concentrations of sodium iodide (NaI)
salt. The concentration of NaI salt was calculated with respect to the total amount of
polymers (PEO:PVdF-HFP) which means 20 wt.% concentration of NaI is equal to 20
weight percent of the fixed amount of PEO and PVdF-HFP. NaI based GPEs in this
system are PP-NaI-20, PP-NaI-40, PP-NaI-60, PP-NaI-80, PP-NaI-100 with 20, 40, 60,
80 and 100 wt.% NaI content. Effect of NaI on the GPE system was investigated using
EIS, temperature-dependent ionic conductivity, XRD and FTIR studies. DSSCs were
fabricated using GPEs and tested under Sun simulator.
4.2.1 Ionic conductivity studies at ambient temperature
The Cole-Cole plots for PP-NaI-20, PP-NaI-40, PP-NaI-60, PP-NaI-80 and PP-NaI-
100 GPEs were obtained and the ionic conductivity values were calculated. Figure 4.1
shows the Cole-Cole plots for PP-NaI-20, PP-NaI-40, PP-NaI-60, PP-NaI-80 and PP-NaI-
100 GPEs in PEO/PVdF-HFP:NaI:I2 system.
Page 72
52
Figure 4.1: Cole-Cole plots for (a) PP-NaI-20, (b) PP-NaI-40, (c) PP-NaI-60, (d) PP-NaI-
80 and (e) PP-NaI-100 gel polymer electrolytes.
Page 73
53
Table 4.1 shows the designation for the GPEs and the relevant ionic conductivity
values. Figure 4.2 shows the variation of the ionic conductivities of the GPEs in presence
of different concentration of sodium iodide (NaI) from 0 to 100 wt.%.
Table 4.1: Designation with the corresponding ionic conductivity and bulk resistance
values of the gel polymer electrolytes.
GPE designation
NaI content
with respect to
PEO:PVdF-HFP
(wt.%)
Bulk resistance
Rb (Ω) σ (mS cm-1)
PP-NaI-20 20 54.4 2.29
PP-NaI-40 40 32.9 3.78
PP-NaI-60 60 24.8 5.02
PP-NaI-80 80 21.4 5.82
PP-NaI-100 100 19.5 6.38
PP-NaI-100 has the lowest bulk resistance value of 19.5 Ω among all the GPEs in
system one. Improvements in the ionic conductivity values can be observed in the
presence of the NaI salt where the highest ionic conductivity value of 6.38 mS cm−1
obtained after incorporation of 100 wt.% of NaI salt for PP-NaI-100 GPE. The ionic
conductivity of GPEs was enhanced due to the incorporation of NaI salt. Dissociation of
NaI salt in the GPEs provided more ions in the system and enhanced the ionic
conductivity value of GPE. Contribution of NaI in the system increases the charge carriers
where I− ions from dissociation of NaI in the system could be considered as the source of
the I−/I3− redox couple next to the Iodine (I2).
Page 74
54
Figure 4.2: Variation of ionic conductivity in presence of different concentrations of NaI
salt in the gel polymer electrolyte system.
4.2.2 Temperature-dependent ionic conductivity studies
The ionic conductivity for PP-NaI-20, PP-NaI-40, PP-NaI-60, PP-NaI-80 and PP-NaI-
100 GPEs was measured at different temperatures from 303 K to 373 K and the results
were demonstrated in Figure 4.3. The ionic conductivity values increased by increasing
the temperature. This could be due to enhancement in mobility of ions in less viscous
medium and increased in the polymer chain flexibilities by increasing temperature
(Ramesh & Arof, 2001).
Page 75
55
Figure 4.3: Temperature-dependent ionic conductivity results for PP-NaI-20, PP-NaI-40,
PP-NaI-60, PP-NaI-80 and PP-NaI-100 gel polymer electrolytes.
Page 76
56
Increasing the ionic conductivity with temperature shows the fast mobility of ions in
the system and it may be due to the increasing in the amorphous phase of the host
polymers where the PEO and PVDF-HFP have low glass transition temperatures specially
compared with the EC and PC plasticizers (Ataollahi et al., 2012; Dissanayake et al.,
2016).
The thermal ionic conductivity behaviour of all the GPEs shows almost straight line
with the regression values ~ 1 according to the Arrhenius thermal activated model. Table
4.2 shows the activation energy values that were calculated by using the equation 3.3, for
all the GPEs with different concentration of NaI content. The activation energy value
decreases by increasing the concentration of NaI salt in the system and it starts to decrease
from 117 meV for the GPE with 20 wt.% NaI content to 98 meV which is the lowest
activation energy value and corresponds for the highest conducting GPE with 100 wt.%
NaI content. Activation energy has direct relationship with mobility of ions in the GPE
system. The lower is the activation energy value, the ions have less barrier for movement
to overcome in the GPE system. NaI salt provides more ions in the GPE system and based
on the ion hopping mechanism more ions can easily transfer to conduction sites in the
system using less energy which entail less activation energy values (Sørensen & Jacobsen,
1982).
Page 77
57
Table 4.2: Designation with the corresponding ionic conductivity and activation energy
values of the gel polymer electrolytes.
GPE designation NaI content (wt.%) Ea (meV)
PP-NaI-20 20 117
PP-NaI-40 40 114
PP-NaI-60 60 108
PP-NaI-80 80 105
PP-NaI-100 100 98
4.2.3 FTIR studies
The interaction between PEO, PVdF-HFP and NaI salt in the GPE systems was
investigated using the FTIR analysis. Figure 4.4 shows FTIR spectra for Pure PEO,
PVdF-HFP and pure NaI salt.
Figure 4.4: FTIR spectra of pure PEO, PVdF-HFP and NaI.
Page 78
58
Table 4.3 represents the band assignments of the pure PEO, PVdF-HFP and NaI salt.
The interaction between NaI salt and the host polymers can be understood by
investigating any changes in these characteristic peaks in the combined FTIR spectra for
all the GPEs with different amounts of NaI content from 20 to 100 wt.%. The FTIR
spectra for GPEs with different NaI contents are represented in Figure 4.5.
Table 4.3: The FTIR absorption bands for the pure polymers and NaI salt that were used
in preparation of the gel polymer electrolytes.
Material Wavenumber
(cm-1)
Band assignments References
Pure PEO 2879
1466
1359, 1059
1341
1279, 1241
1144, 1092
841
CH band
CH2 scissoring
C-O-C stretching
Waging vibration
C-O band
C-O-C band
CH vibration
(Choi et al., 2015;
Farheen & Mathad,
2015; Na et al.,
2016)
Pure PVdF-HFP 3026, 2985
1400
975
872
840
796
761
Symmetric and antisymmetric
stretching vibration of CH2
C-F stretching vibration
C-F stretching
Combined CF2 and CC
symmetric stretching vibrations
Mixed mode of CH2 rocking
CF3 stretching vibration
CH2 rocking vibration
(Saikia & Kumar,
2005; Shalu et al.,
2015)
NaI 1605, 3414 The sodium iodide characteristic
peaks
(Abiddin &
Ahmad, 2015)
Page 79
59
Figure 4.5: FTIR spectra for PP-NaI-20, PP-NaI-40, PP-NaI-60, PP-NaI-80 and PP-NaI-
100 gel polymer electrolytes.
Page 80
60
The characteristic peak of NaI at 3414 cm−1 is shifted to 3559, 3567, 3559, 3560 and
3579 cm−1 in PP-NaI-20, PP-NaI-40, PP-NaI-60, PP-NaI-80 and PP-NaI-100,
respectively, after NaI is complexed with PEO and PVdF-HFP polymer blends. These
changes in the NaI characteristic band may be due to the interaction between Na+ cation
and the fluorine in the PVdF-HFP polymer when NaI dissolved in the GPE system and
dissociated into I− anion and Na+ cation. Moreover, the peak at 2879 cm−1 in PEO and
two peaks at 3026 and 2985 cm−1 in PVdF-HFP, after blending and complexation with
NaI salt are shifted to lower wavenumbers in PP-NaI-20, PP-NaI-40, PP-NaI-60, PP-NaI-
80 and PP-NaI-100 based on the values mentioned in Figure 4.5. The peak at 1554 cm−1
in the PP-NaI-20 spectrum is due to the interaction between the CH2 scissoring band of
PEO and C-F stretching vibration band of PVdF-HFP polymers which increase to 1556
cm−1 by increasing the concentration of NaI salt up to 100 wt.%. The wavenumber at 848
cm−1 is shifted to 849 cm-1 which is due to the interaction of NaI salt with the mixed mode
of CH2 rocking of PVdF-HFP and CH vibration of PEO polymers. The peak at 772 cm−1
in PP-NaI-20 spectrum is shifted to 773 cm−1 in PP-NaI-100 spectrum due to the
interaction between the CF3 stretching vibration of PVDF-HFP and NaI and the
wavenumber at 893 cm-1 in PP-NaI-20 spectrum decreased in intensity in PP-NaI-100
spectrum due to the interaction between combined CF2 and C-C symmetric stretching
vibrations of PVdF-HFP and addition of NaI. All the changes in the wavenumbers on
increasing the amount of NaI salt in the GPE system up to 100 wt.% prove the interaction
and complexation between the NaI salt and the other materials in the system.
4.2.4 X-ray Diffraction (XRD) studies
Figure 4.6 represents the XRD patterns for pure polymers (PEO and PVdF-HFP),
PEO/PVdF-HFP polymer blend and NaI salt. The XRD patterns for PEO shows two sharp
peaks at 2θ = 19o and 23o. The XRD patterns for PVdF-HFP shows semicrystalline nature
of this copolymer (Ataollahi et al., 2012) with the crystalline sharp peaks at 2θ = 20o, 29o
Page 81
61
and 38o. The XRD patterns for PEO/PVdF-HFP blend system show the amorphous
morphology which proves the complete blending of these polymers in the system and as
a result increasing amorphous phase by preventing the re-crystallization in the system.
The sharp peaks of NaI represented in Figure 4.6 shows the highly crystalline nature of
this salt (Rani et al., 2013).
Figure 4.7 shows the XRD pattern for PP-NaI-20, PP-NaI-40, PP-NaI-60, PP-NaI-80
and PP-NaI-100 GPEs. The crystalline peaks of the NaI salt does not appear in the XRD
results of the PP-NaI-20, PP-NaI-40, PP-NaI-60, PP-NaI-80 and PP-NaI-100 GPEs due
to the full dissolution of NaI into the GPE system. Based on Figure 4.7, the
semicrystalline peak in PEO/PVdF-HFP blend polymer system decreases in intensity in
presence of 20 wt.% NaI salt and it continues decreasing with the addition of NaI salt up
to 100 wt.% due to the complexation between NaI and the other materials in the system
(Rani et al., 2013).
Page 82
62
Figure 4.6: XRD patterns for NaI salt, PEO, PVdF-HFP and PEO/PVdF-HFP polymers.
Page 83
63
Figure 4.7: XRD patterns for PEO/PVdF-HFP and PP-NaI-20, PP-NaI-40, PP-NaI-60,
PP-NaI-80 and PP-NaI-100 gel polymer electrolytes.
Page 84
64
4.2.5 Photocurrent density vs voltage characteristics (J-V)
The J-V characteristic curves for all GPEs are represented in Figure 4.8 and the effect
of NaI salt on the efficiency of DSSCs fabricated using PP-NaI-20, PP-NaI-40, PP-NaI-
60, PP-NaI-80 and PP-NaI-100 GPEs were investigated.
Figure 4.8: J-V characteristic curves for the DCCSs fabricated using PP-NaI-20, PP-
NaI-40, PP-NaI-60, PP-NaI-80 and PP-NaI-100 gel polymer electrolytes.
Enhancement in the efficiency of the DSSCs with increasing the NaI content in the
GPE system can be observed in Figure 4.8. All the photovoltaic parameter values of the
fabricated DSSCs are represented in Table 4.4. The highest efficiency value of 5.67 %
was obtained for DSSC which was fabricated using PP-NaI-100 with 100 wt.% NaI salt
Page 85
65
content and highest ionic conductivity value. The performance of DSSCs developed due
to the contribution of NaI salt in I−/I3− redox couple generation in GPE system and also
by facilitation in the movement of ions in the system.
Table 4.4: The values of the Photovoltaic parameters for the fabricated DSSCs using PP-
NaI-20, PP-NaI-40, PP-NaI-60, PP-NaI-80 and PP-NaI-100 gel polymer electrolytes.
Electrolyte Jsc (mA cm−2) Voc (mV) FF (%) Efficiency, η (%)
PP-NaI-20 13.39 654 56.9 4.98
PP-NaI-40 12.03 665 62.7 5.02
PP-NaI-60 12.22 675 62.9 5.19
PP-NaI-80 14.45 600 63.2 5.48
PP-NaI-100 13.93 639 63.7 5.67
Page 86
66
4.3 PVdF-HFP:PEO:EC:PC:NaI:SiO2:I2 gel polymer electrolytes
Novel GPEs were prepared using poly(vinylidene fluoride-co-hexafluoro propylene)
copolymer (PVdF-HFP) and polyethylene oxide (PEO) in presence of fumed silica
nanofiller with the designated system of PVdF-HFP:PEO:EC:PC:NaI:SiO2:I2. GPEs were
examined using electrochemical impedance spectroscopy (EIS) and Temperature-
dependent ionic conductivity study to measure the ionic conductivity and understanding
the thermal ionic conductivity behavior of GPEs. GPEs were characterized for structural
studies using X-ray diffraction (XRD) and Fourier transform infrared (FTIR)
spectroscopy. GPEs were used to fabricate DSSCs and tested under 1 Sun irradiation.
4.3.1 Ionic conductivity studies in ambient temperature
The Cole-Cole plots for PP-NaI-Si-1, PP-NaI-Si-2, PP-NaI-Si-3, PP-NaI-Si-4, PP-
NaI-Si-5, PP-NaI-Si-6, PP-NaI-Si-7 and PP-NaI-Si-8 GPEs were obtained as shown in
Figure 4.9. The ionic conductivity values were calculated.
Page 87
67
Figure 4.9: Cole-Cole plots for (a) PP-NaI-Si-1, (b) PP-NaI-Si-2, (c) PP-NaI-Si-3, (d)
PP-NaI-Si-4, (e) PP-NaI-Si-5, (f) PP-NaI-Si-6, (g) PP-NaI-Si-7 and (h) PP-NaI-Si-8 gel
polymer electrolytes.
Page 88
68
PP-NaI-Si-7 GPE with [PVdF-HFP:PEO]:SiO2 composition of [34.8:52.2]:13 wt.%
has the lowest bulk resistance value of 14.1 Ω and accordingly the highest ionic
conductivity value of 8.84 mS cm−1. The ionic conductivity and bulk resistance values
are tabulated in Table 4.5. The ionic conductivity of the GPE system was increased in
presence of fumed silica (SiO2) filler compared with the GPE without fumed silica (SiO2)
(6.38 mS cm-1). Figure 4.10 shows the variation of ionic conductivity with fumed silica
(SiO2) content with error bars.
Table 4.5: Designation, ionic conductivity and bulk resistance values for gel electrolyte
system in presence of fumed silica (SiO2) nanofiller.
Designation
[PVdF-
HFP:PEO]:SiO2
Composition (wt.%)
Fumed silica
(SiO2) (mg) Rb (Ω) σ (mS cm−1)
PP-NaI-Si-0 [40.0:60.0]:0 0 19.5 6.38
PP-NaI-Si-1 [39.6:59.4]:1 7 17.8 6.99
PP-NaI-Si-2 [38.8:58.2]:3 21 17.2 7.24
PP-NaI-Si-3 [38.0:57.0]:5 35 17.1 7.28
PP-NaI-Si-4 [37.2:55.8]:7 49 16.9 7.37
PP-NaI-Si-5 [36.4:54.6]:9 63 16.8 7.42
PP-NaI-Si-6 [35.6:53.4]:11 77 16.4 7.59
PP-NaI-Si-7 [34.8:52.2]:13 91 14.1 8.84
PP-NaI-Si-8 [34.0:51.0]:15 105 16.7 7.46
Page 89
69
Presence of fumed silica nanoparticles in the GPEs, in addition to the improvements
in mechanical properties of the system improves the ionic conductivity of the GPEs by
decreasing the crystallinity of the host polymer and also by the Lewis acid-base
interactions between the silanol surface groups of fumed silica and the ions in the GPE
which enhances the mobility of I- and I3- ions by immobilizing the Na+ cations
(Sethupathy et al., 2013; Zhao et al., 2014). Based on EIS results, the presence of fumed
silica filler increases the ionic conductivity by decreasing the crystallinity of the system
and providing the micro-channels for ion transportation and at the same time creation of
conductive interfacial layer with polymers, resulting improves the ionic conductivity of
the system (Kumar et al., 2015). Polymers and fumed silica particles can absorb together
by different types of bindings such as hydrophobic interaction, hydrogen binding or
electrostatic binding. Here, mobility of ions were increased by hydrogen bonding between
chains of polymers and the hydroxyl groups on the surface of fumed silica (Zeyghami et
al., 2014). The hydrogen bindings between the hydroxyl groups of the fumed silica itself,
can increase dispersion of fumed silica particles in the GPE system and formation of three
dimensional and uniform gel structure for improvements in the mobility of ions (Sharmin
et al., 2012). Incorporation of fumed silica into the PVdF-HFP:PEO:EC:PC:NaI:SiO2:I2
GPE system increases the ionic conductivity by development of amorphous regions in the
GPE system. Interactions between the fumed silica and polymers increase the polymer
chains flexibility which helps to increase the ionic conductivity and formation of uniform
GPE structure (Abdollahi et al., 2015; Lee et al., 2012). Moreover the interfacial charged
layers on the surface of fumed silica nanoparticles overlap on each other and provide the
pathways for mobility of ions. These charged layers also increase dissociation of salt into
ions when the positive ions attract to the oxygen on the surface of fumed silica that can
increase the ionic conductivity value of the GPE effectively (Shuchi et al., 2016).
Page 90
70
Figure 4.10: Variation of ionic conductivity values for gel polymer electrolytes with
different fumed silica (SiO2) content.
4.3.2 Temperature-dependent ionic conductivity studies
The ionic conductivity for PP-NaI-Si-1, PP-NaI-Si-2, PP-NaI-Si-3, PP-NaI-Si-4, PP-
NaI-Si-5, PP-NaI-Si-6, PP-NaI-Si-7 and PP-NaI-Si-8 GPEs was measured in different
temperatures from 303 K to 373 K and Figure 4.11 exhibits the temperature-dependent
ionic conductivity behavior of the GPEs in presence of the fumed silica filler in PVdF-
HFP:PEO:EC:PC:NaI:SiO2:I2 system.
Page 91
71
Figure 4.11: Temperature-dependent ionic conductivity results for gel polymer
electrolytes with different amounts of fumed silica (SiO2).
The ionic conductivity values increase by increasing the temperature based on what
explained in session 4.1.2. Based on the regression values (R2 ~ 1), all the prepared GPEs
followed the Arrhenius behavior and the activation energies were calculated by using the
Arrhenius equation.
Page 92
72
Table 4.6: Designation, ionic conductivity and activation energy for gel polymer
electrolyte system in presence of fumed silica (SiO2) nanofiller.
Designation [PVdF-HFP:PEO]:SiO2 Composition (wt.%) Ea (meV)
PP-NaI-Si-0 [40.0:60.0]:0 98
PP-NaI-Si-1 [39.6:59.4]:1 96
PP-NaI-Si-2 [38.8:58.2]:3 95
PP-NaI-Si-3 [38.0:57.0]:5 94
PP-NaI-Si-4 [37.2:55.8]:7 92
PP-NaI-Si-5 [36.4:54.6]:9 90
PP-NaI-Si-6 [35.6:53.4]:11 91
PP-NaI-Si-7 [34.8:52.2]:13 85
PP-NaI-Si-8 [34.0:51.0]:15 88
Table 4.6 shows the variation of activation energy values, Ea with athe ionic
conductivity of the GPEs with different amounts of fumed silica content in PVdF-
HFP:PEO:EC:PC:NaI:SiO2:I2 system. Results show the addition of fumed silica filler up
to 13 wt.% into PVdF-HFP:PEO:EC:PC:NaI:SiO2:I2 system has enhanced the mobility
of ions and, as a result, it has improved the ionic conductivity and at the same time, the
activation energy value has been decreased by increasing the mobility of ions in the GPEs
which means the ions in the GPE need less energy to move (Yilmaz et al., 2011).
4.3.3 FTIR studies
Analyzing the changes in the IR absorption peaks in presence of fumed silica filler
helps to understand the complexation between the fumed silica and the other components
of the GPE system and the effect of fumed silica on the chemical bonds of the materials
in the system. Figure 4.12 shows the FTIR spectra in the wavenumber range from 4000
Page 93
73
to 650 cm-1 for the pure materials used in the preparation of the GPEs. Table 4.7 shows
the essential absorption peaks and the relative band assignments for the pure materials
used in preparation of GPEs.
Figure 4.12: FTIR spectra for the pure materials (PVdF-HFP, PEO, NaI and fumed silica
(SiO2)).
Page 94
74
Table 4.7: The essential absorption peaks and relative band assignments for the pure
materials (PEO, PVdF-HFP, NaI and fumed silica (SiO2)).
Materials Wavenumbers
(cm-1)
Band assignments References
Pure PEO 2879 CH band (Choi et al., 2015;
Farheen & Mathad,
2015; Na et al.,
2016)
1466 CH2 scissoring
1359, 1059 C-O-C stretching
1341 Waging vibration
1279, 1241 C-O band
1144, 1092 C-O-C band
841 CH vibration
Pure PVdF-
HFP
3026, 2985 Symmetric and antisymmetric
stretching vibration of CH2
(Saikia & Kumar,
2005; Shalu et al.,
2015)
1400 C-F stretching vibration
975 C-F stretching
872 Combined CF2 and CC
symmetricstretching vibrations
840 Mixed mode of CH2 rocking
796 CF3 stretching vibration
761 CH2 rocking vibration
NaI 1605,3414 The sodium iodide characteristic
peaks
(Abiddin &
Ahmad, 2015)
Fumed
silica
(SiO2)
3331 O-H stretching (Agnihotry et al.,
2004; Fu et al.,
2003; Sharma &
Sekhon, 2007)
1636 O-H deformation of the surface
hydroxyl group of fumed silica
1088, 806 Si-O vibration
Page 95
75
Figure 4.13 represents the Fourier transform infrared (FTIR) absorption peaks in the
wavenumber range between 4000 and 500 cm-1 for the PP-NaI-Si-1, PP-NaI-Si-2, PP-
NaI-Si-3, PP-NaI-Si-4, PP-NaI-Si-5, PP-NaI-Si-6, PP-NaI-Si-7 and PP-NaI-Si-8 GPEs in
system PVdF-HFP:PEO:EC:PC:NaI:SiO2:I2 with different concentrations of fumed silica
filler.
The wavenumbers for the IR absorption peaks of the PP-NaI-Si-0 (without fumed
silica (SiO2)) are represented in Table 4.7 and the relative band assignments for the peaks
show the changes in the wavenumbers due to the interaction between the materials in the
GPEs without filler compared with the characteristic peaks represented in Table 4.7 for
the pure materials. In presence of fumed silica into the GPE system the peak at 3579 cm-
1 changes to the lower wavenumbers due to the interaction between fumed silica and NaI
salt according to Figure 4.13. The peak at 1799 cm-1 appears in the GPE containing 13
wt.% fumed silica (PP-NaI-Si-7) FTIR spectra and due to the complexation between the
fumed silica and NaI the peak at 1770 cm-1 moves to higher wavenumber at 1775 cm-1
with lower intensity. All the peaks in the entire PP-NaI-Si-7 FTIR spectra show
decreasing in intensity, and at 1166, 1634, 716 and 715 cm-1 wavenumbers, all the peaks
show the higher wavenumbers and lower intensity peaks compared with the other GPEs
which were incorporated with 1, 3, 5, 7, 9, 11 and 15 wt.% of fumed silica. All of these
changes have confirmed the complexation between PVdF-HFP copolymer, PEO polymer,
NaI salt and fumed silica.
Page 96
76
Figure 4.13: FTIR spectra for PVdF-HFP:PEO:EC:PC:NaI:SiO2:I2 system.
Page 97
77
4.3.4 X-ray Diffraction (XRD) studies
The XRD patterns for fumed silica (SiO2), PEO, PVdF-HFP, PVdF-HFP:PEO and NaI
are represented in Figure 4.14. The XRD patterns for PVdF-HFP show the semicrystalline
morphology of the PVdF-HFP copolymer with sharp peaks at 2θ = 18o (100), 19o (020),
26o (110), 29o (021) and 38o (211) are corresponding for crystalline peaks of PVdF
(Kumar & Dek, 2010). Two sharp peaks at 2θ = 19o and 23o are represented in the XRD
results for PEO. The XRD patterns for PVdF-HFP:PEO blend in Figure 4.14 shows low
intensity with slightly broadening due to the interaction between PEO and PVdF-HFP
when these two polymers were blended homogenously and the crystallization in the
system was reduced. Moreover, NaI salt shows high crystalline morphology and fumed
silica represents amorphous characteristic based on the XRD results in Figure 4.14.
Furthermore, the XRD patterns of PP-NaI-Si-4, PP-NaI-Si-5, PP-NaI-Si-6, PP-NaI-Si-
7 and PP-NaI-Si-8 GPEs with different amounts of fumed silica filler are represented in
Figure 4.15. All the GPE show the amorphous characteristic due to the interaction
between the fumed silica and the other materials in the system and specially interaction
with the polymers caused by making disordered polymer chains in presence of fumed
silica filler and also well dispersion of fumed silica filler in the system (Prabakaran et al.,
2015b).
Page 98
78
Figure 4.14: XRD patterns for pure materials (PVdF-HFP, PEO, NaI and fumed silica
(SiO2)) used in preparation of gel polymer electrolytes in PVdF-HFP:PEO: EC:PC: NaI:
SiO2:I2 system.
Page 99
79
Figure 4.15: XRD patterns for PP-NaI-Si-4, PP-NaI-Si-5, PP-NaI-Si-6, PP-NaI-Si-7 and
PP- NaI-Si-8 gel polymer electrolytes.
4.3.5 Photocurrent density vs voltage characteristics (J-V)
DSSCs were fabricated by sandwiching the GPEs with and without fumed silica
between the working and counter electrodes to investigate the effects of the fumed silica
on the efficiency of the DSSC. The photovoltaic characteristics of DSSCs using PP-NaI-
Si-1, PP-NaI-Si-2, PP-NaI-Si-3, PP-NaI-Si-4, PP-NaI-Si-5, PP-NaI-Si-6, PP-NaI-Si-7
and PP-NaI-Si-8 GPEs were investigated. The fabricated solar cells were analyzed under
the solar simulator with incident light power of 1000 (W cm-2). Table 4.8 shows the DSSC
parameters.
Page 100
80
Table 4.8: DSSC parameters using the gel polymer electrolytes in PVdF-HFP:PEO:EC
:PC:NaI:SiO2:I2 system and with different fumed silica (SiO2) content.
Electrolytes Jsc (mA cm−2) Voc (mV) FF (%) Efficiency, η (%)
PP-NaI-Si-0 13.93 639 63.7 5.67
PP-NaI-Si-1 17.23 604 62.0 6.45
PP-NaI-Si-3 18.93 639 64.2 7.76
PP-NaI-Si-4 22.26 600 59.4 7.92
PP-NaI-Si-5 22.29 574 62.6 8.01
PP-NaI-Si-6 23.22 584 63.0 8.54
PP-NaI-Si-7 27.31 564 61.3 9.44
PP-NaI-Si-8 18.94 584 59.1 6.53
The J-V results indicate that the presence of fumed silica nanofiller in the GPE
systems, namely PP-NaI-Si-1, PP-NaI-Si-3, PP-NaI-Si-4, PP-NaI-Si-5, PP-NaI-Si-6, PP-
NaI-Si-7, PP-NaI-Si-8, increases the short circuit current density Jsc of the fabricated
DSSCs. Incorporation of 13 wt.% fumed silica filler (PP-NaI-Si-8) led to the highest
conversion efficiency of 9.44%. Figure 4.16 exhibits the J-V characteristics of DSSCs
using PVdF-HFP:PEO:EC:PC:NaI:SiO2:I2 GPE system.
Page 101
81
Figure 4.16: J-V results for the DSSCs using gel polymer electrolytes without fumed
silica (PP-NaI-Si-0) and with different amounts of fumed silica (SiO2).
The J-V results reveal that Jsc is increased with the addition of fumed silica to the GPE
system that enhances transportation of ions. The Jsc and efficiency values follow the
conductivity trend however Voc and FF values does not change much and are in the range
564 to 649 mV and 0.591 to 0.642, respectively. Presence of fumed silica in the GPE
system increases the ionic conductivity and efficiency of GPEs, which can be due to
increasing the mobility of ions in the GPEs (Kim et al., 2004).
Page 102
82
4.4 PVdF-HFP:PEO:EC:PC:NaI:ZnO:I2 gel polymer electrolytes
GPEs were prepared by blending poly (vinylidene fluoride-co-hexafluoro propylene)
copolymer (PVdF-HFP) and polyethylene oxide (PEO) polymers and incorporation of
ZnO inorganic nanofiller (PVdF-HFP:PEO:EC:PC:NaI:I2:ZnO). Electrochemical
impedance spectroscopy (EIS) and temperature-dependent ionic conductivity behavior of
GPEs analyzed. Structural studies of GPEs was carried out by using X-ray diffraction
(XRD) and Fourier transform infrared (FTIR) spectroscopy analysis. GPEs are used to
fabricate DSSCs. Enhancements in the solar light to electricity conversion efficiency (ƞ)
of DSSCs were observed in the presence of ZnO inorganic nanofiller.
4.4.1 Ionic conductivity studies in ambient temperature
The bulk resistance values for GPEs in PEO/PVdF-HFP:NaI:I2:ZnO system were
investigated by plotting the Cole-Cole plots for PP-NaI-ZnO-0, PP-NaI-ZnO-1, PP-NaI-
ZnO-2, PP-NaI-ZnO-3 and PP-NaI-ZnO-4 GPEs and the ionic conductivity values were
calculated. Figure 4.17 shows the Cole-Cole plots for PP-NaI-ZnO-0, PP-NaI-ZnO-1, PP-
NaI-ZnO-2, PP-NaI-ZnO-3 and PP-NaI-ZnO-4 GPEs and based on these plots, the trend
for variation of bulk resistance values (Rb) in presence of ZnO inorganic nanofiller in
PEO/PVdF-HFP:NaI:ZnO:I2 system can be observed.
Page 103
83
Figure 4.17: Cole-Cole plots for (a) PP-NaI-ZnO-0, (b) PP-NaI-ZnO-1, (c) PP-NaI-ZnO-
2, (d) PP-NaI- ZnO-3 and (e) PP-NaI-ZnO-4, gel polymer electrolytes.
Page 104
84
The ionic conductivity value is inversely proportional to the bulk resistance value.
Table 4.9 shows the designation for the GPEs and the relevant ionic conductivity values.
Figure 4.18 shows the variation of ionic conductivity values of GPEs with ZnO
nanoparticles content.
Table 4.9: Designation, ionic conductivity and bulk resistance values for gel polymer
electrolytes in PVdF-HFP:PEO:EC:PC:NaI:ZnO:I2 with different amounts of ZnO
nanoparticle.
Designation [PVdF-HFP:PEO]:ZnO
Composition (wt.%)
Bulk resistance,
Rb (Ω) σ (mS cm-1)
PP-NaI-ZnO-0 [40.0:60.0]:0 19.5 6.38
PP-NaI-ZnO-1 [39.6:59.4]:1 18.0 6.92
PP-NaI-ZnO-2 [39.2:58.8]:2 17.1 7.30
PP-NaI-ZnO-3 [38.8:58.2]:3 14.9 8.36
PP-NaI-ZnO-4 [38.4:57.6]:4 18.5 6.73
Incorporation of ZnO nanoparticles into the GPE system significantly enhanced the
ionic conductivity up to 8.36 mS cm-1 for PP-NaI-ZnO-3 compared to the polymer
electrolyte without ZnO nanoparticle (6.38 mS cm-1). It is inferred that ZnO nanoparticles
provide three dimensional channels for more ion transportations via Grotthuss
mechanism, by increasing the amorphous phase of the GPE system (Ludueña et al., 2011).
The ionic conductivity values for each GPE are listed in Table 4.9. In addition to the
improvements in ionic conductivity and the mechanical flow of the GPEs, contribution
of ZnO nanoparticles enhanced the electron recombination in the electrolyte by inducing
electrons from conduction band of TiO2 layer on photo-anode to the oxidation/reduction
potential of iodide/triiodide (Chang et al., 2016).
Page 105
85
Figure 4.18: Ionic conductivity values for each gel polymer electrolyte in PEO/PVdF-
HFP:NaI:I2:ZnO system with different ZnO content.
4.4.2 Temperature-dependent ionic conductivity studies
The ionic conductivity of PP-NaI-ZnO-0, PP-NaI-ZnO-1, PP-NaI-ZnO-2, PP-NaI-
ZnO-3 and PP-NaI-ZnO-4 GPEs at different temperatures from 30 to 100o C were
obtained and the temperature-dependent ionic conductivity of GPEs were investigated.
The ionic conductivity of GPEs increased by increasing temperature. Figure 4.19
represents the temperature-dependence ionic conductivity behavior of all GPEs in
PEO/PVdF-HFP:NaI:ZnO:I2 system and with incorporation of different amounts of ZnO
nanoparticles.
Page 106
86
Figure 4.19: Temperature-dependence ionic conductivity for gel polymer electrolytes
in PVdF-HFP:PEO:EC:PC:NaI:ZnO:I2 system with different ZnO content.
According to the unity of regression values (R2~1), it is concluded that GPEs in
PEO/PVdF-HFP:NaI:ZnO:I2 system follows Arrhenius thermal behaviour hence the
activation energies of GPEs were calculated by using the Arrhenius equation. Activation
energy values for GPEs with different ZnO nanoparticle content are listed in Table 4.10.
PP-NaI-ZnO-3 GPE with highest ionic conductivity value has the lowest activation
energy value of 95 meV compared to other GPEs in the PVdF-
HFP:PEO:EC:PC:NaI:ZnO;I2 system.
Page 107
87
Table 4.10: Designation, ionic conductivity and activation energy values for gel polymer
electrolytes in PVdF-HFP:PEO:EC:PC:NaI:I2:ZnO with different amounts of ZnO
nanoparticle.
Designation [PVdF-HFP:PEO]:ZnO Composition
(wt.%) Ea (meV)
PP-NaI-ZnO-0 [40.0:60.0]:0 98
PP-NaI-ZnO-1 [39.6:59.4]:1 97
PP-NaI-ZnO-2 [39.2:58.8]:2 96
PP-NaI-ZnO-3 [38.8:58.2]:3 95
PP-NaI-ZnO-4 [38.4:57.6]:4 97
4.4.3 FTIR studies
Figure 4.20 shows the FTIR spectra for PVdF-HFP and PEO polymers, NaI salt and
ZnO nanoparticles in the range from 4000 to 450 cm-1 and their pertinent band
assignments were listed in Table 4.11.
GPEs were analyzed by infrared spectroscopy to investigate the effect of ZnO
nanoparticles on the structural properties of GPEs and chemical bonds of materials in the
system. Figure 4.21 shows the FTIR peaks for all GPEs with different amounts of ZnO
nanoparticles in the PVdF-HFP:PEO:EC:PC:NaI:ZnO:I2 system in the range from 4000
to 450 cm-1. The absorption peaks of GPE without ZnO nanoparticles (PP-NaI-ZnO-0)
are investigated in compare with the characteristic peaks of pure materials represented in
Table 4.11.
Page 108
88
Figure 4.20: FTIR spectra for polymers (PVdF-HFP and PEO), salt (NaI) and ZnO
nanoparticles that were used in preparation of gel polymer electrolytes.
Page 109
89
Table 4.11: FTIR spectra for PVdF-HFP and PEO polymers, NaI salt and ZnO
nanoparticles.
Materials Wavenumbers
(cm-1)
Band assignments References
PVdF-HFP 761
796
840
872
975,1400
3026,2985
CH2 rocking vibration
CF3 stretching vibration
Mix mode of CH2 rocking
Combined CF2 and C-C
symmetric stretching
vibrations
C-F stretching vibration
Symmetric and antisymmetric
stretching vibration of CH2
(Saikia & Kumar,
2005; Shalu et al.,
2015)
PEO 841
1144,1092
1279,1241
1341
1359,1059
1466
2879
C-H vibration
C-O-C band
C-O band
Waging vibration
C-O-C stretching
CH2 scissoring
C-H band
(Choi et al., 2015;
Farheen & Mathad,
2015; Na et al.,
2016)
NaI 1605 and
3414
Characteristic absorption
peaks of sodium iodide
(Zainal Abiddin &
Ahmad, 2015)
ZnO 488
1392,1536
1545,3389
Zinc oxide characteristic
peaks
Symmetric and antisymmetric
stretching of C=O for zinc
acetate
bending and stretching modes
of O-H
(Ambrožič et al.,
2010; Martinez et
al.)
Page 110
90
Figure 4.21: FTIR spectra for all gel polymer electrolytes prepared in PVdF-HFP:PEO:
EC:PC:NaI:I2:ZnO system.
According to the FTIR spectra for PP-NaI-ZnO-3, the broad absorption band at 3579
cm-1 shifts to 3565 cm-1 with lower intensity due to complexation between ZnO
nanoparticles and NaI. The C-H band at 2929 cm-1 moves to higher wavenumber at 2931
cm-1 due to the interaction between ZnO nanoparticles and PEO along with symmetric
and asymmetric stretching vibration of CH2 in PVdF-HFP. The new peak at 1710 cm-1
appears in FTIR spectra of PP-NaI-ZnO-3, by incorporation of 3 wt.% ZnO nanoparticles
and it corresponds with complexation between ZnO nanoparticles, NaI and host
Page 111
91
polymers. For all GPEs the peaks at 2362 and 1967 cm-1 moves to lower wavenumbers
due to the incorporation of ZnO nanoparticles in to the PVdF-
HFP:PEO:EC:PC:NaI:ZnO:I2 system. The band at 1635 cm-1 responsible for C=O
stretching, shifts to 1636 cm-1 for PP-NaI-ZnO-3 and the peak intensity decreases due to
the interaction between C=O stretching of zinc acetate and C=O stretching of ethylene
carbonate and propylene carbonate (Indran et al., 2016). The peak intensity for the bands
at 1389 and 1354 cm-1 decrease due to the interaction between symmetric and asymmetric
C=O stretching of zinc acetate and C-O band of PEO respectively. The band at 1221 cm-
1 attributes to C-O-C stretching of PEO, decrease in peak intensity in presence of ZnO
nanoparticles in the PVdF-HFP:PEO:EC:PC:NaI:ZnO:I2 system. The bands at 773 and
715 cm-1 shifts to higher intensity due to the interaction between ZnO nanoparticles and
CF3 stretching and CH2 rocking vibration of PVdF-HFP respectively.
4.4.4 X-ray Diffraction (XRD) studies
The X-ray diffractogram for pure PVdF-HFP, PEO, NaI and ZnO and also PVdF-
HFP:PEO film has been shown in Figure 4.22. The peaks and their pertaining planes
indicated in the XRD patterns of PVdF-HFP at 2θ= 18o (100), 19o (020), 26o (110), 29o
(021) and 38o (211) are corresponding to α and γ-phase of crystalline PVdF in this co-
polymer respectively and the XRD pattern is indicative of the semicrystalline nature of
PVdF-HFP co-polymer (Hoque et al., 2016; Ulaganathan et al., 2012). Two intense
diffraction peaks at 2θ= 19o and 23o observed in the XRD pattern of pure PEO (Poonam,
2012). The XRD pattern for PVdF-HFP:PEO shows one low intensity and broaden peak
which corresponds for semicrystalline morphology due to the interaction between PVdF-
HFP and PEO that have been enhanced the amorphous regions in the PVdF-HFP:PEO
system. The diffraction peak at 20.2o for PVdF-HFP:PEO XRD pattern shows the overlap
of the peak for (200) plane for β-phase of PVdF in PVdF-HFP co-polymer and the peak
at 19.2o for PEO when non-polar and crystalline α-phase turn to the electro-active β-phase
Page 112
92
due to the interaction between PVdF-HFP and PEO polymers by blending (Hoque et al.,
2016). The XRD pattern for NaI with several diffraction peaks ascertains high crystalline
nature of this salt. ZnO X-ray diffractogram of ZnO shows crystalline morphology and
high intensity diffraction peaks with pertaining planes at 2θ= 31.9o (100), 34.6 o (002),
36.4 o (101), 47.7 o (102), 56.7 o (110), 63 o (103), 66.5 o (200), 68.1 o (112), 69.2 o (201)
(Mallakpour & Zeraatpisheh, 2012). Figure 4.23 shows the X-ray diffractogram for PP-
NaI-ZnO-0, PP-NaI-ZnO-1, PP-NaI-ZnO-2, PP-NaI-ZnO-3 and PP-NaI-ZnO-4.
The XRD pattern for all the GPEs ascertains the semicrystalline morphology. The
broad diffraction peak in the X-ray diffractogram of PP-NaI-ZnO-1, PP-NaI-ZnO-2 and
PP-NaI-ZnO-3 nanocomposite polymer electrolytes slightly decrease in intensity due to
the disordered polymer chains produced by ZnO nanoparticles in the system that
enhanced amorphous phase of the system.
Page 113
93
Figure 4.22: XRD patterns for polymers (PVdF-HFP and PEO), salt (NaI) and ZnO
nanoparticles that were used in preparation of gel polymer electrolytes.
Page 114
94
Figure 4.23: XRD patterns for nanocomposite polymer electrolytes in PVdF-HFP:PEO:
EC:PC:NaI:I2:ZnO system with different ZnO content.
4.4.5 Photocurrent density vs voltage characteristics (J-V)
GPEs with different amounts of ZnO nanoparticles were sandwiched between photo-
anode and counter electrode for fabrication of DSSCs. Solar light to electricity conversion
efficiency of DSSCs were calculated on incorporation of different amounts of ZnO
nanoparticles into the PVdF-HFP:PEO:EC:PC:NaI:ZnO:I2 system. Simulated incident
light power of 1000 (W cm-2) were used to analyze the fabricated DSSCs. DSSC
parameters for DSSCs fabricated using PP-NaI-ZnO-0, PP-NaI-ZnO-1, PP-NaI-ZnO-2,
PP-NaI-ZnO-3 and PP-NaI-ZnO-4 GPEs are listed in Table 4.12.
Page 115
95
Table 4.12: DSSC parameters for all gel polymer electrolytes (PVdF-HFP:PEO:EC:
PC:NaI:ZnO:I2).
Gel polymer electrolytes Jsc (mA cm-2) Voc (mV) FF (%) Efficiency, ƞ (%)
PP-NaI-ZnO-0 13.93 639 63.7 5.67
PP-NaI-ZnO-1 21.20 560 61.0 7.00
PP-NaI-ZnO-2 22.53 560 60.1 7.68
PP-NaI-ZnO-3 24.54 620 60.2 9.08
PP-NaI-ZnO-4 23.06 600 59.0 8.13
Based on the results shown in Table 4.12, incorporation of ZnO nanoparticles into the
PVdF-HFP:PEO:EC:PC:NaI:ZnO:I2 system has increased the short-circuit current
density (Jsc) values. The Jsc values are enhanced due to the improvement of ion
transportation through transmittal channels created in presence of ZnO nanoparticles in
the GPEs. Voc value slightly decrease for GPE with incorporation of 1 wt.% ZnO (PP-
NaI-ZnO-1) due to the increase in electron recombination rate in presence of ZnO
nanoparticles in the GPE system as mentioned earlier. Voc values increased for PP-NaI-
ZnO-2 and PP-NaI-ZnO-3 and by increasing the ionic conductivity and it decreased for
PP-NaI-ZnO-4. The filling factor values decrease by increasing ZnO nanoparticles
content in the GPE system. The highest sunlight to electricity conversion efficiency value
of 9.08 % were obtained for DSSC fabricated by using PP-NaI-ZnO-3 and by
incorporation of 3 wt.% ZnO nanoparticles. Unlike Voc and FF, Jsc and efficiency values
follow the same trend as ionic conductivity. Figure 4.24 represents the combined J-V
characteristic curves for DSSCs fabricated by using GPEs with incorporation of different
amounts of ZnO nanoparticles. Incorporation of ZnO nanoparticles in the GPE system
Page 116
96
increased the Jsc and energy conversion efficiency values, as a result of enhancement in
the mobility of ions in the system (Vijayakumar et al., 2015).
Figure 4.24: Photocurrent density (J) versus cell potential (V) for DSSCs fabricate by
using polymer electrolyte without ZnO nanoparticles and gel polymer electrolytes with
different amounts of ZnO nanoparticles.
4.5 Summary
The results for three GPE systems of PVdF-HFP:PEO:EC:PC:NaI:I2, PVdF-
HFP:PEO:EC:PC:NaI:SiO2:I2 and PVdF-HFP:PEO:EC:PC:NaI:ZnO:I2 were elaborated
in this chapter based on the electrochemical impedance spectroscopy (EIS), temperature-
dependence ionic conductivity, X-ray diffraction (XRD) and FTIR studies. Results for
the photovoltaic performance of DSSCs were also elaborated based on the GPEs in each
system. PP-NaI-100, PP-NaI-Si-7 and PP-NaI-ZnO-3 GPEs showed the highest ionic
Page 117
97
conductivity values of 6.38, 8.84 and 8.36 mS cm−1 in system one, two and three
respectively. DSSCs based on NaI-100, PP-NaI-Si-7 and PP-NaI-ZnO-3 GPEs also
represented the highest energy conversion efficiency values of 5.67, 9.44 and 9.08 %.
Page 118
98
CHAPTER 5: SUMMARY OF THE RESEARCH
In the first system (PVdF-HFP:PEO:EC:PC:NaI:I2), the PEO/PVdF-HFP blend based
GPEs with different amounts of NaI salt from 20 to 100 wt.% with respect to PEO:PVdF-
HFP were prepared and these were employed in fabrication of DSSCs. Increasing the
ionic conductivity of the GPEs by increasing the NaI content up to 100 wt.% with respect
to PEO:PVdF-HFP, were observed and the highest ionic conductivity of 6.38 mS cm−1
was achieved with PP-NaI-100 after incorporation of 100 wt.% of NaI salt. The
temperature-dependent ionic conductivity of all the GPEs was proved the Arrhenius
behavior and the activation energy value decreased up to 98 meV for PP-NaI-100. The
XRD pattern for all the GPEs showed the semi-crystalline nature of the GPEs with the
addition of salt. Increasing the amount of NaI salt in the system proved the complexation
between PEO/PVdF-HFP polymer blend and NaI salt in the system. The absorption peaks
in the FTIR spectra shows the shifting in the wavenumbers by increasing the NaI amount
up to 100 wt.% NaI salt which proved the interaction between NaI salt and PEO/PVdF-
HFP polymer blend in the system. The performance of all the fabricated DSSCs using
PP-NaI-20, PP-NaI-40, PP-NaI-60, PP-NaI-80 and PP-NaI-100 GPEs were analyzed
under the Sun simulator with 100 mW cm−2. From the J-V results, the efficiencies were
calculated. The DSSC fabricated with PP-NaI-100 GPE showed the highest efficiency
value of 5.67 %.
In the second system (PVdF-HFP:PEO:EC:PC:NaI:SiO2:I2), the novel PVdF-
HFP:PEO based GPEs were prepared and the fumed silica was incorporated into GPE
system. The effects of fumed silica nanofiller into the system were studied by
characterization of samples using EIS, XRD and FTIR spectroscopy. Fumed silica
increased the ionic conductivity of the GPE as a result of enhanced ionic transportation
Page 119
99
and increased the amorphous phase of the system based on the XRD results. Furthermore,
interaction between Na+ cations and the silanol surphase groups of fumed silica increase
the mobility of I- and I3- ions and increased the ionic conductivity of GPE. The highest
ionic conductivity of 8.84 mS cm-1 was achieved after incorporation of 13 wt.% of fumed
silica (PP-NaI-Si-7). The PP-NaI-Si-7 shows the lowest activation energy value (85
meV). Temperature-dependent ionic conductivity studies showed that all GPEs followed
the Arrhenius thermal activated model. FTIR and XRD studies confirmed the interaction
and complexation between the PEO, PVDF-HFP:PEO polymers, NaI and fumed silica.
The highest energy conversion efficiency of 9.44% was achieved for the highest
conducting GPE with 13 wt.% of fumed silica content (PP-NaI-Si-7). This high energy
conversion value is achieved as a result of high ionic conductivity and presence of good
contact with the photo-electrode (Kim et al., 2004). Based on the J-V and efficiency (ƞ)
trend, increasing in mobility of ions in presence of fumed silica filler that improved the
photovoltaic performance of fabricated DSSC.
In the third system (PVdF-HFP:PEO:EC:PC:NaI:ZnO:I2), GPEs incorporated with
different amounts of ZnO nanoparticles were prepared and intended DSSCs were
fabricated using these GPEs. GPEs were characterized by using electrochemical
impedance spectroscopy (EIS), Fourier transform infrared spectroscopy (FTIR) and X-
ray diffraction (XRD) and effect of ZnO nanoparticles into the GPE system were
investigated. The ionic conductivity of GPEs increased by increasing mobility of ions by
Grothuss mechanism and ion transportations through transmittal channels created by ZnO
nanoparticles in the GPE system. The highest ionic conductivity value (8.36 mS cm-1)
obtained for PP-NaI-ZnO-3 GPE. X-ray diffractogram has shown the enhancement in the
amorphous phase of GPEs in presence of 1, 2 and 3 wt. % ZnO nanoparticles in the PVdF-
HFP:PEO:EC:PC:NaI:ZnO:I2 system. All nanocomposite polymer electrolytes proven to
follow Arrhenius thermal model based on the temperature-dependent ionic conductivity
Page 120
100
results. The constructive interaction between ZnO nanoparticles, NaI, PVdF-HFP and
PEO are confirmed by XRD and FTIR studies. Energy conversion efficiency and
photovoltaic performance of DSSCs enhanced as the mobility of ions increased in the
GPEs in presence of ZnO nanoparticles. The highest sunlight to energy conversion
efficiency of 9.08 % was achieved for the highest conducting GPE and by incorporation
of 3 wt. % ZnO nanoparticles content.
In both of the second and third GPE systems, incorporation of fumed silica and zinc
oxide nanoparticles as filler, increased the ionic conductivity values. In the first system
the highest ionic conductivity value of 8.84 mS cm-1 was achieved by incorporation of 13
wt.% of fumed silica in the PVdF-HFP:PEO:EC:PC:NaI:SiO2:I2 GPE system which is
higher than the highest ionic conductivity value of 8.36 mS cm-1 that was achieved by
incorporation of 3 wt. % ZnO in the (PVdF-HFP:PEO:EC:PC:NaI:ZnO:I2) GPE system.
Higher energy conversion efficiency value (9.44%) was achieved in the second GPE
system in compare to the highest energy conversion efficiency value (9.08 %) that was
achieved in the third system. Higher ionic conductivity of PP-NaI-Si-7 GPE, produced
higher current density value and also higher energy conversion efficiency compared to
the related results for PP-NaI-ZnO-3 GPE in the third system. Well dispersion of
nanoparticles in the electrolyte system, size of nanoparticles and interfacial layers are
some of the main factors which can increase the ionic conductivity of GPE (Shuchi et al.,
2016). Fumed silica particles has tiny size of 7 nm in compare to the zinc oxide (~100
nm). The hydroxyl groups on the surface of the fumed silica produced the amorphous and
uniform GPE system with high ionic conductivity value due to the interaction of these
particles with polymer chains and their contribution in dissociation of salt in the GPE.
These reasons may be responsible for higher ionic conductivity and energy conversion
efficiency values obtained in the second system compared to the related results in the
third system and by incorporation of zinc oxide nanoparticles.
Page 121
101
CHAPTER 6: CONCLUSIONS AND FUTURE WORKS
6.1 Conclusions
In this research three GPE systems were developed for application in fabrication of
DSSCs with high performance. First GPE system were optimized based on PVdF-
HFP:PEO polymers and sodium iodide (NaI) salt and the highest ionic conductivity value
of 6.38 mS cm−1 were achieved for the PP-NaI-100 GPE after the addition of 100 wt.%
of NaI salt with respect to weight of PEO/PVdF-HFP polymers. PVdF-
HFP:PEO:EC:PC:NaI:SiO2:I2 and PVdF-HFP:PEO:EC:PC:NaI:ZnO:I2 GPE systems
were studied as second and third systems in this research, respectively. For second and
third GPE systems fumed silica (SiO2) and zinc oxide (ZnO) were added respectively to
the optimized GPE in first system as filler to enhance the ionic conductivity of prepared
GPE. The highest ionic conductivity values of 8.84 mS cm−1 and 8.36 mS cm-1 were
obtained for PP-NaI-Si-7 and PP-NaI-ZnO-3 GPEs in PVdF-
HFP:PEO:EC:PC:NaI:SiO2:I2 and PVdF-HFP:PEO:EC:PC:NaI:ZnO:I2 GPE systems
respectively. DSSCs were fabricated using GPEs prepared in system one, two and three
and characterized under Sun simulator. The highest energy conversion efficiency values
for DSSCs fabricated using GPEs in PVdF-HFP:PEO:EC:PC:NaI:I2, PVdF-
HFP:PEO:EC:PC:NaI:SiO2:I2 and PVdF-HFP:PEO:EC:PC:NaI:ZnO:I2 systems using
PP-NaI-100, PP-NaI-Si-7 and PP-NaI-ZnO-3 GPEs were 5.67, 9.44 and 9.08 %
respectively.
6.2 Future works
Optimization of each components of DSSCs (photo/anode/electrolyte/counter
electrode) can enhance the performance of this technology. If the focus of the research is
on the fabrication of DSSCs based on GPEs then increasing the ionic conductivity of
Page 122
102
GPEs can help to enhance the performance of DSSCs by improving the short circuit
current density (Jsc). There are many methods in order to increase the mobility of ions in
the GPEs such as:
Applying different types of amorphous polymers as host polymer for GPE
preparation.
Blending different typed of polymers to increase the amorphous phase of
GPEs for enhancing the mobility of ions as well as increasing the stability of
the GPE system which makes them suitable for application in DSSCs.
Applying different types of iodide salts with different cation sizes as well as
using two types of iodide salts (binary salt system) to increase the mobility of
iodide/triiodide ions in the GPE system.
Applying ionic liquids as a source of ions to enhance the ionic conductivity of
GPEs.
Applying different types of nanoparticles such as carbon nanotubes (CNTs)
and graphene oxides (GO) as filler into the GPE system to increase the
stability and ionic conductivity of GPEs.
Page 123
103
REFERENCES
Abdollahi, M., Rouhani, M., Salarizadeh, P., & Rekabdar, F. (2015). Using fumed silica
nanoparticles modified with hydrophilic sulfonated polymers in the proton
exchange nanocomposite membranes. Polymer Science Series A, 57(5), 667-674.
Abiddin, J. F. B. Z., & Ahmad, A. H. (2015). Conductivity study and fourier transform
infrared (FTIR) characterization of methyl cellulose solid polymer electrolyte
with sodium iodide conducting ion. AIP Conference Proceedings, 1675, 020026.
Agnihotry, S. A., Ahmad, S., Gupta, D., & Ahmad, S. (2004). Composite gel electrolytes
based on poly(methylmethacrylate) and hydrophilic fumed silica. Electrochimica
Acta, 49(14), 2343-2349.
Ahn, S. H., Koh, J. H., Seo, J. A., & Kim, J. H. (2010). Structure control of organized
mesoporous TiO2 films templated by graft copolymers for dye-sensitized solar
cells. Chemical Communications, 46(11), 1935-1937.
Ambrožič, G., Djerdj, I., Škapin, S. D., Žigon, M., & Orel, Z. C. (2010). The double role
of p-toluenesulfonic acid in the formation of ZnO particles with different
morphologies. CrystEngComm, 12(6), 1862.
Andrade, J. R., Raphael, E., & Pawlicka, A. (2009). Plasticized pectin-based gel
electrolytes. Electrochimica Acta, 54(26), 6479-6483.
Angell, C., & Smith, D. (1982). Test of the entropy basis of the Vogel-Tammann-Fulcher
equation. Dielectric relaxation of polyalcohols near Tg. The Journal of Physical
Chemistry, 86(19), 3845-3852.
Arjunan, T. V., & Senthil, T. S. (2013). Review: Dye sensitised solar cells. Materials
Technology, 28(1-2), 9-14.
Ataollahi, N., Ahmad, A., Hamzah, H., Rahman, M. Y. A., & Mohamed, N. (2012).
Preparation and characterization of PVDF-HFP/MG49 based polymer blend
electrolyte. International Journal of Electrochemical Science, 7, 6693-6703.
Bates, J. B. (1976). Fourier transform infrared spectroscopy. [Basic principles and current
applications]. Science; (United States), 191(4222), 31-37.
Bella, F., Pugliese, D., Nair, J. R., Sacco, A., Bianco, S., Gerbaldi, C., . . . Bongiovanni,
R. (2013). A UV-crosslinked polymer electrolyte membrane for quasi-solid dye-
sensitized solar cells with excellent efficiency and durability. Physical Chemistry
Chemical Physics, 15(11), 3706-3711.
Benedetti, J. E., Freitas, F. S., Fernandes, F. C., Gonçalves, A. S., Magalhães, A., &
Nogueira, A. F. (2014). Investigation of the structural properties of poly(ethylene
oxide) copolymer as gel polymer electrolyte and durability test in dye-sensitized
solar cells. Ionics, 21(6), 1771-1780.
Page 124
104
Bergin, S. M., Chen, Y. H., Rathmell, A. R., Charbonneau, P., Li, Z. Y., & Wiley, B. J.
(2012). The effect of nanowire length and diameter on the properties of
transparent, conducting nanowire films. Nanoscale, 4(6), 1996-2004.
Bu, C., Tai, Q., Liu, Y., Guo, S., & Zhao, X. (2013). A transparent and stable polypyrrole
counter electrode for dye-sensitized solar cell. Journal of Power Sources, 221, 78-
83.
Chang, W.-C., Sie, S.-Y., Yu, W.-C., Lin, L.-Y., & Yu, Y.-J. (2016). Preparation of nano-
composite gel electrolytes with metal oxide additives for dye-sensitized solar
cells. Electrochimica Acta, 212, 333-342.
Chen, J., Li, K., Luo, Y., Guo, X., Li, D., Deng, M., . . . Meng, Q. (2009). A flexible
carbon counter electrode for dye-sensitized solar cells. Carbon, 47(11), 2704-
2708.
Choi, B.-R., Park, S.-J., & Kim, S. (2015). Preparation of polyethylene oxide composite
electrolytes containing imidazolium cation salt-attached titanium oxides and their
conducing behavior. Journal of Industrial and Engineering Chemistry, 31, 352-
359.
Cui, Y., Zhang, X., Feng, J., Zhang, J., & Zhu, Y. (2013). Enhanced photovoltaic
performance of quasi-solid-state dye-sensitized solar cells by incorporating a
quaternized ammonium salt into poly(ethylene oxide)/poly(vinylidene fluoride-
hexafluoropropylene) composite polymer electrolyte. Electrochimica Acta, 108,
757-762.
Dao, V. D., & Choi, H. S. (2016). Pt nanourchins as efficient and robust counter electrode
materials for dye-sensitized solar cells. ACS Applied Materials & Interfaces, 8(1),
1004-1010.
de Freitas, J. N., Nogueira, A. F., & De Paoli, M.-A. (2009). New insights into dye-
sensitized solar cells with polymer electrolytes. Journal of Materials Chemistry,
19(30), 5279-5294.
Dissanayake, M. A. K. L., Ekanayake, E. M. B. S., Bandara, L. R. A. K., Seneviratne, V.
A., Thotawatthage, C. A., Jayaratne, S. L., & Senadeera, G. K. R. (2016).
Efficiency enhancement by mixed cation effect in polyethylene oxide (PEO)-
based dye-sensitized solar cells. Journal of Solid State Electrochemistry, 20(1),
193-201.
Dissanayake, M. A. K. L., Rupasinghe, W. N. S., Seneviratne, V. A., Thotawatthage, C.
A., & Senadeera, G. K. R. (2014). Optimization of iodide ion conductivity and
nano filler effect for efficiency enhancement in polyethylene oxide (PEO) based
dye sensitized solar cells. Electrochimica Acta, 145, 319-326.
Durr, M., Schmid, A., Obermaier, M., Rosselli, S., Yasuda, A., & Nelles, G. (2005). Low-
temperature fabrication of dye-sensitized solar cells by transfer of composite
porous layers. Nature Materials, 4(8), 607-611.
Page 125
105
Farheen, S., & Mathad, R. D. (2015). Effect of nano filler on conductivity in peo-pmma-
liclo 4 polymer electrolyte. International Journal of Advanced Science and
Technology, 81, 49-52.
Feldt, S. M., Gibson, E. A., Gabrielsson, E., Sun, L., Boschloo, G., & Hagfeldt, A. (2010).
Design of organic dyes and cobalt polypyridine redox mediators for high-
efficiency dye-sensitized solar cells. Journal of the American Chemical Society,
132(46), 16714-16724.
Fu, Y.-b., Ma, X.-h., Yang, Q.-h., & Zong, X.-f. (2003). The effect of fumed silica on the
interfacial stability in the polymer gel electrolyte. Materials Letters, 57(11), 1759-
1764.
Gong, J., Liang, J., & Sumathy, K. (2012). Review on dye-sensitized solar cells (DSSCs):
Fundamental concepts and novel materials. Renewable and Sustainable Energy
Reviews, 16(8), 5848-5860.
Green, M. A., Emery, K., Hishikawa, Y., Warta, W., & Dunlop, E. D. (2015). Solar cell
efficiency tables (Version 45). Progress in photovoltaics: research and
applications, 23(1), 1-9.
Hagfeldt, A., Boschloo, G., Sun, L., Kloo, L., & Pettersson, H. (2010). Dye-sensitized
solar cells. Chemical reviews, 110(11), 6595-6663.
Hagfeldt, A., & Grätzel, M. (2000). Molecular Photovoltaics. Accounts of Chemical
Research, 33(5), 269-277.
Hong, W., Xu, Y., Lu, G., Li, C., & Shi, G. (2008). Transparent graphene/PEDOT–PSS
composite films as counter electrodes of dye-sensitized solar cells.
Electrochemistry Communications, 10(10), 1555-1558.
Hoque, N. A., Thakur, P., Bala, N., Kool, A., Das, S., & Ray, P. P. (2016). Tunable
photoluminescence emissions and large dielectric constant of the electroactive
poly(vinylidene fluoride–hexafluoropropylene) thin films modified with SnO2
nanoparticles. RSC Advances., 6(36), 29931-29943.
Horiuchi, T., Miura, H., Sumioka, K., & Uchida, S. (2004). High efficiency of dye-
sensitized solar cells based on metal-free indoline dyes. Journal of the American
Chemical Society, 126(39), 12218-12219.
Ileperuma, O. A. (2013). Gel polymer electrolytes for dye sensitised solar cells: A review.
Materials Technology, 28(1-2), 65-70.
Imoto, K., Takahashi, K., Yamaguchi, T., Komura, T., Nakamura, J.-i., & Murata, K.
(2003). High-performance carbon counter electrode for dye-sensitized solar cells.
Solar Energy Materials and Solar Cells, 79(4), 459-469.
Indran, V. P., Haji Saud, A. S., Maniam, G. P., Yusoff, M. M., Taufiq-Yap, Y. H., & Ab.
Rahim, M. H. (2016). Versatile boiler ash containing potassium silicate for the
synthesis of organic carbonates. RSC Advances., 6(41), 34877-34884.
Page 126
106
Kang, J., Li, W., Wang, X., Lin, Y., Xiao, X., & Fang, S. (2003). Polymer electrolytes
from PEO and novel quaternary ammonium iodides for dye-sensitized solar cells.
Electrochimica Acta, 48(17), 2487-2491.
Kang, Y. I., & Moon, J. H. (2015). In situ poly(methyl methacrylate)/graphene composite
gel electrolytes for highly stable dye-sensitized solar cells. ChemSusChem, 8(22),
3799-3804.
Khiar, A. A., & Arof, A. (2010). Conductivity studies of starch-based polymer
electrolytes. Ionics, 16(2), 123-129.
Kim, J. H., Kang, M. S., Kim, Y. J., Won, J., Park, N. G., & Kang, Y. S. (2004). Dye-
sensitized nanocrystalline solar cells based on composite polymer electrolytes
containing fumed silica nanoparticles. Chemical Communications (Cambridge)
(14), 1662-1663.
Ko, Y.-I., Ha, Y.-M., Hayashi, T., Kim, Y. A., Yang, C.-M., Kim, J., . . . Jung, Y. C.
(2016). Flexible Transparent Conducting Films Composed of Photochemically
Oxidized Thin Multi-Walled Carbon Nanotubes. Journal of Nanoscience and
Nanotechnology, 16(11), 11980-11985.
Kubo, W., Kitamura, T., Hanabusa, K., Wada, Y., & Yanagida, S. (2002). Quasi-solid-
state dye-sensitized solar cells using room temperature molten salts and a low
molecular weight gelator. Chemical Communications, (4), 374-375.
Kumar, A., & Dek, M. (2010). Nanofiber Reinforced Composite Polymer Electrolyte
Membranes. Book. doi: 10.5772/8146
Lan, Z., Wu, J., Wang, D., Hao, S., Lin, J., & Huang, Y. (2007). Quasi-solid-state dye-
sensitized solar cells based on a sol–gel organic–inorganic composite electrolyte
containing an organic iodide salt. Solar Energy, 81(1), 117-122.
Lee, B., Buchholz, D. B., & Chang, R. P. H. (2012). An all carbon counter electrode for
dye sensitized solar cells. Energy & Environmental Science, 5(5), 6941.
Lee, L., Kim, I.-J., Yang, S., & Kim, S. (2012). Electrochemical properties of
PEO/PMMA blend-based polymer electrolytes using imidazolium salt-supported
silica as a filler. Research on Chemical Intermediates, 39(7), 3279-3290.
Lee, S.-H. A., Jackson, A.-M. S., Hess, A., Fei, S.-T., Pursel, S. M., Basham, J., . . .
Mallouk, T. E. (2010). Influence of different iodide salts on the performance of
dye-sensitized solar cells containing phosphazene-based nonvolatile electrolytes.
The Journal of Physical Chemistry C, 114(35), 15234-15242.
Li, Q., Wu, J., Tang, Q., Lan, Z., Li, P., Lin, J., & Fan, L. (2008). Application of
microporous polyaniline counter electrode for dye-sensitized solar cells.
Electrochemistry Communications, 10(9), 1299-1302.
Li, S., Qiu, L., Shi, C., Chen, X., & Yan, F. (2014). Water-resistant, solid-state, dye-
sensitized solar cells based on hydrophobic organic ionic plastic crystal
electrolytes. Advanced Materials, 26(8), 1266-1271.
Page 127
107
Linares-Flores, C., Mendizabal, F., Arratia-Pérez, R., Inostroza, N., & Orellana, C.
(2015). Substituents role in zinc phthalocyanine derivatives used as dye-sensitized
solar cells. A theoretical study using Density Functional Theory. Chemical
Physics Letters, 639, 172-177.
Ludueña, G. A., Kühne, T. D., & Sebastiani, D. (2011). Mixed grotthuss and vehicle
transport mechanism in proton conducting polymers from ab initio molecular
dynamics simulations. Chemistry of Materials, 23(6), 1424-1429.
Machado, G. O., Ferreira, H. C. A., & Pawlicka, A. (2005). Influence of plasticizer
contents on the properties of HEC-based solid polymeric electrolytes.
Electrochimica Acta, 50(19), 3827-3831.
Madhushani, W. V. T., Jayathilake, Y., Perera, K. S., & Vidanapathirana, K. P. (2016).
Effect of cation size of iodide salt in the electrolyte on the performance of dye
sensitised solar cells. Journal of the National Science Foundation of Sri Lanka,
44(1), 77.
Mallakpour, S., & Zeraatpisheh, F. (2012). The nanocomposites of zinc oxide/L-amino
acid-based chiral poly(ester-imide) via an ultrasonic route: Synthesis,
characterization, and thermal properties. Journal of Applied Polymer Science,
126(4), 1416-1424.
Martinez, C. R., Vick, J. R., Perales, O., & Singh, S. Cytotoxic studies of PEG
functionalized ZnO Nanoparticles on MCF-7 cancer cells. Nano Science and
Technology Institute, (3), 420-423.
Miki, N. (2013). Liquid Encapsulation Technology for Microelectromechanical
Systems." Advances in Micro/Nano Electromechanical Systems and Fabrication
Technologies", 41-59
Mohan, V. M., Murakami, K., Kono, A., & Shimomura, M. (2013).
Poly(acrylonitrile)/activated carbon composite polymer gel electrolyte for high
efficiency dye sensitized solar cells. Journal of Materials Chemistry A, 1(25),
7399.
Musil, M., Michálek, J., Abbrent, S., Kovářová, J., Přádný, M., Doubková, L., . . .
Sedlaříková, M. (2015). New type of gel polyelectrolytes based on selected
methacrylates and their characteristics. Part I. Copolymers with (3-
(trimethoxysilyl)propyl methacrylate). Electrochimica Acta, 155, 183-195.
Muthuraaman, B., Will, G., Wang, H., Moonie, P., & Bell, J. (2013). Increased charge
transfer of Poly (ethylene oxide) based electrolyte by addition of small molecule
and its application in dye-sensitized solar cells. Electrochimica Acta, 87, 526-531.
Na, W., Lee, A. S., Lee, J. H., Hwang, S. S., Hong, S. M., Kim, E., & Koo, C. M. (2016).
Lithium ion capacitors fabricated with polyethylene oxide-functionalized
polysilsesquioxane hybrid ionogel electrolytes. Electrochimica Acta, 188, 582-
588.
Nazeeruddin, M. K., Baranoff, E., & Grätzel, M. (2011). Dye-sensitized solar cells: A
brief overview. Solar Energy, 85(6), 1172-1178.
Page 128
108
Nazeeruddin, M. K., Kay, A., Rodicio, I., Humphry-Baker, R., Mueller, E., Liska, P., . .
. Graetzel, M. (1993). Conversion of light to electricity by cis-X2bis(2,2'-
bipyridyl-4,4'-dicarboxylate)ruthenium(II) charge-transfer sensitizers (X = Cl-,
Br-, I-, CN-, and SCN-) on nanocrystalline titanium dioxide electrodes. Journal
of the American Chemical Society, 115(14), 6382-6390.
Nazeeruddin, M. K., Pechy, P., Renouard, T., Zakeeruddin, S. M., Humphry-Baker, R.,
Comte, P., . . . Shklover, V. (2001). Engineering of efficient panchromatic
sensitizers for nanocrystalline TiO2-based solar cells. Journal of the American
Chemical Society, 123(8), 1613-1624.
Ndiaye, A., Charki, A., Kobi, A., Kébé, C. M., Ndiaye, P. A., & Sambou, V. (2013).
Degradations of silicon photovoltaic modules: A literature review. Solar Energy,
96, 140-151.
O'Regan, B., & Gratzel, M. (1991). A low-cost, high-efficiency solar cell based on dye-
sensitized colloidal TiO2 films. Nature, 353(6346), 737-740.
Park, N.-G. (2015). Perovskite solar cells: an emerging photovoltaic technology.
Materials Today, 18(2), 65-72.
Prabakaran, K., Mohanty, S., & Nayak, S. K. (2015a). Improved electrochemical and
photovoltaic performance of dye sensitized solar cells based on PEO/PVDF-
HFP/silane modified TiO2 electrolytes and MWCNT/Nafion counter electrode.
RSC Advances, 5(51), 40491-40504.
Prabakaran, K., Mohanty, S., & Nayak, S. K. (2015b). PEO/PVdF–HFP electrolytes for
natural dye sensitized solar cell applications: effect of modified nano-TiO2 on
electrochemical and photovoltaic performance. Journal of Materials Science:
Materials in Electronics, 26(6), 3887-3897.
Prabakaran, K., Mohanty, S., & Nayak, S. K. (2015c). Solid state dye sensitized solar
cells: Eosin-Y sensitized TiO2–ZnO/PEO–PVDF-HFP-MMT
electrolytes/MWCNT–Nafion counter electrode. Ceramics International, 41(9,
Part B), 11824-11835.
Rajesh Kumar, S., Juan, C.-H., Liao, G.-M., Lin, J.-S., Yang, C.-C., Ma, W.-T., . . . Jessie
Lue, S. (2015). Fumed silica nanoparticles incorporated in quaternized poly(vinyl
alcohol) nanocomposite membrane for enhanced power densities in direct alcohol
alkaline fuel cells. Energies, 9(1), 15.
Ramesh, S., & Arof, A. K. (2001). Ionic conductivity studies of plasticized poly(vinyl
chloride) polymer electrolytes. Materials Science and Engineering: B, 85(1), 11-
15.
Rani, N. S., Sannappa, J., Demappa, T., & Mahadevaiah. (2013). Structural, thermal, and
electrical studies of sodium iodide (NaI)-doped hydroxypropyl methylcellulose
(HPMC) polymer electrolyte films. Ionics, 20(2), 201-207.
Ravn Sørensen, P., & Jacobsen, T. (1982). Conductivity, charge transfer and transport
number- an ac-investigation of the polymer electrolyte LiSCN-
poly(ethyleneoxide). Electrochimica Acta, 27(12), 1671-1675.
Page 129
109
Ren, Y., Zhang, Z., Fang, S., Yang, M., & Cai, S. (2002). Application of PEO based gel
network polymer electrolytes in dye-sensitized photoelectrochemical cells. Solar
Energy Materials and Solar Cells, 71(2), 253-259.
Rong, Y., Ku, Z., Li, X., & Han, H. (2015). Transparent bifacial dye-sensitized solar cells
based on an electrochemically polymerized organic counter electrode and an
iodine-free polymer gel electrolyte. Journal of Materials Science, 50(10), 3803-
3811.
Saikia, D., & Kumar, A. (2005). Ionic transport in P(VDF-HFP)–PMMA–LiCF3SO3–
(PC+DEC)–SiO2 composite gel polymer electrolyte. European Polymer Journal,
41(3), 563-568.
Sethupathy, M., Sethuraman, V., & Manisankar, P. (2013). Preparation of PVDF/SiO2;
composite nanofiber membrane using electrospinning for polymer electrolyte
analysis. Soft Nanoscience Letters, 3(2), 37-43.
Shalu, S., Singh, V. K., & Singh, R. K. (2015). Development of ion conducting polymer
gel electrolyte membranes based on polymer PVdF-HFP, BMIMTFSI ionic liquid
and the Li-salt with improved electrical, thermal and structural properties. Journal
of Materials Chemistry C, 3(28), 7305-7318.
Sharma, J., & Sekhon, S. (2007). Nanodispersed polymer gel electrolytes: Conductivity
modification with the addition of PMMA and fumed silica. Solid State Ionics,
178(5-6), 439-445.
Sharma, P. (2012). Effect of nano-filler on structural and ionic transport properties of
plasticized polymer electrolyte. Open Journal of Organic Polymer Materials,
2(2), 38-44.
Sharma, S., Dhiman, N., Pathak, D., & Kumar, R. (2016). Effect of nano-size fumed silica
on ionic conductivity of PVdF-HFP-based plasticized nano-composite polymer
electrolytes. Ionics, 22(10), 1865-1872.
Sharmin, K., Abdalla, M. A., & Aglan, H. A. (2012). Effect of fumed silica nanoparticles
on the proton conductivity of polyimide-phosphoric anhydride membranes.
Journal of Elastomers and Plastics, 46(1), 43-56.
Shen, X., Xu, W., Xu, J., Liang, G., Yang, H., & Yao, M. (2008). Quasi-solid-state dye-
sensitized solar cells based on gel electrolytes containing different alkali metal
iodide salts. Solid State Ionics, 179(35-36), 2027-2030.
Siddiki, M. K., Li, J., Galipeau, D., & Qiao, Q. (2010). A review of polymer multijunction
solar cells. Energy & Environmental Science, 3(7), 867-883.
Sima, C., Grigoriu, C., & Antohe, S. (2010). Comparison of the dye-sensitized solar cells
performances based on transparent conductive ITO and FTO. Thin Solid Films,
519(2), 595-597.
Snaith, H. J., & Schmidt‐Mende, L. (2007). Advances in liquid‐electrolyte and solid‐
state dye‐sensitized solar cells. Advanced Materials, 19(20), 3187-3200.
Page 130
110
Stathatos, E., Lianos, P., Zakeeruddin, S., Liska, P., & Grätzel, M. (2003). A quasi-solid-
state dye-sensitized solar cell based on a sol-gel nanocomposite electrolyte
containing ionic liquid. Chemistry of Materials, 15(9), 1825-1829.
Stergiopoulos, T., Arabatzis, I. M., Katsaros, G., & Falaras, P. (2002). Binary
polyethylene oxide/titania solid-state redox electrolyte for highly efficient
nanocrystalline TiO2 photoelectrochemical cells. Nano Letters, 2(11), 1259-1261.
Sudhakar, Y., & Selvakumar, M. (2012). Lithium perchlorate doped plasticized chitosan
and starch blend as biodegradable polymer electrolyte for supercapacitors.
Electrochimica Acta, 78, 398-405.
Suryawanshi, M., Agawane, G., Bhosale, S., Shin, S., Patil, P., Kim, J., & Moholkar, A.
(2013). CZTS based thin film solar cells: A status review. Materials Technology,
28(1-2), 98-109.
Thankamony, R. L., Chu, H., Lim, S., Yim, T., Kim, Y.-J., & Kim, T.-H. (2015).
Preparation and characterization of imidazolium-PEO-based Ionene/PVDF
(HFP)/LiTFSI as a novel gel polymer electrolyte. Macromolecular Research,
23(1), 38-44.
Ulaganathan, M., Nithya, R., & Rajendran, S. (2012). Surface Analysis Studies on
Polymer Electrolyte Membranes Using Scanning Electron Microscope and
Atomic Force Microscope. In Scanning Electron Microscopy. InTech. Chicago
Chapter 33.
Venkatesan, S., Liu, I. P., Chen, L. T., Hou, Y. C., Li, C. W., & Lee, Y. L. (2016). Effects
of TiO2 and TiC nanofillers on the performance of dye sensitized solar cells based
on the polymer gel electrolyte of a cobalt redox system. American Chemical
Society Applied Materials & Interfaces, 8(37), 24559-24566.
Venkatesan, S., Su, S.-C., Kao, S.-C., Teng, H., & Lee, Y.-L. (2015). Stability
improvement of gel-state dye-sensitized solar cells by utilization the co-solvent
effect of propionitrile/acetonitrile and 3-methoxypropionitrile/acetonitrile with
poly(acrylonitrile-co-vinyl acetate). Journal of Power Sources, 274, 506-511.
Vijayakumar, E., Subramania, A., Fei, Z., & Dyson, P. J. (2015). High-performance dye-
sensitized solar cell based on an electrospun poly(vinylidene fluoride-co-
hexafluoropropylene)/cobalt sulfide nanocomposite membrane electrolyte. RSC
Advances., 5(64), 52026-52032.
Wang, P., Zakeeruddin, S. M., Comte, P., Exnar, I., & Grätzel, M. (2003). Gelation of
ionic liquid-based electrolytes with silica nanoparticles for quasi-solid-state dye-
sensitized solar cells. Journal of the American Chemical Society, 125(5), 1166-
1167.
Wang, P., Zakeeruddin, S. M., & Grätzel, M. (2004). Solidifying liquid electrolytes with
fluorine polymer and silica nanoparticles for quasi-solid dye-sensitized solar cells.
Journal of Fluorine Chemistry, 125(8), 1241-1245.
Wang, P., Zakeeruddin, S. M., Moser, J. E., Nazeeruddin, M. K., Sekiguchi, T., & Grätzel,
M. (2003). A stable quasi-solid-state dye-sensitized solar cell with an amphiphilic
Page 131
111
ruthenium sensitizer and polymer gel electrolyte. Nature Materials, 2(6), 402-
407.
Wu, J., Lan, Z., Lin, J., Huang, M., Hao, S., Sato, T., & Yin, S. (2007). A Novel
thermosetting gel electrolyte for stable quasi‐solid‐state dye‐sensitized solar
cells. Advanced Materials, 19(22), 4006-4011.
Wu, J., Lan, Z., Wang, D., Hao, S., Lin, J., Huang, Y., . . . Sato, T. (2006). Gel polymer
electrolyte based on poly(acrylonitrile-co-styrene) and a novel organic iodide salt
for quasi-solid state dye-sensitized solar cell. Electrochimica Acta, 51(20), 4243-
4249.
Wu, M., Lin, X., Wang, Y., Wang, L., Guo, W., Qi, D., . . . Ma, T. (2012). Economical
Pt-free catalysts for counter electrodes of dye-sensitized solar cells. Journal of the
American Chemical Society, 134(7), 3419-3428.
Xia, J., Li, F., Huang, C., Zhai, J., & Jiang, L. (2006). Improved stability quasi-solid-state
dye-sensitized solar cell based on polyether framework gel electrolytes. Solar
Energy Materials and Solar Cells, 90(7-8), 944-952.
Xiang, W., Huang, W., Bach, U., & Spiccia, L. (2013). Stable high efficiency dye-
sensitized solar cells based on a cobalt polymer gel electrolyte. Chemical
Communications (Cambridge), 49(79), 8997-8999.
Xiao, S., Wang, F., Yang, Y., Chang, Z., & Wu, Y. (2014). An environmentally friendly
and economic membrane based on cellulose as a gel polymer electrolyte for
lithium ion batteries. RSC Advances, 4(1), 76-81.
Xu, X., Huang, D., Cao, K., Wang, M., Zakeeruddin, S. M., & Gratzel, M. (2013).
Electrochemically reduced graphene oxide multilayer films as efficient counter
electrode for dye-sensitized solar cells. Scientific Reports - Nature, 3, 1489.
Yang, H., Huang, M., Wu, J., Lan, Z., Hao, S., & Lin, J. (2008). The polymer gel
electrolyte based on poly (methyl methacrylate) and its application in quasi-solid-
state dye-sensitized solar cells. Materials Chemistry and Physics, 110(1), 38-42.
Zainal Abiddin, J. F., & Ahmad, A. H. (2015). Fourier transform infrared spectroscopy
and electrical characterization of methylcellulose based solid polymer electrolyte
doped with sodium iodide. Jurnal Teknologi, 76(3), 2180-3722.
Zeyghami, M., Kharrat, R., & Ghazanfari, M. H. (2014). Investigation of the applicability
of nano silica particles as a thickening additive for polymer solutions applied in
EOR processes. Energy Sources, Part A: Recovery, Utilization, and
Environmental Effects, 36(12), 1315-1324.
Zhang, Z., Hu, Y., Qin, F., & Ding, Y. (2016). DC sputtering assisted nano-branched
core–shell TiO2/ZnO electrodes for application in dye-sensitized solar cells.
Applied Surface Science, 376, 10-15.
Zhao, J., Jo, S.-G., & Kim, D.-W. (2014). Photovoltaic performance of dye-sensitized
solar cells assembled with electrospun polyacrylonitrile/silica-based fibrous
composite membranes. Electrochimica Acta, 142, 261-267.
Page 132
112
Zhao, X. G., Jin, E. M., Park, J.-Y., & Gu, H.-B. (2014). Hybrid polymer electrolyte
composite with SiO2 nanofiber filler for solid-state dye-sensitized solar cells.
Composites Science and Technology, 103, 100-105.
Page 133
113
LIST OF PUBLICATIONS AND PAPERS PRESENTED
List of Publications
Negar Zebardastan, Khanmirzaei,M.H., Ramesh, S., & Ramesh, K. (2016). Novel
poly(vinylidene fluoride-co-hexafluoro propylene)/polyethylene oxide based gel
polymer electrolyte containing fumed silica (SiO2) nanofiller for high performance dye-
sensitized solar cell. Electrochimica Acta, 220 (2016), 573-580. (Published)
Zebardastan, N., Khanmirzaei, M. H., Ramesh, S., & Ramesh, K. (2017). Presence of
NaI in PEO/PVdF-HFP blend based gel polymer electrolytes for fabrication of dye-
sensitized solar cells. Materials Science in Semiconductor Processing, 66, 144-148.
(Published)
Zebardastan, N., Khanmirzaei, M. H., Ramesh, S., & Ramesh, K. (2017). Performance
enhancement of poly (vinylidene fluoride-co-hexafluoro propylene) /polyethylene oxide
based nanocomposite polymer electrolyte with ZnO nanofiller for dye-sensitized solar
cell. Organic Electronics. (Published)
List of Conferences
Negar Zebardastan, Khanmirzaei, M.H., Ramesh, S. & Ramesh, K. (2016). Presence
of NaI in PEO/PVdF-HFP blend based gel polymer electrolyte for fabrication of dye-
sensitized solar cells. Oral presented at International conference on emerging research in
science and humanities (ERSH 2016), May 16-17 (2016), Kuala Lumpur, Malaysia.