Not to be quoted without prior reference to the authors Fisheries Research Services Report No 07/00 POLYCYCLIC AROMATIC HYDROCARBON (PAH) AND N-ALKANE COMPOSITION OF HERBAGE SAMPLES FOLLOWING THE SEA EMPRESS OIL SPILL L Webster, E Dalgarno and C F Moffat December 2000 Fisheries Research Services Marine Laboratory Victoria Road Aberdeen AB11 9DB
Transcript
Not to be quoted without prior reference to the authors
Fisheries Research Services Report No 07/00
POLYCYCLIC AROMATIC HYDROCARBON (PAH) AND N-ALKANE COMPOSITION OF HERBAGE SAMPLES FOLLOWING THE SEA EMPRESS OIL SPILL
L Webster, E Dalgarno and C F Moffat
December 2000
Fisheries Research Services Marine Laboratory Victoria Road Aberdeen AB11 9DB
1
POLYCYCLIC AROMATIC HYDROCARBON (PAH) AND N-ALKANE COMPOSITION OF HERBAGE SAMPLES FOLLOWING THE
SEA EMPRESS OIL SPILL
L Webster, E Dalgarno and C F Moffat
FRS Marine Laboratory, PO Box 101, Victoria Road, Aberdeen, AB11 9DB
SUMMARY 1. Following the grounding of the Sea Empress at St Ann’s Head, Milford Haven on
15 February 1996, 72,000 tonnes of Forties crude oil was released to the marine environment. At the request of the Countryside Council for Wales, FRS undertook the analysis of herbage samples collected from areas affected by the oil spill. Herbage samples were collected in February 1996, March 1996 and May 1997.
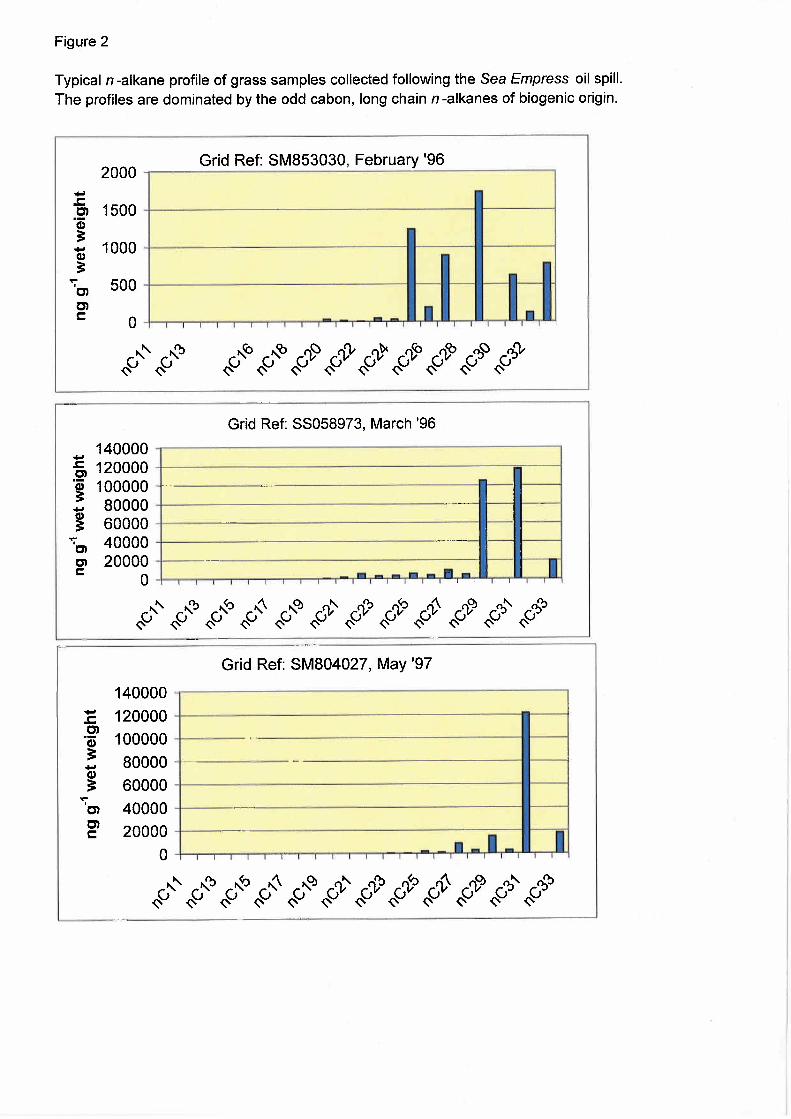
2. The aliphatic profiles of all herbage samples showed an odd carbon long chain
predominance, typical of biogenic origin. 3. Total polycyclic aromatic hydrocarbon (PAH) concentrations in herbage samples
collected in February 1996 ranged from 76.2 ng g-1 wet weight to 3,546 ng g-1 wet weight. Total PAH concentrations in herbage samples from March 1996 ranged from 325.0 ng g-1 wet weight to 2,500 ng g-1 wet weight.
4. Four of the five sites which were re-sampled in March 1996 showed a decrease in
total PAH concentrations. 5. PAH concentrations in samples collected in May 97 were significantly lower than
those from 1996 ranging from 9.5 ng g-1 wet weight to 45.3 ng g-1 wet weight.
INTRODUCTION On the evening of 15 February 1996 the Sea Empress, bringing Forties blend crude oil to Milford Haven in South West Wales, ran aground at St Ann's Head at the entrance to the Milford Haven waterway (Fig. 1). Over a period of seven days, 72,000 tonnes of light crude oil was released to the marine environment along with 250 tonnes of heavy fuel oil; a further 230 tonnes of fuel oil was released after the tanker had been towed to a jetty within the waterway. The Sea Empress oil spill was the third largest spill to occur in Britain. The oil came ashore along 200 km of coastline, causing great concern as this area of south west Wales is an area of international importance for its wildlife and natural beauty. The worst affected areas were Milford Haven and the south coast of Pembrokeshire eastwards to the beaches of Carmarthen Bay, mainly from Tenby to Pendine. Much of the coastline lies within the Pembrokeshire Coast National Park. Within the main area affected by the spill were about 35 Sites of Special Scientific Interest, two National Nature Reserves (at Stackpole and Skomer) and, around Skomer, one of the UK's three Marine Nature Reserves. There were also EC designated Special Protection Areas for birds. In addition, the region was important for fishing and tourism. However, in Milford Haven there are three
Polycyclic Aromatic Hydrocarbon (PAH) and n-Alkane Composition
2
oil refineries and terminals, which for many years have resulted in accidental discharges of oil into the area. Following the spill, a Fisheries Exclusion Zone was designated under the Food and Environment Protection Act 1985 (FEPA), banning the catching of shellfish and fish within the designated area. A considerable amount of monitoring and research started immediately after the tanker grounded.1, 2 Fin fish were found to have little contamination, and the ban on salmon and sea trout was lifted on 3 May 1996, and on other fin fish on 21 May 1996. Similar to the Braer oil spill in Shetland, shellfish, such as mussels, were more heavily contaminated than the fish and recovered more slowly.3 The ban was lifted for crabs and lobsters outside the Milford Haven waterway and for whelks throughout the whole area on 29 August 1996, and over the following year the ban was progressively lifted in stages until all remaining restrictions were removed on 12 September 1997. FRS undertook the analysis of herbage samples in the affected areas, as requested by the Countryside Council for Wales. Aerial deposition of the oil on the land could result in the contamination of the soil and vegetation with polycyclic aromatic hydrocarbons (PAHs) and aliphatic hydrocarbons. Further contamination of the vegetation could also occur by the uptake of these oil related hydrocarbons from the soil into the plants. Samples were collected in February 1996, March 1996 and May 1997 for the determination of n-alkane profiles and PAH concentrations.
EXPERIMENTAL Sample Handling Protocol Grass collected from the South Pembrokeshire coast in late February early March 1996 was supplied to FRS by the Countryside Council for Wales. Hydrocarbons are ubiquitous to the environment and great care must be taken to avoid adventitious contamination of samples. Therefore all samples were collected in solvent washed aluminum cans, supplied to the Council by FRS. The cans had been rinsed twice with dichloromethane and the lids washed with iso-hexane. A second round of sampling took place in May 1997. In August 1997 a further 18 samples, of those collected in March 1996, were also analysed. Isolation of Hydrocarbons from Herbage Each grass sample was cut-up with a solvent washed scalpel or scissors and an aliquot (approximately 10 g, accurately weighed) placed in a solvent washed beaker. To the aliquot of grass was added aliphatic hydrocarbon internal standards, heptamethylnonane (HMN) and squalane, and deuterated aromatic standards (naphthalene, biphenyl, dibenzothiophene, anthracene, pyrene and benzo[a]pyrene). The hydrocarbons were extracted using iso-hexane (100 ml) with sonication for 10 minutes. The iso-hexane extract was filtered through a sodium sulphate column, which was then washed with iso-hexane (10 ml). The iso-hexane extract was concentrated to a small volume before fractionation by isocratic, normal phase HPLC.4,5 An aliquot (150 µl) of the iso-hexane solution was injected on to a Genesis SIL 4 µm HPLC column (25 x 4.6 cm id) and eluted with iso-hexane at a flow rate of 2 ml min-1. Two fractions were collected and concentrated prior to chromatographic analysis. The aliphatic fraction was collected between 0 and 2.5 minutes and the extract analysed by gas chromatography with flame ionisation detection (GC-FID). The fraction eluting between 2.5 and 20 minutes was collected for PAH analysis by gas chromatography with mass selective detection (GC-MSD). Procedural blanks were
Polycyclic Aromatic Hydrocarbon (PAH) and n-Alkane Composition
3
performed with each batch of grass samples, and the hydrocarbon concentration adjusted accordingly. Determination of Polycyclic Aromatic Hydrocarbons by GC-MSD4, 5 The concentration and composition of the PAHs were determined by GC-MSD using an HP5890 Series gas chromatograph interfaced with an HP5970 MSD and fitted with a cool on-column injector. A non-polar methylsilicone column was used for the analyses (Ultra 1, 25 m x 0.2 mm id, 0.33 µm film thickness; Hewlett-Packard Ltd, Stockport, England). Helium (7 psi) was used as the carrier gas. Injections were made at 50°C and the oven temperature held constant for three minutes. Thereafter the temperature was raised at 20°C min-1 up to 100°C. This was followed by a slower ramp of 4°C min-1 up to a final temperature of 270°C. The MSD was set for selective ion monitoring (SIM) with a dwell time of 50 ms. A total of 25 ions plus the six internal standard ions were measured over the period of the analysis. Thus the analysis incorporated 2- to 6-ring, parent and branched PAHs. Good reproducibility was generally obtained for individual PAHs.4 Determination of Aliphatic Hydrocarbons (n-Alkanes) The n-alkane distribution was determined by GC-FID using an HP 5890 Series II gas chromatograph (Hewlett-Packard Ltd, Stockport, England) equipped with an HP 7673 automated, cool on-column injector and fitted with a non-polar, Ultra 1, column (25 m x 0.2 mm id, film thickness 0.33 µm; Hewlett-Packard Ltd, Stockport, England). The carrier gas was ECD grade nitrogen (16 psi). Injections were made at 60°C and the oven temperature held constant for three minutes. Thereafter, the temperature was raised at 4°C min-1 up to 280°C and held at this temperature until the end of the run. The detector was maintained at 300°C throughout. Data were collected using a PE Nelson 600 series link box and processed using a Turbochrom 3.1 data station (Perkin-Elmer Ltd, Beaconsfield, England). Calibration curves were prepared for the n-alkanes nC11-nC33 and for 2,2,4,4,6,8,8-heptamethylnonane (HMN), pristane, phytane and squalane using standard solutions covering the concentration range ~0.1ng ml-1 - ~50 ng ml-1. Quantification was on the basis of the added internal standard, squalane. The detector response for each of the n-alkanes, pristane, phytane, HMN and squalane was linear; a correlation coefficient of 0.9991, 0.9998, 0.9998, 0.9997 and 0.9998 obtained for nC11, nC16, nC123, squalane and nC31 respectively. In all cases the correlation coefficient was at least 0.999. The limit of detection of n-alkanes for the FID, when using automated integration, was 25 pg on-column. However, it was possible, by manual integration of the peaks, to determine n-alkane levels as low as 5 pg on-column, with a signal to noise ratio of 7:1 in the region of octadecane (nC18).
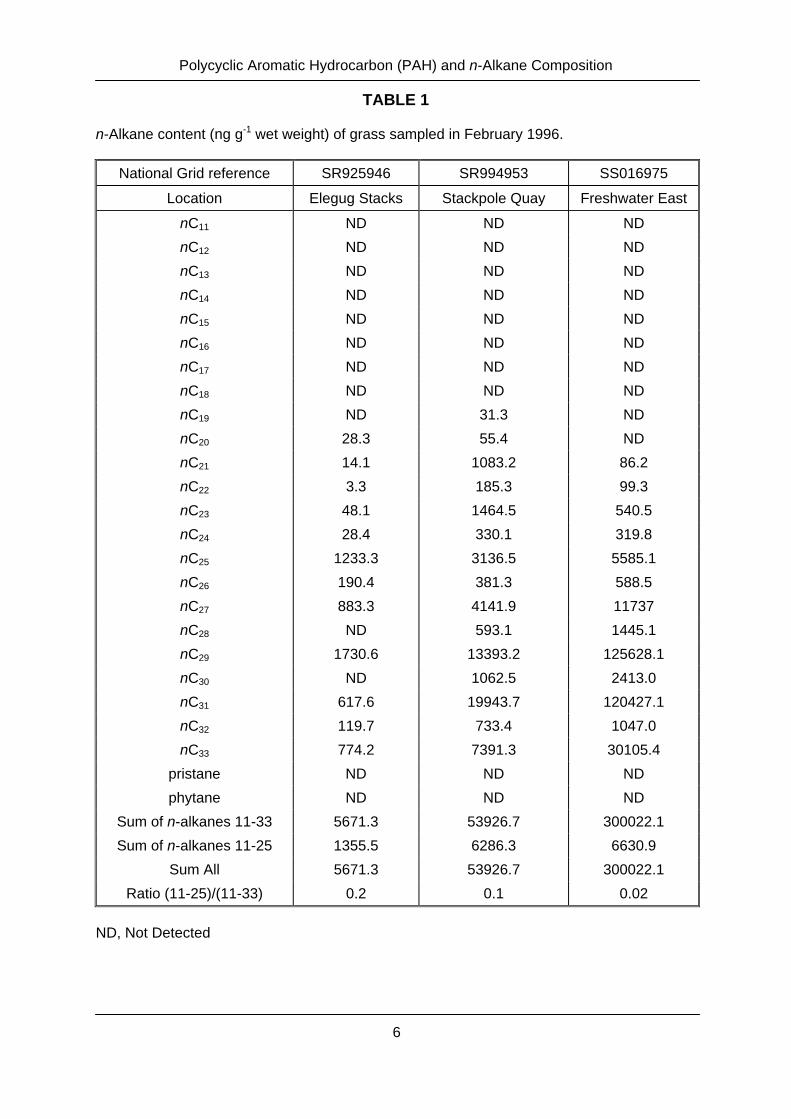
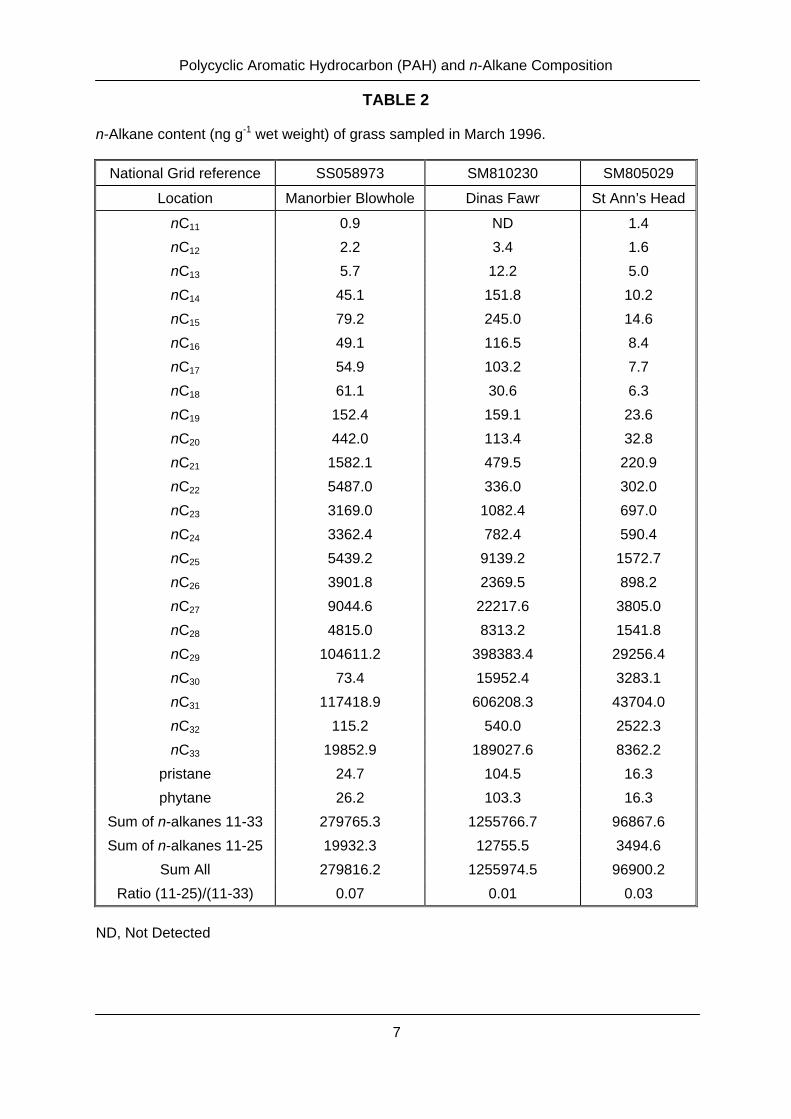
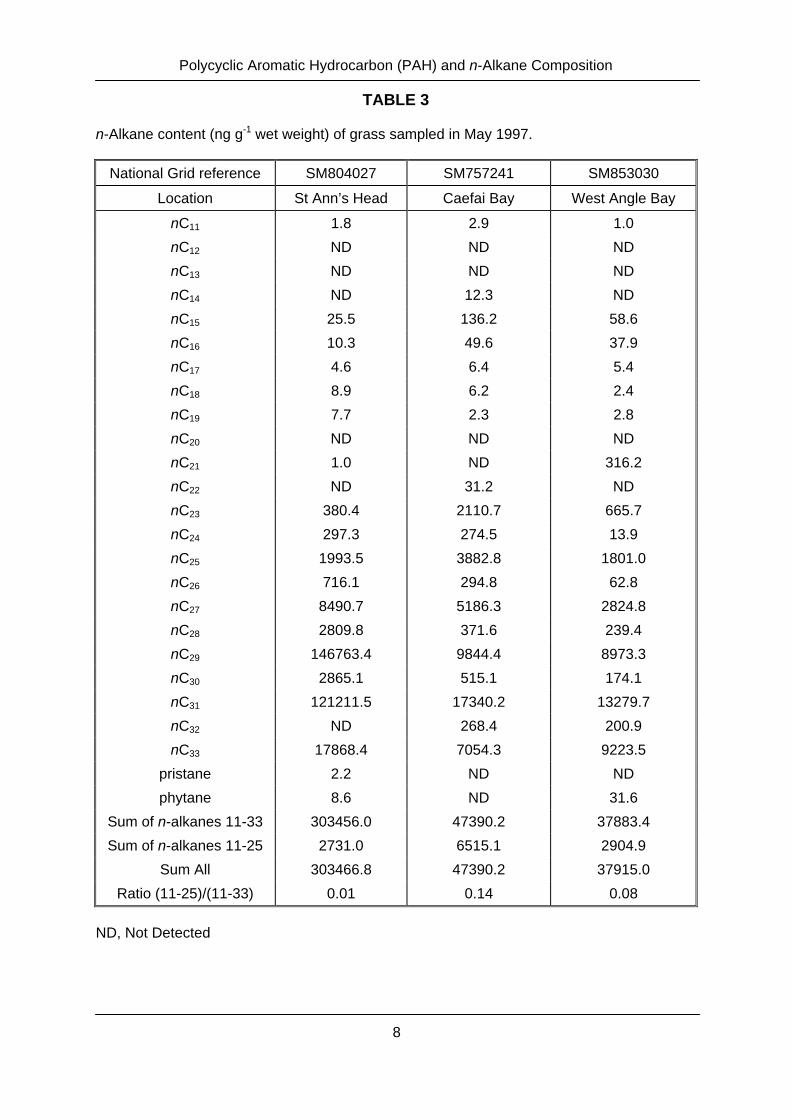
RESULTS For all sampling rounds the aliphatic hydrocarbon composition of the grass samples were dominated by the biogenic hydrocarbons typical of herbage. This included heptacosane (nC27), nonacosane (nC29) and hentriacontane (nC31) (Fig. 2). There was little evidence of petrogenic contamination, with no unresolved complex mixtures (UCM) observed. Table 1, 2 and 3 shows the n-alkane concentrations of selected samples from February 1996, March 1996 and May 1997. The combined concentration of the shorter chain n-alkanes was small in comparison to the total; the (11-25)/(11-33) ratios, presented in Tables 1-3, all being #0.2. This indicates a low petrogenic input in comparison to the biogenic input. These profiles were typical of all herbage samples analysed.
Polycyclic Aromatic Hydrocarbon (PAH) and n-Alkane Composition
4
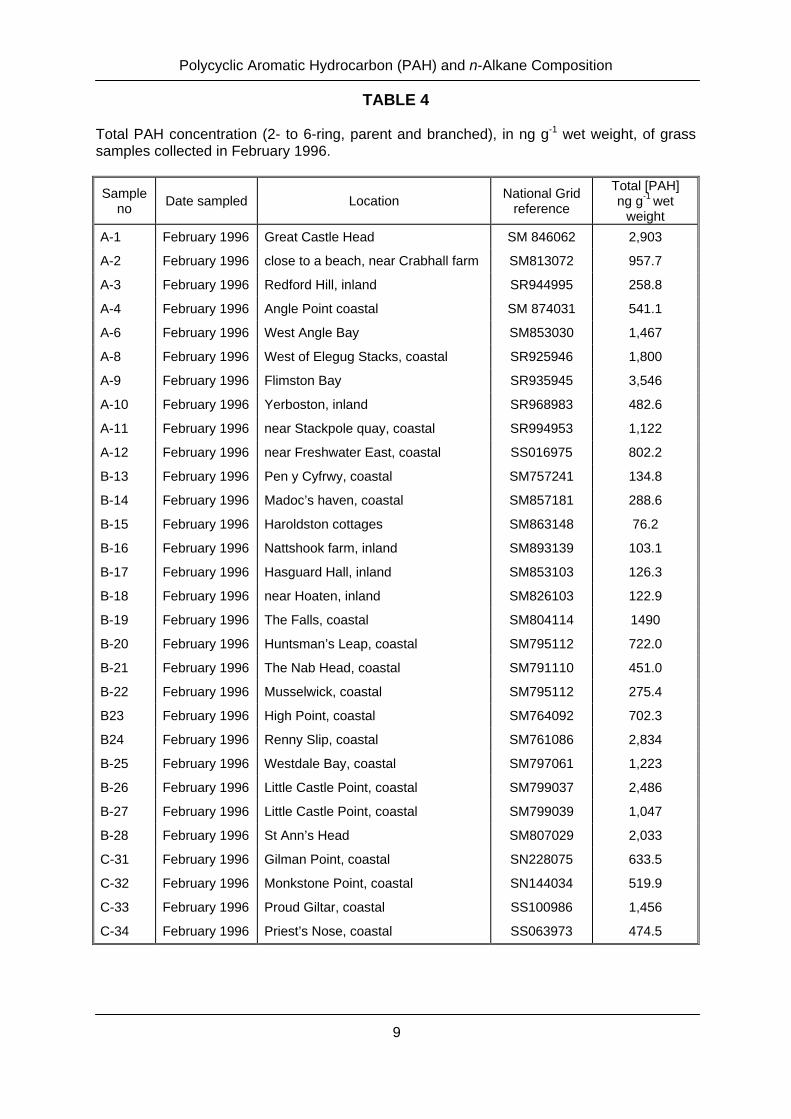
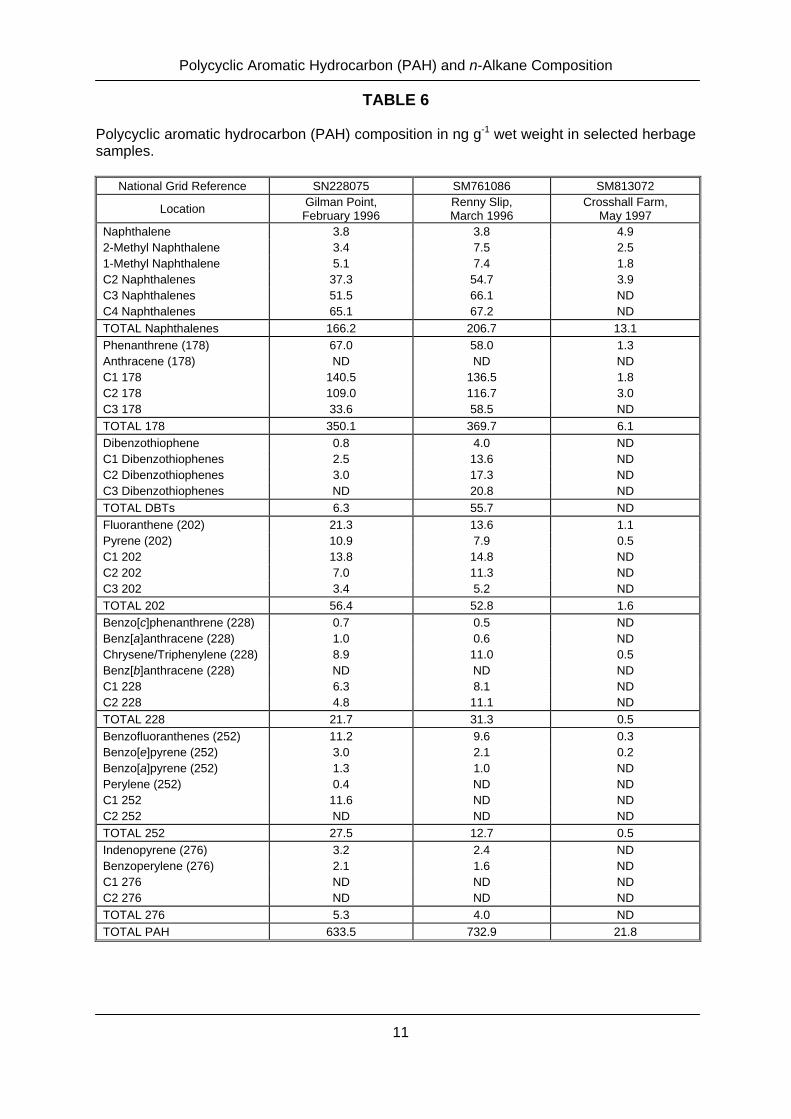
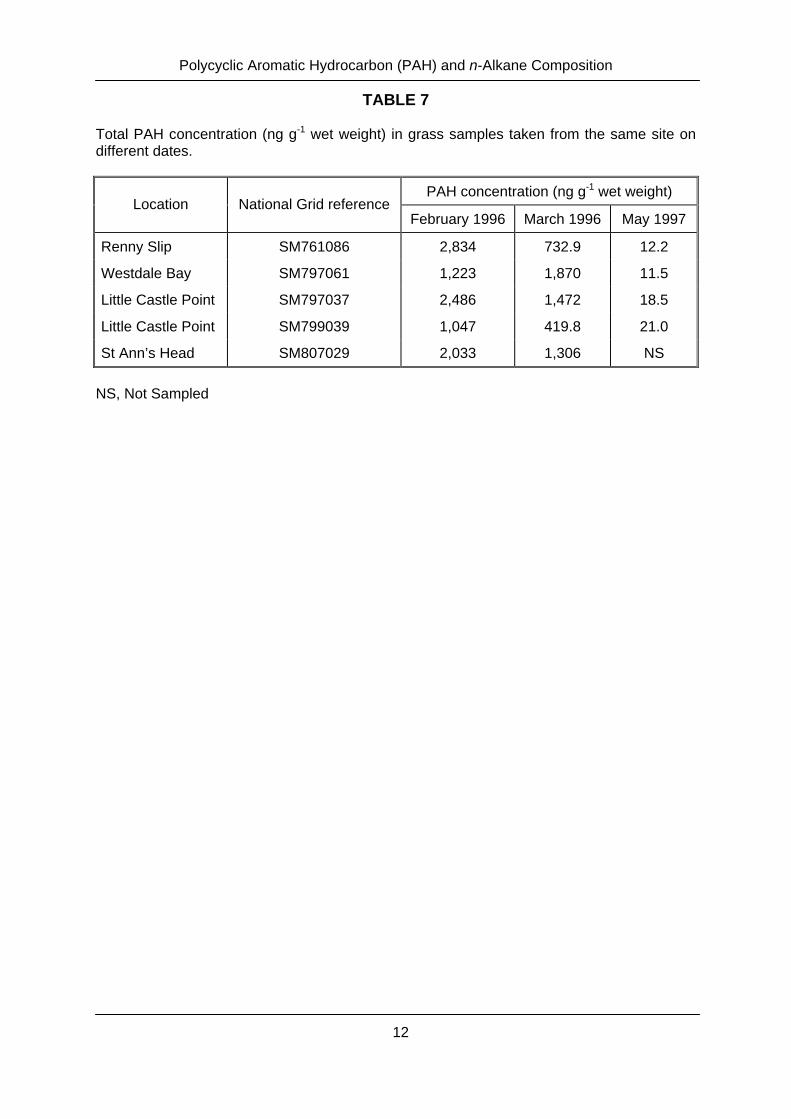
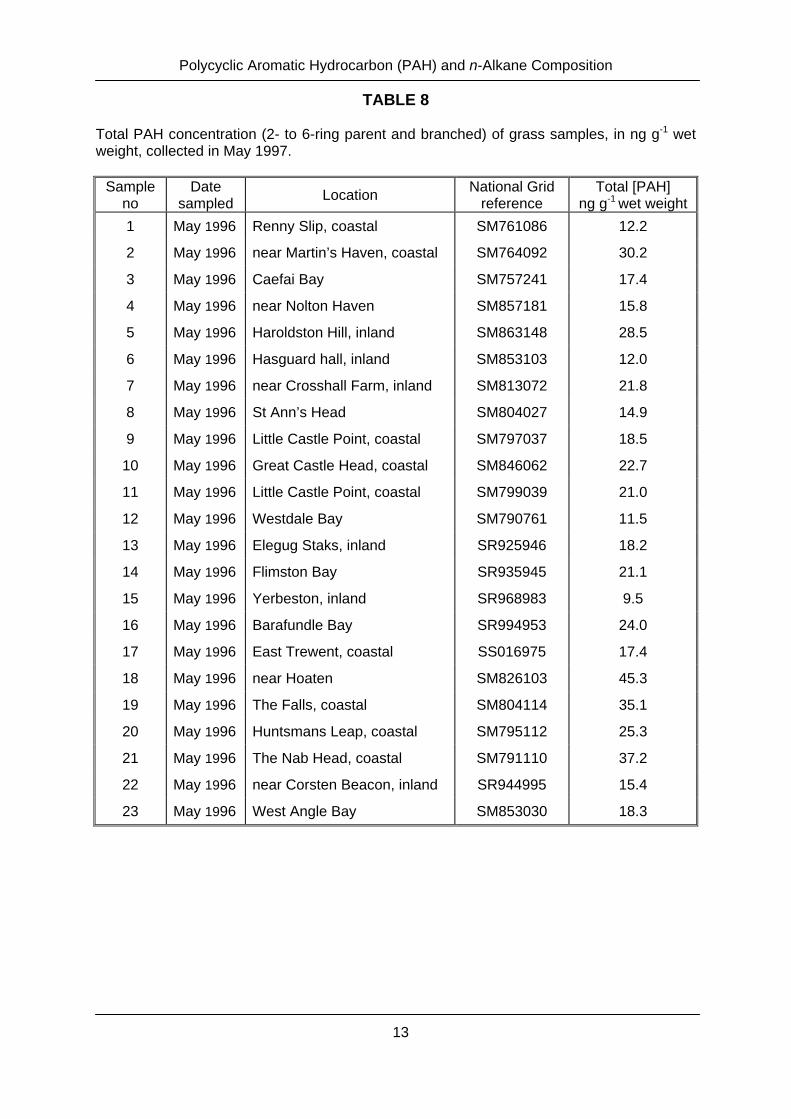
The total measured PAH concentration for the February 1996 samples varied from 76.2 ng g-1 wet weight to 3,546 ng g-1 wet weight (Table 4, Fig. 1). The former concentration was obtained for a sample collected close to Haroldston cottages in St Brides Bay while the latter was collected from the shore of Flimston Bay. Highest PAH concentrations were found in coastal areas and lower concentrations in grass collected inland (Fig. 1). Total PAH concentrations in herbage samples collected in March 1996 ranged from 325.0 to 2,500 ng g-1 wet weight (Table 5). The highest PAH concentrations were found in samples from St Ann’s Head and the lowest from Manorbier, west of Saddle Head. Four of these samples were analysed just after sampling (419.8-1,870 ng g-1 wet weight) and 18 had been stored by the Countryside Council for Wales and were analysed in August 1997 (325.0 to 2,500 ng g-1 wet weight). The PAH distribution in herbage samples collected in February and March 1996 were dominated by the more water soluble 2- and 3-ring compounds, with a much smaller contribution from the larger, 4- to 6-ring, compounds (Table 6, Fig. 3). Grass collected in March tended to have less of the naphthalenes and a higher proportion of the 3-ring (phenethrenes/anthracenes and DBTs) compounds. Five of the sites sampled in February 1996, codes B-24/D-35 to B-28/D39, were re-sampled in early March 1996. These sites were located on the coast between Renney Slip and St Ann’s Head. Four of the five sites showed a decrease in PAH concentration of between 40 and 74% (Table 7). Grass samples were again collected in May 1997. Total PAH concentrations, on this occasion, ranged from 9.5 ng g-1 wet weight to 45.3 ng g-1 wet weight (mean 21.4 ng g-1 wet weight, SD 8.9, CV% 41.5; Table 8). Four of these sites had also been previously sampled in March 96. The concentrations in these four samples were less than 25 ng g-1 wet weight (Table 7) and again the PAH distribution was dominated by the 2- and 3-ring PAHs. This was considerably less than previously observed at either site close to the point of grounding or from the coastal site around St Brides Bay. There was no readily observable pattern to the data in as much as the highest concentration (45.3 ng g-1 wet weight) was determined for sample number 18 (NGR SM826103). This is an inland site, near Hoaten, which gave a PAH concentration of 122.9 ng g-1 wet weight when sampled in February 96 (code B-18). In contrast, the coastal site NGR SM761086 (Code B-24 for February 1996 and one for May 1997; Table 7) gave a PAH concentration of 2,834 ng g-1 for February 1996 but only 12.2 ng g-1 wet weight for May 1997. A possible explanation for this is the decrease in the contamination due to weathering of the oil and seasonal variation. In February the grass will be old and have a lower water content. Surface deposition and accumulation could have occurred over the winter. The grass sampled in May will contain a lot of fresh growth, would have a higher water content and there would have been less time for atmospheric deposition. A similar trend of decreasing PAH concentration, on this occasion between April and May 1993, was found by Milne et al. (1997) during investigations into the Braer oil spill.6 They found PAH concentrations in the range 7-33 ng g-1 wet weight for grass herbage collected during May 1993. This compared with concentrations of,1-200 ng g-1 wet weight, with nine of the 50 samples containing >40 ng g-1 wet weight, for samples collected during April 1993.
CONCLUSIONS 1. Within 10 days of the oil spill grass samples taken from coastal and inland sites
showed elevated PAH levels. The highest concentrations being on exposed coasts from St Ann’s Head to Saddle Head.
2. The PAH distribution was dominated by the 2- and 3- ring compounds. The samples
collected in March showed a lower proportion of 2-ring compounds and more of the 3-ring PAHs compared to the February samples.
Polycyclic Aromatic Hydrocarbon (PAH) and n-Alkane Composition
5
3. Grass re-sampled from equivalent sites in March 1996 showed a decrease in PAH concentration of between 40% and 74%.
5. PAH concentrations in grass collected in May 1997 showed a significant decrease
with the total PAH concentrations in all samples being <46 ng g-1 wet weight. This decrease was not only a result of the weathering of the oil but due to the seasonal variation in the grass.
REFERENCES 1. Glegg, G.A., Hickman, L. and Rowland, S.J. 1999. Contamination of limpets
(Pattela vulgata) following the Sea Empress oil spill. Mar. Poll. Bull., 38, 119-225.
2. Kirby, M.F., Neall, P. and Taylor, T. 1999. EROD activity measured in flatfish from
the area of the Sea Empress oil spill. Chemosphere, 38, 2929-2949. 3. Whittle, K.J., Anderson, D.A., Mackie, P.R., Moffat, C.F., Shepherd, N.J. and
McVicar, A.H. 1997. The impact of the Braer oil on caged salmon. In: The impact of an oil spill in turbulent waters: The Braer, Davies, J.M. and Topping, G. (eds). The Stationary Office, Edinburgh, 144-160.