Polycyclic aromatic hydrocarbons in primary school environments:Levels and potential risks
Marta Oliveira a,b, Klara Slezakova a,b, Joana Madureira c, Eduardo de Oliveira Fernandes c,Cristina Delerue-Matos b, Simone Morais b,⁎, Maria do Carmo Pereira a,⁎a LEPABE, Departamento de Engenharia Química, Faculdade de Engenharia, Universidade do Porto, R. Dr. Roberto Frias, 4200-465 Porto, Portugalb REQUIMTE–LAQV, Instituto Superior de Engenharia do Porto, Instituto Politécnico do Porto, R. Dr. António Bernardino de Almeida 431, 4200-072 Porto, Portugalc Institute of Science and Innovation on Mechanical Engineering and Industrial Management, Rua Dr. Roberto Frias, 4200-465 Porto, Portugal
⁎ Corresponding authors.E-mail addresses: [email protected] (S. Morais), mcsp@
A B S T R A C T
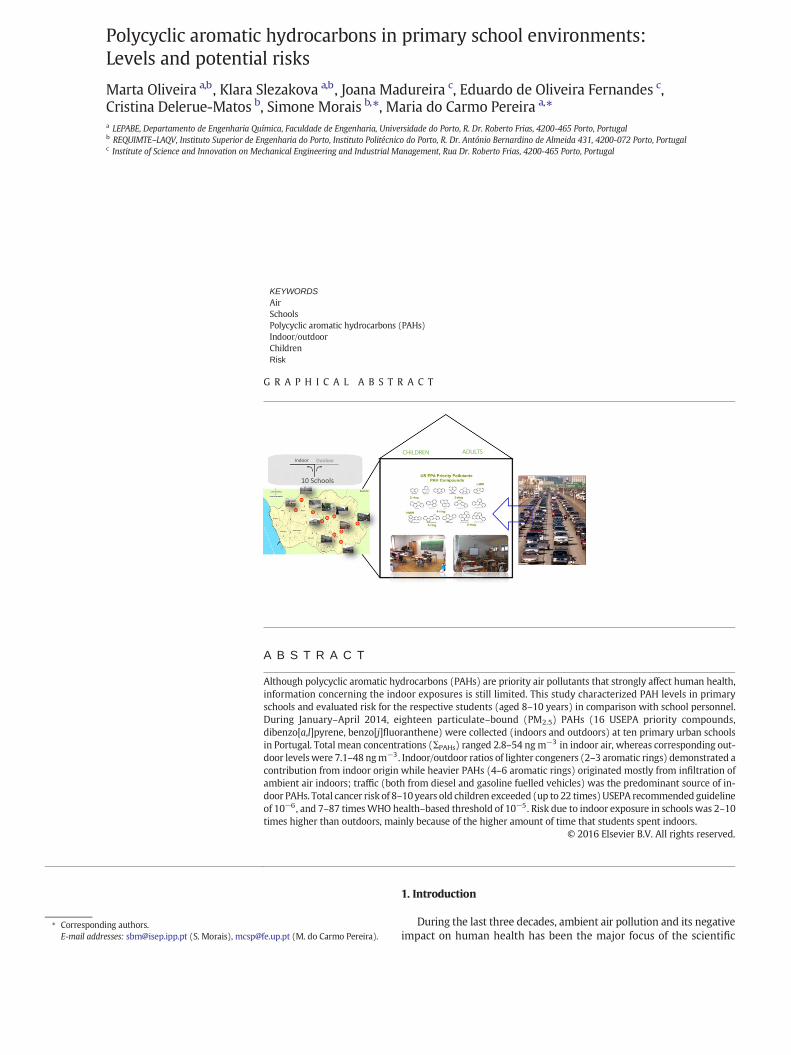
Although polycyclic aromatic hydrocarbons (PAHs) are priority air pollutants that strongly affect human health,information concerning the indoor exposures is still limited. This study characterized PAH levels in primaryschools and evaluated risk for the respective students (aged 8–10 years) in comparison with school personnel.During January–April 2014, eighteen particulate–bound (PM2.5) PAHs (16 USEPA priority compounds,dibenzo[a,l]pyrene, benzo[j]fluoranthene) were collected (indoors and outdoors) at ten primary urban schoolsin Portugal. Total mean concentrations (ΣPAHs) ranged 2.8–54 ngm−3 in indoor air, whereas corresponding out-door levelswere 7.1–48 ngm−3 . Indoor/outdoor ratios of lighter congeners (2–3 aromatic rings) demonstrated acontribution from indoor origin while heavier PAHs (4–6 aromatic rings) originated mostly from infiltration ofambient air indoors; traffic (both from diesel and gasoline fuelled vehicles) was the predominant source of in-door PAHs. Total cancer risk of 8–10 years old children exceeded (up to 22 times) USEPA recommended guidelineof 10−6 , and 7–87 timesWHO health–based threshold of 10−5 . Risk due to indoor exposure in schools was 2–10times higher than outdoors, mainly because of the higher amount of time that students spent indoors.
community. The knowledge of the health associated impacts on humanhealth as a result of indoor air pollution has been limited. Indoor air ex-posure is a complex subject and its comprehension, and subsequently,the establishment and implementation of respective guidelines inorder to assure safe indoor environments, are the key focuses of manyinternational organisations. In that regard, the World Health Organiza-tion (WHO) has designated a list of priority health–relevant indoor airpollutants (WHO, 2010) including polycyclic aromatic hydrocarbons(PAHs).
PAHs are a class of organic compounds composed of multiple aro-matic rings (Haritash and Kaushik, 2009) that are ubiquitously foundin the environment. In air, PAHs are distributed between gas phaseand particulate matter (Ma et al., 2011; Vasilakos et al., 2007); the ma-jority of particulate PAHs is though bound to fine fraction (PM2.5; i.e.aerodynamic diameter below 2.5 μm) (Slezakova et al., 2013a,b). PAHsare produced by incomplete combustion and the major anthropogenicsources include traffic, coal combustion processes, emissions frompower plants andwaste treatment, and frombiomass andwoodburning(Hanedar et al., 2014; Ravindra et al., 2008; Samburova et al., 2016;Sarigiannis et al., 2015; Slezakova et al., 2013a,b). Indoor PAHs resultfrom activities such as smoking and cooking, from various fuels and can-dle burning, as well as from penetration of outdoor emissions (by venti-lation systems, due to structural cracks, etc.) (Chen et al., 2012; Kim etal., 2011; Masih et al., 2010; Qi et al., 2014; Shen et al., 2012; Wu et al.,2015). PAHs affect organisms through various toxic actions and becauseof theirmutagenic and potentially carcinogenic properties, the U.S. Envi-ronmental Protection Agency (USEPA) classified sixteen PAHs as prioritypollutants (USEPA, 2005). Out of these, benzo[a]pyrene has been desig-nated as a human carcinogen (group 1) (IARC, 2010); when assessingcancer risk in humans it has been commonly used as a marker for thecarcinogenic PAHs (WHO, 2010). In addition, some individual PAHsare considered as persistent organic pollutants (WHO, 2013) and severalPAHs are regarded as endocrine disrupting chemicals (WHO, 2013).
In a viewof health consequences, exposure to PAHs is particularly rel-evant for children (Annesi-Maesano et al., 2007; Bae et al., 2010;Tuntawiroon et al., 2010)who are one of themost susceptible subgroupsof the population (Burtscher and Schüepp, 2012; Foos et al., 2008; Singhand Gupta, 2016). Compared to adults, children exposures to airbornepollution are larger because of their faster inhalations, increased numberof physical activities, thus allowing for larger intake of toxic compounds(Gilliland, 2009; Pohl and Abadin, 2008). Furthermore, being exposed togenotoxic carcinogenic compounds at a young agemay cause various ge-netic disruptions (such as mutations, sister chromatid exchanges, etc.)(Merlo et al., 2007; Neri et al., 2006;Wigle et al., 2007) resulting in an el-evated risk of cancer in the adult life (Carpente and Bushkin-Bedient,2013; Vedham et al., 2015). Children spend much of their daily time inschools, kindergartens, which raises the scientific interest in understand-ing the air pollution in these types of indoormicroenvironments. Becauseof the respective health impact, information concerning PAHs in schoolshas been slowly emerging but the current data is still limited. Data avail-able for primary schools (i.e. children 6–11 years old) come from a fewEuropean studies (Alves et al., 2014; Carpente and Bushkin-Bedient,2013; Cirillo et al., 2006; Jovanović et al., 2014; Krugly et al., 2014;Moshammer and Neuberger, 2003; Romagnoli et al., 2014), Asia (Jyethiet al., 2014; Ruchirawat et al., 2006, 2007; Tuntawiroon et al., 2007)and USA (Eiguren-Fernandez et al., 2007). However, the majority ofthose were typically conducted in a limited number of schools (typically1–2 schools; only two known studies used a greater number of schools,namely 5 and 6; Krugly et al., 2014; Romagnoli et al., 2014), often situat-ed just in one/same type of environment. In addition, information re-garding the risk assessments due to exposure to PAHs in primaryschools is scarce (Krugly et al., 2014) with slightly more evidence avail-able for preschool children (i.e. aged between three and five years)(Oliveira et al., 2015, 2016; Wilson et al., 2003).
This study investigates the concentrations of 16 USEPA priority PAHsanddibenzo[a,l]pyrene and benzo[j]fluoranthene at ten primary schools
representative of different urban environments (city centre, residential,industrial). The indoor PAH profiles were characterized and the influ-ence of PAHs in ambient air on their presence indoors was evaluated.Analysis of diagnostic ratios was conducted to identify potential sourcesof PAHs. Moreover, toxicity equivalency factors (TEF) and USEPA riskapproachmethod (USEPA, 2016)were used for the chronic carcinogenicrisk assessment of the subpopulations of students (8–10 years) and ofschool personnel.
2. Material and methods
2.1. Schools characterization
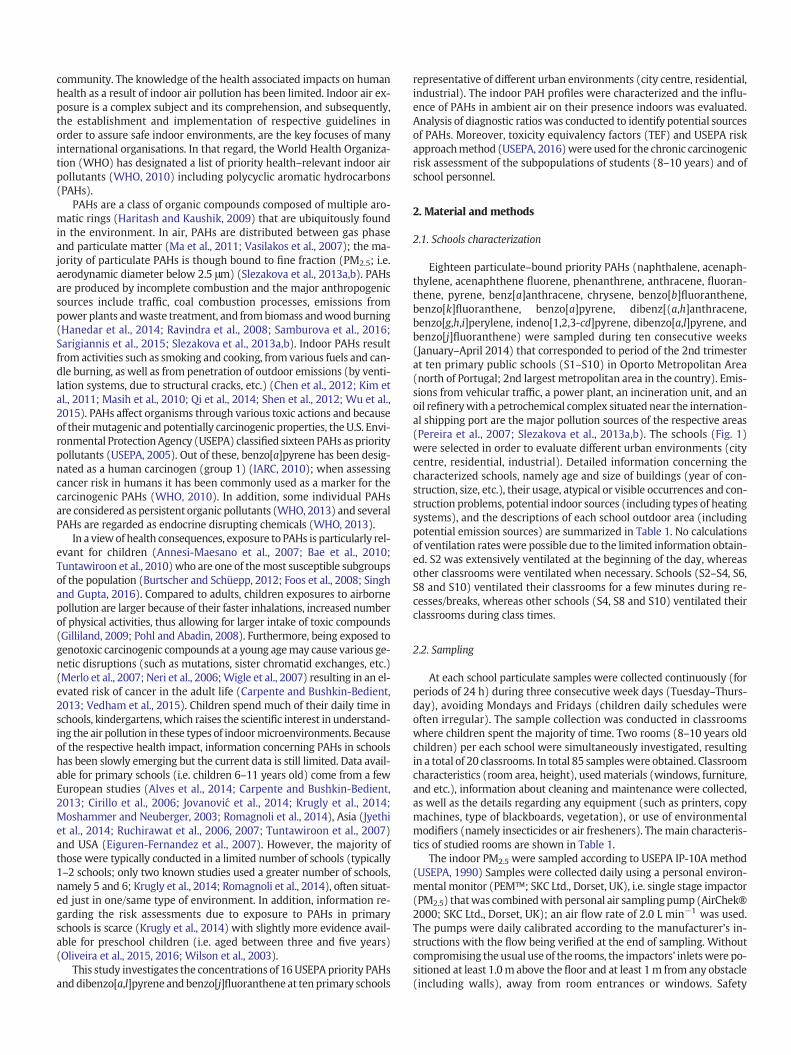
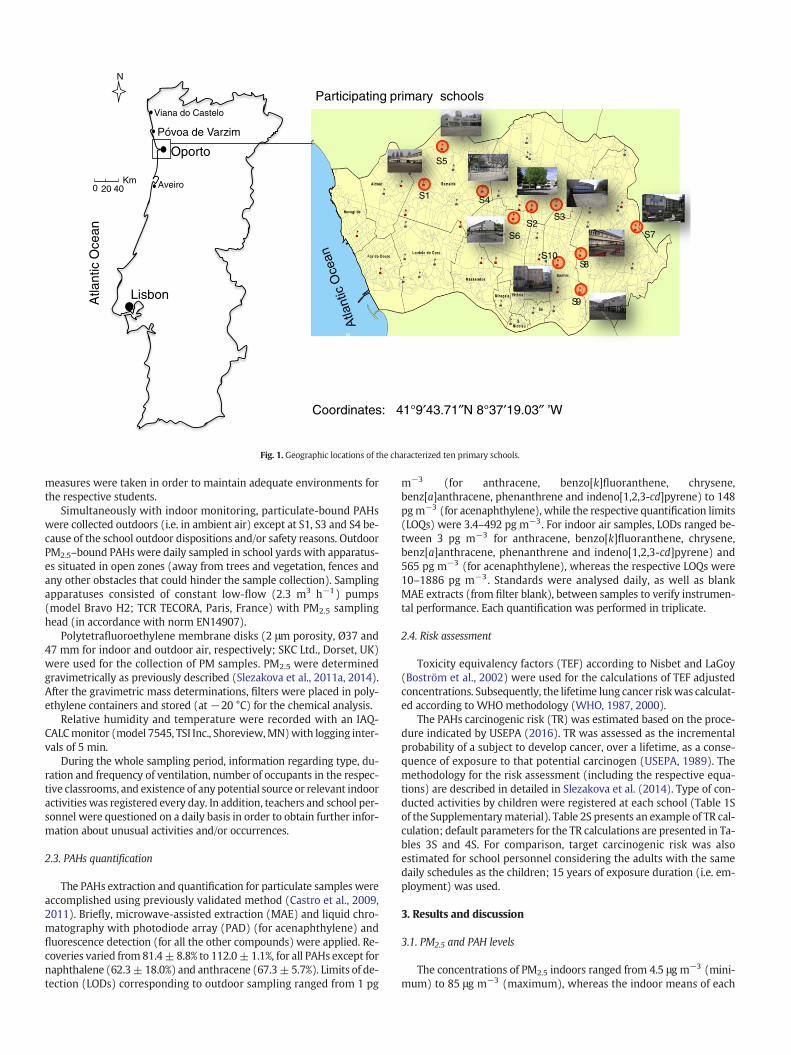
Eighteen particulate–bound priority PAHs (naphthalene, acenaph-thylene, acenaphthene fluorene, phenanthrene, anthracene, fluoran-thene, pyrene, benz[a]anthracene, chrysene, benzo[b]fluoranthene,benzo[k]fluoranthene, benzo[a]pyrene, dibenz[(a,h]anthracene,benzo[g,h,i]perylene, indeno[1,2,3-cd]pyrene, dibenzo[a,l]pyrene, andbenzo[j]fluoranthene) were sampled during ten consecutive weeks(January–April 2014) that corresponded to period of the 2nd trimesterat ten primary public schools (S1–S10) in Oporto Metropolitan Area(north of Portugal; 2nd largest metropolitan area in the country). Emis-sions from vehicular traffic, a power plant, an incineration unit, and anoil refinerywith a petrochemical complex situated near the internation-al shipping port are the major pollution sources of the respective areas(Pereira et al., 2007; Slezakova et al., 2013a,b). The schools (Fig. 1)were selected in order to evaluate different urban environments (citycentre, residential, industrial). Detailed information concerning thecharacterized schools, namely age and size of buildings (year of con-struction, size, etc.), their usage, atypical or visible occurrences and con-struction problems, potential indoor sources (including types of heatingsystems), and the descriptions of each school outdoor area (includingpotential emission sources) are summarized in Table 1. No calculationsof ventilation rates were possible due to the limited information obtain-ed. S2 was extensively ventilated at the beginning of the day, whereasother classrooms were ventilated when necessary. Schools (S2–S4, S6,S8 and S10) ventilated their classrooms for a few minutes during re-cesses/breaks, whereas other schools (S4, S8 and S10) ventilated theirclassrooms during class times.
2.2. Sampling
At each school particulate samples were collected continuously (forperiods of 24 h) during three consecutive week days (Tuesday–Thurs-day), avoiding Mondays and Fridays (children daily schedules wereoften irregular). The sample collection was conducted in classroomswhere children spent the majority of time. Two rooms (8–10 years oldchildren) per each school were simultaneously investigated, resultingin a total of 20 classrooms. In total 85 sampleswere obtained. Classroomcharacteristics (room area, height), usedmaterials (windows, furniture,and etc.), information about cleaning and maintenance were collected,as well as the details regarding any equipment (such as printers, copymachines, type of blackboards, vegetation), or use of environmentalmodifiers (namely insecticides or air fresheners). Themain characteris-tics of studied rooms are shown in Table 1.
The indoor PM2.5 were sampled according to USEPA IP-10A method(USEPA, 1990) Samples were collected daily using a personal environ-mental monitor (PEM™; SKC Ltd., Dorset, UK), i.e. single stage impactor(PM2.5) thatwas combinedwith personal air samplingpump (AirChek®2000; SKC Ltd., Dorset, UK); an air flow rate of 2.0 L min−1 was used.The pumps were daily calibrated according to the manufacturer's in-structions with the flow being verified at the end of sampling. Withoutcompromising the usual use of the rooms, the impactors' inletswere po-sitioned at least 1.0m above the floor and at least 1m from any obstacle(including walls), away from room entrances or windows. Safety
0 20 40Km
Oporto
Viana do Castelo
Póvoa de Varzim
Lisbon
N
Aveiro
Atla
ntic
Oce
an
Coordinates: 41°9′43.71″N 8°37′19.03″ ’W
Participating primary schools
S1
S5
S4
S6S2
S3
S7
S9
S8S10
Fig. 1. Geographic locations of the characterized ten primary schools.
measures were taken in order to maintain adequate environments forthe respective students.
Simultaneously with indoor monitoring, particulate-bound PAHswere collected outdoors (i.e. in ambient air) except at S1, S3 and S4 be-cause of the school outdoor dispositions and/or safety reasons. OutdoorPM2.5–bound PAHswere daily sampled in school yards with apparatus-es situated in open zones (away from trees and vegetation, fences andany other obstacles that could hinder the sample collection). Samplingapparatuses consisted of constant low-flow (2.3 m3 h−1) pumps(model Bravo H2; TCR TECORA, Paris, France) with PM2.5 samplinghead (in accordance with norm EN14907).
Polytetrafluoroethylene membrane disks (2 μm porosity, Ø37 and47 mm for indoor and outdoor air, respectively; SKC Ltd., Dorset, UK)were used for the collection of PM samples. PM2.5 were determinedgravimetrically as previously described (Slezakova et al., 2011a, 2014).After the gravimetric mass determinations, filters were placed in poly-ethylene containers and stored (at −20 °C) for the chemical analysis.
Relative humidity and temperature were recorded with an IAQ-CALCmonitor (model 7545, TSI Inc., Shoreview,MN)with logging inter-vals of 5 min.
During the whole sampling period, information regarding type, du-ration and frequency of ventilation, number of occupants in the respec-tive classrooms, and existence of any potential source or relevant indooractivities was registered every day. In addition, teachers and school per-sonnel were questioned on a daily basis in order to obtain further infor-mation about unusual activities and/or occurrences.
2.3. PAHs quantification
The PAHs extraction and quantification for particulate samples wereaccomplished using previously validated method (Castro et al., 2009,2011). Briefly, microwave-assisted extraction (MAE) and liquid chro-matography with photodiode array (PAD) (for acenaphthylene) andfluorescence detection (for all the other compounds) were applied. Re-coveries varied from 81.4± 8.8% to 112.0± 1.1%, for all PAHs except fornaphthalene (62.3±18.0%) and anthracene (67.3±5.7%). Limits of de-tection (LODs) corresponding to outdoor sampling ranged from 1 pg
m−3 (for anthracene, benzo[k]fluoranthene, chrysene,benz[a]anthracene, phenanthrene and indeno[1,2,3-cd]pyrene) to 148pgm−3 (for acenaphthylene), while the respective quantification limits(LOQs) were 3.4–492 pg m−3 . For indoor air samples, LODs ranged be-tween 3 pg m−3 for anthracene, benzo[k]fluoranthene, chrysene,benz[a]anthracene, phenanthrene and indeno[1,2,3-cd]pyrene) and565 pg m−3 (for acenaphthylene), whereas the respective LOQs were10–1886 pg m−3 . Standards were analysed daily, as well as blankMAE extracts (from filter blank), between samples to verify instrumen-tal performance. Each quantification was performed in triplicate.
2.4. Risk assessment
Toxicity equivalency factors (TEF) according to Nisbet and LaGoy(Boström et al., 2002) were used for the calculations of TEF adjustedconcentrations. Subsequently, the lifetime lung cancer riskwas calculat-ed according to WHOmethodology (WHO, 1987, 2000).
The PAHs carcinogenic risk (TR) was estimated based on the proce-dure indicated by USEPA (2016). TR was assessed as the incrementalprobability of a subject to develop cancer, over a lifetime, as a conse-quence of exposure to that potential carcinogen (USEPA, 1989). Themethodology for the risk assessment (including the respective equa-tions) are described in detailed in Slezakova et al. (2014). Type of con-ducted activities by children were registered at each school (Table 1Sof the Supplementarymaterial). Table 2S presents an example of TR cal-culation; default parameters for the TR calculations are presented in Ta-bles 3S and 4S. For comparison, target carcinogenic risk was alsoestimated for school personnel considering the adults with the samedaily schedules as the children; 15 years of exposure duration (i.e. em-ployment) was used.
3. Results and discussion
3.1. PM2.5 and PAH levels
The concentrations of PM2.5 indoors ranged from 4.5 μg m−3 (mini-mum) to 85 μg m−3 (maximum), whereas the indoor means of each
Table 1Characterization of ten studied primary schools (S1–S10) (n = 20 classrooms).
S1 S2 S3 S4 S5 S6 S7 S8 S9 S10
Location Residential area withindustrial influence
City centre City centre City centre Residential area,industrial influence
City centre Residential areasurrounded withgreens
City centre Residential area Citycentre–backgroundarea
Site characterization Urban–industrial Urban–traffic Urban–traffic Urban–traffic Urban–industrial Urban–traffic Urban–background Urban–traffic Urban–traffic Urban–trafficYear of construction 1968 1938 1959 1959 1980 1958 1963 1957 1982 1950Year of
VentilationBeginning of day no yes no no no no no no no noDuring classes no no no yes no no no yes no yesDuring brakes no yes yes yes no yes no yes no yesAfter classes no no no no no no no no no noDuring cleaning no yes yes yes yes yes yes yes yes yes
Cleaning schedule Twice per day(beginning and endof day)
Twice (beginningand end of day)
Once per day (endof day)
Once (beginning ofday)
Once per day (end ofday)
Twice per day(beginning and endof day)
Once per day(beginning of day)
Once per day (endof day)
Once per day (endof day)
Once per day (endof day)
Number of copymachine
1 1 1 3 1 1 1 1 1 2
Other Meals cooked atschool1159M.Oliveiraetal./ScienceoftheTotalEnvironment575(2017)1156–1167
school were between 9.2 and 66 μg m−3 . Levels in outdoor air rangedfrom 2.4 to 67 μg m−3 , PM2.5 means in ambient air for each schoolwere between 5.3 and 34 μg m−3 . The highest PM2.5 mean (25–67 μgm−3) in outdoor air were observed at school S2, possibly reflecting sea-sonal influences (Finardi et al., 2015) and/or local source of vehicleemissions (i.e. parking lot situated nearby). The lowest median concen-trations measured were at S9 (8.7 ± 3.6 μg m−3) and S10 5.3 ± 2.3 μgm−3) and were situated in a residential and suburban areas,respectively.
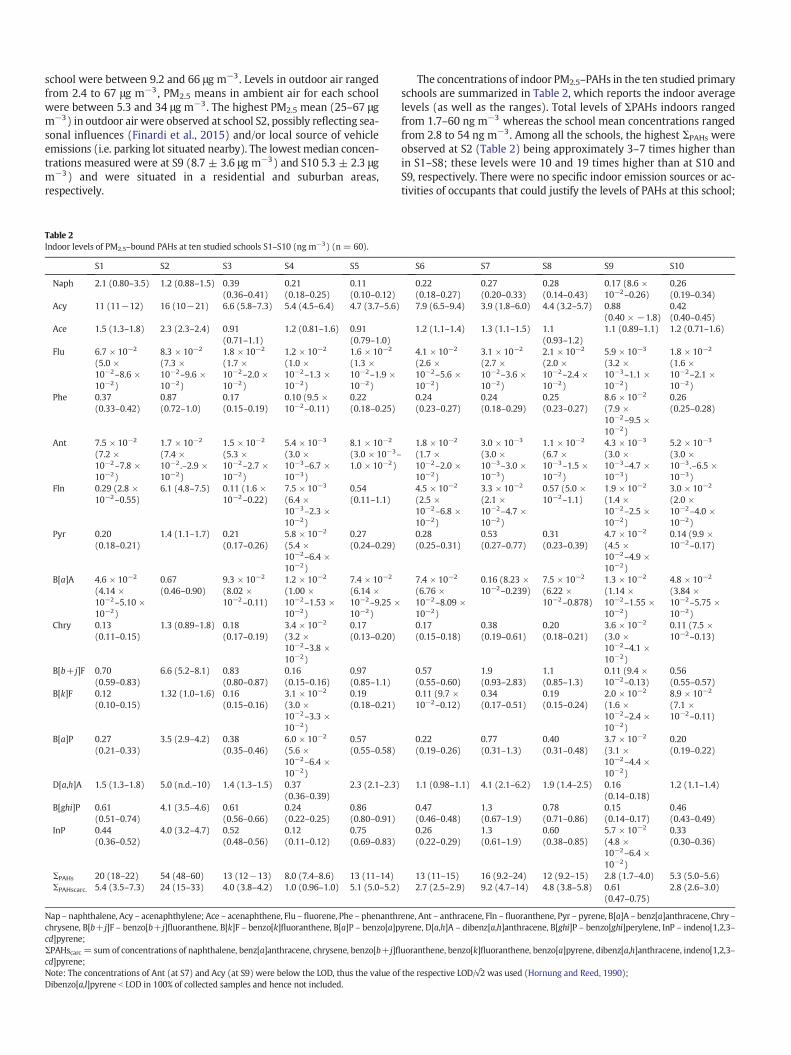
Table 2Indoor levels of PM2.5–bound PAHs at ten studied schools S1–S10 (ng m−3) (n = 60).
Nap – naphthalene, Acy – acenaphthylene; Ace – acenaphthene, Flu – fluorene, Phe – phenanthchrysene, B[b+j]F – benzo[b+j]fluoranthene, B[k]F – benzo[k]fluoranthene, B[a]P – benzo[a]pcd]pyrene;ΣPAHscarc = sum of concentrations of naphthalene, benz[a]anthracene, chrysene, benzo[b+j]flcd]pyrene;Note: The concentrations of Ant (at S7) and Acy (at S9) were below the LOD, thus the value ofDibenzo[a,l]pyrene b LOD in 100% of collected samples and hence not included.
The concentrations of indoor PM2.5–PAHs in the ten studied primaryschools are summarized in Table 2, which reports the indoor averagelevels (as well as the ranges). Total levels of ΣPAHs indoors rangedfrom 1.7–60 ng m−3 whereas the school mean concentrations rangedfrom 2.8 to 54 ng m−3 . Among all the schools, the highest ΣPAHs wereobserved at S2 (Table 2) being approximately 3–7 times higher thanin S1–S8; these levels were 10 and 19 times higher than at S10 andS9, respectively. There were no specific indoor emission sources or ac-tivities of occupants that could justify the levels of PAHs at this school;
the respective LOD/√2 was used (Hornung and Reed, 1990);
however, S2 was the only school that used heating systems during thesampling. In addition, S2 was the only school equipped with metalframedwindows (single glazed; Table 1). Itmust be though highlightedthat the highest levels of PAHs in ambient air were also observed at S2(Table 3), at the same time S2 was the only school with classroomsbeing intensively ventilated at the beginning of the day (directly beforeclasses started; Table 1). Therefore, the higher indoor levelsmight resultfrom the combination of various factors, namely from occupants' indooractivities, characteristics of the buildings/classrooms, and from infiltra-tion of outdoor particles to indoor air (by ventilations, due to inferiorbuilding isolation, etc.) as was similarly previously reported (Amato etal., 2014; Moreno et al., 2014; Rivas et al., 2014, 2015). On the contrary,theminimum indoor levels of PAHswere observed at S9 which was sit-uated in a residential area.
Overall, the data on PAHs in educational environments is ratherscarce. In addition, the available studies were conducted with differentapproaches, variation of the considered PAH congeners, and oftenPAHs analysed in different PM fractions (mainly in coarse fraction, oreven unspecified); all of these further complicate the comparisons be-tween the reported findings. As for data available for PM2.5–boundPAHs, Eiguren-Fernandez et al. (2007) reported total concentrations of15 compounds in a range of 0.4–1.8 ng m−3 in indoor air of schools inSouthern California. Analyzing the same 15 PAHs, Krugly et al. (2014)found much higher levels of PM2.5–bound PAHs (20.1–131 ng m−3) inindoor air of schools in Lithuania. With the exception to S2, the indoorlevels in schools of this study (ΣPAHs 2.8–20 ngm−3)were rather similarto schools in Rome (1.6–16 ng m−3) (Cirillo et al., 2006). Romagnoli etal. (2014) also found PM2.5–bound PAHs in similar ranges (1.8–8.3 ngm−3) in indoor air of schools (sampled during winter season).
The compositional profiles between the ten characterized schools inthis study were relatively similar. In majority of the schools (S1–S6, S8)acenaphthylene was the most (or the second most abundant at S7 andS9) indoor particulate–bound PAH. On average this compound
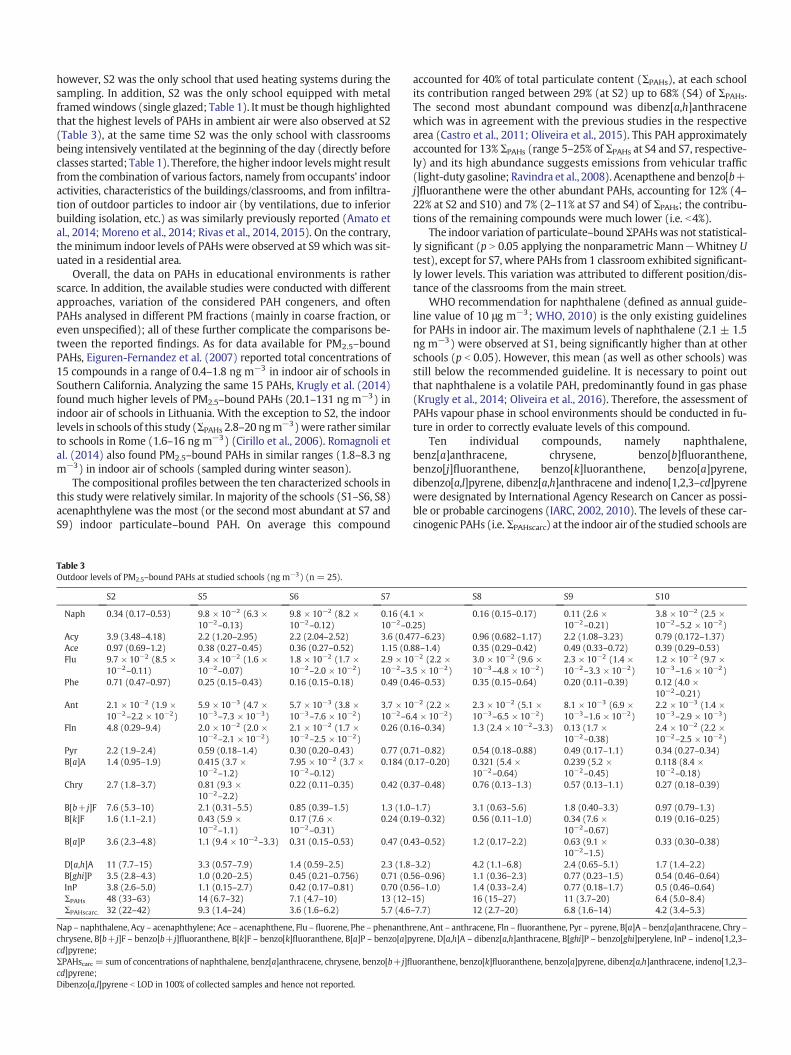
Table 3Outdoor levels of PM2.5–bound PAHs at studied schools (ng m−3) (n = 25).
Nap – naphthalene, Acy – acenaphthylene; Ace – acenaphthene, Flu – fluorene, Phe – phenanthrchrysene, B[b+j]F – benzo[b+j]fluoranthene, B[k]F – benzo[k]fluoranthene, B[a]P – benzo[a]pcd]pyrene;ΣPAHscarc = sum of concentrations of naphthalene, benz[a]anthracene, chrysene, benzo[b+j]flcd]pyrene;Dibenzo[a,l]pyrene b LOD in 100% of collected samples and hence not reported.
accounted for 40% of total particulate content (ΣPAHs), at each schoolits contribution ranged between 29% (at S2) up to 68% (S4) of ΣPAHs.The second most abundant compound was dibenz[a,h]anthracenewhich was in agreement with the previous studies in the respectivearea (Castro et al., 2011; Oliveira et al., 2015). This PAH approximatelyaccounted for 13% ΣPAHs (range 5–25% of ΣPAHs at S4 and S7, respective-ly) and its high abundance suggests emissions from vehicular traffic(light-duty gasoline; Ravindra et al., 2008). Acenapthene andbenzo[b+j]fluoranthene were the other abundant PAHs, accounting for 12% (4–22% at S2 and S10) and 7% (2–11% at S7 and S4) of ΣPAHs; the contribu-tions of the remaining compounds were much lower (i.e. b4%).
The indoor variation of particulate–boundΣPAHswas not statistical-ly significant (p N 0.05 applying the nonparametric Mann−Whitney Utest), except for S7, where PAHs from 1 classroom exhibited significant-ly lower levels. This variation was attributed to different position/dis-tance of the classrooms from the main street.
WHO recommendation for naphthalene (defined as annual guide-line value of 10 μg m−3; WHO, 2010) is the only existing guidelinesfor PAHs in indoor air. The maximum levels of naphthalene (2.1 ± 1.5ng m−3) were observed at S1, being significantly higher than at otherschools (p b 0.05). However, this mean (as well as other schools) wasstill below the recommended guideline. It is necessary to point outthat naphthalene is a volatile PAH, predominantly found in gas phase(Krugly et al., 2014; Oliveira et al., 2016). Therefore, the assessment ofPAHs vapour phase in school environments should be conducted in fu-ture in order to correctly evaluate levels of this compound.
Ten individual compounds, namely naphthalene,benz[a]anthracene, chrysene, benzo[b]fluoranthene,benzo[j]fluoranthene, benzo[k]luoranthene, benzo[a]pyrene,dibenzo[a,l]pyrene, dibenz[a,h]anthracene and indeno[1,2,3–cd]pyrenewere designated by International Agency Research on Cancer as possi-ble or probable carcinogens (IARC, 2002, 2010). The levels of these car-cinogenic PAHs (i.e. ΣPAHscarc) at the indoor air of the studied schools are
also presented in Table 2. In general, the levels in Table 2were in similarconcentration ranges to those in schools in Rome during winter(Romagnoli et al., 2014; mean ΣPAHscarc of 1.0–6.8 ng m−3); however,for spring season these authors found much lower concentrations(0.21–0.71 ngm−3). In this study, ΣPAHscarc accounted for approximate-ly 35% of ΣPAHs (range between 12% at S4 to 56% at S7). Among the car-cinogenic PAHs, dibenz[a,h]anthracene exhibited the highestcontribution at all schools accounting for approximately 36% of ΣPAHscarc
(between 21% at S2 and 45% at S7). In a view of potential health impli-cations, it is necessary to remark that at all studied schoolsdibenz[a,h]anthracene ranked among the abundant compounds evenwhen all the detected PAHs were considered. Other major carcinogenswere: benzo[b+ j]fluoranthene, that on average accounted for 23% ofΣPAHscarc (range of 13–28% at S1 and S2, respectively), andbenzo[a]pyrene (mean: 9% of ΣPAHscarc; range: 5–15% of ΣPAHscarc at S1and S2, respectively).
The levels of PAHsmonitored in ambient air of schools are presentedin Table 3. Total levels of ΣPAHs outdoors ranged from 3.7–63 ng m−3 .With the exception to S2 (range: 33–63 ng m−3; mean of 48 ng m−3),mean concentrations of PM2.5–bound PAHs in outdoor air of the Portu-guese primary schools (6.4 ng m−3 at S10–16 ngm−3 at S8) were sim-ilar to the levels reported in winter for ambient air in Rome (4.5–18 ngm−3; obtained from fixed stations of the environmental monitoringnetwork; Gatto et al., 2013) or for outdoors of schools in Rome (6.3–9.5 ng m−3; Romagnoli et al., 2014). For warmer seasons (0.21–1.3 ngm−3 in ambient air by Gatto et al., 2013; 0.42–1.7 ng m−3 reported byRomagnoli et al., 2014) and in other European countries (Lithuania;41–120 ngm−3; Krugly et al., 2014) considerably different levels of par-ticulate–bound PAHs were observed. Although there was no specificemission source that could justify the increased levels of ambientPAHs at S2, the respective sampling was conducted during a periodwith harsh meteorological conditions (causing atmospheric inversion),which could lead in overall elevated levels of pollutants in the atmo-sphere. In that regard, it is necessary to point out that levels of PAHsin air are seasonally dependent (with higher levels typically observedin winter; Finardi et al., 2015; Jedynska et al., 2014) due to a differentimpact of residential heating emissions (absent in summer), variationof PAHs degradation due to light and oxidants availability during sum-mer, and/or due to the atmospheric dispersion efficiency. In agreement,Finardi et al. (2015) reported levels of benzo[a]pyrene of 3.0 ngm−3 inwinter in outdoor air of dwellings (schools, homes, offices) in Romewhereas it was b0.1 ng m−3 for the summer season. Usingbenzo[a]pyrene as indicator of carcinogenic PAHs, the current Europeanlegislation on ambient air (Directive 2004/107/EC, 2005) sets annualtarget value of 1 ng m−3 for carcinogenic PAHs in PM10 (particulatematter with aerodynamic diameter below 10 μm). Themean concentra-tion of this PAH (averaged of all outdoor data) was 0.94± 1.18 ngm−3 ,with the 30% ofmeasurements exceeding the annual limit value. Never-theless, it is necessary to emphasize that these findings need to be im-plicated carefully as the sampling period did not include wholecalendar year (and all seasons); Finardi et al. (2015) previously demon-strated the need of continuousmonitoring of atmospheric PAH once theuse of discontinuous measurements (as currently designated in EUDirective 2004/107/EC, 2005) does not guarantee a reliable evaluationof seasonal levels (Finardi et al., 2015).
The results in Tables 2–3 also show that total PAH concentrations inoutdoor vs. indoor air of each schools were not statistically different(p b 0.05)with the exception to the S6 where indoor ΣPAHs was approx-imately twice higher than outdoors. School S6 was the only oneequipped with kitchen. Unlike the other schools, meals were directlycooked at the school premises which could result in overall higher in-door levels (in comparison to outdoors). In addition, emissions fromsome other indoor sources could also contribute to indoor levels ofPAHs. The observed potential sources were: use of heating systems,use of cleaning agents, and use of artistic supplies for children activities(such as solvents, adhesives, paints, wax and candles, etc.). PAHs
compositional profiles in ambient air were similar among the schoolsand showed some similarities to indoors. Once againdibenz[a,h]anthracene (mean of 23% of ΣPAHs; 18–28% at S7 and S10),acenaphthylene (mean of 17% of ΣPAHs; 3–32% at S8 and S6) andbenzo[b+ j]fluoranthene (15% of ΣPAHs; ranging between 10% at S7and 20% at S8) were among the most abundant compounds. Lastly, onaverage ΣPAHscarc comprised outdoors 54% of ΣPAHs (range 45–74% atS7 and S8, respectively).
3.2. Source analysis
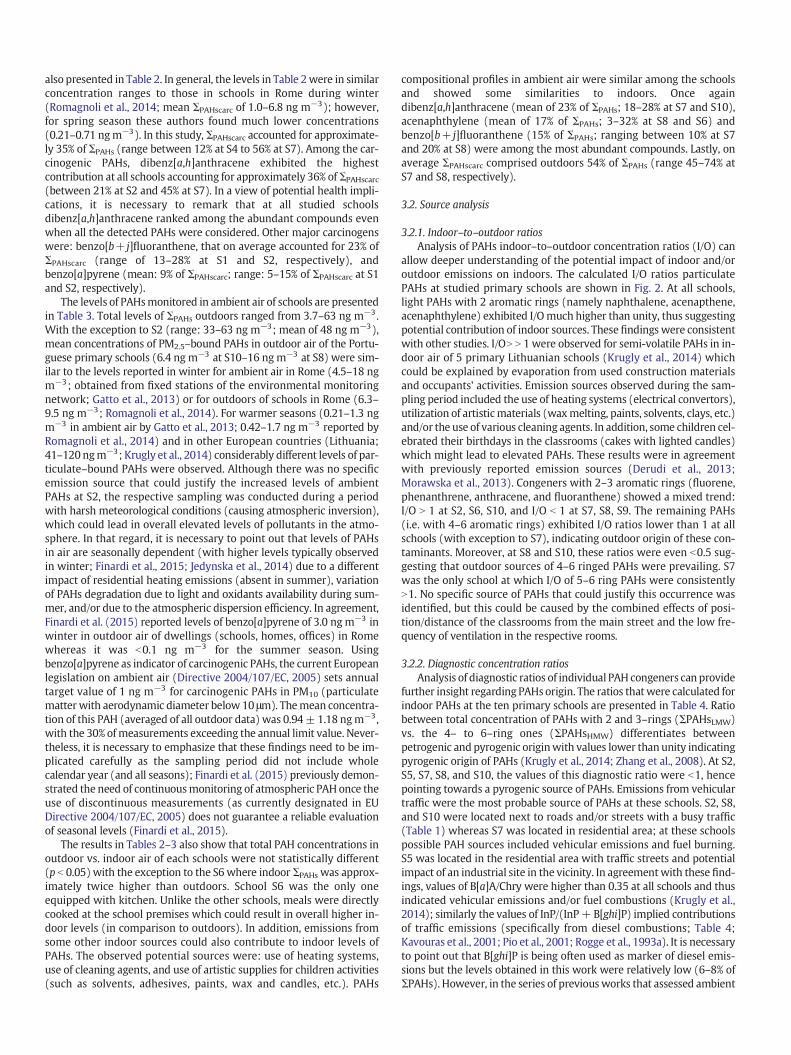
3.2.1. Indoor–to–outdoor ratiosAnalysis of PAHs indoor–to–outdoor concentration ratios (I/O) can
allow deeper understanding of the potential impact of indoor and/oroutdoor emissions on indoors. The calculated I/O ratios particulatePAHs at studied primary schools are shown in Fig. 2. At all schools,light PAHs with 2 aromatic rings (namely naphthalene, acenapthene,acenaphthylene) exhibited I/Omuch higher than unity, thus suggestingpotential contribution of indoor sources. These findings were consistentwith other studies. I/ON N 1 were observed for semi-volatile PAHs in in-door air of 5 primary Lithuanian schools (Krugly et al., 2014) whichcould be explained by evaporation from used construction materialsand occupants' activities. Emission sources observed during the sam-pling period included the use of heating systems (electrical convertors),utilization of artisticmaterials (waxmelting, paints, solvents, clays, etc.)and/or the use of various cleaning agents. In addition, some children cel-ebrated their birthdays in the classrooms (cakes with lighted candles)which might lead to elevated PAHs. These results were in agreementwith previously reported emission sources (Derudi et al., 2013;Morawska et al., 2013). Congeners with 2–3 aromatic rings (fluorene,phenanthrene, anthracene, and fluoranthene) showed a mixed trend:I/O N 1 at S2, S6, S10, and I/O b 1 at S7, S8, S9. The remaining PAHs(i.e. with 4–6 aromatic rings) exhibited I/O ratios lower than 1 at allschools (with exception to S7), indicating outdoor origin of these con-taminants. Moreover, at S8 and S10, these ratios were even b0.5 sug-gesting that outdoor sources of 4–6 ringed PAHs were prevailing. S7was the only school at which I/O of 5–6 ring PAHs were consistentlyN1. No specific source of PAHs that could justify this occurrence wasidentified, but this could be caused by the combined effects of posi-tion/distance of the classrooms from the main street and the low fre-quency of ventilation in the respective rooms.
3.2.2. Diagnostic concentration ratiosAnalysis of diagnostic ratios of individual PAH congeners can provide
further insight regarding PAHs origin. The ratios thatwere calculated forindoor PAHs at the ten primary schools are presented in Table 4. Ratiobetween total concentration of PAHs with 2 and 3–rings (ΣPAHsLMW)vs. the 4– to 6–ring ones (ΣPAHsHMW) differentiates betweenpetrogenic and pyrogenic originwith values lower than unity indicatingpyrogenic origin of PAHs (Krugly et al., 2014; Zhang et al., 2008). At S2,S5, S7, S8, and S10, the values of this diagnostic ratio were b1, hencepointing towards a pyrogenic source of PAHs. Emissions from vehiculartraffic were the most probable source of PAHs at these schools. S2, S8,and S10 were located next to roads and/or streets with a busy traffic(Table 1) whereas S7 was located in residential area; at these schoolspossible PAH sources included vehicular emissions and fuel burning.S5 was located in the residential area with traffic streets and potentialimpact of an industrial site in the vicinity. In agreementwith these find-ings, values of B[a]A/Chry were higher than 0.35 at all schools and thusindicated vehicular emissions and/or fuel combustions (Krugly et al.,2014); similarly the values of InP/(InP+ B[ghi]P) implied contributionsof traffic emissions (specifically from diesel combustions; Table 4;Kavouras et al., 2001; Pio et al., 2001; Rogge et al., 1993a). It is necessaryto point out that B[ghi]P is being often used as marker of diesel emis-sions but the levels obtained in this work were relatively low (6–8% ofΣPAHs). However, in the series of previousworks that assessed ambient
0
1
2
3
4
5
6
7
8
9
I/O
S2 S5 S6 S7
S8 S9 S10
Fig. 2. Indoor to outdoor (I/O) PM2.5–bound PAH ratios at studied schools (S1–S10).
Table 4Diagnostic ratios for indoor PM2.5–bound PAHs at the ten primary schools.
Ratio This study Value Source Reference
S1 S2 S3 S4 S5 S6 S7 S8 S9 S10
aΣPAHsLMW/ΣPAHsHMW 3.58± 0.56
0.59± 0.18
1.78± 0.16
6.39± 0.57
0.90± 0.05
2.98± 0.59
0.53± 0.14
0.99± 0.12
3.33 ±1.7
0.66± 0.14
N1 Petrogenic Zhang et al. (2008)b1 Pyrogenic
B[a]A/Chry 0.36± 0.06
0.50± 0.03
0.52± 0.04
0.37± 0.04
0.45± 0.04
0.44± 0.03
0.42± 0.01
0.39± 0.03
0.36±±0.04
0.46± 0.03
N0.35 Fuelcombustion
Krugly et al. (2014)
InP/(InP + B[ghi]P) 0.42± 0.15
0.50± 0.24
0.46± 0.24
0.33± 0.11
0.47± 0.24
0.36± 0.11
0.50± 0.19
0.43± 0.35
0.27± 0.12
0.41± 0.20
0.21–0.22 Gasolinecars
Gogou et al. (1996), Grimmer etal. (1983), Kavouras et al.(2001), Pio et al. (2001),Ravindra et al. (2008) andRogge et al. (1993a)
0.35–0.70 Dieselemissions
0.56 Coalcombustion
0.62 Woodcombustion
0.36 Road dustB[b]F/B[k]F 5.75
± 0.204.98± 0.13
5.23± 0.10
5.12± 0.23
5.03± 0.25
5.27± 0.28
5.51± 0.34
5.58± 0.22
5.67± 0.14
6.31 ±1.05
N0.5 Diesel Ravindra et al. (2008)
B[ghi]P/B[a]P 2.29± 0.17
1.15± 0.07
1.57± 0.08
3.95± 0.12
1.51± 0.07
2.09± 0.31
1.67± 0.30
1.96± 0.27
4.11 ±1.11
2.16± 0.30
1.2–2.2 Diesel cars Oda et al. (2001) and Rogge etal. (1993a, 1993b)2.5–3.3 Gasoline
cars0.86, 0.91 Road dust
B[a]P/(B[a]P + Chry) 0.67± 0.06
0.73± 0.03
0.69± 0.03
0.64± 0.01
0.77± 0.04
0.57± 0.06
0.67± 0.03
0.67± 0.04
0.51± 0.01
0.66± 0.05
0.5 Diesel Ravindra et al. (2008)0.73 Gasoline
B[a]A/(B[a]A + Chry) 0.26± 0.03
0.33± 0.01
0.34± 0.02
0.27± 0.02
0.31± 0.02
0.31± 0.01
0.30± 0.01
0.28± 0.03
0.27± 0.02
0.32± 0.03
0.40,0.38–0.64
Diesel Li and Kamens (1993), Manoliet al. (2004) and Sicre et al.(1987)0.76 Gasoline
0.43 Woodcombustion
B[b + k]F/B[ghi]P 0.89± 0.07
1.90± 0.15
1.09± 0.19
0.29± 0.05
1.19± 025
0.80± 0.07
2.15± 0.07
1.33± 0.23
0.24± 0.22
0.75± 0.11
1.60 Diesel cars Li and Kamens (1993)0.33 Gasoline
a Τotal concentration of 2– and 3–rings PAHs (ΣPAHsLMW), and 4–6–rings PAHs (ΣPAHsHMW).
PAHs and their source identification for Oporto Metropolitan Area(Castro et al., 2009; Slezakova et al., 2010, 2011b, 2013b), this congenerhas not been the predominant compound (though vehicular emissionswere identified as themajor emission source). The results instead dem-onstrated higher abundances of other traffic emission indicators, suchas dibenz[a,h]anthracene and/or benzo[b+ j]fluoranthene (Callén etal., 2013; Ravindra et al., 2008), similarly to results of the this study.
At S1, S3, S4, S6 and S9 the diagnostic ratios of ΣPAHsLMW toΣPAHsHMW were N1, suggesting petrogenic origin. These unexpectedfindings could be caused by emissions from oil refinery (combinedwith a petrochemical complex) that is located approximately 15 kmwest from the respective area. It also should be remarked that diagnos-tic ratios are merely rudimentary indicators of PAH origin (Galarneau,2008) and need to be interpreted carefully. Numerous studies havedemonstrated their limitations as their values can be altered to a differ-ent extent due to environmental degradation and phase transfers(Dvorská et al., 2011; Galarneau, 2008; Katsoyiannis et al., 2007, 2011;Tobiszewski and Namieśnik, 2012; Usenko et al., 2010). In addition, at-mospheric reactions between PAHs and other pollutants such as NOX
and O3 can have further impact on the ratios values; Ravindra et al.,2008).
The rest of diagnostic ratios (Table 4) used for indoor PAHs at tenprimary schools also pointed towards vehicular influences. The valuesof B[b]F/B[k]F N 0.5 (Ravindra et al., 2008) indicated an influence of die-sel emissions aswell as the values of B[ghi]P/B[a]Pwhichmostly rangedfrom 1.2–2.2. These results are further supported as diesel is the fuelmostly used for road transport accounting for 78.3% of the Portugueseconsumption of vehicle fuels (INE, 2014). However, other diagnostic ra-tios that were applied in order to differentiate between types of vehicleemissions (i.e. diesel versus gasoline) and the obtained findings werenot completely consistent. Values of B[a]P/(B[a]P + Chry), B[a]A/(B[a]A + Chry), and B[b+k]F/B[ghi]P (Table 4) indicated a mixed con-tribution of both types of emissions at the characterized schools. Valuesof Flu/(Flu + Pyr) can be used to distinguish between the exhausts ori-gin with values N0.5 pointing towards diesel emissionswhile ratio b 0.5indicates gasoline type (Ravindra et al., 2008). The values of this ratiowere very low (Table 4), therefore potentially indicating influence ofgasoline emissions at schools (Li and Kamens, 1993). Lastly, at all tenschools, Phe/(Phe + Ant) N 0.7 indicated emissions from lubricant oilsand/or fossil fuels (Mirante et al., 2013). Based on the applied ratiosanalysis, it is possible to assume that vehicular traffic was a significantemission source for PAHs present in indoor air, with a mixed contribu-tion from both diesel and gasoline fueled cars. In that regard it is neces-sary to emphasize the findings of a recent study by Finardi et al. (2015)which highlighted rather old technical literature concerning PAH emis-sion signatures that lacks investigations onmolecular signatures of newgeneration vehicles, biomass burning technologies, boilers and wastetreatment plants, so that the available reference values of currentlyused diagnostic ratios sometimes seem unusable to assign unequivocal-ly PAHs to specific sources.
Finally, seasonal variations of atmospheric PAHs have been previ-ously demonstrated. Using different diagnostic ratios of PAHs,Jedynska et al. (2014) identified traffic emissions (diesel and gasolinefueled vehicles) as the main source of PAHs, and wood burning as thesecond important contribution causing a higher impact at regionalbackground stations. Finardi et al. (2015) analysed several diagnosticratios and rates of their seasonal variability, allowing identification ofdifferent sourceswith a prevalent impact of residential combustion dur-ing winter and of traffic emissions in summer. However, the analysis ofdiagnostic ratios applied to indoor levels of PAHs during winter andspring season (Table 5S) did not reveal a prevailing contribution of dif-ferent emission sources for the two seasons. Nevertheless, in a view ofthe risk assessment, this study was designed to monitor PAHs duringone complete trimester of a school year, which resulted only in 1/3 ofthe data collected for the spring season. Thus, further evaluation focus-ing longer sampling of PAHs (both in ambient air and indoor area)
would be required in order to characterize in depth seasonal variationof ambient and indoor PAHs in Oporto metropolitan Area.
3.2.3. Risk analysisThe TEF–adjusted levels for 18 PAHs (indoors and outdoors) of stud-
ied schools are shown in Tables 6S and 7S, respectively.Dibenz[a,h]anthracene exhibited the second highest levels (approxi-mately between 5 and 25% to ΣPAHs in indoor air), andwas themost im-portant PAH of ΣTEF–PAHs , most likely due its high value of TEF. Onaverage dibenz[a,h]anthracene contributed 93% of both indoor (range84–95%) and outdoor (92–94%) ΣTEF–PAHs at the selected schools.Benzo[a]pyrene (that is among 18 studied PAHs the only ascertainedcarcinogen to human health) was the second most predominant PAHof ΣTEF–PAHs accounting for 3–11% at indoor and 4–6% at outdoor air.
Lung cancer risk due to total school exposure (i.e. sum of both in-doors and outdoors)was calculated according toWHO(benzo[a]pyreneunit risk value 8.7 × 10⁻⁵ per ngm−3 , considering exposure of 70 years;WHO, 2010); values ranged between 6.5 × 10⁻⁵ (at S9) and 8.7 × 10⁻⁴
(S2). Thus lung cancer risk estimated for the characterized primaryschools surpassed WHO recommended threshold of 10−5 (Boström etal., 2002), being about 7–87 times higher than the recommended guide-line. The respective values of risk though might be even higher as theywere estimated considering 6 h of indoor exposure time (as spent inclassrooms). Nevertheless, in the remaining school time (additional 1–1.5 h) children move between other school indoor microenvironments(libraries, gymnasiums, canteens, schools public halls) and the expo-sures in these places could add to overall indoor exposure to PAHs(and consequently increase the respective risk). Therefore, future as-sessment of PAH levels and risk in these school microenvironmentswould be of a great importance.
The target carcinogenic risk calculated for students of primaryschools (8–10 years old) and school personnel were assessed usingUSEPA methodology and the means are presented in Table 8S. USEPArecommends a 10−6 threshold (USEPA, 1989), nonetheless the accumu-lative carcinogenic risks should not be higher than the more restrictivelevel of 10−4 . Target risk due to indoor exposure (ΣTRIndoor) exceededthe recommended guideline at all schools with exception to S4 and S9(due to much lower levels of the respective PAH indoors; Table 2),whereas risk due to outdoor exposure (ΣTROutdoor) was below 10−6
and thus negligible at all schools. Specifically, ΣTRIndoor were 2–10times higher than ΣTROutdoor probably due to prolonged periods thatchildren spent indoors (6 h indoors in classrooms versus 1–1.25 h out-doors). Overall, ΣTRIndoor contributed 70–90% of total school risk(ΣTRSchool, i.e. sum of both indoors and outdoors). Considering thesehigh contributions of indoor risk, future studies should be conductedallowing a deeper understanding of child exposure and the health con-sequences in schools in order to develop and implement the respectiveguidelines which are essential for these environments.
The carcinogenic risk due to total (indoor and outdoor) school expo-sure was also calculated. Results in Fig. 3a show that with exceptions toS4 (absence of outdoor PAH assessment) and S9 (significantly lower, i.e.the lowest, indoor PAHs; Table 2), carcinogenic risk exceeded (up to 22times) the recommended guideline at all schools. For adults, carcino-genic risk due to total exposure exceeded (2–166 times) the recom-mended level of 10−6 at all schools (Fig. 3b), at S2 being even higherthan the more stringent guideline of 10−4 . For adult populations ofschool personnel, the risk of overall school exposure (ΣTRSchool) wereabout 8 times greater than children, probably due to the longer expo-sure duration (15 versus 2 years).
In order to decrease the overall risk of adverse health outcomes, im-proved management of (indoor) air pollution is necessary. RegardingPAHs, this implies reducing personal exposure to various indoor com-bustion sources (heaters, candles, essences and stick burning, openfire cooking) but also reduced exposure in indoor microenvironmentsnear sources such as traffic, use of protective equipment (for pollutedoccupational settings), and various interventions to modify individual
(a)
(b)
0.0E+00
5.0E-06
1.0E-05
1.5E-05
2.0E-05
2.5E-05
S1 S2 S3 S4 S5 S6 S7 S8 S9 S10
To
tal t
arg
et c
arci
no
gen
ic r
isk
Schools
8-10 years old children
Outdoor
Indoor
0.0E+00
5.0E-05
1.0E-04
1.5E-04
2.0E-04
S1 S2 S3 S4 S5 S6 S7 S8 S9 S10
To
tal t
arg
et c
arci
no
gen
ic r
isk
Schools
Adults
Outdoor
Indoor
Fig. 3. Total carcinogenic risks due to school (i.e. both indoor and outdoor) exposure: (a) for 8–10 years old children; (b) for adults. The black horizontal line identifies USEPArecommended guideline level of 10−6 .
susceptibility. It is understandable that contribution of indoor pollutantsand of those generated outdoors to personal exposures depends onmultiple factors (such as building characteristics, presence of indooremission sources and personal activities, type of pollutants, and etc.).These parameters need to be taken into the account (on individuallevels) when assessing, and reducing, the personal exposure to theseharmful pollutants (Laumbach et al., 2015).
4. Conclusions
This work provides information concerning PM2.5–bound PAHslevels and risk in primary schools environments as there is few data inliterature on this topic. Urban school situated in the most polluted site(S2) exhibited the highest levels of indoor PAHs, whereas the lowest in-door concentrations were found for a school situated in residential area(S9). I/O ratios of congeners with 2–3 aromatic rings demonstrated theinfluence of indoor emission sources whereas the occurrence of highermolecular weight PAH congeners (4–6 aromatic rings) was mainlycaused by infiltration of ambient emissions indoors. Consequently, diag-nostic ratios demonstrated emissions from vehicular fuel combustions(both of diesel and gasoline origin) as the main source of indoor partic-ulate-bound PAHs.
Total carcinogenic risk due to indoor school exposure was 2–10times higher than for outdoors, mainly due to the extended durationsof time that primary students are indoors. The risk assessment revealedthat cancer risk of 8–10 years old school children and adults exceeded(up to 22 times, and 2–166 times for children and schools staff, respec-tively) the recommended USEPA guideline; WHO health–based level of10−5 was exceeded 7–87 times, which may potentially cause negativehealth outcomes of the exposed populations. It is necessary to point
out that the risk assessment was conducted using PAH levels averagedover the period of one school trimester (i.e. 10 weeks); however, PAHlevels in air are season-dependent with winter concentrations beingtypically higher than the summer ones (Finardi et al., 2015) which re-flect on the estimated risk values and over findings of this study. Finally,the sampling approach (i.e. duration, period, choice of samplingmethodand technology) could cause some additional bias (Lewis et al., 2016).Thus future study combining the traditional and novel measures forpersonal exposures (Koehler and Peters, 2015) may provide alternatestrategies for exposure assessment and yield stronger, more precisefindings on associations with adverse health outcomes.
Ethical statement
Human subjects were not directly involved in this study. Full infor-mation about the measurements conducted in this work was providedto all students and teaching staff using the respective spaces as well asto the parents and boards of directors of all primary schools.
Acknowledgments
This work was supported by European Union (FEDER funds throughCOMPETE) and National Funds (Fundação para a Ciência e Tecnologia)through projects UID/QUI/50006/2013 and POCI-01-0145-FEDER-006939, by the FCT/MEC with national funds and co-funded by FEDERin the scope of the P2020 Partnership Agreement. Additional financialsupport was provided by Fundação para Ciência e Tecnologia throughproject PTDC/DTP-SAP/1522/2012 (ARIA: How indoor air quality can af-fect children allergies and asthma) and fellowships SFRH/BPD//105100/2014 (Klara Slezakova) and SFRH/BD/80113/2011 (Marta Oliveira).
Appendix A. Supplementary data
Supplementary data to this article can be found online at http://dx.doi.org/10.1016/j.scitotenv.2016.09.195.
References
Alves, C.A., Urban, R.C., Pegas, P.N., Nunes, T., 2014. Indoor/outdoor relationships betweenPM10 and associated organic compounds in a primary school. Aerosol Air Qual. Res.14, 86–98.
Amato, F., Rivas, I., Viana, M., Moreno, T., Bouso, L., Reche, C., Àlvarez-Pedrerol, M.,Alastuey, A., Sunyer, J., Querol, X., 2014. Sources of indoor and outdoor PM2.5 concen-trations in primary schools. Sci. Total Environ. 490, 757–765.
Annesi-Maesano, I., Moreau, D., Caillaud, D., Lavaud, F., LeMoullec, Y., Taytard, A., Pauli, G.,Charpin, D., 2007. Residential proximity fine particles related to allergic sensitisationand asthma in primary school children. Respir. Med. 101, 1721–1729.
Bae, S., Pan, X.C., Kim, S.Y., Park, K., Kim, Y.H., Kim, H., Hong, Y.C., 2010. Exposures to par-ticulate matter and polycyclic aromatic hydrocarbons and oxidative stress inschoolchildren. Environ. Health Perspect. 118, 579–583.
Boström, C.E., Gerde, P., Hanberg, A., Jernstrom, B., Johansson, C., Kyrklund, T., Rannug, A.,Tornqvist, M., Victorin, K., Westerholm, R., 2002. Cancer risk assessments, indicators,and guidelines for polycyclic aromatic hydrocarbons in the ambient air. Environ.Health Perspect. 10, 451–488.
Burtscher, H., Schüepp, K., 2012. The occurrence of ultrafine particles in the specific envi-ronment of children. Paediatr. Respir. Rev. 13, 89–94.
Callén, M.S., López, J.M., Iturmendi, A., Mastral, A.M., 2013. Nature and sources of particleassociated polycyclic aromatic hydrocarbons (PAH) in the atmospheric environmentof an urban area. Environ. Pollut. 183, 166–174.
Carpente, D.O., Bushkin-Bedient, S., 2013. Exposure to chemicals and radiation duringchildhood and risk for cancer later in life. J. Adolesc. Health 52 (5 Suppl), S21–S29.
Castro, D., Slezakova, K., Delerue–Matos, C., Alvim–Ferraz, M.C., Morais, S., Pereira, M.C.,2011. Polycyclic aromatic hydrocarbons in gas and particulate phases of indoor envi-ronment influenced by tobacco smoke: levels, phase distribution and health risks.Atmos. Environ. 45, 1799–1808.
Castro, D., Slezakova, K., Oliva–Teles, M.T., Delerue–Matos, C., Alvim–Ferraz, M.C., Morais,S., Pereira, M.C., 2009. Analysis of polycyclic aromatic hydrocarbons in atmosphericparticulate samples by microwave–assisted extraction and liquid chromatography.J. Sep. Sci. 32, 501–510.
Chen, C., Zhao, B., Zhou,W.T., Jiang, X.Y., Tan, Z.C., 2012. Amethodology for predicting par-ticle penetration factor through cracks of windows and doors for actual engineeringapplication. Build. Environ. 47, 339–348.
Cirillo, T., Montuori, P., Mainardi, P., Russo, I., Triassi, M., Amodio-Cocchieri, R., 2006.Multipathway polycyclic aromatic hydrocarbon and pyrene exposure among chil-dren living in Campania (Italy). J. Environ. Sci. Health A. Tox. Hazard Subst. Environ.Eng. 41, 2089–2107.
Derudi, M., Gelosa, S., Sliepcevich, A., Cattaneo, A., Cavallo, D., Rota, R., Nano, G., 2013.Emission of air pollutants from burning candles with different composition in indoorenvironments. Environ. Sci. Pollut. Res. 21, 4320–4330.
Directive 2004/107/EC, 2005. Directive of the European Parliament and of the council re-lating to arsenic, cadmium, mercury, nickel and polycyclic aromatic hydrocarbons inambient air. Off. J. Eur. Union L23, 3–16.
Dvorská, A., Lammel, G., Klánová, J., 2011. Use of diagnostic ratios for studying source ap-portionment and reactivity of ambient polycyclic aromatic hydrocarbons over CentralEurope. Atmos. Environ. 45, 420–427.
Eiguren-Fernandez, A., Avol, E.L., Thurairatnam, S., Hakami, M., Froines, J.R., Miguel, A.H.,2007. Seasonal influence on vapor-and particle-phase polycyclic aromatic hydrocar-bon concentrations in school communities located in southern California. AerosolSci. Technol. 41, 438–446.
Finardi, S., Radice, P., Cecinato, A., Gariazzo, C., Gherardi, M., Romagnoli, P., 2015. Seasonalvariation of PAHs concentration and source attribution through diagnostic ratiosanalysis. Urban Climate http://dx.doi.org/10.1016/j.uclim.2015.12.001 in press.
Foos, B., Marty,M., Schwartz, J., Bennett, W., Moya, J., Jarabek, A.M., Salmon, A.G., 2008. Fo-cusing on children's inhalation dosimetry and health effects for risk assessment: anintroduction. J. Toxicol. Environ. Health - Part A: Current Issues 71, 149–165.
Galarneau, E., 2008. Source specificity and atmospheric processing of airborne PAHs: im-plications for source apportionment. Atmos. Environ. 42, 8139–8149.
Gatto, M.P., Gariazzo, C., Gordiani, A., L'Episcopo, N., Gherardi, M., 2013. Children and el-ders exposure assessment to particle-bound polycyclic aromatic hydrocarbons(PAHs) in the city of Rome Italy. Environ. Sci. Pollut. Res. 21, 13152–13159.
Gilliland, F.D., 2009. Outdoor air pollution, genetic susceptibility, and asthma manage-ment: opportunities for intervention to reduce the burden of asthma. Pediatrics123 (Suppl. 3), S168–S173.
Gogou, A., Stratigakis, N., Kanakidou, M., Stefanou, E.G., 1996. Organic aerosols in EasternMediterranean: components source reconciliation by using molecular markers andatmospheric back trajectories. Org. Geochem. 25, 79–96.
Grimmer, G., Jacob, J., Naujack, K.W., Dettbarn, G., 1983. Determination of polycyclic aro-matic compounds emitted from brown-coal-fired residential stoves by gas chroma-tography/gas spectrometry. Anal. Chem. 55, 892–900.
Hanedar, A., Alp, K., Kaynak, B., Avşar, E., 2014. Toxicity evaluation and source apportion-ment of polycyclic aromatic hydrocarbons (PAHs) at three stations in Istanbul, Tur-key. Sci. Total Environ. 488–489, 437–446.
Haritash, A.K., Kaushik, C.P., 2009. Biodegradation aspects of polycyclic aromatic hydro-carbons (PAHs): a review. J. Hazard. Mater. 169 (1–3), 1–15.
Hornung, R.W., Reed, L.D., 1990. Estimation of average concentration in the presence ofnondetectable values. Appl. Occup. Environ. Hyg. 5, 46–51.
IARC Working Group on the Evaluation of Carcinogenic Risks to Humans, 2002s. Sometraditional herbal medicines, some mycotoxins, naphthalene and styrene. IARCMonogr. Eval. Carcinog. Risks Hum. 82, 1–556.
IARC Working Group on the Evaluation of Carcinogenic Risks to Humans (IARC), 2010s.Some non-heterocyclic polycyclic aromatic hydrocarbons and some related expo-sures. IARC Monogr. Eval. Carcinog. Risks Hum. 92, 1–853.
Instituto Nacional de Estatística (INE), 2014. Statistical Yearbook of Portugal 2013.Instituto Nacional de Estatística, I.P, Lisbon, Portugal.
Jedynska, A., Hoek, G., Eeftens, M., Cyrysc, J., Keuken, M., Ampe, C., Beelen, R., Cesaroni, G.,Forastiere, F., Cirach, M., de Hoogh, K., De Nazelleg, A., Madsen, C., Declercq, C.,Eriksen, K.T., Katsouyanni, K., Makarem, A.H., Lanki, T., Meliefste, K.,Nieuwenhuijsen, M., Oldenwening, M., Pennanen, A., Raaschou-Nielsen, O.,Brunekreef, B., Kooter, I.M., 2014. Spatial variations of PAH, hopanes/steranes andEC/OC concentrations within and between European study areas. Atmos. Environ.87, 239–248.
Jovanović, M., Vučićević, B., Turanjanin, V., Živković, M., Spasojević, V., 2014. Investigationof indoor and outdoor air quality of the classrooms at a school in Serbia. Energy 77,42–48.
Jyethi, D.S., Khillare, P.S., Sarkar, S., 2014. Risk assessment of inhalation exposure to poly-cyclic aromatic hydrocarbons in school children. Environ. Sci. Pollut. Res. 21,366–378.
Katsoyiannis, A., Sweetman, A.J., Jones, K.C., 2011. PAHmolecular diagnostic ratios appliedto atmospheric sources: a critical evaluation using two decades of source inventoryand air concentration data from the UK. Environ. Sci. Technol. 45, 8897–8906.
Katsoyiannis, A., Terzi, E., Cai, Q.-Y., 2007. On the use of PAHmolecular diagnostic ratios insewage sludge for the understanding of the PAH sources. Is this use appropriate?Chemosphere 69, 1337–1339.
Kavouras, I.G., Koutrakis, P., Tsapakis, M., Lagoudaki, E., Stephanou, E.G., Von Baer, D.,Oyola, P., 2001. Source apportionment of urban particulate aliphatic and polynucleararomatic hydrocarbons (PAHs) using multivariate methods. Environ. Sci. Technol. 35,2288–2294.
Kim, K.H., Pandey, S.K., Kabir, E., Susaya, J., Brown, R.J.C., 2011. Themodern paradox of un-regulated cooking activities and indoor air quality. J. Hazard. Mater. 195, 1–10.
Koehler, K.A., Peters, A., 2015. New methods for personal exposure monitoring for air-borne particles. Curr. Environ. Health Rep. 2, 399–411.
Krugly, E., Martuzevicius, D., Sidaraviciute, R., Ciuzas, D., Prasauskas, T., Kauneliene, V.,Stasiulaitiene, I., Kliucininkas, L., 2014. Characterization of particulate and vaporphase polycyclic aromatic hydrocarbons in indoor and outdoor air of primary schools.Atmos. Environ. 82, 298–306.
Laumbach, R., Meng, O., Kipen, H., 2015. What can individuals do to reduce personalhealth risks from air pollution? J. Thorac. Dis. 7, 96–107.
Lewis, A.C., Lee, J.D., Edwards, P.M., Shaw, M.D., Evans, M.J., Moller, S.J., Smith, K.R.,Buckley, J.W., Ellis, M., Gillot, S.R., White, A., 2016. Evaluating the performance oflow cost chemical sensors for air pollution research. Faraday Discuss. 189, 85–103.
Li, C.K., Kamens, R.M., 1993. The use of polycyclic aromatic hydrocarbons as source signa-tures in receptor modelling. Atmos. Environ. 27, 523–532.
Ma, W.L., Sun, D.Z., Shen, W.G., Yang, M., Qi, H., Liu, L.Y., Shen, J.M., Li, Y.F., 2011. Atmo-spheric concentrations, sources and gas-particle partitioning of PAHs in Beijingafter the 29th Olympic Games. Environ. Pollut. 159 (7), 1794–18001.
Manoli, E., Kouras, A., Samara, C., 2004. Profile analysis of ambient and source emittedparticle-bound polycyclic aromatic hydrocarbons from three sites in northern Greece.Chemosphere 56, 867–878.
Masih, J., Masih, A., Kulshrestha, A., Singhvi, R., Taneja, A., 2010. Characteristics of polycy-clic aromatic hydrocarbons in indoor and outdoor atmosphere in the north centralpart of India. J. Hazard. Mater. 177, 190–198.
Merlo, D.F., Ceppi, M., Stagi, E., Bocchini, V., Sram, R.J., Rössner, P., 2007. 7. Toxicol. Lett.172 (1–2), 60–67.
Mirante, F., Alves, C., Pio, C., Pindado, O., Perez, R., Revuelta, M.A., Artiñano, B., 2013. Or-ganic composition of size segregated atmospheric particulate matter, during summerand winter sampling campaigns at representative sites in Madrid, Spain. Atmos. Res.132–133, 345–361.
Morawska, L., Afshari, A., Bae, G.N., Buonanno, G., Chao, C.Y.H., Hänninen, O., Hofmann, O.,Isaxon, C., Jayaratne, E.R., Pasanen, P., Salthammer, P.,Waring, M.,Wierzbicka, A., 2013.Indoor aerosols: from personal exposure to risk assessment. Indoor Air 23, 462–487.
Moreno, T., Rivas, I., Bouso, L., Viana, M., Jones, T., Àlvarez-Pedrerol, M., Andrés Alastuey,A., Sunyer, J., Querol, X., 2014. Variations in school playground and classroom atmo-spheric particulate chemistry. Atmos. Environ. 91, 162–171.
Moshammer, H., Neuberger, M., 2003. The active surface of suspended particles as a pre-dictor of lung function and pulmonary symptoms in Austrian school children. Atmos.Environ. 37, 1737–1744.
Neri, M., Bonassi, S., Knudsen, L.E., Sram, R.J., Holland, N., Ugolini, D., Merlo, D.F., 2006.Children's exposure to environmental pollutants and biomarkers of genetic damage.I. Overview and critical issues. Mutat. Res. Rev. Mutat. Res. 612 (1), 1–13.
Oda, J., Nomura, S., Yasuhara, A., Shibamoto, T., 2001. Mobile sources of atmospheric poly-cyclic aromatic hydrocarbons in a roadway tunnel. Atmos. Environ. 35, 4819–4827.
Oliveira, M., Slezakova, K., Delerue-Matos, C., Pereira, M.C., Morais, S., 2015. Exposure topolycyclic aromatic hydrocarbons and assessment of potential risks in preschool chil-dren. Environ. Sci. Pollut. Res. 22 (18), 13892–13902.
Oliveira, M., Slezakova, K., Delerue-Matos, C., Pereira, M.C., Morais, S., 2016. Assessment ofpolycyclic aromatic hydrocarbons in indoor and outdoor air of preschool environ-ments (3–5 years old children). Environ. Pollut. 208, 382–394.
Pereira, M.C., Santos, R.C., Alvim-Ferraz, M.C.M., 2007. Air quality improvements using Eu-ropean environment policies: a case study of SO2 in a coastal region in Portugal.J. Toxicol. Environ. Health - Part A: Current Issues 70, 347–351.
Pio, C.A., Alves, C.A., Duarte, A.C., 2001. Identification, abundance and origin of atmospher-ic organic particulate matter in a Portuguese rural area. Atmos. Environ. 35,1365–1375.
Pohl, H.R., Abadin, H.G., 2008. Chemical mixtures: evaluation of risk for child specific ex-posures in a multi-stressor environment. Toxicol. Appl. Pharmacol. 233, 116–125.
Qi, H., Li, W.L., Zhu, N.Z., Ma, W.L., Liu, L.Y., Zhang, F., Li, Y.F., 2014. Concentrations andsources of polycyclic aromatic hydrocarbons in indoor dust in China. Sci. Total Envi-ron. 491–492, 100–107.
Ravindra, K., Sokhi, R., Grieken, R.V., 2008. Atmospheric polycyclic aromatic hydrocar-bons: source attribution, emission factors and regulation. Atmos. Environ. 42,2895–2921.
Rivas, I., Viana, M., Moreno, T., Bouso, L., Pandolfi, M., Àlvarez-Pedrerol, M., Forns, J.,Alastuey, A., Sunyer, J., Querol, X., 2015. Outdoor infiltration and indoor contributionof UFP and BC, OC, secondary inorganic ions and metals in PM2.5 in schools. Atmos.Environ. 106, 129–138.
Rivas, I., Viana, M., Moreno, T., Pandolfi, M., Amato, F., Reche, C., Bouso, L., Àlvarez-Pedrerol, M., Alastuey, A., Sunyer, J., Querol, X., 2014. Child exposure to indoor andoutdoor air pollutants in schools in Barcelona, Spain. Environ. Int. 69, 200–212.
Romagnoli, P., Balducci, C., Perilli, M., Gherardi, M., Gordiani, A., Gariazzo, C., Gatto, M.P.,Cecinato, A., 2014. Indoor PAHs at schools, homes and offices in Rome, Italy. Atmos.Environ. 92, 51–59.
Ruchirawat, M., Navasumrit, P., Settachan, D., Autrup, H., 2006. Environmental impacts onchildren's health in Southeast Asia: genotoxic compounds in urban air. Ann. N. Y.Acad. Sci. 1076, 678–690.
Ruchirawat, M., Settachan, D., Navasumrit, P., Tuntawiroon, J., Autrup, H., 2007. Assess-ment of potential cancer risk in children exposed to urban air pollution in Bangkok,Thailand. Toxicol. Lett. 168, 200–209.
Samburova, V., Connolly, J., Gyawali, M., Yatavelli, R.L.N., Watts, A.C., Chakrabarty, R.K.,Zielinska, B., Moosmüller, H., Khlystov, A., 2016. Polycyclic aromatic hydrocarbonsin biomass-burning emissions and their contribution to light absorption and aerosoltoxicity. Sci. Total Environ. 568, 391–401.
Sarigiannis, D.A., Karakitsios, S.P., Zikopoulos, D., Nikolaki, S., Kermenidou, M., 2015. Lungcancer risk from PAHs emitted from biomass combustion. Environ. Res. 137,147–156.
Shen, G., Wei, S., Zhang, Y., Wang, R., Wang, B., Li, W., Shen, H., Huang, Y., Chen, Y., Chen,H., Wei, W., Tao, S., 2012. Emission of oxygenated polycyclic aromatic hydrocarbonsfrom biomass pellet burning in a modern burner for cooking in China. Atmos. Envi-ron. 60, 234–237.
Sicre, M.A., Marty, J.C., Saliot, A., Aparicio, X., Grimalt, J., Albaiges, S., 1987. Aliphatic andaromatic hydrocarbons in different sized aerosols over theMediterranean Sea: occur-rence and origin. Atmos. Environ. 21, 2247–2259.
Singh, D.K., Gupta, T., 2016. Effect through inhalation on human health of PM1 boundpolycyclic aromatic hydrocarbons collected from foggy days in northern part ofIndia. J. Hazard. Mater. 306, 257–268.
Slezakova, K., Castro, D., Begonha, A., Delerue-Matos, C., Alvim-Ferraz, M.C., Morais, S.,Pereira, M.C., 2011b. Air pollution from traffic emissions in Oporto, Portugal: healthand environmental implications. Microchem. J. 99, 51–59.
Slezakova, K., Castro, D., Delerue-Matos, C., Alvim-Ferraz, M.C.M., Morais, S., Pereira, M.C.,2013a. Impact of vehicular traffic emissions on particulate-bound PAHs: levels andassociated health risks. Atmos. Res. 127, 141–147.
Slezakova, K., Castro, D., Delerue-Matos, C., Morais, S., Pereira, M.C., 2014. Levels and risksof particulate-bound PAHs in indoor air influenced by tobacco smoke: a field mea-surement. Environ. Sci. Pollut. Res. 21, 4492–4501.
Slezakova, K., Castro, D., Pereira, M.C., Morais, S., Delerue-Matos, C., Alvim-Ferraz, M.C.,2010. Influence of traffic emissions on the carcinogenic polycyclic aromatic hydrocar-bons in outdoor breathable particles. J. Air Waste Manage. Assoc. 60, 393–401.
Slezakova, K., Pires, J.C.M., Castro, D., Alvim-Ferraz, M.C.M., Delerue-Matos, C., Morais, S.,Pereira, M.C., 2013b. PAH air pollution at a Portuguese urban area: carcinogenicrisks and sources identification. Environ. Sci. Pollut. Res. 20 (6), 3932–3945.
Slezakova, K., Pires, J.C.M., Martins, F.G., Pereira, M.C., Alvim-Ferraz, M.C., 2011a. Identifi-cation of tobacco smoke components in indoor breathable particles by SEM–EDS.Atmos. Environ. 45, 863–872.
Tobiszewski, M., Namieśnik, J., 2012. PAH diagnostic ratios for the identification of pollu-tion emission sources. Environ. Pollut. 162, 110–119.
Tuntawiroon, J., Mahidol, C., Navasumrit, P., Autrup, H., Ruchirawat, M., 2007. Increasedhealth risk in Bangkok children exposed to polycyclic aromatic hydrocarbons fromtraffic-related sources. Carcinogenesis 28, 816–822.
Tuntawiroon, J., Mahidol, C., Navasumrit, P., Autrup, H., Ruchirawat, M., 2010. Increasedhealth risk in Bangkok children exposed to polycyclic aromatic hydrocarbons fromtraffic-related sources. Carcinogenesis 28, 816–822.
U.S. Environmental Protection Agency (USEPA), 1989. Risk Assessment Guidance forSuperfund, Vol. I: Human Health Evaluation Manual EPA/540/1–89/002 Office ofEmergency and Remedial Response, Washington, DC.
U.S. Environmental Protection Agency (USEPA), 1990. Compendium of Methods for theDetermination of Air Pollutants in Indoor Air. Atmospheric Research and ExposureAssessment Laboratory, Research Triangle Park, NC.
U.S. Environmental Protection Agency (USEPA), 2005. Guidelines for Carcinogen Risk As-sessment, EPA/630/P-03/001F. US Environmental Protection Agency, Washington,D.C. http://www.epa.gov/raf/publications/pdfs/CANCER_GUIDELINES_FINAL_3-25-05.pdf.
U.S. Environmental Protection Agency (USEPA), 2016. Risk–based concentration table.retrieved from http://www.epa.gov/reg3hwmd/risk/human/rb-concentration_table/usersguide.htm accessed in February 2016.
Usenko, S.L., Massey Simonich, K.J., Haggeman, J.E., Schrlau, L., Geiser, D.H., Campbell,A.P.G., Landers, D.H., 2010. Sources and deposition of polycyclic aromatic hydrocar-bons to western U.S. National Parks. Environ. Sci. Technol. 44, 4512–4518.
Vasilakos, C., Levi, N., Maggos, T., Hatzianestis, J., Michopoulos, J., Helmis, C., 2007. Gas–particle concentration and characterization of sources of PAHs in the atmosphere ofa suburban area in Athens, Greece. J. Hazard. Mater. 140, 45–51.
Vedham, V., Verma, M., Mahabir, S., 2015. Early-life exposures to infectious agents andlater cancer development. Cancer Medicine 4 (12), 1908–1922.
Wigle, D.T., Arbuckle, T.E., Walker, M., Wade, M.G., Liu, S., Krewski, D., 2007. Environmen-tal hazards: evidence for effects on child health. J. Toxicol. Environ. Health - Part B:Critical Reviews 10 (1–2), 3–39.
Wilson, N.K., Chuang, J.C., Lyu, C., Menton, R., Morgan, M.K., 2003. Aggregate exposures ofnine preschool children to persistent organic pollutants at day care and at home.J. Expo. Anal. Environ. Epidemiol. 13, 187–202.
World Health Organization, 2000. Air Quality Guidelines for Europe. 2nd edition. WHORegional Office for Europe, Copenhagen, Denmarkr.
World Health Organization (WHO), 1987. Air Quality Guidelines for Europe. WHO Re-gional Office for Europe, Copenhagen, Denmark.
World Health Organization (WHO), 2010. WHO Guidelines for Indoor Air Quality: Select-ed Pollutants. Regional Office for Europe of the World Health Organization, Copenha-gen, Denmark.
World Health Organization (WHO), 2013. State of the Science of Endocrine DisruptingChemicals 2012. United Nations Environment Programme and the World Health Or-ganization, Geneva.
Wu, F., Liu, X., Wang, W., Man, Y.B., Chan, C.Y., Liu, W., Tao, S., Wong, M.H., 2015. Charac-terization of particulate-bound PAHs in rural households using different types of do-mestic energy in Henan Province, China. Sci. Total Environ. 536, 840–846.
Zhang, W., Zhang, S., Wan, C., Yue, D., Ye, Y., Wang, X., 2008. Source diagnostics of polycy-clic aromatic hydrocarbons in urban road runoff, dust, rain and canopy through fall.Environ. Pollut. 153, 594–601.


![Polycyclic aromatic hydrocarbons (PAH) guidance · Polycyclic aromatic hydrocarbons (Benzo[a]pyrene) General Information Key Points Identity The term polycyclic aromatic hydrocarbons](https://static.documents.pub/doc/80x56/5af498db7f8b9a8d1c8c6b2b/polycyclic-aromatic-hydrocarbons-pah-guidance-aromatic-hydrocarbons-benzoapyrene.jpg)


