Polyethylene-based nanocomposites containing organoclay: A newapproach to enhance gas barrier via multilayer coextrusion andinterdiffusion
Jeremy J. Decker a, Kevin P. Meyers a, Donald R. Paul b, David A. Schiraldi c, Anne Hiltner c,Sergei Nazarenko a, *
a School of Polymers and High Performance Materials, The University of Southern Mississippi, Hattiesburg, MS 39406, United Statesb Department of Chemical Engineering and Texas Materials Institute, University of Texas at Austin, Austin, TX 78712, United Statesc Department of Macromolecular Science and Engineering, Case Western Reserve University, Cleveland, OH 44106, United States
a r t i c l e i n f o
Article history:Received 26 September 2014Received in revised form15 January 2015Accepted 25 January 2015Available online 3 February 2015
Keywords:PolyethyleneNanocompositesClay
* Corresponding author. Tel.: þ1 601 266 5967; faxE-mail address: [email protected] (S. Na
Layer multiplying coextrusion was employed to produce films consisting of alternating layers of unfilledand particulate filled polymers, i.e., low density polyethylene (LDPE) and maleic anhydride grafted linearlow density polyethylene (LLDPE-g-MA)/organoclay nanocomposites. Layer multiplying coextrusion wasemployed to produce gas barrier films consisting of alternating layers of unfilled and particulate filledpolymers, i.e., low density polyethylene (LDPE) and maleic anhydride grafted linear low density poly-ethylene (LLDPE-g-MA)/organoclay nanocomposite. To further enhance gas barrier performance, the clayconcentration within the nanocomposite layers was increased several fold through annealing of themultilayer film in the melt state. Residing in the melt state activated the interdiffusion between thepolymers and due to a significant difference in the molecular mobility between the LDPE and LLDPE-g-MA chains led to a moving boundary effect which contracted the (LLDPE-g-MA)-rich nanocompositelayers and expanded the LDPE-rich layers. Analysis of the clay morphology within the nanocompositelayers demonstrated an increase in the clay particle lengths and aspect ratios, which was attributed tothe growth of “skewed” aggregates during layer contraction and particle concentration. The melt inducedclay concentration and increased clay particle dimensions caused a significant decrease in oxygenpermeability of the nanocomposite layers and reduced the overall permeability of the multilayered films.Morphology and transport behavior of the multilayered films were compared to a series of LLDPE-g-MA/clay bulk nanocomposites with varying clay content prepared by melt compounding in a twin screwextruder. Nielsen and Cussler models were used to describe the gas barrier data of the nanocompositefilms. Although both models can be fit well to the experimental data, the Cussler model showed a betteragreement with the morphological observations.
Polyethylene (PE) is one of the least expensive plastics producedin high volume and is used in a variety of applications, in particularpackaging films [1]. While high gas barrier is often an essentialattribute of a packaging film, all kinds of polyethylenes unfortu-nately exhibit rather low gas barriers. There is therefore a need tomodify PE in order to enhance the gas barrier. Incorporation ofinorganic platelet shaped fillers to polymers has been extensively
: þ1 601 266 5504.zarenko).
employed as a versatile approach to improve gas barrier. Welldispersed high aspect ratio platelet particles, especially when theyare aligned in the direction parallel to the film surface, can result ina significant decrease of the gas permeability [2].
The use of high aspect ratio layered silicates as fillers in poly-mers has attracted considerable interest due to the ability to ach-ieve exceptional property enhancements at low loading levels, inparticular enhancements in gas barrier [3e7]. Sodium montmoril-lonite (Na-MMT) clay has in particular been widely used forblending with polymers as it is the most abundant naturallyoccurring nanoclay. The structure of Na-MMT consists of stacks ofcrystalline mineral sheets (nanoplatelets) that are 1 nm thick andabout 50e150 nm long. If these high aspect ratio nanoplatelets are
highly delaminated and uniformly dispersed in the polymermatrix,even at low concentrations, a considerable reduction of the gaspermeability is expected. Single clay layers, however, exhibit atendency to aggregate and this process may strongly affect the gasbarrier outcome as compared to the one anticipated when the clayis dispersed to the level of single nanoplatelets [8]. Thus, to relatethe nanocomposite gas barrier to the clay morphology one needs toconduct a very thorough analysis of the clay aggregates.
Polyethylene is a nonpolar polymer and thus lacks favorableinteractions with the polar surface of the silicate layers even whenthe clay surfaces are organically modified. The most commonlyused method to overcome this hurdle is based on chemical modi-fication of the PE structure by grafting with polar maleic anhydride(MA) moieties to make the hydrophobic polymer more compatiblewith the clay surfaces. Adding a small amount of MA-grafted PE as acompatibilizer upon melt compounding of unmodified polyolefinwith clay typically results in nanocomposites with an intercalatedmorphology. Direct melt compounding of organoclay with MA-grafted PE can, however, produce nanocomposites with a highlydelaminated morphology [9].
Theoretical predictions of gas diffusion in the composite mediacontaining platelet fillers suggest that the characteristic distancebetween the particles will control barrier properties [10]. Twopossible filler concentration regimes are characterized by verydifferent diffusion behavior. Under dilute particle conditions, thedisks are spaced at a distance much exceeding the disk radius R andtheir volume fraction is much less than one. Here the contributionsof the disks to the effective diffusivity of the permeants are nearlyindependent and are best described by a tortuosity model derivedby Nielsen [11]. At semidilute concentrations, the volume fractionof the disks is still much less than one but they are spaced at dis-tances comparable to or smaller than R. In this semidilute regimethe physics of diffusion is dominated by the significant contributionof repeated multiple scatterings of penetrant molecules betweenthe close pairs of disks, adding considerably to the decrease in theoverall diffusivity of the composite [10]. These changes in diffu-sivity in the semidilute diffusion regime are best described by themodels derived by Cussler [12,13]. Therefore, it can be advanta-geous for barrier enhancement, while maintaining the same overallmineral content and even reducing it, to disperse particulates un-evenly, for instance, by fabricating a layered structure wherepolymer layers containing particulates in concentrated regimes arealternated with unfilled layers of the same polymer. Previously weshowed that multilayer coextrusion processing can be successfullyemployed to fabricate films with alternating layers of filled andunfilled polymers [14e16].
The basic multilayer coextrusion system consists of two singlescrew extruders equipped with melt pumps, a coextrusion feed-block, a series of layer multiplier elements, and a film die (filmspreader). Metering pumps control the polymer melt streamswhich are combined in the feedblock as two parallel layers. Fromthe feedblock the layers flow through a series of layer multiplyingelements, with each multiplier element doubling the number oflayers by first slicing the layers vertically, then spreading themhorizontally, and finally recombining. The multilayer coextrusionprocess used in this study enables the fabrication of layered poly-mer films with tens, hundreds, and even thousands of alternatinglayers with individual layer thicknesses that can vary from hun-dreds of microns to tens of nanometers [17e19]. Due to the strin-gent flow conditions, multilayering generally promotes particleorientation but highly concentrated regimes are difficult to achieveas they result in a considerable elevation in viscosity making thecomposite melts impossible to coextrude. It has been previouslydemonstrated that interdiffusion of a polymer pair in a multilayercan be employed to increase the concentration of inorganic
particles in one of the component layers [20]. The physics of thisphenomenon is described below.
Polymerepolymer interdiffusion or polymerepolymer mutualdiffusion describes the process of polymer chain transport, usuallyin both directions, across an interface that is driven by a composi-tional gradient [21,22]. Early studies on interdiffusion analyzedpolymer couples (bilayers) with only one interface. Kramer andGreen et al. were the first to demonstrate that interdiffusion be-tween two polymers, i.e., polystyrenes exhibiting very differentmolecular weights, can lead to a moving boundary (interface)phenomenon similar to that known in metallurgy as the Kirkendalleffect [23]. This effect can be observed when the individual diffu-sion coefficients in the interdiffusing couple are very different. Thepolymerepolymer interface moves toward the polymer exhibitinga lower molecular weight (faster diffusing component). Thismovement has been attributed to the conservation of melt density.To conserve density, the voids created due to an imbalance in masstransport across the interface have to collapse causing the bound-ary to move [24,25].
More recently, multilayers have been employed for interdiffu-sion studies [26e29]. They display two major advantages. A largercontact area and a greater number of interfaces can amplify theeffect so that more common characterization techniques can beused to monitor the progression of interdiffusion. Also, becauseindividual multilayer layers can be made relatively thin, the entireprocess of interdiffusion from start until finish (complete compo-sitional homogenization) can be observed within a reasonableexperimental time scale. A study conducted by our group in thepast has demonstrated a very strong moving boundary effect inHDPE/LLDPE polyethylene multilayers. Upon annealing in the meltstate, the layers containing faster interdiffusing chains (LLDPE)contracted and the layers containing slower interdiffusing chains(HDPE) subsequently expanded [30,31]. In the study conductedlater on LDPE/LLDPEmultilayers, micro particulates such as talc andnickel were added to the LLDPE polymer e faster interdiffusingcomponent. The LLDPE layers contracted by more than fourfoldresulting in a more than a fourfold increase in particulate concen-tration [20]. In this study that follows, organically modified Na-MMT nanoclay has been incorporated in the LLDPE-g-MA layersof a LLDPE-g-MA/LDPE multilayer. Interdiffusion and particle con-centration upon annealing of this multilayer are studied with aparticular emphasis on morphological and gas barrier changes.
2. Experimental
2.1. Materials
The organoclay, Cloisite®20A, dimethyl-bis(hydrogenate-tallow) ammonium montmorillonite, was purchased fromSouthern Clay Products. It is prepared by a cation exchange re-action between sodium montmorillonite (Na-MMT) and a two-tailed quaternary ammonium surfactant, i.e., dimethyl-bis(hydrogenated-tallow) ammonium chloride. According to thecompany specifications, the organic content of this clay is 38% (wt/wt) with aWAXS d-spacing of 25.1 Å. This organoclay was selectedbased upon previous studies showing excellent dispersion ofCloisite®20A with maleated polyethylene and because its twoalkyl tail surfactant exhibits equitable thermal stability at 200 �C[9,32].
Much of the discussion will focus upon the inorganic portion ofthe organoclay, which will be designated as MMT, and any refer-ences to the MMT fraction in a polymer must be understood to onlyapply to the inorganic portion. The mineral weight fraction, wm,was calculated as follows, wm ¼ g,moc/mcom, where moc is theweight of organoclay in the composite, mcom is the weight of the
J.J. Decker et al. / Polymer 61 (2015) 42e5444
composite (organoclay þ polymer), and g is the mineral weightfraction within the organoclay itself (0.62 in this case). The volumefraction, ɸm, was calculated from the corresponding weight fractionas follows, ɸm ¼ wm (rcom/rm), where rcom is the composite densityand rm is the mineral clay layer density, 2.86 g/cm3. The compositedensity, rcom, was calculated from the corresponding weight frac-tion and the densities of the polymer and mineral layers assumingthe two phase scheme. The organic matrix density was assumed tobe equal to the original polymer density.
The maleic anhydride grafted linear low density polyethylene(LLDPE-g-MA), Fusabond® E MX110D, subsequently designated asPEMA110, was donated by DuPont. It was chosen in this study for itshigh melt flow index (MFI), 16.8 g/10 min at 200 �C and 2.16 kg. ThePEMA110 was used to prepare polymer/clay nanocomposites formultilayering. After dispersing 5% (wt/wt) of nanoclay in PEMA110,the MFI was reduced to be very suitable for the multilayer coex-trusion, 4.9 g/10 min. The second LLDPE-g-MA system, Fusabond® EMB528D, also donated by DuPont and designated here asPEMA528, was employed in this study as a model for comparativestudy. It has amuch smaller MFI, 4.2 g/10min, and a higher capacityto disperse larger loadings of the nanoclay. Based on our 1H NMRanalysis, the MA graft levels of PEMA110 and PEMA528 were 1.3 wt% and 1.0 wt% respectively. These levels of MA grafting are com-parable with that reported elsewhere for a similar resin [9].
The low density polyethylene, Huntsman PE2030, designatedhere as LDPE, was purchased from PolyOne. This polymer was usedto prepare a multilayer film. The MFI for this LDPE, 5.2 g/10 min,matches well with the MFI for the PEMA110 nanocomposite con-taining 5% (wt/wt) of nanoclay. Note, matching the melt viscositiesfor the polymers comprising the alternating layers is critical forsuccessful coextrusion of multilayers.
2.2. Melt processing
The nanoclay and the LLDPE-g-MA polymers were dried for aminimum of 24 h in a vacuum oven at 80 �C and then cooled toroom temperature under vacuum prior to melt processing. Nano-composites were melt compounded in a Prism TSE 16 TC twinscrew extruder using a barrel temperature of 200 �C, a screw speedof 70 rpm, andmaximal feed rate to generate kilogram quantities ofpellets. For all nanocomposites generated, the LLDPE-g-MA and thenanoclay were hand mixed and introduced into the extruder by asingle hopper which was blanketed in nitrogen gas to preventwater uptake. The extrudate was cooled in an ice water bath,pelletized, and dried at 80 �C under vacuum for 2 h. The driedpellets were reintroduced into the hopper and extruded againunder the same conditions. This process was carried out four timesfor each nanocomposite generated, as it was found to optimize claydispersion. After final drying, the nanocomposite pellets werestored over desiccant. Film specimens were generated bycompression molding at 200 �C and 3000 psi on a non-stick surfacein a 1 mm thick mold for oxygen transport, WAXS, and TEM anal-ysis. MMT content of the samples was confirmed by placing pre-dried nanocomposite films or pellets in a furnace at 900 �C forone hour and weighing the remaining MMT ash, correcting for theloss of structural water [33].
Multilayer films composed of 65 alternating layers of LDPE andPEMA110 nanocomposite with 5% wt/wt (1.0% vol/vol) of MMTwere coextruded at a feed ratio 1:1 using the multilayer coex-trusion system described previously [14,34]. A sacrificial poly-styrene layer was extruded on the outer surfaces of themultilayered films to prevent deformation of the external poly-ethylene layers from internal stresses during cooling, and wasthereafter removed. After removal of both sacrificial layers, the finalmultilayer films possessed an average thickness of about
340 microns. The films were stored over desiccant. Layer volumecomposition was confirmed by measuring MMT ash and via directobservation of the layers by OM and TEM.
The multilayer films composed of LDPE and PEMA110/Cloisi-te®20A nanocomposite were annealed at 200 �C under nitrogenatmosphere in a melt press for various times. Film specimens wereannealed on non-stick surfaces and confined in a mold specificallyfabricated tomatch the film thickness. Filmswere carefully cut to fitthese molds, in order to prevent distortion of the film dimensionsduring annealing. The pressure applied was under 50 psi sinceconfinement, not compression, was the objective. A constant ni-trogen flow was provided around the melt press platens to reduceoxidative degradation. After annealing, the films were quenched inice water, dried, and stored over desiccant.
To take into account the effect of interdiffusion in a multilayeredsystem on the gas barrier of the polymer components, a series ofcompositional blends of the LLDPE-g-MA (PEMA110) and LDPE(PE2030) weremelt processed from pure polymer pellets in a PrismTSE 16 TC twin screw extruder at 200 �C and a screw speed of70 rpm. The polymers were dried for a minimum of 24 h undervacuum at 80 �C prior to melt blending. The polymer blendextrudates were cooled in ice water, pelletized, and dried undervacuum at 80 �C with the process repeated four times to achievemaximum mixing and match the thermal history of the nano-composites. Film specimens were produced by compressionmolding at 200 �C and 3000 psi on a non-stick PTFE coated surfacein a 1 mm thick mold for oxygen transport measurements.
2.3. Characterization
1H NMR was used to determine the MA-grafting levels of theLLDPE-g-MA resins used in this study. The solvent was deuteratedtetrachloroethane (TCE). All spectra were acquired on a VarianUNITYINOVA spectrometer operating at a frequency of 499.8 MHzand using a standard 5 mm two-channel probe. A 90� flip angle of19.75 ms and an acquisition time of 1.9 s were used. The number ofco-added scans was 192, with a delay of 19.6 s implemented be-tween transients. A Lorentzian filter of 0.53 Hz was applied prior toapplication of the Fourier transform. Peak shifts were referenced tothe residual proton signal for the deuterated TCE solvent (6.0 ppm).Peak assignments for the maleic anhydride sites were based onpreviously reported values [35,36]. Weight percentages werecalculated using proton integral values.
One dimensional X-ray diffraction spectra were collected on aRigaku Ultima III diffractometer (Cu Ka radiation, l ¼ 1.542 Å) atroom temperature using BraggeBrentano parafocusing geometry(reflection mode XRD) on the sample films.
Melt flow indices (MFI) were determined according to ASTMD1238 using a Dynisco melt flow indexer at 200 �C with appliedweights of 2.16 kg and 5.0 kg.
Oxygen barrier of the nanocomposite films and controls weremeasured at 25 �C, 0% RH, and 1 atm partial oxygen pressure dif-ference using a commercially manufactured diffusion apparatus,OX-TRAN® 2/21 ML (MOCON). This instrument employs acontinuous-flow method (ASTM D3985-81 and ASTM F1249-01)with nitrogen as the carrier gas to measure oxygen flux, J(t),through polymeric films. The film specimens were carefullyconditioned in the instrument, as described previously [16]. Thepermeability coefficient, P, was calculated directly from the steady-state flux, J∞, value as P ¼ J∞l/Dp, where l is the film thickness andDp is the oxygen partial pressure difference across the film. We usethroughout this article the following standard permeability units,ccgas(STP),cm)/(m2,day,atm), designated here as SPU.
For the optical microscopy (OM) analysis of the multilayeredfilms, 5 mm thick sections were microtomed perpendicular to the
J.J. Decker et al. / Polymer 61 (2015) 42e54 45
film surface using a glass knife. Phase contrast images werecaptured on film and the layer thicknesses were determined byimage analysis utilizing Digimizer Version 4.2.4.0. Changes in layerthicknesses of the annealed multilayered samples were quantifiedutilizing image analysis of the OM data.
For transmission electron microscopy (TEM), 90 nm thick sec-tions were cut at T ¼ �100 �C in the direction perpendicular to thefilm surface using a Leica cryo-ultramicrotome FC6 and a diamondknife, where they were deposited on a copper grid. The sectionswere imaged using a Zeiss 109T TEM operated at an acceleratingvoltage of 80 kV under bright field conditions. Since theMMT layershave a higher electron density than the surrounding polymer ma-trix, they appear darker in the images. Image analysis of TEM mi-crographs was used to quantify clay particle dimensions. Themicrographs were analyzed at 20Kmagnificationwhich allowed forsufficient resolution to observe individual clay nanoplatelets aswell as providing a suitable area from which to extract a largepopulation sampling. Clearly focused and well stigmated micro-graphs were utilized, since image clarity and resolution were crit-ical to this analysis, especially for individual MMT nanoplatelets,due to their nanoscale dimensions proving difficult to discriminatefrom the polymer matrix. Within the designated area, each andevery discernible clay layer was traced using Adobe Photoshop.These tracings were saved separately in bitmap format and im-ported into the image analysis program, Digimizer 4.2.4.0, wherethe clay particle characteristic dimensions were measured. Particlelengths were determined as the end-to-end distance. Particlethicknesses were determined by dividing the particles into sixequidistant sections, where five thickness measurements weretaken at these divisions to average the particle thickness. For clayparticle sections consisting of a single MMT layer, the thicknesscould not accurately be measured due to resolution limitations andwere assigned a thickness of 1 nm corresponding to the thickness ofan individual MMT sheet. To achieve statistical validity in this
Fig. 1. Representative TEM micrographs of clay morphologies in bulk nanocompositefilms with the following MMT volume fractions (v/v): (a) 1.0%; (b) 2.1%; (c) 3.2%; (d)4.4%.
analysis, at least 400 particles were measured for length andthickness per sample.
3. Results and discussion
3.1. Clay morphology in bulk nanocomposites
Representative TEM micrographs of PEMA528/Cloisite®20Acompression molded films (microtomed cross-sections) are shownin Fig. 1. The inserts are images taken at higher magnification. All ofthe nanocomposites exhibited a highly delaminated morphology.One can see in the micrographs single nanoplatelets but more oftentiny clay particles (aggregates) consisting of several (2e4) nano-platelets. In many instances the individual silicate platelets formingthese small aggregates were skewed in a staircase fashion formingthe striations that are longer than the individual nanoplatelets.Fig. 2a displays a schematic of one of these clay particles consistingof several skewed platelets and Fig. 2b shows a real examplerevealed by TEM at high magnification of the PEMA528 nano-composite with a MMT content of 1.0% (vol/vol).
Skewing of nanoplatelets due to shear stresses upon meltmixing has been discussed in detail elsewhere [33,37]. One of thegoals of this project is to appraise the clay particles dimensions andrelate this information to the nanocomposite gas barrier perfor-mance. Of note, skewed aggregates were a predominant morpho-logical feature in every PE based nanocomposite systemwe studiedincluding the multilayer film. A very high resolution image of thenanocomposite layer in the multilayer film shown as Fig. 1s in theSupplementary Information part helps the reader to zoom in at ascale that allows one to see the individual clay layers.
With increasing MMT content, a decrease in clay particle length(2R) was noticeable while the particle thickness seemed to varyinsignificantly. To quantitatively characterize the particle di-mensions a series of statistical histograms were generated for theclay particle half-length (Ri), thickness (a), and aspect ratio (a). Thehistograms are shown in Fig. 3 while the corresponding numberaverage quantities with standard deviations are reported in Table 1.The average half-length, R, gradually decreased with increasingMMT content, approximately by a factor of two, from 46 to 24 nm,and the Ri distribution narrowed with the right side of the distri-bution noticeably shortened. The average thickness, a, as well as thedistribution remained unchanged, therefore the average individualparticle aspect ratio, a, decreased alongwith the particle length, i.e.,from 29 to 14, and the distribution became more narrow.
The decrease in particle aspect ratio with increasing clay contentwas consistent with previous findings and attributed mainly to theincrease of the nanocomposite melt viscosity [38,39]. It has beendemonstrated in polymer clay nanocomposites in general and inmaleated polyolefin based systems, in particular, that as the con-tent of nanoclay increases the melt viscosity of the nanocomposite
Fig. 2. Skewed agglomerate consisting of several single clay platelets (a) schematic; (b)as revealed by TEM at higher magnification in a bulk nanocomposite with 1.0% vol/volMMT.
Fig. 3. Histograms of nanoclay particle dimensions in PEMA528 nanocomposites. Frequency plots are shown for particle half-lengths, Ri, thicknesses, ai (inserts), and aspect ratios,ai. Plots arranged according to the mineral volume fractions as follows: (a,b) 1.0%; (c,d) 2.1%; (e,f) 4.4%.
J.J. Decker et al. / Polymer 61 (2015) 42e5446
also increases [38,40]. Increased melt viscosity led to higher shearstresses applied to the clay particles. Under these more vigorousmixing conditions individual silicate nanoplatelets were peeled offmore efficiently and as the number of single layers per skewedaggregate was reduced the particles appeared shorter [33]. Withthe PEMA528 based systems employed in this study, the MFI of thenanocomposites decreased dramatically with clay content, i.e.,from 10.8 g/10 min for the pure PEMA528, to 2.3 g/10 min at0.010 vol/vol MMT, to 0.3 g/10 min at 0.021 vol/vol MMT, with anapplied weight of 5.0 kg at 200 �C, indicating large increases inviscosity. At higher clay contents, the viscosity was too high tomeasure the MFI at this temperature.
The clay particles were preferentially oriented in the planeparallel to the film surface. The particle orientation somewhatimproved with the addition of more MMT. The reason for thisbehavior is not exactly clear. One plausible argument is that it couldbe due to the increased mechanical coupling between the particleswith decreasing the characteristic distance between them leadingto more cooperative orientation behavior.
WAXS and TEM are complementary experimental approachesused to access the clay layer dispersion state in the nano-composites. WAXS scans of the bulk nanocomposite samples areshown as Fig. 2s in the Supplementary Information part. Forcomparative purposes, virgin PEMA528 and dry nanoclay are alsoincluded in the figure. The lack of any clear basal reflections in thePEMA528 nanocomposites were in agreement with the highlydelaminated individual clay layers and the incoherently stackedskewed aggregates observed by TEM.
3.2. Layer structure and clay morphology in nanocompositemultilayers
Optical micrographs of the multilayer films (cross-sections) areshown in Fig. 4 for films that were held in the melt at 200 �C forvarious times and the as-made (un-annealed) films. A continuousand rather uniformmicrolayer structure can be clearly observed. Inthe un-annealed multilayer the nanocomposite and LDPE layerwidths were 5.25 ± 1.42 mm and 5.03 ± 1.50 mm respectively. In the
Table 1TEM image analysis of clay particle dimensions in PEMA528/Cloisite®20Ananocomposites.
Fig. 5. Average layer thicknesses of the multilayered film plotted as a function of theroot square of annealing time.
J.J. Decker et al. / Polymer 61 (2015) 42e54 47
OM images the nanocomposite layers appear darker than the LDPElayers. We are not exactly sure about the nature of this opticalcontrast; however, several factors may be at issue such as thealternating layer height difference from microtoming, the crystal-line morphology variance, and the refractive index dissimilaritycaused byMMT. Clay nanoparticles cannot be seen directly with theoptical microscope. A 3-D schematic of the multilayer films beforeand after annealing in the melt is also included in Fig. 4.
Upon annealing, the nanocomposite layers rapidly contractedand the LDPE-rich layers rapidly expanded, indicating that thePEMA110 chains had diffused into the LDPE layers much faster thanthe LDPE chains in the reverse direction. Slower dynamics of theLDPE was expected because the LDPE chains contain long branches.These long branches can form additional entanglements. Incontrast, the LLDPE chains diffuse faster because they contain shortbranches which do not form these additional entanglements.
For a more quantitative analysis of the moving boundary phe-nomenon, the average layer widths determined by OM are plottedin Fig. 5 versus the annealing time root square (t1/2). The layerthickness data are also reported in Table 2. The kinetics of themoving boundary effect in the multilayer was fairly rapid. Alreadyafter 25min at 200 �C the nanocomposite layers contracted roughlyby a factor of 4 while the LDPE layers expanded by a factor of 2. Atlonger annealing times the films visibly degraded and were notfurther explored. The sum of the LDPE and the nanocomposite layerwidths remained unchanged during the annealing process. Thelayer widths changed linearly with t1/2. The t1/2 dependence of amarker (boundary) movement in a polymerepolymer diffusion
Fig. 4. Optical Micrographs of the multilayered films after annealing at 200 �C for thetime indicated and a schematic of the multilayer nanocomposite before and afterannealing/particle concentration (OM inserts).
couple was predicted and experimentally confirmed in the past byKramer et al. [24].
The moving boundary effect in the PEMA110-nanocomposite/LDPE multilayer caused the filled layers to contract and toconcentrate the nanoclay. Since the clay remained within thenanocomposite layers, the MMT volume fraction directly correlatedwith the narrowing of these layers. Therefore, the MMT averagevolume fraction in the nanocomposite layers upon annealing can bereadily calculated. The data are reported in Table 2. The volumefraction of MMT in the nanocomposite layers varied from 1.0% (v/v)in the as-made (un-annealed) multilayer to 4.3% (v/v) in themultilayer annealed for 25 min at 200 �C.
One might anticipate that high aspect ratio clay particles wouldobstruct transport of the polymer chains during interdiffusion byincreasing the length of the diffusion path, an effect that is expectedto increase with clay particle concentration. However, the lineartrends of the layer thickness with t1/2 showed no changes in slopesuggesting that the polymer chain reptation process apparentlywas not impeded by the clay particles, at least within the annealingtime scale and mineral composition range studied.
Fig. 6 displays TEM micrographs of nanocomposite layers in un-annealed and annealed at 200 �C multilayers. To help the reader,the dotted lines indicate approximate layer boundaries when theyappear in the field of view. The inserts show fragments of the TEMmicrographs taken at higher magnification. The nanoclay seemedto be distributed uniformly within the layers in the as-made andannealed multilayer samples. The nanocomposite layers, similarlyto the bulk nanocomposites presented in the previous section,exhibited a similar delaminated morphology in which the indi-vidual silicate nanoplatelets were skewed forming longer than
Table 2Nanocomposite and LDPE layer thicknesses for un-annealed and annealed (forvarious times at 200 �C) multilayers. MMT volume content in the nanocompositelayers was calculated using the layer thickness information.
Fig. 6. TEM micrographs of nanocomposite layers in the as-made multilayer (a) andafter annealing at 200 �C for 5 min (b); 15 min (c); and 25 min (d). Dotted lines indicateapproximate layer boundaries. Inserts exhibit TEM micrographs at largermagnification.
J.J. Decker et al. / Polymer 61 (2015) 42e5448
individual platelet clay particles. Geometric constraints imposed bylayer multiplying normally leads to extensive orientation of plateletmicroparticles, such as talc or metal flakes, in the plane of the layers[15,20]. In the nanocomposite multilayers studied in this work, clayparticle orientation along the extrusion directionwas also observedbut certainly it was not as pronounced as in the case of previouslystudied multilayers containing microparticles. It is not exactly clearwhat the reason for this behavior is, but it could be due to the factthat the characteristic length of the clay particles is considerablysmaller than the nanocomposite layer thickness. Because thenanoparticles are not as constricted upon coextrusion as previouslyemployed microparticles, the nanoplatelets orientation appearedsomewhat more prominent closer to the layer interfaces and
Fig. 7. Pictorial model illustrating the evolution of skewed aggregates upon a
certainly improved considerably after the nanocomposite layersnarrowed sizably at longer annealing times. After longer annealingtimes, the clay particles in the nanocomposite layers also appearedlonger. Interdiffusion and nanocomposite layer contraction appar-ently allowed for the growth of skewed aggregates as the nano-platelets and clay particles impinged upon one another. Thisbehavior is in contrast to that we earlier described for the bulknanocomposites prepared by melt mixing in a twin screw extruder.A pictorial description of the clay particle evolution upon annealingand contraction of the nanocomposite layers in a multilayer isdisplayed in Fig. 7.
For a more quantitative description, a statistical analysis of theclay particle dimensions in the nanocomposite layers uponcontractionwas conducted in amanner similar to that described forthe bulk nanocomposite controls. The histograms are shown inFig. 8 while the corresponding number average quantities withstandard deviations are reported in Table 3. As one can see from thehistograms, the average particle half-length, R, gradually increasedwith annealing time from about 36 to 87 nm. Particularly notice-able in the histograms is a broadening of the distribution with thetime of annealing toward longer particles. The average particlethickness, a, practically did not change, nor did the distribution,hence the average aspect ratio, a, also increased from 30 to 55 withthe distribution broadened towards larger aspect ratios.
In addition to TEM, un-annealed and annealed multilayers werealso probed byWAXS to see if the coextrusion process or annealingproduced any ordered intercalated clay morphology. The dif-fractograms of the PEMA110/nanoclay clay control with 1.0% (v/v)of mineral phase and three diffractograms of un-annealed multi-layer and a multilayer annealed at 200 �C for 17 and 25 min areshown as Fig. 3s in the Supplementary Information part. Therewere no observable changes in the XRD scans that would haveindicated the clay layers had reaggregated into ordered tactoidstructures. The clay particles did not possess the long rangestacking order necessary for coherent basal reflections to arise.
3.3. Oxygen permeability of LDPE/LLDPE-g-MA blends
The dependence of oxygen permeability for LDPE (PE2030)/LLDPE-g-MA (PEMA110) blends on volume fraction of PEMA110 isshown in Fig. 9. We found the trend to be perfectly linear(r2 ¼ 0.996) and this we believe indicates that the blends are
nnealing and contraction of the nanocomposite layers in the multilayer.
Fig. 8. Histograms of nanoclay particle dimensions in the nanocomposite layers of the as-made and annealed at 200 �C multilayer. Frequency plots are shown for particle half-lengths, Ri, thicknesses, ai (inserts), and aspect ratios, ai. Plots are arranged according to the calculated mineral volume fraction of the nanolayers in the multilayer (annealingtime is also shown in brackets) as follows: (a,b) 1.0% (0 min); (c,d) 1.8% (5 min); (e,f) 2.2% (15 min); (g,h) 4.3% (25 min).
J.J. Decker et al. / Polymer 61 (2015) 42e54 49
miscible. Immiscible blends would undergo phase inversion anddisplay a sigmoidal permeability trend with composition [41].Miscibility in the melt of maleated and pure polyolefin blend sys-tems has been observed before at maleic anhydride concentrationslow enough not to cause phase separation due to unfavorable chaininteraction [42].
It is noteworthy to mention that oxygen transport probes theamorphous phase. The crystalline phase of polymers is generallyimpermeable and insoluble for even small gas molecules like oxygen.
Therefore, our gas permeability measurements point to the misci-bility of LDPE and LLDPE-g-MA in the amorphous regions of thesemicrystalline blends. Among the different polyolefin systems, themiscibility of LLDPE/LDPE blends seems to be the least studied andthe available reports provide inconsistent conclusions on the misci-bility. Some LLDPE/LDPE compositions were found to be miscible,some partially miscible, and some even immiscible. Structural factorssuch asmolecularweight, length of chain branches, and chain branchcontent were shown to affect the miscibility [43e46].
Table 3TEM image analysis of clay particle dimensions in nanocomposite layers of un-annealed and annealed multilayer.
Oxygen permeability of PEMA110, 10.5 ± 0.8 SPU (standardpermeability units, see Experimental section), was found to belower than that of LDPE, 16.2 ± 0.6 SPU. One of the main reasons forthe lower oxygen permeability of PEMA110 could be a larger maleicanhydride content which makes a polymer more polar. Polarpolymers typically exhibit higher gas barrier [47].
Fig. 9. Oxygen permeability of LDPE/PEMA110 blends.
3.4. Oxygen permeability of bulk nanocomposites
Oxygen permeabilities of PEMA528/Cloisite®20A nano-composites are reported in Table 4. As one can see, adding nanoclaysignificantly enhances the gas barrier performance of a polymer.Oxygen permeability decreased by 42 and 67% after adding 1.0 and4.4% (vol/vol) of the nanoclay, respectively. Fig. 10 exhibits atraditional plot of the relative oxygen permeability (Pf =P0), where Pfis the permeability of a filled nanocomposite system and P0 is thepermeability of a pure polymer (in this case PEMA528), plottedversus the MMT volume fraction. Two models originally proposedby Nielsen and by Cussler were employed to fit the data [11,13]. Themodels predict the relative permeability of composite films withwell dispersed platelets oriented in the direction parallel to the filmsurface. It is generally accepted that the Nielsen equation (Equation(1)) is more applicable in the dilute particulate concentrationregime defined as follows, ɸ << 1, aɸ << 1. Where, ɸ, is the plateletvolume fraction and a ¼ R=a is the platelet aspect ratio. Theplatelets in this regime are set apart by a distance greater than theiraverage half-length, R, and contribute independently to the gastransport. In turn, the Cussler equation (Equation (2)) is moreapplicable in the semidilute concentration regime defined as fol-lows, ɸ << 1, aɸ >> 1. The platelets are spaced by a distance com-parable to their average half-length in this regime so theycontribute more cooperatively to the transport mechanism whichin this case becomes more localized and confined [10].
PfP0
¼ 1� f
1þ af(1)
PfP0
¼ 1� f
�1þ 2af
3
�2 (2)
Both models assume that the relative permeability, Pf =P0, isrelated to the reduced cross-section area, Af =A0; and the tortuosityfactor, t, as follows, Pf =P0 ¼ ðAf =A0Þ=t. The tortuosity factor issimilarly defined to be a ratio of the length of the tortuous path, lf,associated with turning around the discs while traveling across thefilm to the length of the direct path, l0. Both models effectivelycalculate the tortuosity factor by counting the number of platelets apermeant meets as it travels through the film. There is a relativelysmall difference between the final expressions for the tortuosityfactors presented by the two models, i.e., (1 þ aɸ) in the Nielsenmodel and (1 þ 2aɸ/3) in the Cussler model. The major difference,however, arises in the way the two models define and calculate thereduced area, Af =A0. The Nielsen model defines the reduced area to
be the area fraction of the polymer phase on a section typicallycalculated by employing the Delesse principle in stereologicalanalysis [48]. According to this principle the volume fraction of theembedded phase must be equal to the area fraction on a section.Therefore, the reduced area in the Nielsen model is equal to thevolume fraction of a polymer phase, Af =A0 ¼ ð1� fÞ. The Cusslermodel defines and calculates the reduced area very differently. Thecorresponding average volumes accessible for permeation in theunfilled and subsequently filled films are assumed to be a productof the corresponding bulk average accessible areas times the cor-responding diffusion paths as follows, V0 ¼ A0$l0 and V0�Vf ¼ Af$lf.This leads to the final expression for the reduced area,Af =A0 ¼ ð1� fÞ=ð1þ 2af=3Þ.
The best fits of equations (1) and (2) to the experimental data(Pf =P0 vs. ɸ) generated for PEMA528/Cloisite®20A nanocompositesare shown as the lines in Fig. 10. Both models describe fairly wellthe experimental data with the aspect ratio, a ¼ R=a, to be the onlyfitting parameter. With an optimal value of a ¼ 63, the Nielsenequation showed a slightly better fit (r2 ¼ 0.989) to the experi-mental data than the Cussler equationwith a¼ 36 (r2¼ 0.968). Onepoint at 4.4% (v/v), however, noticeably deviated from the best fits.The relative permeability for this composition was found to belarger than the values predicted by the models which we believewas due to a sizable decrease of the clay particle aspect ratio at thisclay composition as it was reported earlier in the morphologysection for PEMA528/Cloisite®20A bulk nanocomposites. Despitethe Nielsen model overall showing a better fit to the experimentaldata, the a value predicted by this model was larger than theaverage aspect ratios, a, determined by TEM for the various com-positions by about a factor of 3 (see Table 1). In contrast, the aspectratio predicted by the Cussler model exhibited a satisfactoryagreement with the TEM data, excluding the point at ɸ¼ 4.4% (v/v).
Fig. 10. Relative oxygen permeability of PEMA528 nanocomposite films versus volumefraction of MMT: Experimental data and fits using Nielsen and Cussler equations.
J.J. Decker et al. / Polymer 61 (2015) 42e54 51
A question can therefore be posed as to which of the two equationsprovides a more accurate description. It may be difficult to come toa definitive answer with the existing morphological informationbecause there is a general problem with TEM analysis as it has atendency to overestimate the fraction of smaller particles imbed-ded in the polymer matrix due to a “cross-section” effect [49]. If theparticle centers are situated outside the microtome slice theircharacteristic dimensions will appear smaller on the correspondingTEM images and the average particle size representing a distribu-tion also will be affected, as it will appear smaller. More dramaticunderestimation of the particle sizes is expected if the slice thick-ness is considerably smaller than the measured particle dimension.In our case the slice thickness, about 100 nm, was, however, com-parable with the clay particle lateral dimension. So, it is quite un-likely that the particle size distributionwas significantly affected bythe “cross-section” effect. This argument is in favor of using theCussler equation to describe the permeation data as it appears toagree better with the morphological observations. The Cusslerequation has been previously shown in other multilayered/highlyfilled film systems to better represent permeation behaviors thandoes the Nielson model [50].
3.5. Oxygen permeability of un-annealed and annealednanocomposite multilayers
Fig. 11 shows the permeability, Pf-m, of the filled nanocompositemultilayer films versus annealing time, t. The permeability data arealso reported in Table 5. The multilayers exhibited a gradualdecrease in oxygen permeability with annealing time from theinitial value, 8.1 SPU, prior to annealing (t ¼ 0 min), to 4.9 SPU afterannealing for 25 min corresponding to a 40% permeability decreaserelative to the un-annealed film, which is significant. It is alsointeresting to estimate the relative permeability Pf�m=P0�m, priorto and after annealing assuming a value for the unfilled multilayerfilm, P0-m, of 13.4 which corresponds to the experimentally deter-mined permeability of a 50/50 blend of LDPE and PEMA110. Vis-cosity differences between the unfilled PEMA110 and LDPEprevented themultilayering of these two polymers. With an overallMMT content of 0.5% (v/v) (nanoclay only in half the layers), therelative permeabilities could be approximated for the un-annealedand after annealing for 25 min films as 0.60 and 0.37 respectively.For comparison, with the same mineral content, the relativepermeability of the PEMA528/Cloisite®20A nanocomposite controlis 0.76. Therefore, if the relative permeabilities of a nanocompositecontrol and a nanocomposite multilayer prior to annealing are
Table 4Oxygen permeabilities of LDPE, PEMA528, and PEMA110 poly(ethylene) controls,PEMA110/LDPE blends, PEMA528/Cloisite®20A bulk nanocomposites with variousMMT volume fractions, and PEMA110/Cloisite®20A composite with MMTcontent 1%(v/v).
Material MMT content (ɸ, vol/vol) Permeability (SPU)
Standard permeability units (SPU): (ccgas(STP),cm)/(m2,day,atm).
somewhat comparable, after annealing the relative permeability ofa multilayer is markedly smaller.
A seriesmodel was employed to describe the permeability of theun-annealed and annealed PEMA110 nanocomposite/LDPE multi-layer, Pf-m. The permeability, Pf-m, is a function of the permeability,Pf-l, and the thickness, Lf-l, of the nanocomposite layers, and thepermeability, PLDPE, and the thickness, LLDPE, of the LDPE-rich layersas follows:
LLDPE þ Lf�l
Pf�m¼ Lf�l
Pf�lþ LLDPEPLDPE
(3)
While the information on Pf-m, Lf-l, and LLDPE is experimentallyavailable (see Tables 2 and 5), Pf-l and PLDPE are two unknowns thathave to be decoupled. The transport model can be simplified and Pf-land PLDPE decoupled if it is assumed that interdiffusion occurs solelyby diffusing polymer chains from the PEMA110 nanocompositelayers into the LDPE layers. We believe that this assumption isreasonable as the observed prominent moving boundary effectpoints to a largemismatch of the diffusion coefficients while a short
Fig. 11. Oxygen permeability, Pf-m, of a nanocomposite multilayer versus annealingtime at 200 �C.
Table 5Directly measured oxygen permeability of un-annealed and annealed multilayers, and estimated permeabilities of LDPE-rich and nanocomposite layers.
Standard permeability units (SPU): (ccgas(STP),cm)/(m2,day,atm).a Permeabilities without uncertainty were calculated as described in discussion.
J.J. Decker et al. / Polymer 61 (2015) 42e5452
duration of the annealing process in principle suggests that only anegligible amount of slow-moving long branched LDPE can inter-diffuse into the nanocomposite layers. We assume that due to avery short processing time during melt coextrusion, the extent ofinterdiffusion in un-annealed multilayers is minimal; therefore theun-annealed multilayers consist of pure LDPE and pure PEMA110/nanoclay layers. The simplification made above for the transportproblem enabled us to calculate the volume composition of theLDPE-rich layers from the layer thickness variation upon annealing(see Table 2), and then based on these calculations to estimate thepermeability of LDPE-rich layers using the permeability versuscomposition plot shown in Fig. 9 for LDPE/LLDPE-g-MA blends.After evaluating the permeability of the LDPE-rich layers, thepermeability of the nanocomposite layers, Pf-l, was calculated usingEquation (3). The permeabilities of the LDPE-rich and nano-composite layers are reported in Table 5.
As one can see in Table 5, the oxygen permeability of the LDPE-rich layers, PLDPE, rapidly decreased upon annealing by about 10%after the first 5 min due to interdiffusion of LLDPE-g-MA chains andthen continued to decrease with time but rather slowly. After25 min of annealing the permeability of the LDPE-rich layersdecreased by only 15%. The oxygen permeability of the nano-composite layers, Pf-l, decreased more dramatically. After the firstfive minutes of annealing the permeability decreased by 35% andafter 25 min by 84%. The calculated permeability of the nano-composite layers prior to annealing of a multilayer, 5.5 SPU, wasfound to be very similar to that experimentally determined for themelt pressed PEMA110/nanoclay bulk nanocomposite film with 1%(v/v) of MMT, i.e. 5.4 ± 0.5 SPU. This fact is in agreement with our
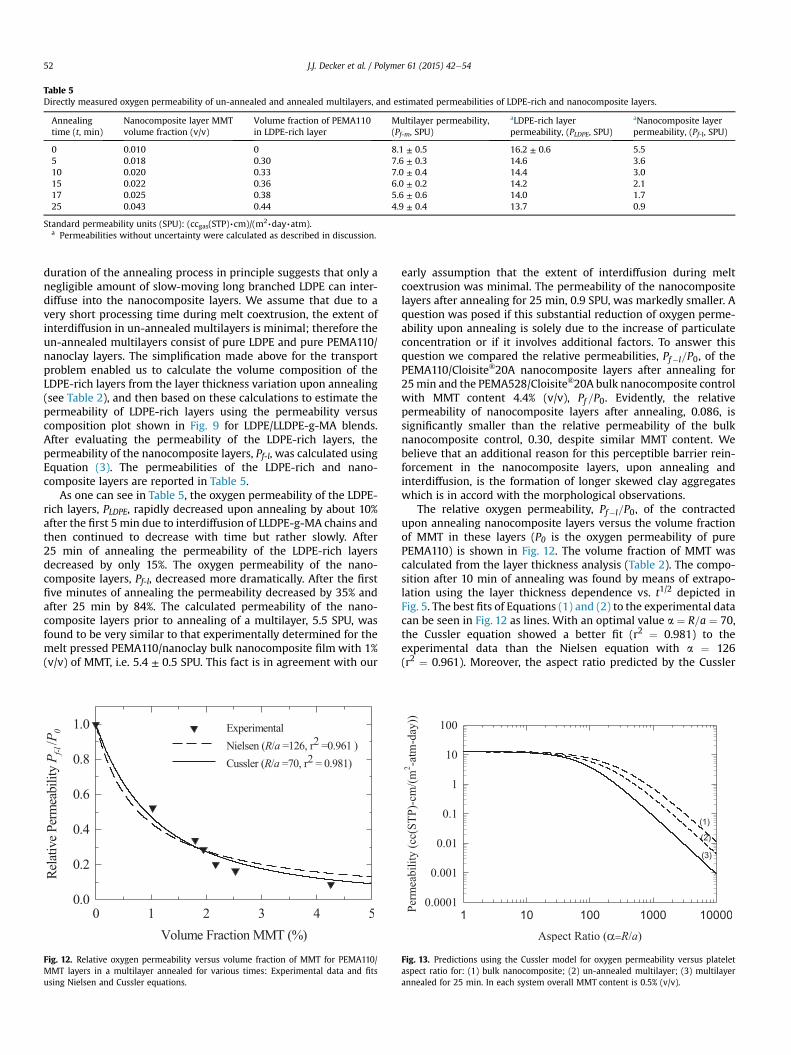
Fig. 12. Relative oxygen permeability versus volume fraction of MMT for PEMA110/MMT layers in a multilayer annealed for various times: Experimental data and fitsusing Nielsen and Cussler equations.
early assumption that the extent of interdiffusion during meltcoextrusion was minimal. The permeability of the nanocompositelayers after annealing for 25 min, 0.9 SPU, was markedly smaller. Aquestion was posed if this substantial reduction of oxygen perme-ability upon annealing is solely due to the increase of particulateconcentration or if it involves additional factors. To answer thisquestion we compared the relative permeabilities, Pf�l=P0, of thePEMA110/Cloisite®20A nanocomposite layers after annealing for25min and the PEMA528/Cloisite®20A bulk nanocomposite controlwith MMT content 4.4% (v/v), Pf =P0. Evidently, the relativepermeability of nanocomposite layers after annealing, 0.086, issignificantly smaller than the relative permeability of the bulknanocomposite control, 0.30, despite similar MMT content. Webelieve that an additional reason for this perceptible barrier rein-forcement in the nanocomposite layers, upon annealing andinterdiffusion, is the formation of longer skewed clay aggregateswhich is in accord with the morphological observations.
The relative oxygen permeability, Pf�l=P0, of the contractedupon annealing nanocomposite layers versus the volume fractionof MMT in these layers (P0 is the oxygen permeability of purePEMA110) is shown in Fig. 12. The volume fraction of MMT wascalculated from the layer thickness analysis (Table 2). The compo-sition after 10 min of annealing was found by means of extrapo-lation using the layer thickness dependence vs. t1/2 depicted inFig. 5. The best fits of Equations (1) and (2) to the experimental datacan be seen in Fig. 12 as lines. With an optimal value a ¼ R=a ¼ 70,the Cussler equation showed a better fit (r2 ¼ 0.981) to theexperimental data than the Nielsen equation with a ¼ 126(r2 ¼ 0.961). Moreover, the aspect ratio predicted by the Cussler
Fig. 13. Predictions using the Cussler model for oxygen permeability versus plateletaspect ratio for: (1) bulk nanocomposite; (2) un-annealed multilayer; (3) multilayerannealed for 25 min. In each system overall MMT content is 0.5% (v/v).
J.J. Decker et al. / Polymer 61 (2015) 42e54 53
model also exhibited a much better agreement with the TEM data(see Table 3).
Finally we want to comment on the prospect of the multilayerapproach described in this article, assuming similar polyethylenesystems and mineral compositions are used. Evidently, futuresuccess depends on the ability to use higher aspect ratio particu-lates. Fig. 13 shows the predicted oxygen permeability versusplatelet aspect ratio for a bulk nanocompositewith anMMTcontentof 0.5% (v/v) (1), an un-annealed multilayer (2), and a multilayerannealed at 200 �C for 25 min (3). In the un-annealed multilayer,the filled layer mineral content is assumed to be 1% (v/v) with afilled-unfilled initial layer thickness ratio 1:1. Subsequently, theoverall MMT content in the multilayers is 0.5% (v/v) as well. For themultilayers, the oxygen permeability of the nanocomposite layerswas calculated first using the Cussler model (Equation (2)) and thenthe overall permeability was estimated via the series model(Equation (3)). We assumed that the LDPE and PEMA110-rich layersexhibit the same expansion/contraction behavior due to interdif-fusion and the moving boundary effect as reported in Table 2. TheLDPE/PEMA110 (50/50) blend was assumed to be the matrix for thebulk nanocomposite and the Cussler equation was used to predictthe oxygen permeability trend (1) for this system as well. Note, theoxygen permeability for the blend, 13.4 SPU determined experi-mentally is similar to that for LDPE/PEMA110 (50/50) multilayerestimated using the series model, 12.7 SPU.
The predicted oxygen permeability versus aspect ratio curves inFig. 13 qualitatively displayed very similar tendencies. Within theaspect ratio range less than 40 the permeability decreased slowly,essentially showing a plateau on a logelog graph, after which thedecrease was fairly rapid. For comparison, the permeability of theannealed multilayers with a ¼ 1, 40, 100, 1000, and 10,000 was12.941, 8.050, 3.830, 0.085, and 0.0009 SPU, respectively. As ex-pected, among these three systems the annealed multilayerexhibited the highest and the bulk nanocomposite the lowest gasbarrier performance with the trend for the un-annealed multilayerin between. The difference between the trends in the plateau re-gion range, i.e. a ~ 1e40, however, was very minor graduallybecoming more pronounced with larger a permeability trendsabove a ¼ 500 continued to decrease with somewhat comparablerates. For comparison, with a ¼ 36, 70, 500, 1000, and 10,000, theoxygen permeability was 1.3, 1.6, 6.0, 8.4, and 12.5 times smallerthan the permeability of a bulk nanocomposite, and 1,1, 1.3, 3.3, 4.0,and 4.8 times smaller than the permeability of a un-annealedmultilayer, respectively. Therefore, if the nanoparticulates thatexhibit a very high aspect ratio (a ¼ 500e2000), such as syntheticfluorohectorite or graphene (described elsewhere) had beendispersed in the LLDPE-g-MA matrix, the annealed multilayerapproach would result in an increase of the gas barrier of about twoorders of magnitude relative to the unfilled matrix while an in-crease of one order of magnitude for a bulk nanocompositewith thesame particulate content [51e53]. Multilayering without annealingalso improves the gas barrier as compared to the bulk nano-composite but the effect is clearly smaller. As one can see from Fig.13, MMT nanoparticulates exhibit too small of an aspect ratio andtheir effect on gas barrier is relatively minor. However, if nano-particulates with larger aspect ratios are employed, much moreimpressive barrier enhancement can be anticipated.
4. Conclusions
A direct melt compounding of organoclay Cloisite®20A withcommercial grades of MA-grafted LLDPE (DuPont Fusabond® se-ries) in a twin screw extruder produced bulk nanocomposites witha highly delaminated morphology. The organoclay in the polymermatrix was dispersed to the level of single nanoplatelets that were
often arranged in tiny aggregates (particles) consisting of 2e4nanoplatelets skewed in a staircase fashion. The length and aspectratio of these skewed aggregates were larger than those of a singlenanoplatelet. With increasing the MMT content, the clay particlelength and aspect ratio decreased. This effect was attributed to anincrease in the bulk nanocomposite melt viscosity which led tohigher shear stresses. Under these more vigorous mixing condi-tions individual silicate layers were peeled off more efficiently. Asthe number of single layers per skewed aggregate was reduced, theparticles appeared shorter.
Layer multiplying coextrusion was employed to create filmsconsisting of alternating layers of LDPE and LLDPE-g-MA/Cloisi-te®20A nanocomposite. The MMT concentration within the nano-composite layers was increased through annealing of themultilayered films in the melt state. This process took advantage ofthe mismatch in the diffusion coefficients between LDPE andLLDPE-g-MA polymer chains leading to a moving boundary thatcaused the LLDPE-g-MA rich particulate filled layers to contractwhile the LDPE rich layers expanded. In contrast to the effect of theshortening of clay particles during the melt compounding ofnanocomposites in an extruder, the analysis LLDPE-g-MA/Cloisi-te®20A layers in the multilayer system revealed an unexpectedlengthening of clay particles upon annealing. The lack of a stressfield during interdiffusion and nanocomposite layer contractionapparently allowed for the growth of skewed aggregates as nano-platelets and clay particles impinged upon one another.
The multilayered nanocomposite system exhibited a gradualimprovement of oxygen barrier with annealing and the contractionof the filled layers led to a 63% reduction of the oxygen permeabilityrelative to an unfilled LDPE/LDPE-g-MA system. This gas barrierreinforcement effect far exceeded the 24% reduction anticipatedassuming the same mineral content in the nanocomposite bulkcontrol. A series model, under the assumption that interdiffusionoccurs solely by diffusing polymer chains from the LLDPE-g-MA/nanoclay layers into the LDPE layers, enabled calculating the oxy-gen permeability of the filled layers upon annealing and contrac-tion. After annealing, the nanocomposite layers exhibited a 91%reduction of the oxygen permeability as compared to the unfilledPEMA110 polymer. In a nanocomposite control with the samemineral content, the oxygen permeability was reduced by 70%. Thisadditional gas barrier enhancement was attributed to the forma-tion of longer skewed aggregates upon annealing and thecontraction of the filled layers, in accord with the morphologicalobservations. Cussler and Nielsen models have been employed tomodel the permeability data in the nanocomposite controls and thenanocomposite layers in a multilayer. Although both modelsdescribed fairly well the experimental data, the Cussler modeloverall showed a better agreement with the morphologicalobservations.
While the increase in gas barrier properties observed using thisnew methodology is by itself novel and interesting, it is clear fromthe model analysis that increasing the nanoplatelet aspect ratios,and perhaps the initial nanoclay concentration in the filled layerswill lead to even more impressive barrier results. Indeed, withhigher aspect ratio fillers, these results may prove remarkable,especially if the same trends of particle length growth are observed.
Acknowledgments
The authors are grateful to the National Science Foundation forsupport of this work through the Center for Layered PolymericSystems (DMR 0423914) and the GK-12 fellowship program(DGE-1007911, Award #0947944). Special thanks are to be given tothe multilayering teams at Case Western Reserve University fortheir careful manufacturing of the multilayered films and many
J.J. Decker et al. / Polymer 61 (2015) 42e5454
fruitful discussions. We are also grateful to Dr. William L. Jarrettfrom the School of Polymers and High Performance Materials, theUniversity of Southern Mississippi, for conducting the NMR char-acterization of the polyethylene resins used in this study.
Appendix A. Supplementary data
Supplementary data related to this article can be found at http://dx.doi.org/10.1016/j.polymer.2015.01.061.
References
[1] Peacock AJ. Handbook of polyethylene: structures: properties, and applica-tions. Boca Raton, Florida: CRC Press; 2000.
[2] Bissot TC. Performance of high-barrier resins with platelet-type fillers. In:Koros WJ, editor. Barrier polymers and structures, ACS symposium series 423.Washington, DC: American Chemical Society; 1990. p. 225e38. Ch. 11.
[3] Ray SS, Okamoto M. Polymer/layered silicate nanocomposites: a review frompreparation to processing. Prog Polym Sci 2003;28:1539e641. http://dx.doi.org/10.1016/j.progpolymsci.2003.08.002.
[4] Alexander M, Dubois P. Polymer-layered silicate nanocomposites: prepara-tion, properties and uses of a new class of materials. Mater Sci Eng R Rep2000;28(1):1e63. http://dx.doi.org/10.1016/S0927-796X(00)00012-7.
[5] Paul DR, Robeson LM. Polymer nanotechnology: nanocomposites. Polymer2008;49(15):3187e204. http://dx.doi.org/10.1016/j.polymer.2008.04.017.
[7] Priolo MA, Holder KM, Gamboa D, Grunlan JC. Influence of clay concentrationon the gas barrier of clay-polymer nanobrick wall thin film assemblies.Langmuir 2011;27(19):12106e14. http://dx.doi.org/10.1021/la201584r.
[8] Nazarenko S, Meneghetti P, Julmon P, Olson BG, Qutubuddin S. Gas barrier ofpolystyrene montmorillonite clay nanocomposites: effect of mineral layeraggregation. J Polym Sci Pol Phys 2007;45(13):1733e53. http://dx.doi.org/10.1002/polb.21181.
[9] Hotta S, Paul DR. Nanocomposites formed from linear low density poly-ethylene and organoclays. Polymer 2004;45(22):7639e54. http://dx.doi.org/10.1016/j.polymer.2004.08.059.
[10] Fredrickson GH, Bicerano JJ. Barrier properties of oriented disk composites.J Chem Phys 1999;110(4):2181e8. http://dx.doi.org/10.1063/1.477829.
[11] Nielsen LE. Models for the permeability of filled polymer systems. J MacromolSci A Chem 1967;1(5):929e42. http://dx.doi.org/10.1080/10601326708053745.
[12] Cussler EL, Hughes SE, Ward III WJ, Aris RJ. Barrier membranes. J Membr Sci1988;38(2):161e74. http://dx.doi.org/10.1016/S0376-7388(00)80877-7.
[13] Lape NK, Nuxoll EE, Cussler EL. Polydisperse flakes in barrier films. J MembrSci 2004;236(1e2):29e37. http://dx.doi.org/10.1016/j.memsci.2003.12.026.
[14] Mueller C, Nazarenko S, Ebeling T, Schuman TL, Hiltner A, Baer E. Novelstructures by microlayer coextrusion-talc-filled PP, PC/SAN, and HDPE/LLDPE.Polym Eng Sci 1997;37(2):355e62. http://dx.doi.org/10.1002/pen.11678.
[15] Nazarenko S, Hiltner A, Baer E. Polymer microlayer structures with anisotropicconductivity. J Mater Sci 1999;34(7):1461e70. http://dx.doi.org/10.1023/A:1004527205239.
[16] Sekelik DJ, Stepanov EV, Nazarenko S, Hiltner A, Baer E. Oxygen barrierproperties of crystallized and talc-filled poly(ethylene terephthalate). J PolymSci Pol Phys 1999;37(8):847e57. http://dx.doi.org/10.1002/(SICI)1099-0488(19990415)37:8<847::AID-POLB10>3.0.CO;2e3.
[17] Im J, Hiltner A, Baer E. Microlayer composites. In: Baer E, Moet A, editors. Highperformance polymers. New York: Hanser; 1991. p. 175.
[18] Wang HP, Keum JK, Hiltner A, Baer E. Confined crystallization of PEO innanolayered films impacting structure and oxygen permeability. Macromol-ecules 2009;42(18):7055e66. http://dx.doi.org/10.1021/ma901379f.
[19] Song H, Singer K, Lott J, Wu Y, Zhou J, Andrews J, et al. Continuous meltprocessing of all-polymer distributed feedback lasers. J Mater Chem2009;19(40):7520e4. http://dx.doi.org/10.1039/B909348F.
[20] Nazarenko S, Dennison M, Schuman T, Stepanov EV, Hiltner A, Baer E. Creatinglayers of concentrated inorganic particles by interdiffusion of polyethylenes inmicrolayers. J Appl Polym Sci 1999;73(14):2877e85. doi: 10.1002/(SICI)1097-4628(19990929)73:14<2877::AID-APP11>3.0.CO;2-O.
[21] Klein J. The interdiffusion of polymers. Science 1990;250(4981):640e6. http://dx.doi.org/10.1126/science.250.4981.640.
[22] Kausch HH, Tirrell M. Polymer interdiffusion. Annu Rev Mater Sci 1989;19:341e77. http://dx.doi.org/10.1146/annurev.ms.19.080189.002013.
[23] Smigelskas AD, Kirkendall EO. Zinc diffusion in alpha brass. Trans AIME1947;171:130e42.
[24] Kramer EJ, Green P, Palmstrøm CJ. Interdiffusion and marker movements inconcentrated polymer-polymer diffusion couples. Polymer 1984;25(4):473e80. http://dx.doi.org/10.1016/0032-3861(84)90205-2.
[25] Green PF, Palmstrram CJ, Mayer JW, Kramer EJ. Marker displacement mea-surements of polymer-polymer interdiffusion. Macromolecules 1985;18(3):501e7. http://dx.doi.org/10.1021/ma00145a033.
[26] Keskkula H, Paul DR. Diffusion of miscible polymers in multilayer films. J ApplPolym Sci 1987;34(5):1861e77. http://dx.doi.org/10.1002/app.1987.070340506.
[27] Pollock G, Nazarenko S, Hiltner A, Baer E. Interdiffusion in microlayeredpolymer composites of polycarbonate and a copolyester. J Appl Polym Sci1994;52(2):163e76. http://dx.doi.org/10.1002/app.1994.070520205.
[28] Lai CY, Ponting MT, Baer E. Influence of interdiffusion on multilayeredgradient refractive index (GRIN) lens materials. Polymer 2012;53(6):1393e403. http://dx.doi.org/10.1016/j.polymer.2012.01.036.
[30] Schuman T, Stepanov EV, Nazarenko S, Capaccio G, Hiltner A, Baer E. Inter-diffusion of linear and branched polyethylene in microlayers studied viamelting behavior. Macromolecules 1998;31(14):4551e61. http://dx.doi.org/10.1021/ma971758e.
[31] Schuman T, Nazarenko S, Stepanov EV, Magonov S, Hiltner A, Baer E. Solidstate structure and melting behavior of interdiffused polyethylenes inmicrolayers. Polymer 1999;40(26):7373e85. http://dx.doi.org/10.1016/S0032-3861(99)00013-0.
[32] Shah RK, Paul DR. Organoclay degradation in melt processed polyethylenenanocomposites. Polymer 2006;47(11):4075e84. http://dx.doi.org/10.1016/j.polymer.2006.02.031.
[33] Fornes TD, Yoon PJ, Keskkula H, Paul DR. Nylon 6 nanocomposites: the effectof matrix molecular weight. Polymer 2001;42(25):9929e40. http://dx.doi.org/10.1016/S0032-3861(01)00552-3.
[34] Mueller CD, Kerns J, Ebeling T, Nazarenko S, Hiltner A, Baer E. In: Coates PD,editor. Polymer process engineering, vol. 97. London: The Institute of Mate-rials; 1997. p. 137e57.
[35] Russell KE, Kelusky EC. Grafting ofmaleic anhydride to n-eicosane. J PolymSci PolChem 1988;26(8):2273e80. http://dx.doi.org/10.1002/pola.1988.080260821.
[36] Miyauchi K, Saito K. 1H NMR assignment of oligomeric grafts of maleicanhydride-grafted polyolefin. Magn Reson Chem 2012;50(8):580e3. http://dx.doi.org/10.1002/mrc.3839.
[38] Lee H-S, Fasulo PD, Rodgers WR, Paul DR. TPO based nanocomposites. Part 1.Morphology and mechanical properties. Polymer 2005;46(25):11673e89.http://dx.doi.org/10.1016/j.polymer.2005.09.068.
[39] Nam PH, Maiti P, Okamoto M, Kotaka T, Hasegawa N, Usuki A. A hierarchicalstructure and properties of intercalated polypropylene/clay nanocomposites. Poly-mer 2001;42(23):9633e40. http://dx.doi.org/10.1016/S0032-3861(01)00512-2.
[40] Galgali G, Ramesh C, Lele A. A rheological study on the kinetics of hybridformation in polypropylene nanocomposites. Macromolecules 2001;34(4):852e8. http://dx.doi.org/10.1021/ma000565f.
[41] Hopfenberg HP, Paul DR. Transport phenomena in polymer blends. In:Paul DR, Newman S, editors. Polymer blends, vol. 1. New York: AcademicPress Inc; 1978. p. 445e89.
[42] Gonzalez-Montiel A, Keskkula H, Paul DR. Morphology of nylon 6/poly-propylene blends compatibilized with maleated polypropylene. J Polym Sci PolPhys 1995;33(12):1751e67. http://dx.doi.org/10.1002/polb.1995.090331206.
[43] Cho K, Ahn T, Park I, Lee BH, Choe S. Influence of the melt Index of low densitypolyethylene on the properties in the blend with linear low density poly-ethylenes. J Ind Eng Chem 1997;3(2):147e54.
[44] Shin TJ, Lee B, Lee J, Jin S, Sung BS, Han YS, et al. Small-angle neutron scatteringstudy of the miscibility of metallocene-catalyzed octene linear low-densitypolyethylene and low-density polyethylene blends. J Appl Crystallogr2009;42(2):161e8. http://dx.doi.org/10.1107/S0021889809002854.
[45] Hussein IA, Williams MC. Rheological study of heterogeneities in melt blendsof ZN-LLDPE and LDPE: influence of Mw and comonomer type, and implica-tions for miscibility. Rheol Acta 2004;43(6):602e14. http://dx.doi.org/10.1007/s00397-004-0356-9.
[46] Utracki LA, Schlund B. Linear low density polyethylenes and their blends: part4 shear flow of LLDPE blends with LLDPE and LDPE. Polym Eng Sci1987;27(20):1512e22. http://dx.doi.org/10.1002/pen.760272006.
[47] Salame M. Prediction of gas barrier properties of high polymers. Polym Eng Sci1986;26(22):1543e6. http://dx.doi.org/10.1002/pen.760262203. Polym.
[48] Chan SL. Image analysis. In: Roulin-Moloney AC, editor. Fractography andfailure mechanisms of polymers and composites. London: Elsevier AppliedScience; 1989. p. 145e92.
[49] Cort�e L, Leibler L. Analysis of polymer blend morphologies from transmissionelectron micrographs. Polymer 2005;46(17):6360e8. http://dx.doi.org/10.1016/j.polymer.2005.05.109.
[50] Gupta M, Lin Y, Deans T, Baer E, Hiltner A, Schiraldi DA. Structure and gasbarrier properties of poly(propylene-graft-maleic anhydride)/phosphate glasscomposites prepared by microlayer coextrusion. Macromolecules 2010;43(9):4230e9. http://dx.doi.org/10.1021/ma100391u.
[51] Kamena K. Nanoclays and their emerging markets. In: Xanthos M, editor.Functional fillers for plastics. Weinheim, Germany: Willey-VCH Verlag GmbH& Co. KGaA; 2005. p. 163e74.
[52] Souza DHS, Dahmouche K, Andrade CT, Dias ML. Structure, morphology andthermal stability of synthetic fluorine mica and its organic derivatives. ApplClay Sci 2011;54(3e4):226e34. http://dx.doi.org/10.1016/j.clay.2011.09.006.
[53] Compton OC, Kim S, Pierre C, Torkelson JM, Nguyen ST. Crumpled graphenenanosheets as highly effective barrier property enhancers. Adv Mater2010;22(42):4759e63. http://dx.doi.org/10.1002/adma.201000960.