Brigham Young University Brigham Young University BYU ScholarsArchive BYU ScholarsArchive Theses and Dissertations 2016-03-01 Polymer Coated Urea in Kentucky Bluegrass Polymer Coated Urea in Kentucky Bluegrass Jessica Chelise Buss Brigham Young University - Provo Follow this and additional works at: https://scholarsarchive.byu.edu/etd Part of the Plant Sciences Commons BYU ScholarsArchive Citation BYU ScholarsArchive Citation Buss, Jessica Chelise, "Polymer Coated Urea in Kentucky Bluegrass" (2016). Theses and Dissertations. 5669. https://scholarsarchive.byu.edu/etd/5669 This Thesis is brought to you for free and open access by BYU ScholarsArchive. It has been accepted for inclusion in Theses and Dissertations by an authorized administrator of BYU ScholarsArchive. For more information, please contact [email protected], [email protected].
Transcript
Brigham Young University Brigham Young University
BYU ScholarsArchive BYU ScholarsArchive
Theses and Dissertations
2016-03-01
Polymer Coated Urea in Kentucky Bluegrass Polymer Coated Urea in Kentucky Bluegrass
Jessica Chelise Buss Brigham Young University - Provo
Follow this and additional works at: https://scholarsarchive.byu.edu/etd
This Thesis is brought to you for free and open access by BYU ScholarsArchive. It has been accepted for inclusion in Theses and Dissertations by an authorized administrator of BYU ScholarsArchive. For more information, please contact [email protected], [email protected].
Jessica Chelise Buss Department of Plant and Wildlife Sciences, BYU
Master of Science
Nitrogen (N) is the most commonly over-applied nutrient in urban environments because of the large visual and growth increases. This over-application has led to an increase in the loss of N gas in the forms of ammonia and nitrous oxide, as well as an increase in nitrate leaching to surface and groundwater. Furthermore, excess N results in increased maintenance costs and landfill volume due to increased shoot growth from mowed clipping removal. Polymer coated urea (PCU) has proven to be an excellent source to these losses of N to the environment, but rate and timing parameters need study. A two-year field study, on sand and sandy loam soils in Provo, UT, was initiated in April 2014. Seven fertilized treatments included: urea split applied monthly; a single application of PCU (Agrium One Ap) applied in spring, a single PCU application in fall; two evenly split applications in spring and late summer; and three evenly split applications in spring, late summer, and late fall. These were compared to an untreated control. In addition the two application of PCU also had reduced rates of half and three-quarters, in addition to the full rate. Height and verdure measurements were taken on a weekly basis, along with periodic visual and biomass readings. All fertilized treatments resulted in a significant response to N as compared to the control. The single annual application treatments had significantly greater shoot growth during the weeks immediately after application and a significant reduction in verdure months later and, therefore, were unacceptable for consumer recommendation. Two applications of PCU, either at the three-quarter or full rates, were nearly identical in all measurements as compared to the spoon feeding of urea applied monthly. The half rate of two applications showed signs of inadequate N. Three applications of PCU was identical to two and, therefore, not recommended. This study shows two applications of PCU at the three-quarter rate is equally effective as spoon feeding the N. Doing so would result in less labor for fertilization. Further work is needed to evaluate other timing approaches for a single annual application, as well as long term effects of a reduced rate of N.
Wilson, M., Rosen, C., & Moncrief, J. (2010). Effects of Polymer-Coated Urea on Nitrate
Leaching and Nitrogen Uptake by Potato. Journal of Environment Quality, 39, 492-499.
24
FIGURES
Figure 1 Kentucky bluegrass heights over two years for a trial on loam soil. Year 2014 is on top and 2015 is on the bottom. The data has been transformed with the grower’s standard practice (GSP) of urea/ammonium sulfate applied monthly as the line at zero (ideal) in comparison to polymer coated urea/ammonium sulfate applied once in spring (1Ap-S) and fall (1Ap-F) and a split two application once in spring and again in fall (2Ap) all at the100% rate. Statistics are shown in Tables 4 and 5.
25
Figure 2 Kentucky bluegrass heights for 2014 for a trial on sand soil. The data has been transformed with the grower’s standard practice (GSP) of urea/ammonium sulfate applied monthly as the line at zero (ideal) in comparison to polymer coated urea/ammonium sulfate applied once in spring (1Ap-S) and fall (1Ap-F) and a split two application once in spring and again in fall (2Ap) all at the 100% rate. Statistics are shown in Table 7.
26
Figure 3 Kentucky bluegrass NDVI readings over two years for a trial on loam soil. Year 2014 is on top and 2015 is on the bottom. The data has been transformed with the grower’s standard practice (GSP) of urea/ammonium sulfate applied monthly as the line at zero (ideal) in comparison to polymer coated urea/ammonium sulfate applied once in spring (1Ap-S) and fall (1Ap-F) and a split two application once in spring and again in fall (2Ap) all at the100% rate. Statistics are shown in Tables 9 and 10.
27
Figure 4 Kentucky bluegrass NDVI readings for 2014 for a trial on sand soil. The data has been transformed with the grower’s standard practice (GSP) of urea/ammonium sulfate applied monthly as the line at zero (ideal) in comparison to polymer coated urea/ammonium sulfate applied once in spring (1Ap-S) and fall (1Ap-F) and a split two application once in spring and again in fall (2Ap) all at the 100% rate. Statistics are shown in Table 12.
28
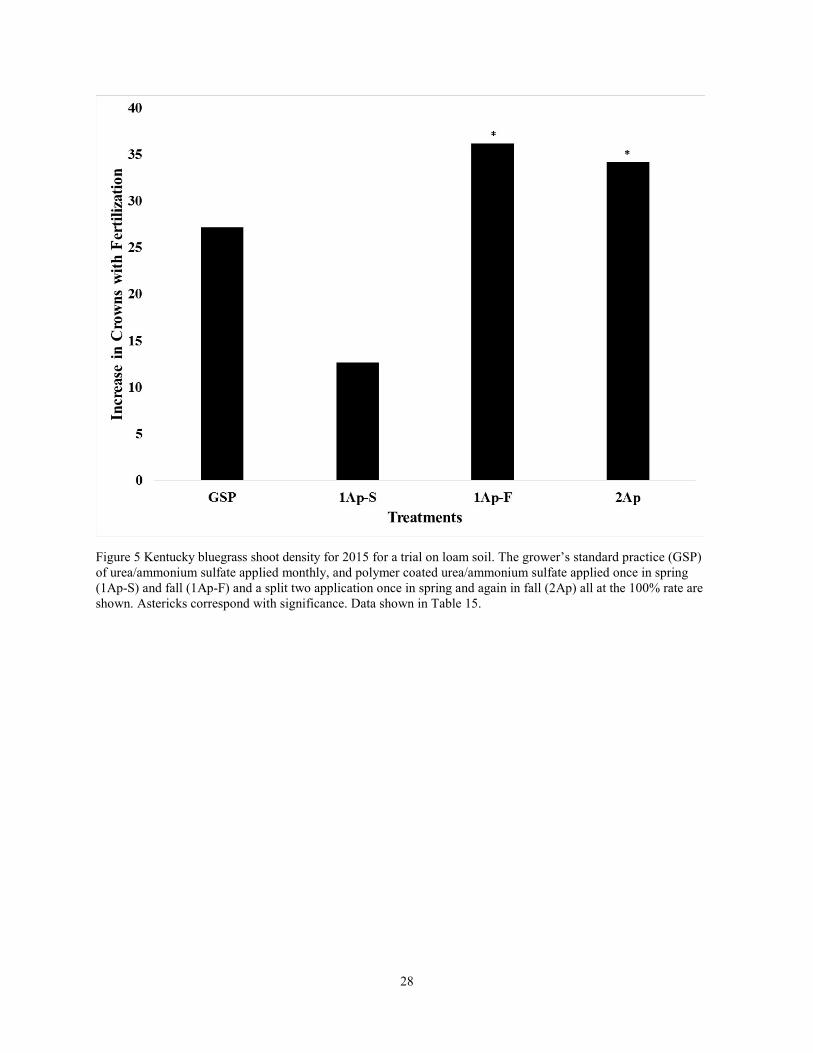
Figure 5 Kentucky bluegrass shoot density for 2015 for a trial on loam soil. The grower’s standard practice (GSP) of urea/ammonium sulfate applied monthly, and polymer coated urea/ammonium sulfate applied once in spring (1Ap-S) and fall (1Ap-F) and a split two application once in spring and again in fall (2Ap) all at the 100% rate are shown. Astericks correspond with significance. Data shown in Table 15.
29
TABLES
Table 1 Soil test values for two Kentucky bluegrass trials (Loam and Sand)
Texture Sandy Loam Sand
pH (2:1) 8 7.4
ECe (2:1) mmhos/cm-1 0.5 0.2
excess lime % 5 0 OM 2.4 1.6
NO3-N mg kg-1 4 2 NH4-N 2 2
P (bicarb) 19 5 K 275 75 S 15 5
Ca 2203 200 Mg 377 24 Na 92 23
Zn DTPA 1.6 0.5 Fe 9 5 Mn 8 2 Cu 0.6 0.3
B H2O 1.1 0.5
30
Table 2 Percentages of the full rate of nitrogen fertilizer for Kentucky bluegrass trials treatments. The N rate for each treatment was 19.5 and 29.3 g m-2 for loam and sand trials, respectively. Treatments included a grower’s standard practice (GSP) compared to polymer coated urea (PCU)/ammonium sulfate (AS) blends applied once in spring (1Ap-S), once in fall (1Ap-F), or with two annual applications—in spring and fall (2Ap).
height ordinal day <.0001 <.0001 <.0001 treatment <.0001 <.0001 <.0001
ordinal day*treatment <.0001 <.0001 <.0001
shoot N ordinal day 0.0007 0.0003 <.0001 treatment <.0001 <.0001 <.0001
ordinal day*treatment <.0001 <.0001 <.0001
32
Table 4 Height values with statistical analysis for a Kentucky bluegrass trial at the loam site in 2014 with a grower’s standard of practice (GSP) applied monthly as a urea/ammonium sulfate blend compared to polymer coated urea/ammonium sulfate blend fertilizer applied in one application in spring (1Ap-S) or fall (1Ap-F) or in two applications (2Ap). Fertilizer was applied at a full rate 100%. Values sharing the same letter within a date are not significantly different from one another. Dates without letters have no significant differences between any treatments on that date. P = 0.05
No data is shown for 1Ap-F prior to its first date of fertilization.
Ordinal Day of Year 135 162 170 176 183 190 197 204 211 218
------------------------------------------------ mm ------------------------------------------------ GSP 50 b 34 b 34 32 b 31 30 30 26 28 29 b 2Ap 58 ab 36 b 35 34 ab 33 30 29 28 30 30 ab
1Ap-S 63 a 46 a 39 43 a 38 33 29 33 31 38 a
Date 8/27 9/3 9/10 9/17 9/24 10/1 10/8 10/22 11/5
Ordinal Day of Year 239 246 253 260 267 274 281 295 309
------------------------------------------- mm ------------------------------------------- GSP 32 30 32 32 36 36 31 b 36 29 b 2Ap 33 31 34 30 36 38 34 ab 39 34 ab
1Ap-S 36 35 35 33 36 33 31 b 34 33 ab 1Ap-F 29 34 38 39 a 42 41 a
33
Table 5 Height values with statistical analysis for a Kentucky bluegrass trial at the loam site in 2015 with a grower’s standard of practice (GSP) applied monthly as a urea/ammonium sulfate blend compared to a polymer coated urea/ammonium sulfate blend fertilizer applied in one application in spring (1Ap-S) or fall (1Ap-F) or in two applications (2Ap). Fertilizer was applied at a full rate 100%. Values sharing the same letter within a date are not significantly different from one another. Dates without letters have no significant differences between any treatments on that date. P = 0.05
Ordinal Day of Year 238 245 252 261 266 273 280 287 294 301
------------------------------------------- mm -------------------------------------------- GSP 36 38 34 39 41 ab 36 ab 39 b 45 b 39 b 40 ab 2Ap 31 33 34 34 36 b 34 b 47 ab 41 bc 39 b 34 bc
1Ap-S 34 32 30 33 33 b 32 b 35 b 32 c 26 c 27c 1Ap-F 30 33 32 37 50 a 46 a 59 a 58 a 53 a 51 a
34
Table 6 Biomass values with statistical analysis for Kentucky bluegrass trials at the loam site in 2014 and 2015 with a grower’s standard of practice (GSP) applied monthly as a urea/ammonium sulfate blend compared to a polymer coated urea/ammonium sulfate blend fertilizer applied in one application in spring (1Ap-S) or fall (1Ap-F) or in two applications (2Ap). Fertilizer was applied at a full rate 100%. Values sharing the same letter within a date are not significantly different from one another. P = 0.05
No data is shown for 1Ap-F prior to its first date of fertilization.
2014 2015 Date
5/15 10/2 8/26 10/15 10/30
Ordinal Day of Year 135 275 238 288 303
GSP 30.45 a 23.84 a 21.43 a 14.19 ab 14.64 a 2Ap 42.29 a 38.57 ab 13.83 a 14.10 ab 12.69 a
1Ap-S 61.28 a 29.41 b 17.74 a 5.82 b 4.66 a 1Ap-F 27.82 a 8.48 a 19.41a 28.19 b
35
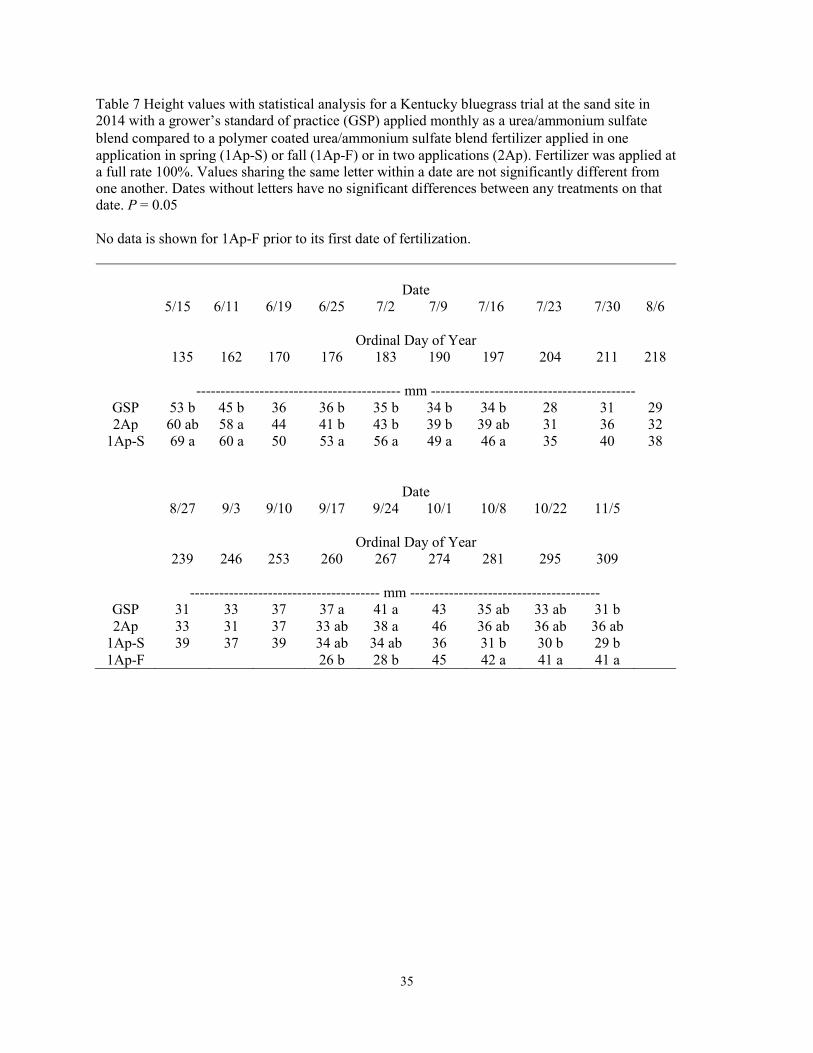
Table 7 Height values with statistical analysis for a Kentucky bluegrass trial at the sand site in 2014 with a grower’s standard of practice (GSP) applied monthly as a urea/ammonium sulfate blend compared to a polymer coated urea/ammonium sulfate blend fertilizer applied in one application in spring (1Ap-S) or fall (1Ap-F) or in two applications (2Ap). Fertilizer was applied at a full rate 100%. Values sharing the same letter within a date are not significantly different from one another. Dates without letters have no significant differences between any treatments on that date. P = 0.05
No data is shown for 1Ap-F prior to its first date of fertilization.
Ordinal Day of Year 135 162 170 176 183 190 197 204 211 218
------------------------------------------ mm ------------------------------------------ GSP 53 b 45 b 36 36 b 35 b 34 b 34 b 28 31 29 2Ap 60 ab 58 a 44 41 b 43 b 39 b 39 ab 31 36 32
1Ap-S 69 a 60 a 50 53 a 56 a 49 a 46 a 35 40 38
Date 8/27 9/3 9/10 9/17 9/24 10/1 10/8 10/22 11/5
Ordinal Day of Year 239 246 253 260 267 274 281 295 309
--------------------------------------- mm --------------------------------------- GSP 31 33 37 37 a 41 a 43 35 ab 33 ab 31 b 2Ap 33 31 37 33 ab 38 a 46 36 ab 36 ab 36 ab
1Ap-S 39 37 39 34 ab 34 ab 36 31 b 30 b 29 b 1Ap-F 26 b 28 b 45 42 a 41 a 41 a
36
Table 8 Biomass values with statistical analysis for a Kentucky bluegrass trial at the sand site in 2014 with a grower’s standard of practice (GSP) applied monthly as a urea/ammonium sulfate blend compared to a polymer coated urea/ammonium sulfate fertilizer applied in one application in spring (1Ap-S) or fall (1Ap-F) or in two applications (2Ap). Fertilizer was applied at a full rate 100%. Values sharing the same letter within a date are not significantly different from one another. P = 0.05
No data is shown for 1Ap-F prior to its first date of fertilization.
Date 5/15 10/2
Ordinal Day of Year 135 275
GSP 28.78 ab 45.11 a 2Ap 45.13 a 59.08 a
1Ap-S 62.30 ab 33.61 a 1Ap-F 25.59 a
37
Table 9 NDVI values (multiplied by 100) with statistical analysis for a Kentucky bluegrass trial at the loam site in 2014 with a grower’s standard of practice (GSP) applied monthly as a urea/ammonium sulfate blend compared to a polymer coated urea/ammonium sulfate fertilizer applied in one application in spring (1Ap-S) or fall (1Ap-F) or in two applications (2Ap). Fertilizer was applied at a full rate 100%. Values sharing the same letter within a date are not significantly different from one another. Dates without letters have no significant differences between any treatments on that date. P = 0.05
No data is shown for 1Ap-F prior to its first date of fertilization.
Ordinal Day of Year 233 239 246 253 260 267 274 281 288 295 309
GSP 67 66 70 70 68 71 69 71 71 ab 69 ab 66 ab 2Ap 69 68 66 67 65 69 70 74 74 ab 74 ab 72 a
1Ap-S 67 70 68 69 67 70 66 69 68 b 68 b 63 b 1Ap-F 66 65 71 71 77 77 a 78 a 74 a
38
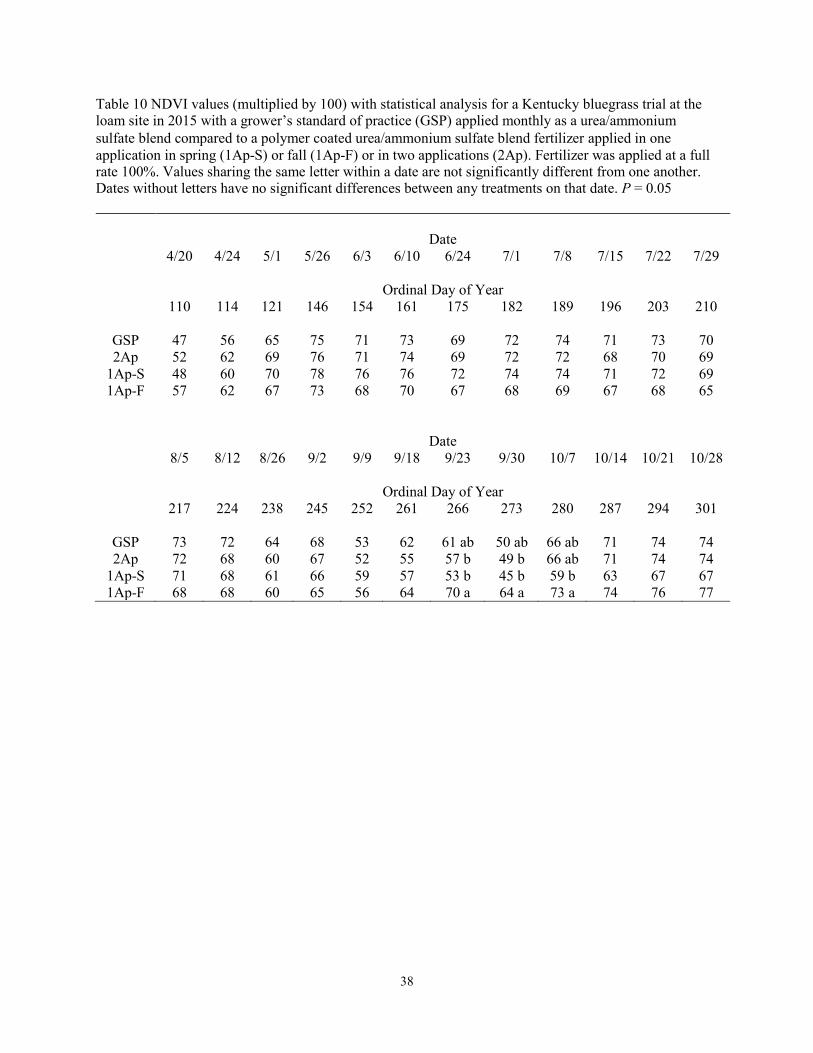
Table 10 NDVI values (multiplied by 100) with statistical analysis for a Kentucky bluegrass trial at the loam site in 2015 with a grower’s standard of practice (GSP) applied monthly as a urea/ammonium sulfate blend compared to a polymer coated urea/ammonium sulfate blend fertilizer applied in one application in spring (1Ap-S) or fall (1Ap-F) or in two applications (2Ap). Fertilizer was applied at a full rate 100%. Values sharing the same letter within a date are not significantly different from one another. Dates without letters have no significant differences between any treatments on that date. P = 0.05
Ordinal Day of Year 217 224 238 245 252 261 266 273 280 287 294 301
GSP 73 72 64 68 53 62 61 ab 50 ab 66 ab 71 74 74 2Ap 72 68 60 67 52 55 57 b 49 b 66 ab 71 74 74
1Ap-S 71 68 61 66 59 57 53 b 45 b 59 b 63 67 67 1Ap-F 68 68 60 65 56 64 70 a 64 a 73 a 74 76 77
39
Table 11 Visual values with statistical analysis for Kentucky bluegrass trials at the loam site in 2014 and 2015 with a grower’s standard of practice (GSP) applied monthly as a urea/ammonium sulfate blend compared to a polymer coated urea/ammonium sulfate blend fertilizer applied in one application in spring (1Ap-S) or fall (1Ap-F) or in two applications (2Ap). Fertilizer was applied at a full rate 100%. The statistics within the table display those treatments with the same letters as not being significantly different. Values sharing the same letter within a date are not significantly different from one another. P = 0.05.
No data is shown for 1Ap-F prior to its first date of fertilization.
2014 2015 Date
5/6 8/27 9/17 8/26 11/1
Ordinal Day of Year 126 239 260 238 305
GSP 2.00 ab 2.75 ab 3.00 a 3.44 a 3.69 ab 2Ap 2.50 a 2.88 ab 2.75 a 2.88 a 3.63 ab
1Ap-S 4.00 b 3.63 ab 3.13 a 2.69 a 2.88 a 1Ap-F 1.88 a 2.25 a 2.63 b 4.13 b
40
Table 12 NDVI values (multiplied by 100) with statistical analysis for a Kentucky bluegrass trial at the sand site in 2014 with a grower’s standard of practice (GSP) applied monthly as a urea/ammonium sulfate blend compared to a polymer coated urea/ammonium sulfate blend fertilizer applied in one application in spring (1Ap-S) or fall (1Ap-F) or in two applications (2Ap). Fertilizer was applied at a full rate 100%. Values sharing the same letter within a date are not significantly different from one another. Dates without letters have no significant differences between any treatments on that date. P = 0.05
No data is shown for 1Ap-F prior to its first date of fertilization.
Ordinal Day of Year 233 239 246 253 260 267 274 281 288 295 309
GSP 71 69 70 69 71 74 74 75 75 a 74 ab 70 ab 2Ap 72 70 68 68 66 71 73 75 75 a 76 a 74 a
1Ap-S 73 71 69 68 68 69 68 70 69 b 69 b 64 b 1Ap-F 67 66 70 75 78 78 a 78 a 76 a
41
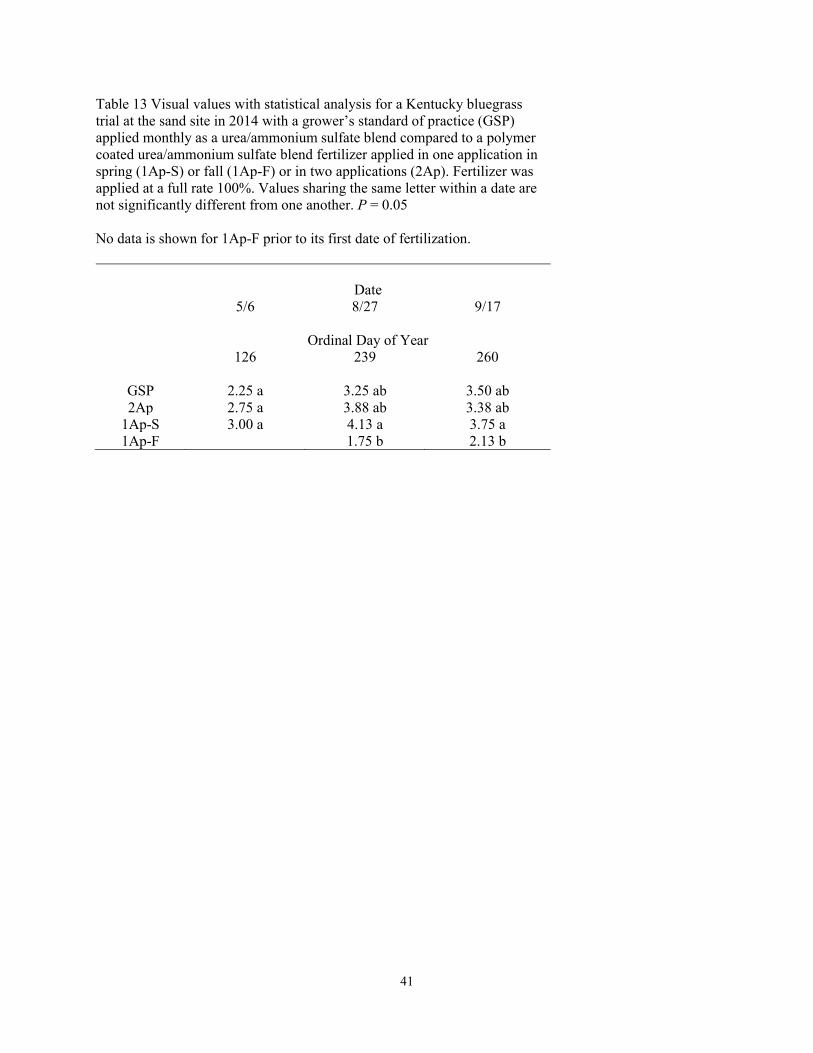
Table 13 Visual values with statistical analysis for a Kentucky bluegrass trial at the sand site in 2014 with a grower’s standard of practice (GSP) applied monthly as a urea/ammonium sulfate blend compared to a polymer coated urea/ammonium sulfate blend fertilizer applied in one application in spring (1Ap-S) or fall (1Ap-F) or in two applications (2Ap). Fertilizer was applied at a full rate 100%. Values sharing the same letter within a date are not significantly different from one another. P = 0.05
No data is shown for 1Ap-F prior to its first date of fertilization.
Date 5/6 8/27 9/17
Ordinal Day of Year 126 239 260
GSP 2.25 a 3.25 ab 3.50 ab 2Ap 2.75 a 3.88 ab 3.38 ab
1Ap-S 3.00 a 4.13 a 3.75 a 1Ap-F 1.75 b 2.13 b
42
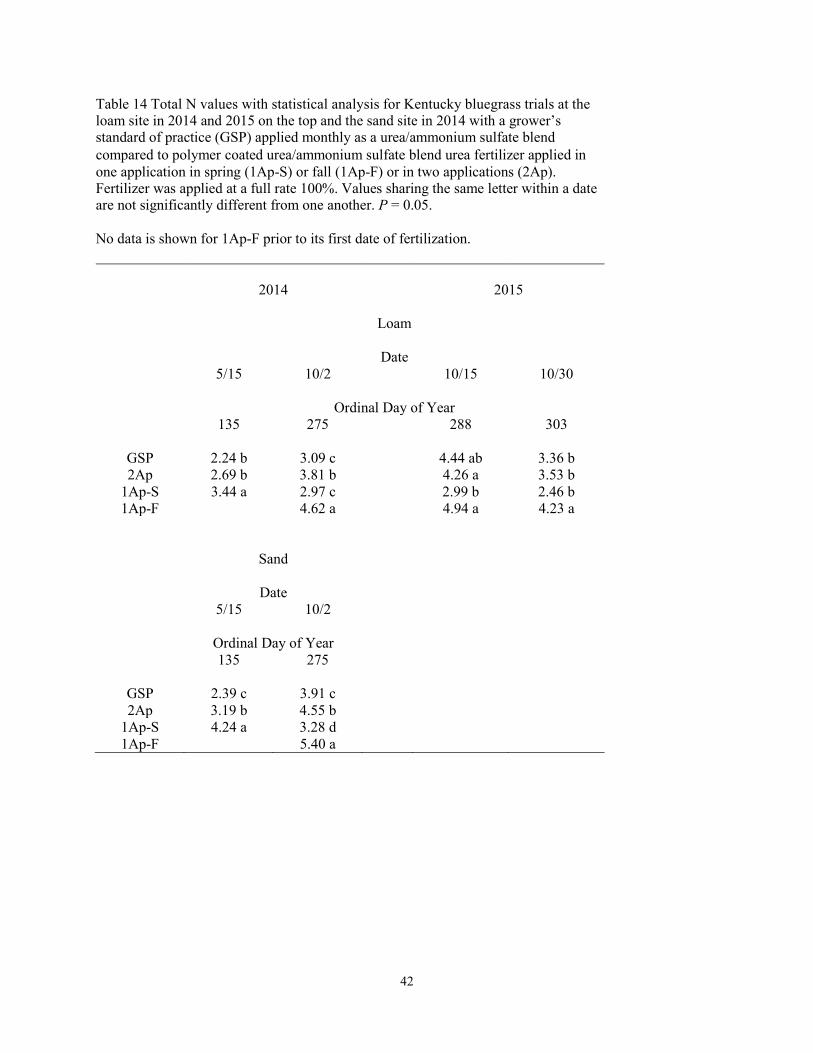
Table 14 Total N values with statistical analysis for Kentucky bluegrass trials at the loam site in 2014 and 2015 on the top and the sand site in 2014 with a grower’s standard of practice (GSP) applied monthly as a urea/ammonium sulfate blend compared to polymer coated urea/ammonium sulfate blend urea fertilizer applied in one application in spring (1Ap-S) or fall (1Ap-F) or in two applications (2Ap). Fertilizer was applied at a full rate 100%. Values sharing the same letter within a date are not significantly different from one another. P = 0.05.
No data is shown for 1Ap-F prior to its first date of fertilization.
2014 2015
Loam
Date 5/15 10/2 10/15 10/30
Ordinal Day of Year 135 275 288 303
GSP 2.24 b 3.09 c 4.44 ab 3.36 b 2Ap 2.69 b 3.81 b 4.26 a 3.53 b
1Ap-S 3.44 a 2.97 c 2.99 b 2.46 b 1Ap-F 4.62 a 4.94 a 4.23 a
Sand
Date 5/15 10/2
Ordinal Day of Year 135 275
GSP 2.39 c 3.91 c 2Ap 3.19 b 4.55 b
1Ap-S 4.24 a 3.28 d 1Ap-F 5.40 a
43
Table 15 Shoot density with statistical analysis for a Kentucky bluegrass trial at the loam site in 2015 with a grower’s standard of practice (GSP) applied monthly as a urea/ammonium sulfate blend compared to a polymer coated urea/ammonium sulfate blend fertilizer applied in one application in spring (1Ap-S) or fall (1Ap-F) or in two applications (2Ap). Fertilizer was applied at a full rate 100%. Values sharing the same letter within a date are not significantly different from one another. P = 0.05
Date
10/30
Ordinal Day of Year
303
GSP 61.5 2Ap 68.5
1Ap-S 47.0 1Ap-F 70.5
44
Polymer Coated Urea in Kentucky Bluegrass: Rate of Application
Jessica C. Buss, James H. Gish, Neil C. Hansen, and Bryan G. Hopkins
Brigham Young University, Provo, UT, USA
ABSTRACT
Nitrogen (N) is the most commonly over-applied nutrient in urban environments because of the
obvious difference in “greenness”. This over-application has led to nutrient pollution of the
atmosphere and hydrosphere. Furthermore, excess N results in increases in maintenance costs
and solid waste volume. A two-year study was initiated in April 2014. Four fertilized treatments
were applied at two locations in Provo, UT. Treatments included full recommended rate of a urea
and ammonium sulfate blend split applied monthly compared to a polymer coated urea (PCU)
and ammonium sulfate blend applied at 50, 75, or 100% of the full rate applied in two equal
applications early and late in the growing season. The PCU blend applied at the full rate
performed virtually the same as the blend with uncoated urea. Reducing the rate to 75% gave
very similar results for verdure and shoot growth at both locations. However, further reduction to
the half rate consistently had significantly lower plant verdure as compared to the other
treatments. This study shows that a reduction in rate by 25% results in similar plant verdure and
shoot growth as the full rate, but reducing the rate by 50% results in lower shoot growth as well
as lower plant verdure. Further work is needed to evaluate the long-term effects of a reduced rate
of N.
45
INTRODUCTION
As urban and suburban developments grow, turfgrass is quickly growing as the principle
managed land cover (National Turfgrass Federation, 2003; Walker, 2007). According to the
combination of studies done by Milesi et al. (2005) and Runfola et al. (2014) turfgrass coverage
in the U.S. is estimated to be 111,683 km2. Turfgrass occupies 1.9% of the total surface area in
the United States and is the leading irrigated crop in the country (Milesi et al., 2005). Turfgrass
serves important roles in society. Despite the many benefits, there are also concerns due to
consumption of natural resources and pollution issues.
One such concern is related to nitrogen (N) fertilization. Turfgrass managers typically
apply between 75 and 500 kg N ha-1 each year because it is the nutrient of greatest need and is
most likely to show visual symptoms if deficient (Milesi et al., 2005). As such, many
homeowners and turfgrass managers make the mistake of over applying N. The recommended
rate of N to be applied varies between and within species. Warm-season turfgrass requires ~50
kg N ha-1 for each month of active growth. Cool-season turfgrass requires ~150-250 kg N ha-1yr-1
(Christians, 2007).
Annual worldwide N fertilizer demand is projected to total over 112 thousand metric tons
in 2015 but the actual total applied is projected to be over 156,300,000 tons for the same year
(FAO, 2011). Over application of N-based fertilizers leads to an increase in shoot growth at the
expense of root growth. Poor rooting can result in unhealthy plants, poor surface conditions, and
inefficient water and fertilizer recovery rates. In addition, excessive shoot growth results in
increased mowing and an increase in clipping wastes and/or damage to the turfgrass if excessive
clippings are not removed. In addition to problems with plant health, excessive N application
increases risk of environmental problems. Nitrogen cycling in the ecosystem is a vital and
normal process, but excesses can result in problems with leaching of nitrate (NO3-) to
46
groundwater and runoff of NO3- and ammonium (NH4
+) to surface water bodies and atmospheric
pollution through nitrous oxide (N2O) emission and ammonia (NH3) volatilization.
Ammonia volatilization results in increases in air quality problems, including:
photochemical smog, particulate matter, strong odors, and acid rain. In addition, the
volatilization of NH3 is a concern with deposition on land or water bodies in sensitive systems.
Excessive N deposition can lead to reduction in plant community loss, as well as a reduction in
biodiversity (Sutton et al., 2008). The deposition of NH3 can also lead to soil acidification
(Sutton et al., 2008), as well as surface water eutrophication (Boyd, 2000).
Another gaseous N environmental issue is related to N2O. Hirsch et al. (2006) estimated
anthropogenic emissions of N2O to have increased by about 40-50% over preindustrial levels. It
is estimated that emissions directly related to fertilization account for 78% of the total annual
anthropogenic N2O losses (LeMonte et al., 2016; USEPA, 2007). The processes of nitrification
and denitrification lead to the formation of N2O which is lost to the environment (McTaggart et
al., 1994). The concern with N2O is that it is a long-lived, potent greenhouse gas with a
significantly greater potential of global warming by almost 300 times that of carbon dioxide
(CO2) (IPCC, 1995; USEPA, 2007).
Nitrogen excess in the hydrosphere is also a serious concern. Soil NO3- is easily leached
below the rooting zone due to it being a highly soluble anion that is repelled by negatively
charged soil. It has been reported that the annual rate of N leaching from turfgrass ranges
between 0 and 160 kg N ha-1 year-1—representing up to 30% of applied N (Barton, 2006).
Contaminated drinking water high in NO3- causes methemoglobinemia (baby blue syndrome) in
mammalian infants (Olson et al., 2009). It is also speculated to cause other health issues in
humans, but this is not proven.
47
Surface water contamination is also a concern. Both NH4+ and NO3
- can be easily
transported via surface water runoff and soil erosion (Easton, 2004). As with groundwater, NO3-
in surface water is also a potential drinking water problem. Additionally, excess N in surface
water can lead to problems from algal blooms—which can result in injury or death of the aquatic
life or organisms drinking the water, decreases in biodiversity, unsightly conditions, strong
odors, economic losses, and a decrease in recreational use (Fangmeier et al., 1994; Mulvaney et
al., 2009).
Along with needing to reduce the environmental impacts of N loss, it is also important to
recognize that N fertilizers are manufactured using natural gas and other nonrenewable
resources. In order to conserve resources and minimize environmental impacts, N loss needs to
be minimized by maximizing plant utilization of the applied N (Hopkins et al., 2008). Many
argue that planting turfgrass should be discouraged or even illegal. Although there are negative
impacts associated with turfgrass due to the over fertilization of the crop in agriculture and urban
settings and other issues (such as pesticide use and water consumption), there are many positive
impacts to society and the environment.
In addition to being aesthetically pleasing, providing a safe surface for many recreational
activities, and generating oxygen, turfgrass reduces: air temperature, atmospheric pollutants,
erosion, water and chemicals in storm drains, chemicals leached to groundwater, flooding, noise
pollution, and fire risk. By maintaining a low growing and green plant material next to buildings,
fires are less likely to spread. Air quality is improved because turfgrass is a good filter for
capturing smoke and dust. Sulfur and carbon dioxides are also absorbed from the atmosphere—
reducing acid rain and greenhouse gas concentration. In addition to the impact on global
48
temperature, the cooling effect of turfgrass makes for a more pleasant urban environment and
results in reduced use of natural resources to cool the interiors of neighboring buildings.
Sequestering carbon (C) into the soil results in improved soil health. Carbon
sequestration is the removal of C from the atmosphere in the form of carbon dioxide (CO2),
which is then held in the soil (Bremer, 2007). A possible concern with turfgrass is that it has to
be mowed and that the mowers are putting C into the atmosphere. It has been found that turfgrass
is able to sequester four times more C from the air than is put into the air by the typical
lawnmower engine. If the lawn is cared for with proper water, fertilizer, and mowing inputs then
the net carbon intake is five to seven times higher, which is up to 800 lbs of C per acre per year
(Qian, 2015), than the carbon output of the mowers used in managing the lawn (Bandaranayake,
2003; Milesi; Qian, 2015; Sahu).
However, in order to have these benefits, N is needed. Turfgrass requires a steady supply
of N to grow successfully (Christians, 2007). Nitrogen is the mineral nutrient generally found in
the highest concentration in plants and deficiencies can be dramatic from a visual perspective.
Nitrogen plays a vital role in many processes in the life cycle of a plant and they would not be
able to complete their life cycles without it. One of the most important biochemical processes
which N plays a role in is the formation of chlorophyll (Marshchner, 2012). With N playing such
a vital role in many processes there is a high demand for N to facilitate the essential biochemical
processes. Due to this high demand, as well as the high mobile nature of N causing it to be easily
lost to the surrounding environment, N is often the primary limiting factor for plant growth
(Chatterjee, 2012). Without the adequate concentrations of N, plant vigor, visual quality,
verdure, recovery from damage, and overall health are affected due to the production of less
chlorophyll and proteins resulting in a chlorosis and an increased susceptibility to pests and
49
diseases (Bowman, 2002; Geary, 2015; Marshchner, 2012). The essentialness of N leads to
efficient use within the plant following absorption. Nitrogen is only lost from the plant by rain or
mist-induced foliage leaching or defoliation (Barker, 2007). The repeated removal of plant
biomass by harvesting or mowing can result in a depletion of N reserves within the plant. Plants
are not able to regenerate N to the levels required following the removal of plant biomass—N
must be replenished mainly through the addition of fertilizer and soil amendments. A small
fraction of N can be replenished through atmospheric deposition, irrigation, and fixation of
atmospheric N by legumes. Atmospheric deposition and fixation do not provide adequate
amounts of N to meet the demands of plants. In order to meet the demands needed for high crop
production and most urban landscapes, N fertilization is required (LeMonte, 2011). Ideally,
fertilizer rate and application would be applied to meet the needs of the plant precisely.
Unfortunately, this ideal is not possible due to the inherent inefficiencies in the system.
Substantial increases in the efficiency of N are possible if best management practices (BMP) are
implemented. The key to good stewardship depends on using the right source, at the right rate, at
the right time, and with the right placement (Snyder et al., 2007).
The use of inefficient fertilizer types is a contributor to the negative environmental
impacts due to a low N-use efficiency (NUE) (Cameron, 2013; Nielson, 2006). It is estimated
that NUE for worldwide cereal production is only 33% (Blaylock et al., 2005). Schlesinger
(1992) estimated that 10% of all manufactured N fertilizer worldwide is volatilized as NH3-N
gas. In a growth chamber study, volatilization of surface-applied N fertilizers reached an excess
of 60% over the first 10 days following fertilization using warm-season bentgrass (Agrostis
palustris Huds.; Knight et al., 2007). Within North and Central America, about 54% of N2O-N
50
emitted is attributed to the addition of fertilizer (Blaylock et al., 2005; IPCC, 1996). The NUE
for turfgrass would be expected to be similarly low without best management practices.
Measures need to be taken in order to assure that the negative impacts of urban turfgrass
does not outweigh the positives. In trends over the last few decades, it has been shown that there
has been an increase in the rate of N fertilizer applied to crops especially corn. This has led to
less fertilizer nutrient recovery from the crops at harvest. It has been estimated that N recovery
was about 50% in the late 1980’s (Newbound, 1989). This indicates that there is a great deal of N
being lost to the environment (Bock, 1991; Shaviv, 1993). As shown by Ransom (2014),
LeMonte et al. (2016), and Minami (1994) the losses of N to the environment can be reduced
with the use of control release fertilizers (CRF) and slow release fertilizers (SRF). These
fertilizers are used to allow for the delivery of N over extended periods while reducing risk of
loss to the environment and, thus, increasing NUE. These CRF and SRF materials are designed
to release N over extended time periods, as opposed to traditional “quick release” fertilizers,
which release N to the soil all at once. The engineering of the CRF and SRF materials is an
attempt to match more closely plant N needs throughout the growing season, while reducing the
exposure time and loss of N (Blaylock et al., 2005). Research shows that SRF and CRFs have
made significant impacts on crop yields and impacts on N loss to the environment (Hyatt, 2010;
Simultaneous Records of N2O and NO Fluxes from a Farmed Cropland in the Northern
China Plain with a Reduced Nitrogen Addition Rate by One-Third. Agriculture, Ecosystems
& Environment, 178, 39-50.
70
FIGURES
Figure 1 Kentucky bluegrass heights over two years for a trial on loam soil. Year 2014 is on top and 2015 is on the bottom. The data has been transformed with the grower’s standard practice (GSP) of urea/ammonium sulfate applied monthly as the line at zero (ideal) in comparison to polymer coated urea/ammonium sulfate applied at the 100% rate same as GSP (P100) and reduced rates of 50% (P50) and 75% (P75). Statistics shown in Tables 4 and 5.
71
Figure 2 Kentucky bluegrass heights for 2014 for a trial on sand soil. The data has been transformed with the grower’s standard practice (GSP) of urea/ammonium sulfate applied monthly as the line at zero (ideal) in comparison to polymer coated urea/ammonium sulfate applied at the 100% rate same as GSP (P100) and reduced rates of 50% (P50) and 75% (P75). Statistics shown in Table 7.
72
Figure 3 Kentucky bluegrass verdure as measured by NDVI readings over two years for a trial on loam soil. Year 2014 is on top and 2015 is on the bottom. The data has been transformed with the grower’s standard practice (GSP) of urea/ammonium sulfate applied monthly as the line at zero (ideal) in comparison to polymer coated urea/ammonium sulfate applied at the 100% rate same as GSP (P100) and reduced rates of 50% (P50) and 75% (P75). Statistics shown in Tables 9 and 10.
73
Figure 4 Kentucky bluegrass verdure as measured by NDVI readings for 2014 for a trial on sand soil. The data has been transformed with the grower’s standard practice (GSP) of urea/ammonium sulfate applied monthly as the line at zero (ideal) in comparison to polymer coated urea/ammonium sulfate applied at the 100% rate same as GSP (P100) and reduced rates of 50% (P50) and 75% (P75). Statistics shown in Table 12.
74
Figure 5 Kentucky bluegrass Shoot density for 2015 for a trial on loam soil. The data has been transformed with the control in comparison to the grower’s standard practice (GSP) of urea/ammonium sulfate applied monthly, and polymer coated urea/ammonium polymer coated urea applied at the 100% rate same as GSP (P100) and reduced rates of 50% (P50) and 75% (P75). Data shown in Table 15.
75
TABLES
Table 1 Soil test values for two Kentucky bluegrass trials (Loam and Sand)
Texture Sandy Loam Sand
pH (2:1) 8 7.4
ECe (2:1) mmhos cm-1 0.5 0.2
excess lime % 5 0 OM 2.4 1.6
NO3-N mg kg-1 4 2 NH4-N 2 2
P (bicarb) 19 5 K 275 75 S 15 5
Ca 2203 200 Mg 377 24 Na 92 23
Zn DTPA 1.6 0.5 Fe 9 5 Mn 8 2 Cu 0.6 0.3
B H2O 1.1 0.5
76
Table 2 Percentages of the full rate of nitrogen fertilizer for Kentucky bluegrass trials treatments. The full rate for the grower’s standard practice (GSP) and the polymer coated urea (PCU)/ammonium sulfate (AS) blend was 19.5 and 29.3 g m-2 for loam and sand trials, respectively. The reduced rate treatments had 50% and 75% of these amounts for P50 and P75, respectively.
height ordinal day <.0001 <.0001 <.0001 treatment <.0001 <.0001 <.0001
ordinal day*treatment <.0001 <.0001 <.0001
shoot N ordinal day 0.0007 0.0003 <.0001 treatment <.0001 <.0001 <.0001
ordinal day*treatment <.0001 <.0001 <.0001
78
Table 4 Height values with statistical analysis for a Kentucky bluegrass trial at the loam site in 2014 with a grower’s standard of practice (GSP) applied monthly as a urea/ammonium sulfate blend compared to a polymer coated urea/ammonium sulfate blend fertilizer applied in two applications at differing rates with a full rate (P100), three-quarter the rate (P75), and half the rate (P50). Values sharing the same letter within a date are not significantly different from one another. Dates without letters have no significant differences between any treatments on that date. P = 0.05
Ordinal Day of Year 239 246 253 260 267 274 281 295 309
------------------------------------------- mm -------------------------------------- GSP 32 30 32 32 36 36 31 36 ab 29 P100 33 31 34 30 36 38 34 39 a 34 P75 31 29 32 30 33 36 30 32 ab 32 P50 30 26 30 30 29 30 29 29 b 30
79
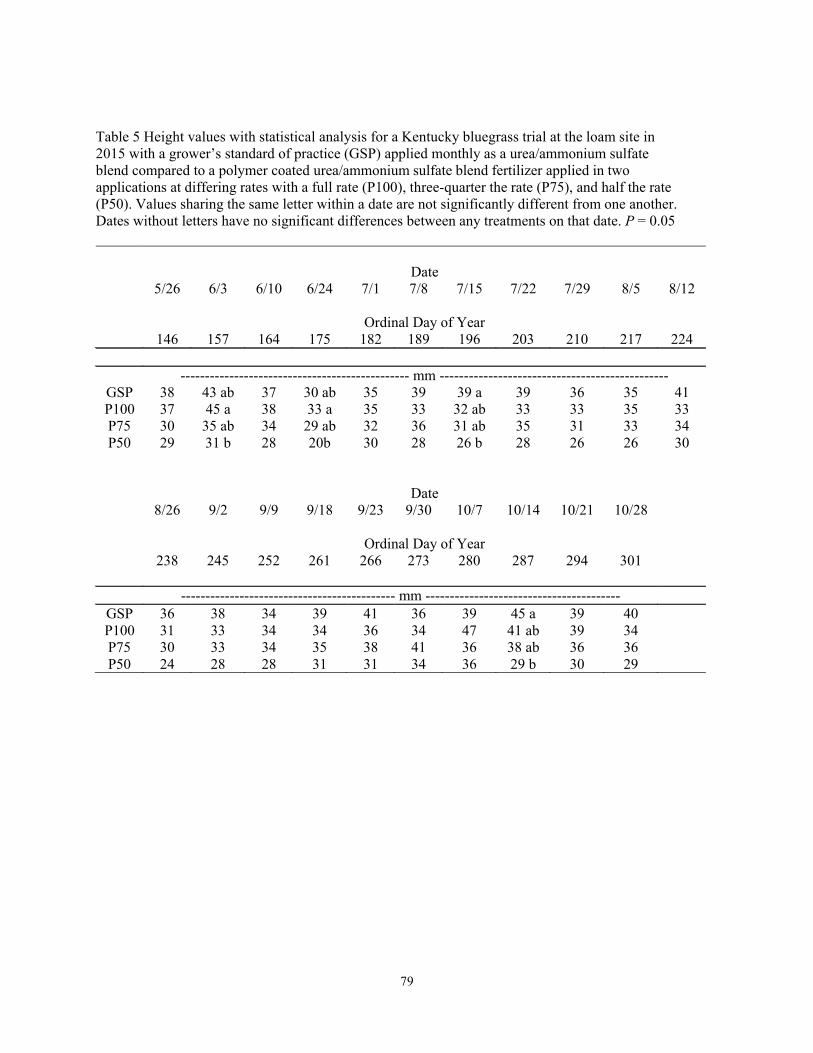
Table 5 Height values with statistical analysis for a Kentucky bluegrass trial at the loam site in 2015 with a grower’s standard of practice (GSP) applied monthly as a urea/ammonium sulfate blend compared to a polymer coated urea/ammonium sulfate blend fertilizer applied in two applications at differing rates with a full rate (P100), three-quarter the rate (P75), and half the rate (P50). Values sharing the same letter within a date are not significantly different from one another. Dates without letters have no significant differences between any treatments on that date. P = 0.05
Table 6 Biomass values with statistical analysis for Kentucky bluegrass trials at the loam site in 2014 and 2015 with a grower’s standard of practice (GSP) applied monthly as a urea/ammonium sulfate blend compared to a polymer coated urea/ammonium sulfate blend fertilizer applied in two applications at differing rates with a full rate (P100), three-quarter the rate (P75), and half the rate (P50). Values sharing the same letter within a date are not significantly different from one another. P = 0.05
GSP 30.5 ab 23.8 a 21.4 a 14.2 a 14.6 a P100 42.3 a 38.6 a 13.8 ab 14.1 a 12.7 a P75 33.1 ab 21.2 a 10.8 ab 8.6 a 11.1 a P50 28.2 b 8.1 a 2.9 b 2.1 a 2.1 a
81
Table 7 Height values with statistical analysis for a Kentucky bluegrass trial at the sand site in 2014 with a grower’s standard of practice (GSP) applied monthly as a urea/ammonium sulfate blend compared to a polymer coated urea/ammonium sulfate blend fertilizer applied in two applications at differing rates with a full rate (P100), three-quarter the rate (P75), and half the rate (P50). Values sharing the same letter within a date are not significantly different from one another. Dates without letters have no significant differences between any treatments on that date. P = 0.05
Ordinal Day of Year 135 162 170 176 183 190 197 204 211 218
GSP 5.3 ab 4.5 b 3.6 3.6 ab 3.5 ab 3.4 3.4 2.8 3.1 2.9 P100 6.0 a 5.8 a 4.4 4.1 a 4.3 a 3.9 3.9 3.1 3.6 3.2 P75 4.9 b 5.0 ab 3.7 3.6 ab 3.4 ab 3.5 3.3 2.9 3.3 2.8 P50 5.1 ab 4.3 b 3.50 3.1 b 3.2 b 3.1 3.1 2.5 2.8 2.6
Date 8/27 9/3 9/10 9/17 9/24 10/1 10/8 10/22 11/5
Ordinal Day of Year 239 246 253 260 267 274 281 295 309
GSP 3.1 3.3 3.7 3.7 4.1 a 4.3 a 3.5 3.3 3.1 P100 3.3 3.1 3.7 3.3 3.8 a 4.6 a 3.6 3.6 3.6 P75 3.1 2.7 3.4 3.0 3.4 ab 3.8 ab 3.5 3.3 3.0 P50 2.9 2.6 3.2 2.8 2.6 b 2.9 b 2.8 2.9 2.7
82
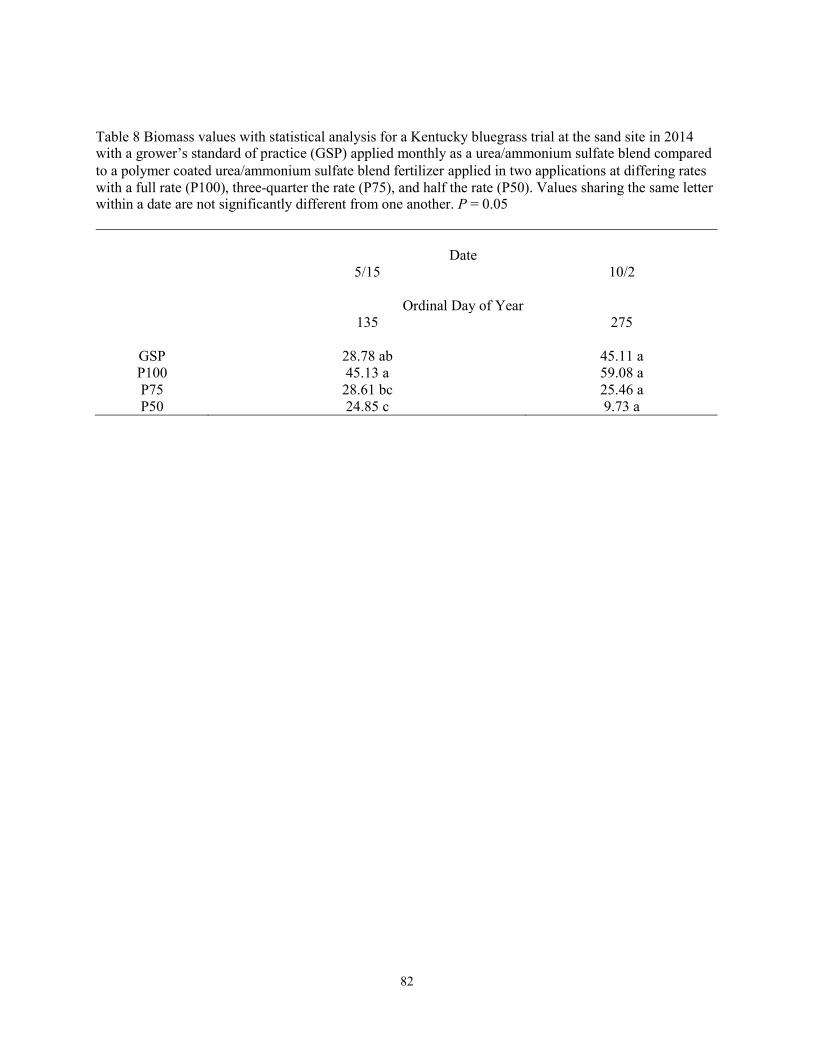
Table 8 Biomass values with statistical analysis for a Kentucky bluegrass trial at the sand site in 2014 with a grower’s standard of practice (GSP) applied monthly as a urea/ammonium sulfate blend compared to a polymer coated urea/ammonium sulfate blend fertilizer applied in two applications at differing rates with a full rate (P100), three-quarter the rate (P75), and half the rate (P50). Values sharing the same letter within a date are not significantly different from one another. P = 0.05
Date 5/15 10/2
Ordinal Day of Year 135 275
GSP 28.78 ab 45.11 a P100 45.13 a 59.08 a P75 28.61 bc 25.46 a P50 24.85 c 9.73 a
83
Table 9 NDVI values (multiplied by 100) with statistical analysis for a Kentucky bluegrass trial at the loam site in 2014 with a grower’s standard of practice (GSP) applied monthly as a urea/ammonium sulfate blend compared to a polymer coated urea/ammonium sulfate blend fertilizer applied in two applications at differing rates with a full rate (P100), three-quarter the rate (P75), and half the rate (P50). There were no significant differences between treatments within any date. P = 0.05
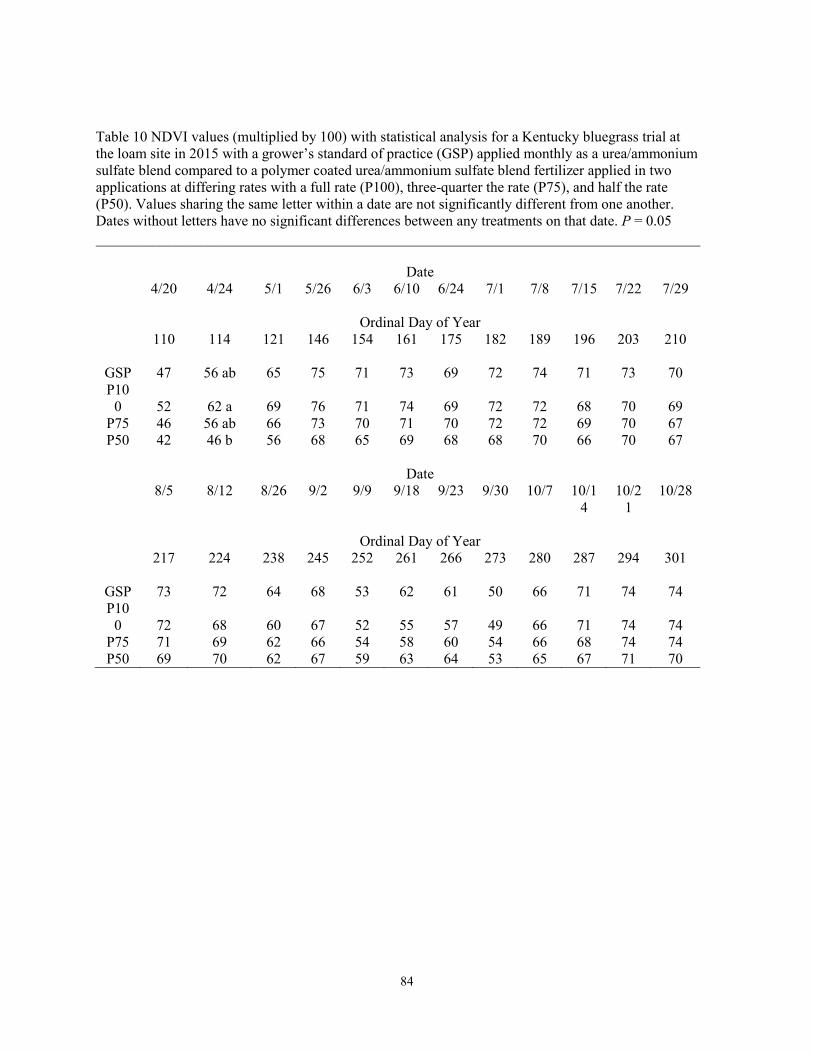
Table 10 NDVI values (multiplied by 100) with statistical analysis for a Kentucky bluegrass trial at the loam site in 2015 with a grower’s standard of practice (GSP) applied monthly as a urea/ammonium sulfate blend compared to a polymer coated urea/ammonium sulfate blend fertilizer applied in two applications at differing rates with a full rate (P100), three-quarter the rate (P75), and half the rate (P50). Values sharing the same letter within a date are not significantly different from one another. Dates without letters have no significant differences between any treatments on that date. P = 0.05
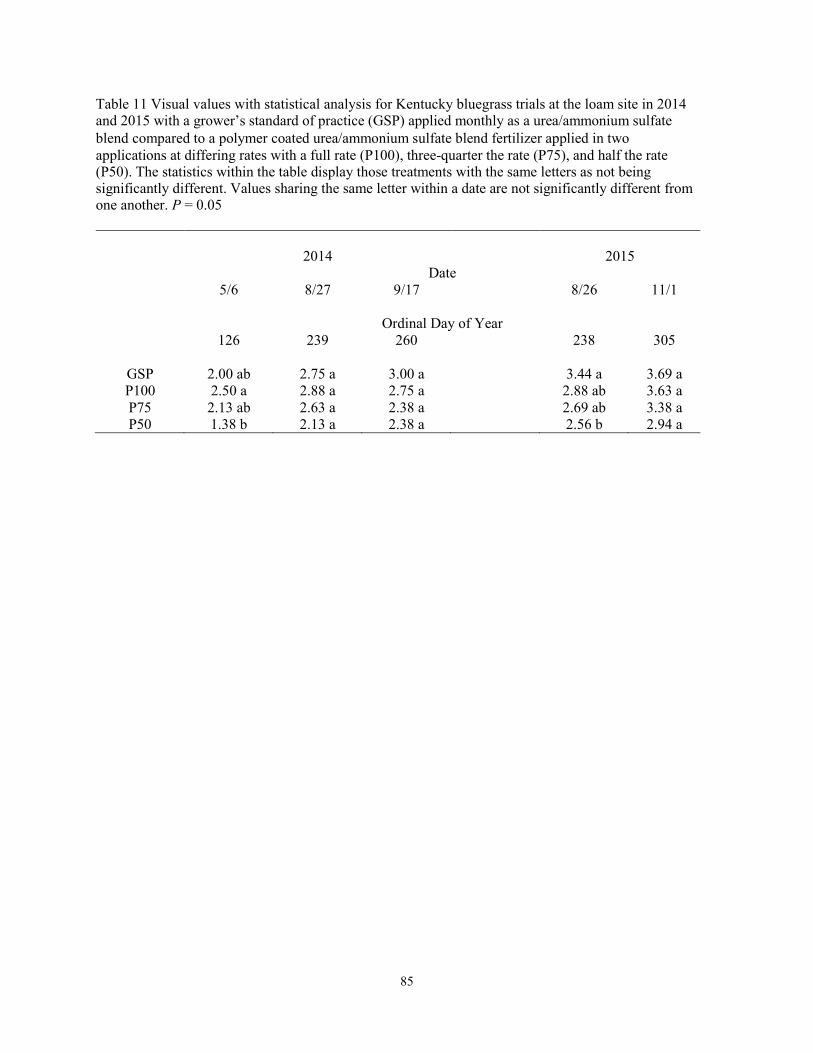
Table 11 Visual values with statistical analysis for Kentucky bluegrass trials at the loam site in 2014 and 2015 with a grower’s standard of practice (GSP) applied monthly as a urea/ammonium sulfate blend compared to a polymer coated urea/ammonium sulfate blend fertilizer applied in two applications at differing rates with a full rate (P100), three-quarter the rate (P75), and half the rate (P50). The statistics within the table display those treatments with the same letters as not being significantly different. Values sharing the same letter within a date are not significantly different from one another. P = 0.05
2014 2015 Date
5/6 8/27 9/17 8/26 11/1
Ordinal Day of Year 126 239 260 238 305
GSP 2.00 ab 2.75 a 3.00 a 3.44 a 3.69 a P100 2.50 a 2.88 a 2.75 a 2.88 ab 3.63 a P75 2.13 ab 2.63 a 2.38 a 2.69 ab 3.38 a P50 1.38 b 2.13 a 2.38 a 2.56 b 2.94 a
86
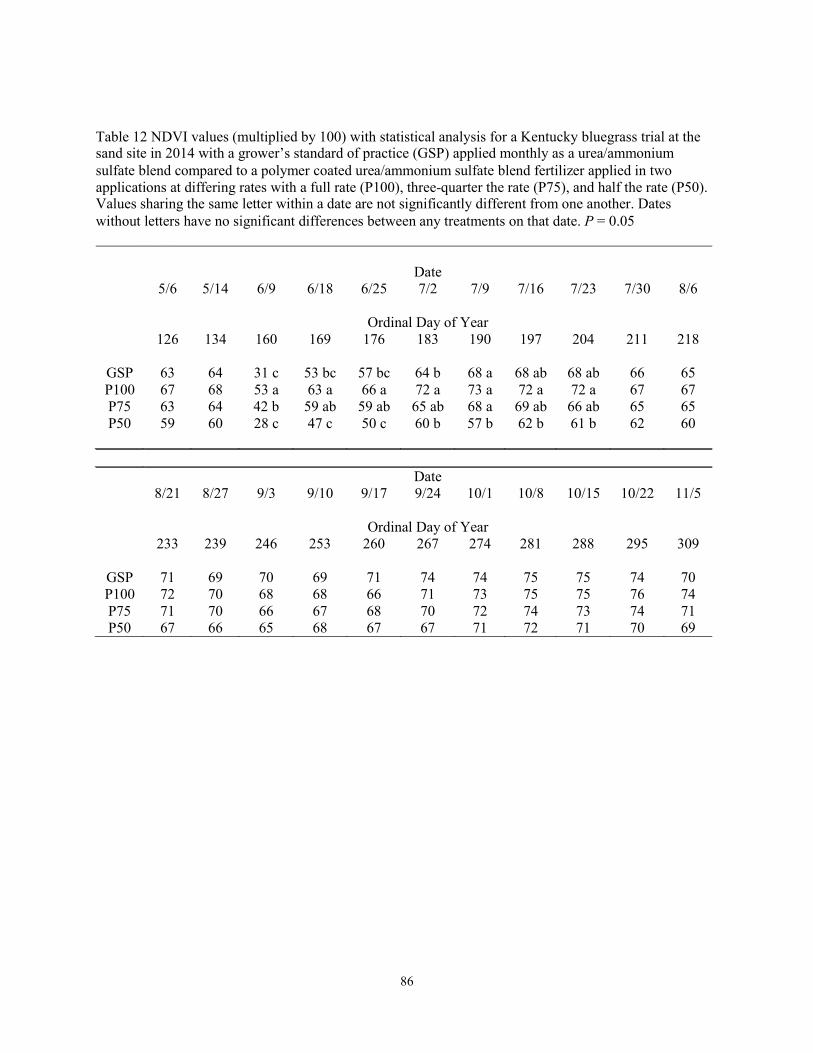
Table 12 NDVI values (multiplied by 100) with statistical analysis for a Kentucky bluegrass trial at the sand site in 2014 with a grower’s standard of practice (GSP) applied monthly as a urea/ammonium sulfate blend compared to a polymer coated urea/ammonium sulfate blend fertilizer applied in two applications at differing rates with a full rate (P100), three-quarter the rate (P75), and half the rate (P50). Values sharing the same letter within a date are not significantly different from one another. Dates without letters have no significant differences between any treatments on that date. P = 0.05
Ordinal Day of Year 126 134 160 169 176 183 190 197 204 211 218
GSP 63 64 31 c 53 bc 57 bc 64 b 68 a 68 ab 68 ab 66 65 P100 67 68 53 a 63 a 66 a 72 a 73 a 72 a 72 a 67 67 P75 63 64 42 b 59 ab 59 ab 65 ab 68 a 69 ab 66 ab 65 65 P50 59 60 28 c 47 c 50 c 60 b 57 b 62 b 61 b 62 60
Table 13 Visual values with statistical analysis for a Kentucky bluegrass trial at the sand site in 2014 with a grower’s standard of practice (GSP) applied monthly as a urea/ammonium sulfate blend compared to a polymer coated urea/ammonium sulfate blend fertilizer applied in two applications at differing rates with a full rate (P100), three-quarter the rate (P75), and half the rate (P50). Values sharing the same letter within a date are not significantly different from one another. P = 0.05
Date 5/6 8/27 9/17
Ordinal Day of Year 126 239 260
GSP 2.25 ab 3.25 a 3.50 a P100 2.75 a 3.88 a 3.38 a P75 2.25 ab 3.00 a 3.00 a P50 1.38 b 2.88 a 2.88 a
88
Table 14 Total N values with statistical analysis for Kentucky bluegrass trials at the loam site in 2014 and 2015 on the top and the sand site in 2014 with a grower’s standard of practice (GSP) applied monthly as a urea/ammonium sulfate blend compared to polymer coated urea/ammonium sulfate bled fertilizer applied in two applications at differing rates with a full rate (P100), three-quarter the rate (P75), and half the rate (P50). Values sharing the same letter within a date are not significantly different from one another. P= 0.05.
Loam 2014 2015
Date 5/15 10/2 10/15 10/30
Ordinal Day of Year 135 275 288 303
GSP 2.24 ab 3.09 a 4.44 a 3.36 a P100 2.69 b 3.81 b 4.26 a 3.53 a P75 2.31 b 3.21 ab 3.73 a 3.13 a P50 1.87 a 2.67 a 3.00 a 2.53 a
Sand
Date 5/15 10/2
Ordinal Day of Year 135 275
GSP 2.39 a 3.91 b P100 3.19 b 4.55 c P75 2.58 a 3.77 b P50 2.07 a 3.03 a
89
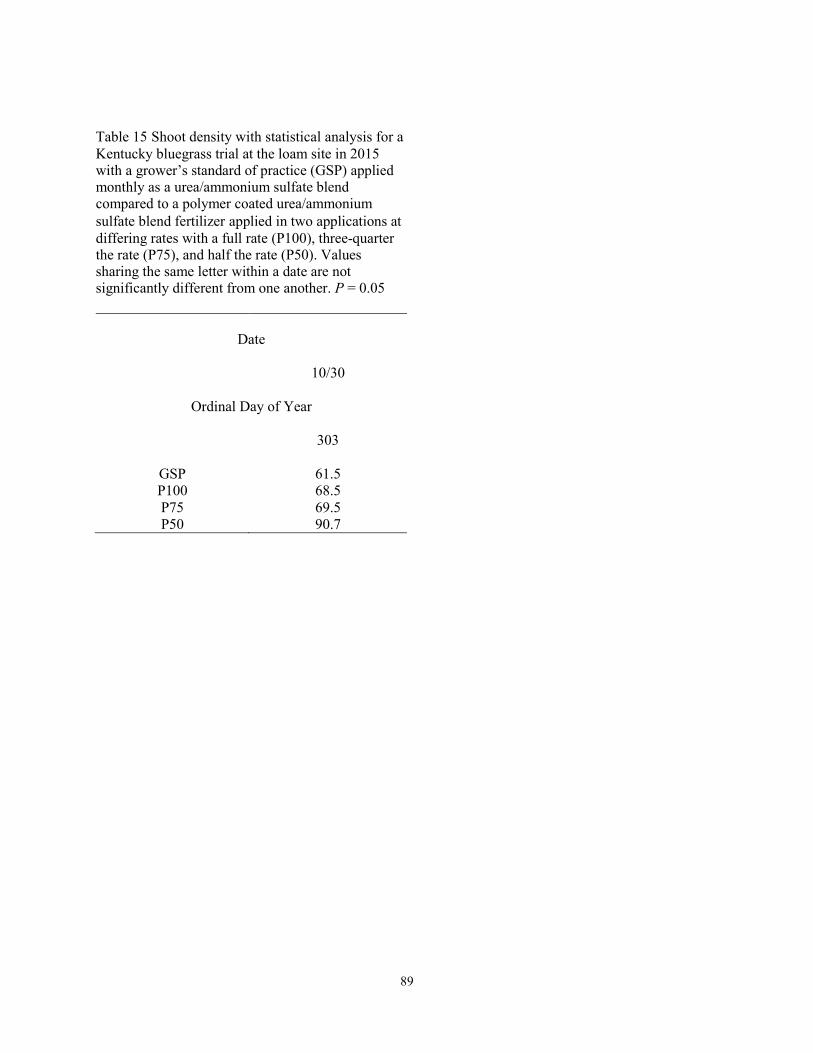
Table 15 Shoot density with statistical analysis for a Kentucky bluegrass trial at the loam site in 2015 with a grower’s standard of practice (GSP) applied monthly as a urea/ammonium sulfate blend compared to a polymer coated urea/ammonium sulfate blend fertilizer applied in two applications at differing rates with a full rate (P100), three-quarter the rate (P75), and half the rate (P50). Values sharing the same letter within a date are not significantly different from one another. P = 0.05
Date
10/30
Ordinal Day of Year
303
GSP 61.5 P100 68.5 P75 69.5 P50 90.7
90
Appendix A
The following is supplementary data collected for the Timing Study (Chapter 1), but not included in the main paper.
Root Density: Loam Soil Trial
Appendix Table 1 Root density (g) with statistical analysis for a Kentucky bluegrass trial at the loam site in 2015 with a grower’s standard of practice (GSP) applied monthly as a urea/ammonium sulfate blend compared to a polymer coated urea/ammonium sulfate blend fertilizer applied in one application in spring (1Ap-S) or fall (1Ap-F) or in two applications (2Ap). Fertilizer was applied at a full rate 100%. Values sharing the same letter within a date are not significantly different from one another. P = 0.05
Date
10/30
Ordinal Day of Year
303
GSP 3.91 a 2Ap 3.19 a
1Ap-S 3.01 a 1Ap-F 5.10 a
91
Loam Biomass
Shoot biomass at the first sampling date in 2014 showed a significant difference between 1Ap-S
and the GSP with 1Ap-S having a larger biomass which corresponds directly with the significant
height difference for 1Ap-S over the GSP on the same date (Fig. 1). There were no significant
biomass differences on the second date in 2014 which also corresponds with the height
measurements on the same date. There were no differences for the first date in 2015 for biomass
or height. The second date in 2015 had significant differences in the biomass of 1Ap-F having
significantly greater biomass than 1Ap-S. The height for the same date is different from the
biomass with the 1Ap-F being significantly greater than the GSP, 1Ap-S, and 2Ap. There was a
significant difference in biomass on the third date of 2015 with 1Ap-F having significantly
greater biomass than the GSP, 1Ap-S, and 2Ap. The height results slightly differ from the
biomass for the same date in that the height of 1Ap-F was not significantly greater than the GSP.
92
Appendix Figure 1 Kentucky bluegrass biomass for 2014 and 2015 for a trial on loam soil. The grower’s standard practice (GSP) of urea/ammonium sulfate applied monthly, and polymer coated urea/ammonium sulfate applied once in spring (1Ap-S) and fall (1Ap-F) and a split application once in spring and again in fall (2Ap) all at the 100% rate are shown. Letters above bars correspond with the treatments in which it is statistically significant. Bars without letters did not have significance in relation to the other treatments. The biomass is not shown for 1Ap-F until after the application in fall 2014. Data shown in Table 6.
Sand Biomass
Shoot biomass at the first sampling date in 2014 showed a significant difference between 1Ap-S
and the GSP and 2Ap with 1Ap-S having a larger biomass (Table 8). These differences
correspond with the significant height difference for 1Ap-S over the GSP and 2Ap on the same
date. There were no significant differences on the second date in 2014 which is also consistent
with the heights on the same date.
93
Appendix Figure 2 Kentucky bluegrass biomass for 2014 for a trial on sand soil. The grower’s standard practice (GSP) of urea/ammonium sulfate applied monthly, and polymer coated urea/ammonium sulfate applied once in spring (1Ap-S) and fall (1Ap-F) and a split application once in spring and again in fall (2Ap) all at the 100% rate are shown. Letters above bars correspond with the treatments in which it is statistically significant. Bars without letters did not have significance in relation to the other treatments. The biomass is not shown for 1Ap-F until after the application in fall 2014. Data shown in Table 8.
Loam Visual
Although NDVI did not show a difference on ordinal day 126, when the first visual ratings of
plant health and verdure were made in 2014, 1Ap-S had significantly higher ratings than GSP
and 2Ap (Table 11; Fig. 4). On the subsequent visual rating dates, there were no significant
differences for visual ratings, which corresponds with the NDVI readings on the same dates. In
2015, there were no significant differences for visual ratings on either of the dates. This
correspond with the NDVI readings for the same two dates. For both years, the visual ratings
followed the same trend for the different treatments as the NDVI readings for the same dates.
94
Appendix Figure 3 Kentucky bluegrass visual ratings for 2014 and 2015 for a trial on loam soil. The grower’s standard practice (GSP) of urea/ammonium sulfate applied monthly, and polymer coated urea/ammonium sulfate applied once in spring (1Ap-S) and fall (1Ap-F) and a split application once in spring and again in fall (2Ap) all at the 100% rate are shown. Letters above bars correspond with the treatments in which it is statistically significant. Bars without letters did not have significance in relation to the other treatments. The visual ratings are not shown for 1Ap-F until after the application in fall 2014. Data shown in Table 11.
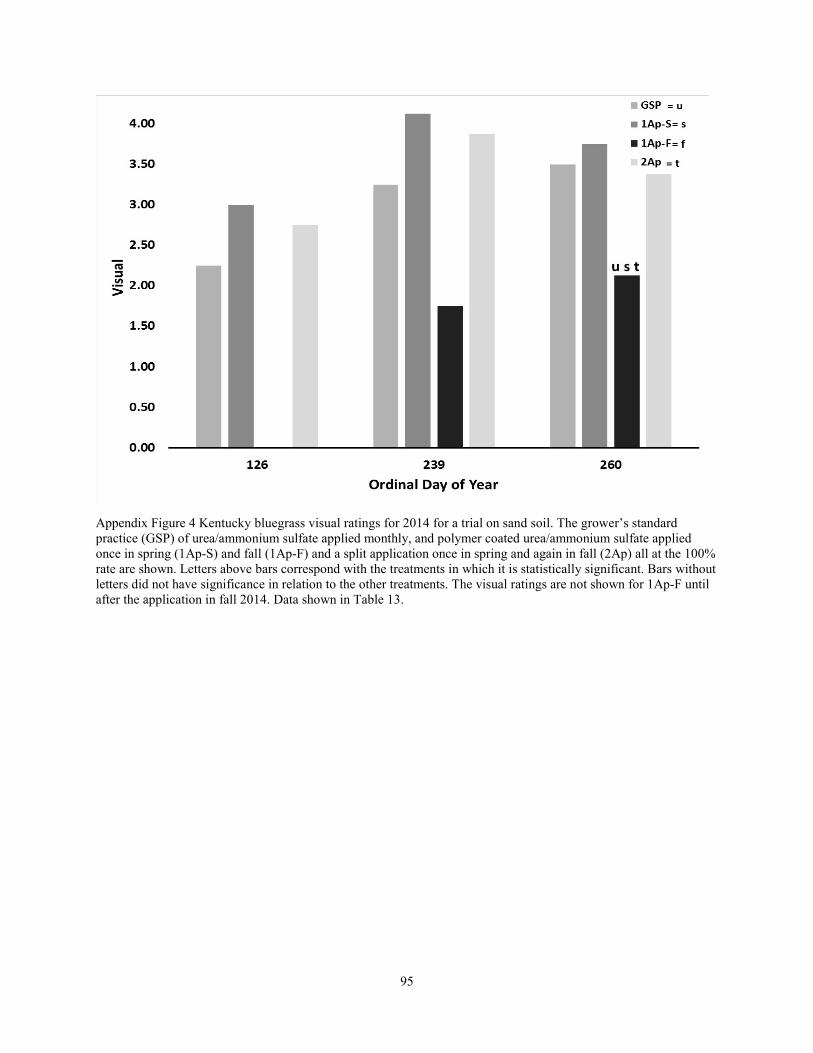
Sand Visual
Visual ratings on the first and second dates in 2014 (Table 13) showed no significant
differences, which corresponds with the NDVI readings for the same dates (Fig. 5 and 8). On the
third date the visual ratings showed a significant difference with the GSP, 1Ap-S, and 2Ap
having greater visual ratings than 1Ap-F (Fig. 6). This does not correspond with the NDVI
readings for the same date, but there were the same general trends between the visual ratings and
the NDVI readings.
95
Appendix Figure 4 Kentucky bluegrass visual ratings for 2014 for a trial on sand soil. The grower’s standard practice (GSP) of urea/ammonium sulfate applied monthly, and polymer coated urea/ammonium sulfate applied once in spring (1Ap-S) and fall (1Ap-F) and a split application once in spring and again in fall (2Ap) all at the 100% rate are shown. Letters above bars correspond with the treatments in which it is statistically significant. Bars without letters did not have significance in relation to the other treatments. The visual ratings are not shown for 1Ap-F until after the application in fall 2014. Data shown in Table 13.
96
Three Applications
When three applications was rarely statistically different in shoot height as well as plant verdure
in both the loam and sand trials when compared to the GSP (Appendix Figs. 5-12). Similarly,
the three applications was never statistically different than two applications of PCU. This shows
that a reduction of applications to two can be done without any negative effects on the turf.
Appendix Table 2 Height values with statistical analysis for a Kentucky bluegrass trial at the loam site in 2014 with a grower’s standard of practice (GSP) applied monthly as a urea/ammonium sulfate blend compared to polymer coated urea/ammonium sulfate blend fertilizer applied in two applications (2Ap) or three applications (3Ap). Fertilizer was applied at a full rate 100%. Values sharing the same letter within a date are not significantly different from one another. Dates without letters have no significant differences between any treatments on that date. P = 0.05
Appendix Table 3 Height values with statistical analysis for a Kentucky bluegrass trial at the loam site in 2015 with a grower’s standard of practice (GSP) applied monthly as a urea/ammonium sulfate blend compared to a polymer coated urea/ammonium sulfate blend fertilizer applied in two applications (2Ap) or three applications (3Ap). Fertilizer was applied at a full rate 100%. Values sharing the same letter within a date are not significantly different from one another. Dates without letters have no significant differences between any treatments on that date. P = 0.05
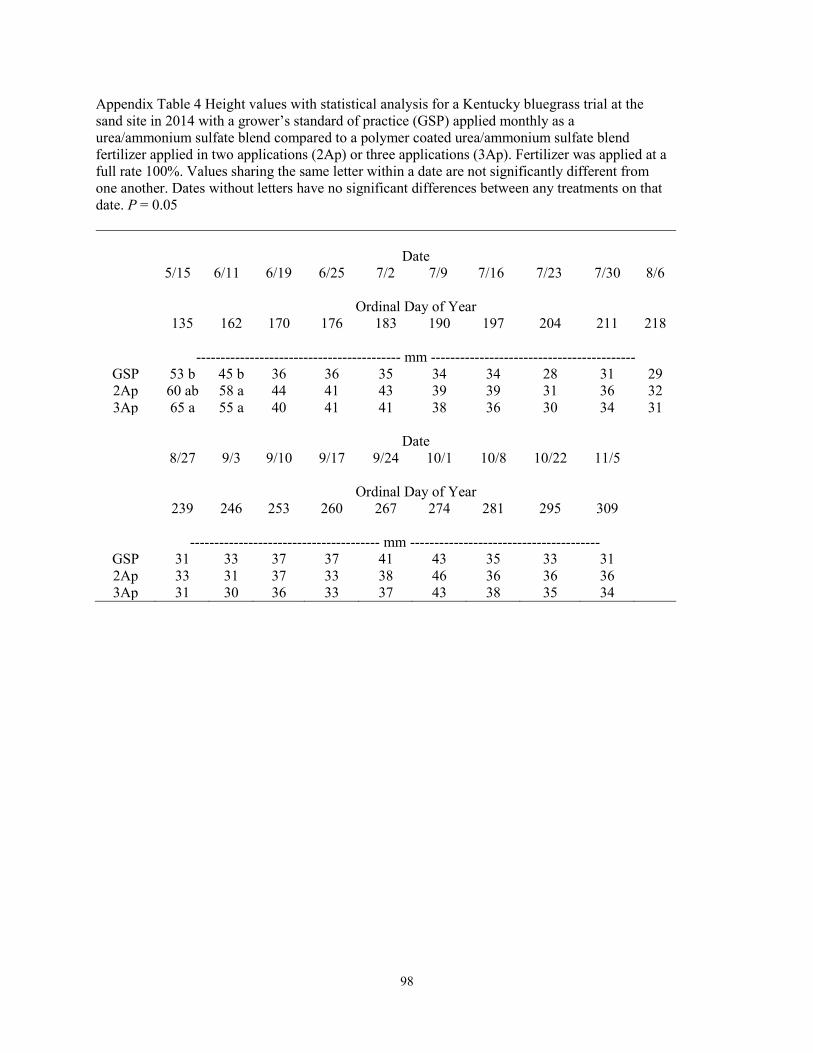
Appendix Table 4 Height values with statistical analysis for a Kentucky bluegrass trial at the sand site in 2014 with a grower’s standard of practice (GSP) applied monthly as a urea/ammonium sulfate blend compared to a polymer coated urea/ammonium sulfate blend fertilizer applied in two applications (2Ap) or three applications (3Ap). Fertilizer was applied at a full rate 100%. Values sharing the same letter within a date are not significantly different from one another. Dates without letters have no significant differences between any treatments on that date. P = 0.05
Appendix Table 5 Biomass values with statistical analysis for Kentucky bluegrass trials at the loam site in 2014 and 2015 with a grower’s standard of practice (GSP) applied monthly as a urea/ammonium sulfate blend compared to a polymer coated urea/ammonium sulfate blend fertilizer applied in two applications (2Ap) or three applications (3Ap). Fertilizer was applied at a full rate 100%. Values sharing the same letter within a date are not significantly different from one another. P = 0.05
2014 2015 Date
5/15 10/2 8/26 10/15 10/30
Ordinal Day of Year 135 275 238 288 303
GSP 30.45 a 23.84 a 21.43 a 14.19 a 14.64 a 2Ap 42.29 a 38.57 a 13.83 a 14.10 a 12.69 a 3Ap 38.64 a 33.49 a 20.90 a 15.73 a 15.63 a
Appendix Table 6 Biomass values with statistical analysis for a Kentucky bluegrass trial at the sand site in 2014 with a grower’s standard of practice (GSP) applied monthly as a urea/ammonium sulfate blend compared to a polymer coated urea/ammonium sulfate fertilizer applied in two applications (2Ap) or three applications (3Ap). Fertilizer was applied at a full rate 100%. Values sharing the same letter within a date are not significantly different from one another. P = 0.05
Date 5/15 10/2
Ordinal Day of Year 135 275
GSP 28.78 a 45.11 a 2Ap 45.13 a 59.08 a 3Ap 60.70 a 46.94 a
100
Appendix Table 7 NDVI values (multiplied by 100) with statistical analysis for a Kentucky bluegrass trial at the loam site in 2014 with a grower’s standard of practice (GSP) applied monthly as a urea/ammonium sulfate blend compared to a polymer coated urea/ammonium sulfate blend fertilizer applied in two applications (2Ap) and three applications (3Ap). Fertilizer was applied at a full rate 100%. Values sharing the same letter within a date are not significantly different from one another. Dates without letters have no significant differences between any treatments on that date. P = 0.05
Appendix Table 8 NDVI values (multiplied by 100) with statistical analysis for a Kentucky bluegrass trial at the loam site in 2015 with a grower’s standard of practice (GSP) applied monthly as a urea/ammonium sulfate blend compared to a polymer coated urea/ammonium sulfate blend fertilizer applied in two applications (2Ap) or three applications (3Ap). Fertilizer was applied at a full rate 100%. Values sharing the same letter within a date are not significantly different from one another. Dates without letters have no significant differences between any treatments on that date. P = 0.05
Appendix Table 9 NDVI values (multiplied by 100) with statistical analysis for a Kentucky bluegrass trial at the sand site in 2014 with a grower’s standard of practice (GSP) applied monthly as a urea/ammonium sulfate blend compared to a polymer coated urea/ammonium sulfate blend fertilizer applied in one application in spring (1Ap-S) or fall (1Ap-F) or in two applications (2Ap). Fertilizer was applied at a full rate 100%. Values sharing the same letter within a date are not significantly different from one another. Dates without letters have no significant differences between any treatments on that date. P = 0.05
Appendix Table 10 Visual values with statistical analysis for Kentucky bluegrass trials at the loam site in 2014 and 2015 with a grower’s standard of practice (GSP) applied monthly as a urea/ammonium sulfate blend compared to a polymer coated urea/ammonium sulfate blend fertilizer applied in two applications (2Ap) or three applications (3Ap). Fertilizer was applied at a full rate 100%. The statistics within the table display those treatments with the same letters as not being significantly different. Values sharing the same letter within a date are not significantly different from one another. P = 0.05
2014 2015 Date
5/6 8/27 9/17 8/26 11/1
Ordinal Day of Year 126 239 260 238 305
GSP 2.00 a 2.75 a 3.00 a 3.44 a 3.69 a 2Ap 2.50 a 2.88 a 2.75 a 2.88 a 3.63 a 3Ap 2.63 a 3.13 a 2.88 a 3.00 a 3.81 a
Appendix Table 11 Visual values with statistical analysis for a Kentucky bluegrass trial at the sand site in 2014 with a grower’s standard of practice (GSP) applied monthly as a urea/ammonium sulfate blend compared to a polymer coated urea/ammonium sulfate blend fertilizer applied in two applications (2Ap) or three applications (3Ap). Fertilizer was applied at a full rate 100%. Values sharing the same letter within a date are not significantly different from one another. P = 0.05
Date 5/6 8/27 9/17
Ordinal Day of Year 126 239 260
GSP 2.25 a 3.25 a 3.50 a 2Ap 2.75 a 3.88 a 3.38 a 3Ap 2.75 a 3.88 a 3.38 a
104
Appendix Table 12 Total N values with statistical analysis for Kentucky bluegrass trials at the loam site in 2014 and 2015 on the top and the sand site in 2014 with a grower’s standard of practice (GSP) applied monthly as a urea/ammonium sulfate blend compared to polymer coated urea/ammonium sulfate blend urea fertilizer applied in two applications (2Ap) or three applications (3Ap). Fertilizer was applied at a full rate 100%. Values sharing the same letter within a date are not significantly different from one another. P = 0.05
2014 2015
Loam
Date 5/15 10/2 10/15 10/30
Ordinal Day of Year 135 275 288 303
GSP 2.24 a 3.09 a 4.44 a 3.36 a 2Ap 2.69 a 3.81 b 4.26 a 3.53 a 3Ap 2.69 a 3.60 b 4.19 a 3.45 a
Sand
Date 5/15 10/2
Ordinal Day of Year 135 275
GSP 2.39 a 3.91 b 2Ap 3.19 b 4.55 a 3Ap 3.12 b 4.21 ab
105
P-values
The following tables give the p-values for each treatment on the corresponding ordinal days.
Appendix Table 13 P-values for root biomass in the loam trial in 2015 for treatments in relation to each other. The treatments include the grower’s standard of practice (GSP) and a single application of PCU applied in spring (1Ap-S) or fall (1Ap-F) or in two applications (2Ap) or three applications (3Ap) all at the full rate as well as the control (ctrl). Significance is at P= 0.05
Appendix Table 14 P-values for root biomass in the sand trial in 2015 for treatments in relation to each other. The treatments include the grower’s standard of practice (GSP) and a single application of PCU applied in spring (1Ap-S) or fall (1Ap-F) or in two applications (2Ap) or three applications (3Ap) all at the full rate as well as the control (ctrl). Significance is at P= 0.05
Appendix Table 15 P-values height in the loam trial in 2014 for treatments in relation to each other. The treatments include the grower’s standard of practice (GSP) and a single application of PCU applied in spring (1Ap-S) or fall (1Ap-F) or in two applications (2Ap) or three applications (3Ap) all at the full rate as well as the control (ctrl). Only statistically significant p-values are shown. P = 0.05
Appendix Table 16 P-values height in the loam trial in 2015 for treatments in relation to each other. The treatments include the grower’s standard of practice (GSP) and a single application of PCU applied in spring (1Ap-S) or fall (1Ap-F) or in two applications (2Ap) or three applications (3Ap) all at the full rate as well as the control (ctrl). Only statistically significant p-values are shown. P = 0.05
Appendix Table 17a P-values height in the sand trial in 2014 for treatments in relation to each other. The treatments include the grower’s standard of practice (GSP) and a single application of PCU applied in spring (1Ap-S) or fall (1Ap-F) or in two applications (2Ap) or three applications (3Ap) all at the full rate as well as the control (ctrl). Only statistically significant p-values are shown. P = 0.05
Appendix Table 17b P-values height in the sand trial in 2014 for treatments in relation to each other. The treatments include the grower’s standard of practice (GSP) and a single application of PCU applied in spring (1Ap-S) or fall (1Ap-F) or in two applications (2Ap) or three applications (3Ap) all at the full rate as well as the control (ctrl). Only statistically significant p-values are shown. P = 0.05
170 1Ap-
S 1Ap-
F <.0001 204 1Ap-
S 1Ap-
F 0.0269 281 1Ap-
F ctrl <.0001
170 1Ap-
S 3Ap 0.0079 204 1Ap-
S ctrl 0.0269 281 3Ap ctrl 0.0020
170 1Ap-
S ctrl <.0001 211 1Ap-
S 1Ap-
F <.0001 295 1Ap-
S 1Ap-F 0.0079
170 1Ap-
F 2Ap 0.0020 211 1Ap-
S ctrl <.0001 295 1Ap-
F ctrl <.0001
170 2Ap ctrl 0.0269 211 1Ap-
F 2Ap 0.0079 295 2Ap ctrl 0.0079
176 GSP 1Ap-
S <.0001 211 2Ap ctrl 0.0079 295 3Ap ctrl 0.0269
176 1Ap-
S 1Ap-
F <.0001 218 1Ap-
S 1Ap-
F 0.0001 309 GSP 1Ap-F 0.0269
176 1Ap-
S 2Ap 0.0020 218 1Ap-
S ctrl 0.0269 309 1Ap-
S 1Ap-F 0.0020
176 1Ap-
S 3Ap 0.0020 239 1Ap-
S 1Ap-
F <.0001 309 1Ap-
F ctrl <.0001
176 1Ap-
S ctrl <.0001 239 1Ap-
S ctrl <.0001 309 2Ap ctrl <.0001
176 1Ap-
F 2Ap 0.0020 246 GSP 1Ap-
F 0.0269 309 3Ap ctrl <.0001
176 1Ap-
F 3Ap 0.0020 246 1Ap-
S 1Ap-
F <.0001
110
Appendix Table 18 P-values for biomass in the loam trial in 2014 for treatments in relation to each other. The treatments include the grower’s standard of practice (GSP) and a single application of PCU applied in spring (1Ap-S) or fall (1Ap-F) or in two applications (2Ap) or three applications (3Ap) all at the full rate as well as the control (ctrl). Only statistically significant p-values are shown. P = 0.05
Appendix Table 19 P-values for biomass in the loam trial in 2015 for treatments in relation to each other. The treatments include the grower’s standard of practice (GSP) and a single application of PCU applied in spring (1Ap-S) or fall (1Ap-F) or in two applications (2Ap) or three applications (3Ap) all at the full rate as well as the control (ctrl). Only statistically significant p-values are shown. P = 0.05
Appendix Table 20 P-values for biomass in the sand trial in 2014 for treatments in relation to each other. The treatments include the grower’s standard of practice (GSP) and a single application of PCU applied in spring (1Ap-S) or fall (1Ap-F) or in two applications (2Ap) or three applications (3Ap) all at the full rate as well as the control (ctrl). Only statistically significant p-values are shown. P = 0.05
Appendix Table 21 P-values for NDVI readings for the loam trial in 2014 for treatments in relation to each other. The treatments include the grower’s standard of practice (GSP) and a single application of PCU applied in spring (1Ap-S) or fall (1Ap-F) or in two applications (2Ap) or three applications (3Ap) all at the full rate as well as the control (ctrl). Only statistically significant p-values are shown. P = 0.05
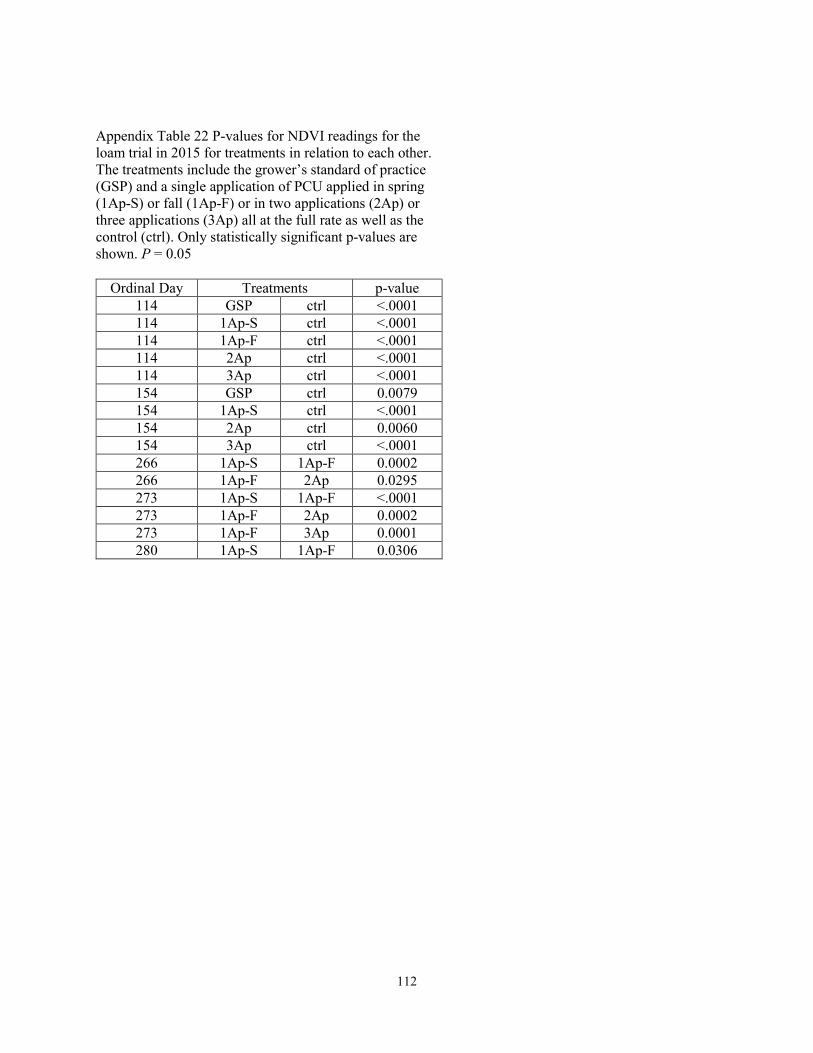
Appendix Table 22 P-values for NDVI readings for the loam trial in 2015 for treatments in relation to each other. The treatments include the grower’s standard of practice (GSP) and a single application of PCU applied in spring (1Ap-S) or fall (1Ap-F) or in two applications (2Ap) or three applications (3Ap) all at the full rate as well as the control (ctrl). Only statistically significant p-values are shown. P = 0.05
Appendix Table 23a P-values for NDVI readings for the sand trial in 2014 for treatments in relation to each other. The treatments include the grower’s standard of practice (GSP) and a single application of PCU applied in spring (1Ap-S) or fall (1Ap-F) or in two applications (2Ap) or three applications (3Ap) all at the full rate as well as the control (ctrl). Only statistically significant p-values are shown. P = 0.05
Appendix Table 23b P-values for NDVI readings for the sand trial in 2014 for treatments in relation to each other. The treatments include the grower’s standard of practice (GSP) and a single application of PCU applied in spring (1Ap-S) or fall (1Ap-F) or in two applications (2Ap) or three applications (3Ap) all at the full rate as well as the control (ctrl). Only statistically significant p-values are shown. P = 0.05
Appendix Table 24 P-values for visual ratings for the loam trial in 2014 for treatments in relation to each other. The treatments include the grower’s standard of practice (GSP) and a single application of PCU applied in spring (1Ap-S) or fall (1Ap-F) or in two applications (2Ap) or three applications (3Ap) all at the full rate as well as the control (ctrl). Only statistically significant p-values are shown. P = 0.05
Appendix Table 25 P-values for visual ratings for the loam trial in 2015 for treatments in relation to each other. The treatments include the grower’s standard of practice (GSP) and a single application of PCU applied in spring (1Ap-S) or fall (1Ap-F) or in two applications (2Ap) or three applications (3Ap) all at the full rate as well as the control (ctrl). Only statistically significant p-values are shown. P = 0.05
Appendix Table 26 P-values for visual ratings for the sand trial in 2014 for treatments in relation to each other. The treatments include the grower’s standard of practice (GSP) and a single application of PCU applied in spring (1Ap-S) or fall (1Ap-F) or in two applications (2Ap) or three applications (3Ap) all at the full rate as well as the control (ctrl). Only statistically significant p-values are shown. P = 0.05
Appendix Table 27 P-values for nitrogen concentration for the loam trial in 2014 for treatments in relation to each other. The treatments include the grower’s standard of practice (GSP) and a single application of PCU applied in spring (1Ap-S) or fall (1Ap-F) or in two applications (2Ap) or three applications (3Ap) all at the full rate as well as the control (ctrl). Only statistically significant p-values are shown. P = 0.05
Appendix Table 28 P-values for nitrogen concentration for the loam trial in 2015 for treatments in relation to each other. The treatments include the grower’s standard of practice (GSP) and a single application of PCU applied in spring (1Ap-S) or fall (1Ap-F) or in two applications (2Ap) or three applications (3Ap) all at the full rate as well as the control (ctrl). Only statistically significant p-values are shown. P = 0.05
Appendix Table 29 P-values for nitrogen concentration for the sand trial in 2014 for treatments in relation to each other. The treatments include the grower’s standard of practice (GSP) and a single application of PCU applied in spring (1Ap-S) or fall (1Ap-F) or in two applications (2Ap) or three applications (3Ap) all at the full rate as well as the control (ctrl). Only statistically significant p-values are shown. P = 0.05
Appendix Table 30 P-values for shoot density in the loam trial in 2015 for treatments in relation to each other. The treatments include the grower’s standard of practice (GSP) and a single application of PCU applied in spring (1Ap-S) or fall (1Ap-F) or in two applications (2Ap) or three applications (3Ap) all at the full rate as well as the control (ctrl). Significance is at P= 0.05
Appendix Table 31 P-values for shoot density in the sand trial in 2015 for treatments in relation to each other. The treatments include the grower’s standard of practice (GSP) and a single application of PCU applied in spring (1Ap-S) or fall (1Ap-F) or in two applications (2Ap) or three applications (3Ap) all at the full rate as well as the control (ctrl). Significance is at P= 0.05
Appendix Figure 5 Treatments in the loam trial in November 2014. Lighter colored plots had less nitrogen applied in the fall or no nitrogen applied.
Appendix Figure 6 Treatments in the sand trial in November 2014. Lighter colored plots had less nitrogen applied in the fall or no nitrogen applied.
122
Appendix Figure 7 Treatments in the loam trial in April 2015. Lighter colored plots came out of dormancy later than the plots which had nitrogen applied in the fall.
Appendix Figure 8 Treatments in the sand trial in September 2015. Darker plots received more nitrogen in the fall than the lighter plots.
123
Appendix Figure 9 Treatments in the loam trial in November 2014. The plot on the left had nitrogen applied once in spring (1Ap-S) and the plot on the right had nitrogen applied once in fall (1Ap-F).
124
Appendix Figure 10 Treatments in the sand trial in December 2014. The plot on the left had nitrogen applied once in spring (1Ap-S) and the plot on the right had nitrogen applied once in fall (1Ap-F).
125
Appendix A
The following is supplementary data collected for the Rate Study (Chapter 2), but not included in the main paper.
Root Density: Loam Soil Trial
Appendix Table 1 Root density (g) with statistical analysis for a Kentucky bluegrass trial at the loam site in 2015 with a grower’s standard of practice (GSP) applied monthly as a urea/ammonium sulfate blend compared to a polymer coated urea/ammonium sulfate blend fertilizer applied in two applications at differing rates with a full rate (P100), three-quarter the rate (P75), and half the rate (P50). Values sharing the same letter within a date are not significantly different from one another. P = 0.05
Date
10/30
Ordinal Day of Year
303
GSP 3.91 a P100 3.19 a P75 3.74 a P50 1.36 a
126
Loam Growth
Shoot biomass was significant on the second sampling date in 2014 with the P100 being
significantly greater than P50 (Appendix Fig. 1; Table 6). All other sampling dates for the
biomass were not significant. On the same date, the height difference was not significant
although there was still a greater amount of shoot growth for the P100 over P50 (Figs. 1 and 2;
Tables 4 and 5).
Appendix Figure 1 Kentucky bluegrass biomass for 2014 and 2015 for a trial on loam soil. The grower’s standard practice (GSP) of urea/ammonium sulfate applied monthly at the 100% rate, and polymer coated urea/ammonium sulfate split applied once in spring and again in fall at the 100% (P100), 75% (P75), and 50% (P50) rate are shown. Statistical significance is shown within the figure. Data shown in Table 6.
127
Sand Growth
Shoot biomass at the first sampling date in 2014 showed no significant difference, but the heights
for the same date had a significant difference between P100 and P50 (Appendix Fig. 2; Fig. 2;
Tables 7 and 8). On the second sampling date for biomass, there was a significant difference with
P100 having significantly greater biomass than P75 and P50. On the same date, P50 had
significantly less biomass than the GSP. There was the same trend in the heights for the same
date, but the only ones with significance were the GSP and P100 having greater heights than
P50.
Appendix Figure 2 Kentucky bluegrass biomass for 2014 for a trial on sand soil. The grower’s standard practice (GSP) of urea/ammonium sulfate applied monthly at the 100% rate, and polymer coated urea/ ammonium sulfate split applied once in spring and again in fall at the 100% (P100), 75% (P75), and 50% (P50) rates are shown. Statistical significance is shown within the figure. Data shown in Table 8.
128
Loam Health
Although NDVI did not show a difference on ordinal day 126, when the first visual ratings of
plant health and verdure were made in 2014, P100 had significantly higher ratings than P50 (Fig.
3; Appendix Fig. 3; Tables 9-11). On the following visual rating dates, there were no significant
differences which corresponds with the NDVI readings on the same dates. In 2015, the GSP had
significantly greater visual ratings than P50 on the first date, but this was not present in the
NDVI readings for the same date. The second date in 2015 did not show any significance in the
visual ratings or the NDVI readings for the same date.
Appendix Figure 3 Kentucky bluegrass visual ratings for 2014 and 2015 for a trial on loam soil. The grower’s standard practice (GSP) of urea/ammonium sulfate applied monthly at the 100% rate, and polymer coated urea/ammonium sulfate split applied once in spring and again in fall at the 100% (P100), 75% (P75), and 50% (P50) rate are shown. Statistical significance is shown within the figure. Data shown in Table 11.
129
Sand Health
Visual ratings on the first dates showed a significant difference between P100 and P50 which did
not correspond with the NDVI readings for the same date (Fig. 4; Appendix Fig. 4; Tables 12
and 13). On both the second and third dates, the visual ratings showed no significant differences
between the treatments which corresponds with the NDVI readings for the same dates.
Appendix Figure 4 Kentucky bluegrass visual ratings for 2014 for a trial on sand soil. The grower’s standard practice (GSP) of urea/ammonium sulfate applied monthly at the 100% rate, and polymer coated urea/ammonium sulfate split applied once in spring and again in fall at the 100% (P100), 75% (P75), and 50% (P50) rate are shown. Statistical significance is shown within the figure. Data shown in Table 13.
130
P-values
The following tables give the p-values for each treatment on the corresponding ordinal days.
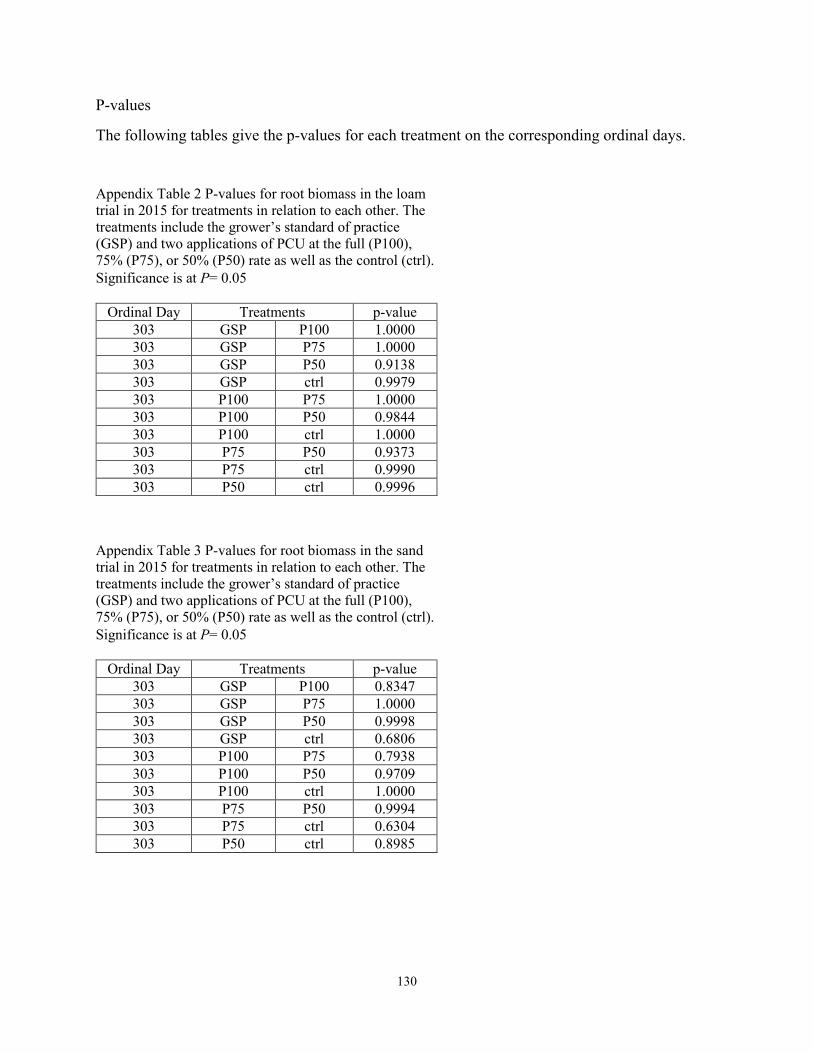
Appendix Table 2 P-values for root biomass in the loam trial in 2015 for treatments in relation to each other. The treatments include the grower’s standard of practice (GSP) and two applications of PCU at the full (P100), 75% (P75), or 50% (P50) rate as well as the control (ctrl). Significance is at P= 0.05
Appendix Table 3 P-values for root biomass in the sand trial in 2015 for treatments in relation to each other. The treatments include the grower’s standard of practice (GSP) and two applications of PCU at the full (P100), 75% (P75), or 50% (P50) rate as well as the control (ctrl). Significance is at P= 0.05
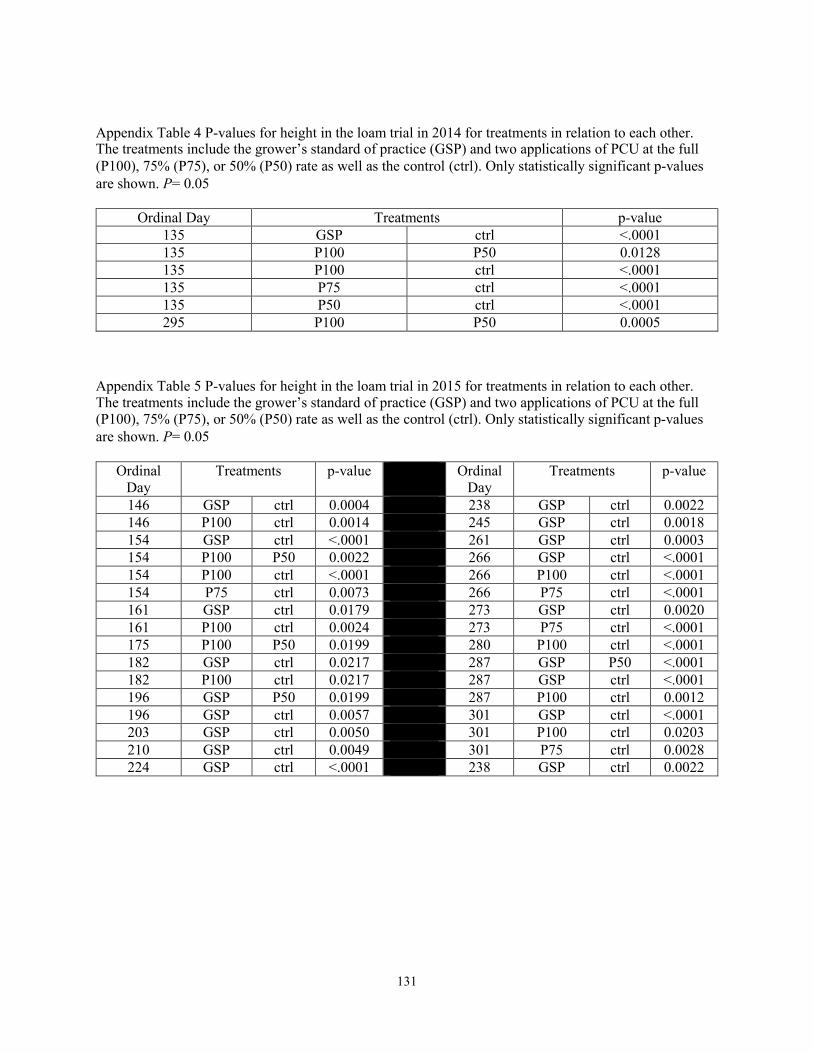
Appendix Table 4 P-values for height in the loam trial in 2014 for treatments in relation to each other. The treatments include the grower’s standard of practice (GSP) and two applications of PCU at the full (P100), 75% (P75), or 50% (P50) rate as well as the control (ctrl). Only statistically significant p-values are shown. P= 0.05
Appendix Table 5 P-values for height in the loam trial in 2015 for treatments in relation to each other. The treatments include the grower’s standard of practice (GSP) and two applications of PCU at the full (P100), 75% (P75), or 50% (P50) rate as well as the control (ctrl). Only statistically significant p-values are shown. P= 0.05
Appendix Table 6 P-values for height in the sand trial in 2014 for treatments in relation to each other. The treatments include the grower’s standard of practice (GSP) and two applications of PCU at the full (P100), 75% (P75), or 50% (P50) rate as well as the control (ctrl). Only statistically significant p-values are shown. P= 0.05
Appendix Table 7 P-values for biomass in the loam trial in 2014-2015 for treatments in relation to each other. The treatments include the grower’s standard of practice (GSP) and two applications of PCU at the full (P100), 75% (P75), or 50% (P50) rate as well as the control (ctrl). Only statistically significant p-values are shown. P= 0.05
2014 2015 Ordinal
Day Treatments p-valueOrdinal
Day Treatments p-value135 P100 P50 0.0050 238 GSP P50 0.0006
238 GSP ctrl 0.0003
Appendix Table 8 P-values for biomass in the sand trial in 2014 for treatments in relation to each other. The treatments include the grower’s standard of practice (GSP) and two applications of PCU at the full (P100), 75% (P75), or 50% (P50) rate as well as the control (ctrl). Only statistically significant p-values are shown. P= 0.05
Appendix Table 9 P-values for NDVI readings in the loam trial in 2014 for treatments in relation to each other. The treatments include the grower’s standard of practice (GSP) and two applications of PCU at the full (P100), 75% (P75), or 50% (P50) rate as well as the control (ctrl). Only statistically significant p-values are shown. P= 0.05
Ordinal Day Treatments p-value309 P100 ctrl 0.0199
Appendix Table 10 P-values for NDVI readings in the loam trial in 2015 for treatments in relation to each other. The treatments include the grower’s standard of practice (GSP) and two applications of PCU at the full (P100), 75% (P75), or 50% (P50) rate as well as the control (ctrl). Only statistically significant p-values are shown. P= 0.05
Appendix Table 11 P-values for NDVI readings in the sand trial in 2014 for treatments in relation to each other. The treatments include the grower’s standard of practice (GSP) and two applications of PCU at the full (P100), 75% (P75), or 50% (P50) rate as well as the control (ctrl). Only statistically significant p-values are shown. P= 0.05
Appendix Table 12 P-values for visual ratings in the loam trial in 2014 for treatments in relation to each other. The treatments include the grower’s standard of practice (GSP) and two applications of PCU at the full (P100), 75% (P75), or 50% (P50) rate as well as the control (ctrl). Only statistically significant p-values are shown. P= 0.05
Ordinal Day Treatments p-value126 P100 P50 0.0369
Appendix Table 13 P-values for visual ratings in the loam trial in 2015 for treatments in relation to each other. The treatments include the grower’s standard of practice (GSP) and two applications of PCU at the full (P100), 75% (P75), or 50% (P50) rate as well as the control (ctrl). Only statistically significant p-values are shown. P= 0.05
Appendix Table 14 P-values for visual ratings in the sand trial in 2014 for treatments in relation to each other. The treatments include the grower’s standard of practice (GSP) and two applications of PCU at the full (P100), 75% (P75), or 50% (P50) rate as well as the control (ctrl). Only statistically significant p-values are shown. P= 0.05
Appendix Table 15 P-values for nitrogen concentration in the loam trial in 2014-2015 for treatments in relation to each other. The treatments include the grower’s standard of practice (GSP) and two applications of PCU at the full (P100), 75% (P75), or 50% (P50) rate as well as the control (ctrl). Only statistically significant p-values are shown. P= 0.05
Appendix Table 16 P-values for nitrogen concentration in the sand trial in 2014 for treatments in relation to each other. The treatments include the grower’s standard of practice (GSP) and two applications of PCU at the full (P100), 75% (P75), or 50% (P50) rate as well as the control (ctrl). Only statistically significant p-values are shown. P= 0.05
Appendix Table 17 P-values for crown density in the loam trial in 2015 for treatments in relation to each other. The treatments include the grower’s standard of practice (GSP) and two applications of PCU at the full (P100), 75% (P75), or 50% (P50) rate as well as the control (ctrl). Only statistically significant p-values are shown. P= 0.05
Appendix Table 18 P-values for crown density in the sand trial in 2015 for treatments in relation to each other. The treatments include the grower’s standard of practice (GSP) and two applications of PCU at the full (P100), 75% (P75), or 50% (P50) rate as well as the control (ctrl). Only statistically significant p-values are shown. P= 0.05
Appendix Figure 5 Treatments in the loam trial in November 2014. Lighter colored plots had less nitrogen applied in the fall or no nitrogen applied.
Appendix Figure 6 Treatments in the sand trial in November 2014. Lighter colored plots had less nitrogen applied in the fall or no nitrogen applied.
139
Appendix Figure 7 Treatments in the loam trial in April 2015. Lighter colored plots came out of dormancy later than the plots which had nitrogen applied in the fall.
Appendix Figure 8 Treatments in the sand trial in September 2015. Darker plots received more nitrogen in the fall than the lighter plots.