Polymetal International plc 1 Release time IMMEDIATE Date 12 March 2018 Polymetal International plc Preliminary results for the year ended 31 December 2017 Polymetal International plc (LSE, MOEX: POLY, ADR: AUCOY) (together with its subsidiaries – “Polymetal”, the “Company”, or the “Group”) is pleased to announce the Group’s preliminary results for the year ended 31 December 2017. FINANCIAL HIGHLIGHTS In 2017, revenue increased by 15% over 2016 to US$ 1,815 million, primarily driven by gold equivalent (GE) production growth of 13%. Gold sales were 1,090 Koz, up 24% year-on-year, while silver sales were down 14% to 26.5 Moz, in line with production volume dynamics. Average realised gold and silver prices remained largely unchanged from 2016 at US$ 1,247/oz and US$ 16.1/oz respectively. Group Total cash costs 1 (“TCC”) were US$ 658/GE oz for the year, up 15% from 2016 levels and at the lower end of the Company’s updated guidance of US$ 650-675/GE oz. The increase in TCC was predominantly driven by the strengthening of the Russian Rouble (by 15% from an average rate of 67.1 RUB/USD in 2016 to 58.3 RUB/USD in 2017) on the back of the recent oil price rally and stabilising macroeconomic conditions in Russia. All-in sustaining cash costs 1 (“AISC”) amounted to US$ 893/GE oz, also within the Company’s updated guidance, an increase of 15% year-on-year, driven mostly by the same factors, as well as significantly increased exploration spending across the portfolio. Adjusted EBITDA 1 was US$ 745 million, down 2% compared to 2016, as increased costs incurred due to a stronger Russian Rouble largely offset the production growth. The Adjusted EBITDA margin was at 41% compared to 48% in 2016. Net earnings 2 were US$ 354 million versus US$ 395 million in the prior year, reflecting the decrease in EBITDA and the impact of foreign exchange gains on 2016 earnings. Underlying net earnings 1 were US$ 376 million (2016: US$ 382 million). Capital expenditure came in at US$ 383 million 3 , up 41% compared to 2016 due to accelerated pre-stripping and construction at Kyzyl, as well as an increased brownfield exploration spend across the operating assets portfolio . The Group is on track with the commissioning of Kyzyl and the ramp up of the debottlenecked POX plant in the second half of 2018. Net debt 1 increased to US$ 1,420 million during the period (31 December 2016: US$ 1,330 million), representing a Net debt/Adjusted EBITDA ratio of 1.91x. Despite intensive construction activities at Kyzyl in the course of 2017, the Company continued to generate meaningful free cash flow 1 that amounted to US$ 143 million (2016: US$ 257 million), while maintaining stable net cash operating inflow of US$ 533 million (2016: US$ 530 million). A final dividend of US$ 0.30 per share (approx. US$ 129 million) representing 50% of the Group’s underlying net earnings for 2H 2017 has been proposed by the Board in accordance with the revised dividend policy and in compliance with the hard ceiling of Net debt/Adjusted EBITDA ratio below 2.5x. This will bring the total dividend declared for the period to US$ 189 million. 1 The financial performance reported by the Group contains certain Alternative Performance Measures (APMs) disclosed to compliment measures that are defined or specified under International Financial Reporting Standards (IFRS). For more information on the APMs used by the Group, including justification for their use, please refer to the “Alternative performance measures” section below . The definition and calculation of non-IFRS APMs used in this report, including Adjusted EBITDA, Total cash costs, All-in sustaining cash costs, Underlying net earnings, Net debt and Free cash f low are explained in the “Financial Review ” section below . 2 Profit for the financial period. 3 On a cash basis, representing cash outflow on purchases of property, plant and equipment in the statement of consolidated cash flows. Total capital expenditure including loans advanced on capital spending at Nezhda and Prognoz joint ventures comprised US$ 435 million.
Transcript
Polymetal International plc 1
Release time
IMMEDIATE
Date 12 March 2018
Polymetal International plc Preliminary results for the year ended 31 December 2017 Polymetal International plc (LSE, MOEX: POLY, ADR: AUCOY) (together with its subsidiaries – “Polymetal”, the “Company”, or the “Group”) is pleased to announce the Group’s preliminary results for the year ended 31 December 2017.
FINANCIAL HIGHLIGHTS
In 2017, revenue increased by 15% over 2016 to US$ 1,815 million, primarily driven by gold equivalent (GE) production growth of 13%. Gold sales were 1,090 Koz, up 24% year-on-year, while silver sales were down 14% to 26.5 Moz, in line with production volume dynamics. Average realised gold and silver prices remained largely
unchanged from 2016 at US$ 1,247/oz and US$ 16.1/oz respectively.
Group Total cash costs1 (“TCC”) were US$ 658/GE oz for the year, up 15% from 2016 levels and at the lower end of the Company’s updated guidance of US$ 650-675/GE oz. The increase in TCC was predominantly driven by the strengthening of the Russian Rouble (by 15% from an average rate of 67.1 RUB/USD in 2016 to 58.3 RUB/USD
in 2017) on the back of the recent oil price rally and stabilising macroeconomic conditions in Russia. All-in sustaining cash costs1 (“AISC”) amounted to US$ 893/GE oz, also within the Company’s updated guidance, an increase of 15% year-on-year, driven mostly by the same factors, as well as significantly increased exploration
spending across the portfolio.
Adjusted EBITDA1 was US$ 745 million, down 2% compared to 2016, as increased costs incurred due to a stronger Russian Rouble largely offset the production growth. The Adjusted EBITDA margin was at 41% compared to 48%
in 2016.
Net earnings2 were US$ 354 million versus US$ 395 million in the prior year, reflecting the decrease in EBITDA and the impact of foreign exchange gains on 2016 earnings. Underlying net earnings1 were US$ 376 million (2016:
US$ 382 million).
Capital expenditure came in at US$ 383 million3, up 41% compared to 2016 due to accelerated pre-stripping and construction at Kyzyl, as well as an increased brownfield exploration spend across the operating assets portfolio . The Group is on track with the commissioning of Kyzyl and the ramp up of the debottlenecked POX plant in the
second half of 2018.
Net debt1 increased to US$ 1,420 million during the period (31 December 2016: US$ 1,330 million), representing a Net debt/Adjusted EBITDA ratio of 1.91x. Despite intensive construction activities at Kyzyl in the course of 2017,
the Company continued to generate meaningful free cash flow1 that amounted to US$ 143 million (2016: US$ 257 million), while maintaining stable net cash operating inflow of US$ 533 million (2016: US$ 530 million).
A final dividend of US$ 0.30 per share (approx. US$ 129 million) representing 50% of the Group’s underlying net
earnings for 2H 2017 has been proposed by the Board in accordance with the revised dividend policy and in compliance with the hard ceiling of Net debt/Adjusted EBITDA ratio below 2.5x. This will bring the total dividend declared for the period to US$ 189 million.
1 The f inancial performance reported by the Group contains certain Alternative Performance Measures (APMs) disclosed to compliment measures that are defined or specif ied under International Financial Reporting Standards (IFRS). For more information on the APMs used by the Group,
including justif ication for their use, please refer to the “Alternative performance measures” section below. The definition and calculation of non-IFRS APMs used in this report, including Adjusted EBITDA, Total cash costs, All-in sustaining cash costs, Underlying net earnings, Net debt and Free cash f low are explained in the “Financial Review ” section below . 2 Profit for the f inancial period. 3 On a cash basis, representing cash outf low on purchases of property, plant and equipment in the statement of consolidated cash f lows. Total capital expenditure including loans advanced on capital spending at Nezhda and Prognoz joint ventures comprised US$ 435 million.
Polymetal International plc 2
OPERATING HIGHLIGHTS
Polymetal delivered a strong operational performance in 2017: total GE production increased 13% year-on-year to
1,433 Koz, 2% above our initial production guidance of 1,400 Koz. The strong finish to 2017 was driven by contributions from the fully ramped-up Svetloye heap leach (Okhotsk hub), as well as a strong performance at Komar (Varvara hub), Omolon and Amursk/Albazino.
Full year gold production totalled 1,075 Koz, a 21% increase year-on-year. Gold sales generally followed production dynamics. Silver production was down 8% to 26.8 Moz compared to 2016.
Polymetal has increased production materially over the 20 years since the Company’s inception, delivering a compound annual growth rate of 24%
Polymetal regrettably reports two fatal accidents in 2017. While the total number of fatalities for the year has halved compared to 2016, we view this result as unsatisfactory. The Company has commenced implementing additional safety measures in 2018 with a particular focus on smaller operating units, especially those in remote locations.
The Company reiterates its production guidance for 2018 and 2019 of 1.55 Moz and 1.7 Moz of gold equivalent , respectively. As in prior years, production in both years will be skewed towards the 2H due to seasonality.
TCC in 2018 are expected to be in the range of US$ 650-700/GE oz while AISC are expected at US$ 875-925/GE
oz. The anticipated increase in costs comes on the back of rising domestic diesel prices and further potential strengthening of the Russian Rouble. Cost guidance remains contingent on the Rouble/Dollar exchange rate dynamic which has a significant effect on the Group’s operating costs.
“I am delighted to report strong operational delivery and robust earnings for the year”, said Vitaly Nesis, Group CEO of Polymetal, commenting on the results. “While we have reached peak capital expenditure during 2017 ahead of the launch of the Kyzyl project in Q3 2018, the Group continued to deliver positive free cash flow and generate meaningful cash returns to our shareholders”.
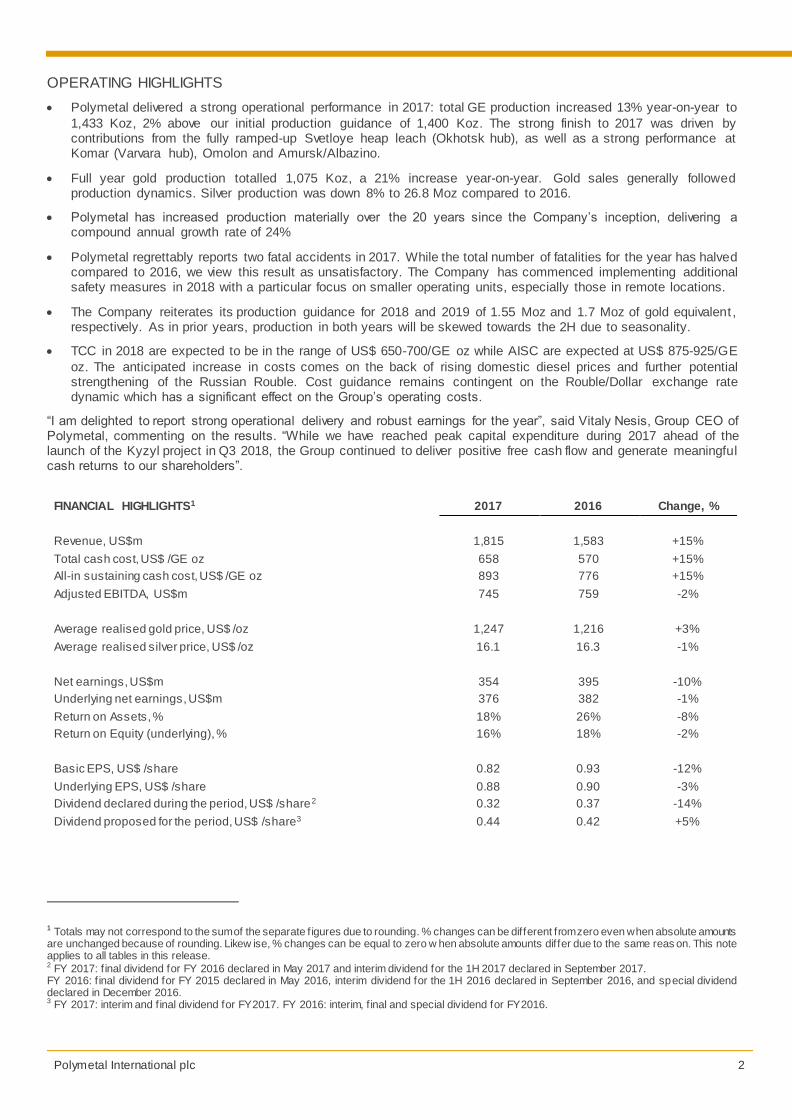
FINANCIAL HIGHLIGHTS1 2017 2016 Change, %
Revenue, US$m 1,815 1,583 +15%
Total cash cost, US$ /GE oz 658 570 +15%
All-in sustaining cash cost, US$ /GE oz 893 776 +15%
Adjusted EBITDA, US$m 745 759 -2%
Average realised gold price, US$ /oz 1,247 1,216 +3%
Average realised silver price, US$ /oz 16.1 16.3 -1%
Net earnings, US$m 354 395 -10%
Underlying net earnings, US$m 376 382 -1%
Return on Assets, % 18% 26% -8%
Return on Equity (underlying), % 16% 18% -2%
Basic EPS, US$ /share 0.82 0.93 -12%
Underlying EPS, US$ /share 0.88 0.90 -3%
Dividend declared during the period, US$ /share2 0.32 0.37 -14%
Dividend proposed for the period, US$ /share3 0.44 0.42 +5%
1 Totals may not correspond to the sum of the separate f igures due to rounding. % changes can be different from zero even when absolute amounts are unchanged because of rounding. Likew ise, % changes can be equal to zero w hen absolute amounts differ due to the same reas on. This note applies to all tables in this release. 2 FY 2017: f inal dividend for FY 2016 declared in May 2017 and interim dividend for the 1H 2017 declared in September 2017. FY 2016: f inal dividend for FY 2015 declared in May 2016, interim dividend for the 1H 2016 declared in September 2016, and special dividend declared in December 2016. 3 FY 2017: interim and f inal dividend for FY2017. FY 2016: interim, f inal and special dividend for FY2016.
Polymetal International plc 3
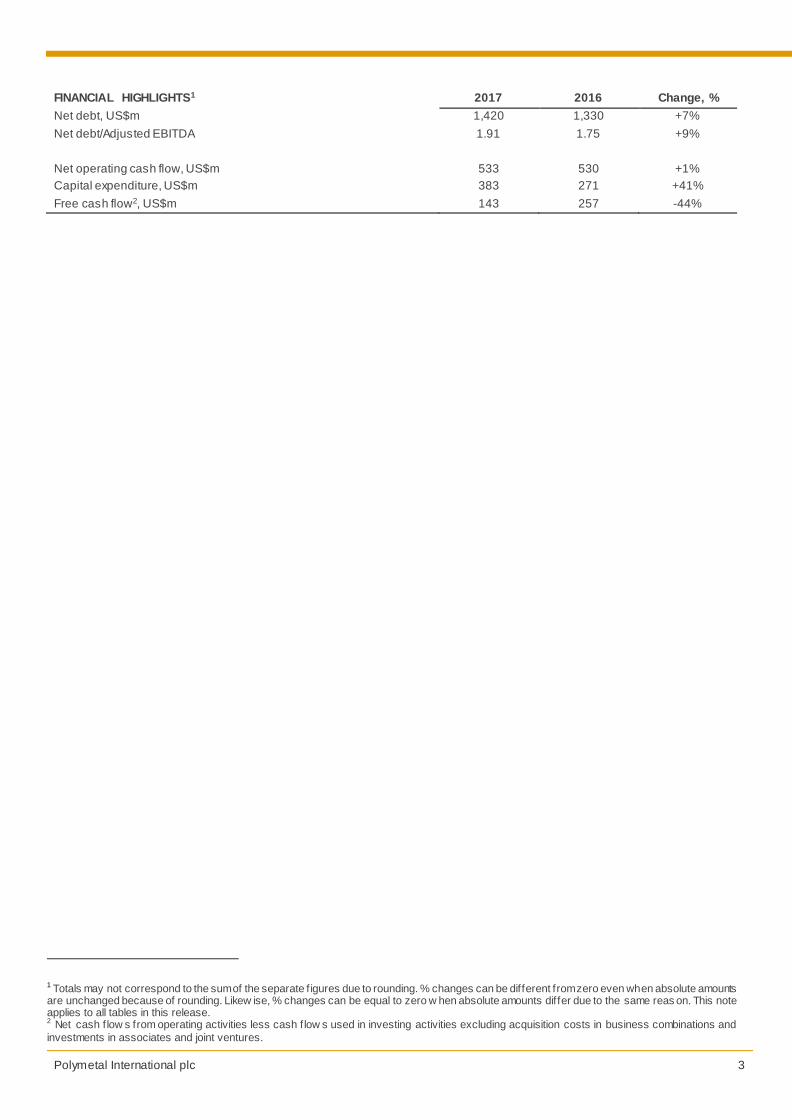
FINANCIAL HIGHLIGHTS1 2017 2016 Change, %
Net debt, US$m 1,420 1,330 +7%
Net debt/Adjusted EBITDA 1.91 1.75 +9%
Net operating cash flow, US$m 533 530 +1%
Capital expenditure, US$m 383 271 +41%
Free cash flow2, US$m 143 257 -44%
1 Totals may not correspond to the sum of the separate f igures due to rounding. % changes can be different from zero even when absolute amounts are unchanged because of rounding. Likew ise, % changes can be equal to zero w hen absolute amounts differ due to the same reas on. This note applies to all tables in this release. 2 Net cash f low s from operating activities less cash f low s used in investing activities excluding acquisition costs in business combinations and
investments in associates and joint ventures.
Polymetal International plc 4
CONFERENCE CALL AND WEBCAST
Polymetal will hold a conference call and webcast on Monday, 12 March 2018 at 09:00 London time (12:00 Moscow
time).
To participate in the call, please dial: 8 10 800 500 98 63 access code 50622354# (free from Russia), or
+44 20 3009 2483 (free from the UK), or +1 646 722 4912 (free from the US), or
or follow the link: http://www.audio-webcast.com/cgi-bin/visitors.ssp?fn=visitor&id=5403
Please be prepared to introduce yourself to the moderator or register.
Webcast replay will be available on Polymetal’s website (www.polymetalinternational.com) and at http://www.audio-webcast.com/cgi-bin/visitors.ssp?fn=visitor&id=5403. A recording of the call will be available immediately after the call
at +44 20 3364 5147 (from within the UK), +1 646 722 4969 (USA Toll Free) and +7 495 249 16 71 (from within Russia), access code 418742254#, from 12:30 Moscow time Monday, 12 March, till 12:30 Moscow time Monday, 19 March, 2018.
THIS RELEASE MAY INCLUDE STATEMENTS THAT ARE, OR MAY BE DEEMED TO BE, “FORWARD-LOOKING STATEMENTS”. THESE FORWARD-LOOKING STATEMENTS SPEAK ONLY AS AT THE DATE OF THIS RELEASE. THESE FORWARD-LOOKING STATEMENTS CAN BE IDENTIFIED BY THE USE OF FORWARD-LOOKING TERMINOLOGY, INCLUDING THE WORDS “TARGETS”, “BELIEVES”, “EXPECTS”, “AIMS”, “INTENDS”, “WILL”, “MAY”, “ANTICIPATES”, “WOULD”, “COULD” OR “SHOULD” OR SIMILAR EXPRESSIONS OR, IN EACH CASE THEIR NEGATIVE OR OTHER VARIATIONS OR BY DISCUSSION OF STRATEGIES, PLANS, OBJECTIVES, GOALS, FUTURE EVENTS OR INTENTIONS. THESE FORWARD-LOOKING STATEMENTS ALL INCLUDE MATTERS THAT ARE NOT HISTORICAL FACTS. BY THEIR NATURE, SUCH FORWARD-LOOKING STATEMENTS INVOLVE KNOWN AND UNKNOWN RISKS, UNCERTAINTIES AND OTHER IMPORTANT FACTORS BEYOND THE COMPANY’S CONTROL THAT COULD CAUSE THE ACTUAL RESULTS, PERFORMANCE OR ACHIEVEMENTS OF THE COMPANY TO BE MATERIALLY DIFFERENT FROM FUTURE RESULTS, PERFORMANCE OR ACHIEVEMENTS EXPRESSED OR IMPLIED BY SUCH FORWARD-LOOKING STATEMENTS. SUCH FORWARD-LOOKING STATEMENTS ARE BASED ON NUMEROUS ASSUMPTIONS REGARDING THE COMPANY’S PRESENT AND FUTURE BUSINESS STRATEGIES AND THE ENVIRONMENT IN WHICH THE COMPANY WILL OPERATE IN THE FUTURE. FORWARD-LOOKING STATEMENTS ARE NOT GUARANTEES OF FUTURE PERFORMANCE. THERE ARE MANY FACTORS THAT COULD CAUSE THE COMPANY’S ACTUAL RESULTS, PERFORMANCE OR ACHIEVEMENTS TO DIFFER MATERIALLY FROM THOSE EXPRESSED IN SUCH FORWARD-LOOKING STATEMENTS. THE COMPANY EXPRESSLY DISCLAIMS ANY OBLIGATION OR UNDERTAKING TO DISSEMINATE ANY UPDATES OR REVISIONS TO ANY FORWARD-LOOKING STATEMENTS CONTAINED HEREIN TO REFLECT ANY CHANGE IN THE COMPANY’S EXPECTATIONS WITH REGARD THERETO OR ANY CHANGE IN EVENTS, CONDITIONS OR CIRCUMSTANCES ON WHICH ANY SUCH STATEMENTS ARE BASED
Group CEO statement...................................................................................................................................... 7
Principal risks and uncertainties .................................................................................................................... 25
In March 2018, we celebrate 20 years since the foundation of Polymetal. During that time, we have consistently delivered a strong operating performance and made good on our promises to our shareholders, employees, communities and other stakeholders.
Dear fellow stakeholders
In 2018, Polymetal celebrates its 20th anniversary; perhaps still youthful by global metrics but, nevertheless, a respectable milestone for a business built from the ground up in an emerging market . During that time, the Company
has delivered a compound annual growth rate (CAGR) of 24% in production, 16 mines developed from scratch, 6.7 Moz of gold equivalent and 9.5 Moz of palladium equivalent in newly discovered resources, over US$ 1 billion in dividends and attained industry leadership in processing refractory gold. We have expanded our operations within
three mining jurisdictions in the former Soviet Union (Russia, Kazakhstan and Armenia) and have achieved a premium listing on the London Stock Exchange in 2011.
Playing to our strengths
Over the last 20 years, we have built on our core competencies: using a hub-based system (Dukat, Omolon and Okhotsk); mastering POX technology and trading refractory gold concentrates (Kyzyl, Albazino, Mayskoye); operating successfully in difficult climatic conditions at locations with little or no existing infrastructure (five operations in the
Russian Far East). Consistently focusing on high-grade assets has also ensured that we have delivered superior returns on capital.
Financial prudence pays dividends
Adherence to strong capital discipline has been the foundation of our strategy – in careful project selection with a preference for high grade and low-capital-intensity, in value-accretive M&As, as well as in our dividend policy. From free cash flow for 2012-2017 totalling US$ 1.3 billion, Polymetal paid out US$ 1 billion in dividends, providing tangible
returns to shareholders with a sector-leading three-year TSR1 of 61%.
Leading by example
At the same time, Polymetal recognises its duty of care for its entire stakeholder base, as evidenced by its practice of
good governance and sustainable development in the regions in which we operate. The Board and management are fully committed to a sustainability agenda with a renewed focus on health and safety. In other areas, Polymetal’s position as an industry leader in sustainability is acknowledged both by local communities and by an increasing number of international rating agencies, most recently the World Wildlife Fund and Sustainalytics. We are also signatories to
the International Cyanide Management Code.
Polymetal is at the start of another dynamic stage in its history. Our investment in new projects – Kyzyl, and potentially into Nezhda, Prognoz and a second Amursk POX line - is expected to enable Polymetal to deliver superior shareholder
returns and industry leadership over the long term. I look forward to making this journey , along with the Company’s stakeholders.
Bobby Godsell Chairman
1 Total shareholder return.
Polymetal International plc 7
GROUP CEO STATEMENT
We have made significant progress in 2017 on existing operations and new projects, and 2018 looks set to be a transformational year for Polymetal.
A successful and eventful year
2017 has been an exciting year for Polymetal, with significant progress made on the Kyzyl construction and the Amursk POX expansion. Both projects are on track and will launch within a few months. We further advanced our growth pipeline with the initial resource and reserve estimate on Nezhda joint venture reaffirming the economic attractiveness
of the asset and justifying our development approach; we have also secured an option to consolidate our ownership. During the year, we invested in Prognoz, the largest undeveloped silver asset in Russia and progressed with pilot plant testing at Viksha, our first platinum group metals (PGM) project.
We have substantially increased our resources this year. Reserves at Nezhda1 were confirmed as 2.0 Moz of GE at 4.0 g/t with an exploration upside of 8.9 Moz of additional resources at 5.0 g/t. At Prognoz, where we have begun drilling, according to historical estimates there is a high-grade resource of 292 Moz of silver1 at 586 g/t with excellent
exploration potential. An updated reserve estimate at the Komar gold deposit reported an increase of 535 Koz of gold with the grade stable at 1.8 g/t. We are now planning to transport more than 2 million tonnes of ore from Komar to our Varvara processing site, doubling the anticipated production rate.
Operationally, we met the production guidance comfortably, growing GE production 13% year-on-year to 1.43 Moz. Just one year after launch, Svetloye delivered superior results while Komar provided strong support to our Varvara operations. Other mature mines generally performed in line with expectations, with the exception of Mayskoye where
open-pit production has been delayed until 2018 in order to rectify recovery issues. By the end of the year we also achieved a record 97.2% recovery at our flagship Amursk POX hub.
Full-year gold production of 1,075 Koz, a 21% increase year-on-year, allowed Polymetal to join the prestigious 1Moz
club, the second premium-listed London Stock Exchange gold company to achieve this impressive milestone.
Robust financial performance
Despite peak capital spending at Kyzyl and the Amursk POX expansion, in addition to our investment in new
development projects, Polymetal delivered meaningful free cash flow, totalling US$ 143 million in 2017. There were some cost pressures during the year due to the significant 15% appreciation of the Russian Rouble, driven by the rebound in oil prices, which pushed TCC up to US$ 658/GE oz in 2017 (2016: US$ 570/GE oz). However, this was partially offset by the best performance in gold prices since 2010, with 13% annual growth.
This enabled us to deliver a net profit for the year of US$354 million. In line with the new dividend policy, the pay-out ratio for regular dividends has been increased to 50%. In 2017, dividends of US$ 138 million (US$ 0.32 per share) were paid out and a final dividend of US$ 129 million (US$ 0.30 per share) is proposed.
Health and safety still a key focus
Although there has been some improvement in our health and safety performance, there is no room for complacency since, sadly, we have to report the death of two employees in 2017. We continue to view this as unacceptable and
remain committed to our zero-fatalities target, as our enhanced critical risk management system gains traction.
At the same time, we have received wide-spread recognition for our sustainability initiatives, both here in our home market and internationally. Most recently we were awarded a top ranking for environmental responsibility among
Russian metals and mining companies by the World Wildlife Fund; Sustainalytics positioned Polymetal as an outperformer in the metals and mining industry, ranking it first among its peers and fourth among the 44 mining companies included in the report; our performance on the Dow Jones Sustainability Index was accessed as above
industry average and up 28% over the previous year. We were also awarded the highest score for Corporate Governance and Anti-Corruption in the FTSE4Good Index.
1 On a 100% basis
Polymetal International plc 8
Anticipating the future
2018 looks set to become another transformational year for Polymetal. The launch of the Kyzyl project is scheduled for the third quarter and is much anticipated both within the Company and by all our stakeholders. This, in turn, should
allow us to move closer to finalising decisions on two further investments by the end of 2018, namely the construction plans for Nezhda and the feasibility study for a second POX line at Amursk. We expect further production growth in 2018, with this predominantly driven by Kyzyl but also from Komar’s ramp-up to 2.2 Mtpa and from our existing mines
continuing to deliver stable performances.
Last, but by no means least, I wish to thank our employees for all their commitment and professionalism. It is their efforts that have helped to shape the Company over the last 20 years and should be celebrated, along with the
anniversary itself. I am optimistically looking forward to the next decade in our history and to us all playing our parts in this new chapter of Polymetal’s story.
Vitaly Nesis Group CEO
Polymetal International plc 9
OPERATING REVIEW
A record-breaking year
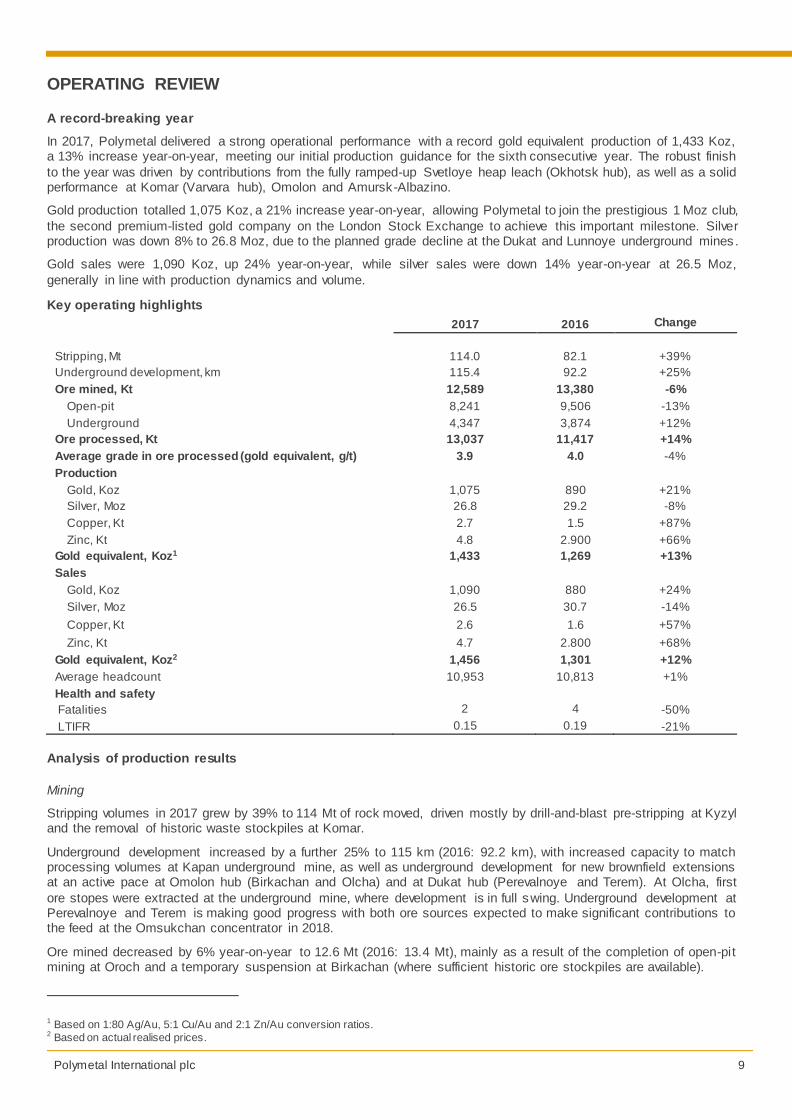
In 2017, Polymetal delivered a strong operational performance with a record gold equivalent production of 1,433 Koz, a 13% increase year-on-year, meeting our initial production guidance for the sixth consecutive year. The robust finish
to the year was driven by contributions from the fully ramped-up Svetloye heap leach (Okhotsk hub), as well as a solid performance at Komar (Varvara hub), Omolon and Amursk-Albazino.
Gold production totalled 1,075 Koz, a 21% increase year-on-year, allowing Polymetal to join the prestigious 1 Moz club,
the second premium-listed gold company on the London Stock Exchange to achieve this important milestone. Silver production was down 8% to 26.8 Moz, due to the planned grade decline at the Dukat and Lunnoye underground mines .
Gold sales were 1,090 Koz, up 24% year-on-year, while silver sales were down 14% year-on-year at 26.5 Moz,
generally in line with production dynamics and volume.
Key operating highlights
2017 2016 Change
Stripping, Mt 114.0 82.1 +39%
Underground development, km 115.4 92.2 +25%
Ore mined, Kt 12,589 13,380 -6%
Open-pit 8,241 9,506 -13%
Underground 4,347 3,874 +12%
Ore processed, Kt 13,037 11,417 +14%
Average grade in ore processed (gold equivalent, g/t) 3.9 4.0 -4%
Production
Gold, Koz 1,075 890 +21%
Silver, Moz 26.8 29.2 -8%
Copper, Kt 2.7 1.5 +87%
Zinc, Kt 4.8 2.900 +66%
Gold equivalent, Koz1 1,433 1,269 +13%
Sales
Gold, Koz 1,090 880 +24%
Silver, Moz 26.5 30.7 -14%
Copper, Kt 2.6 1.6 +57%
Zinc, Kt 4.7 2.800 +68%
Gold equivalent, Koz2 1,456 1,301 +12%
Average headcount 10,953 10,813 +1%
Health and safety
Fatalities 2 4 -50%
LTIFR 0.15 0.19 -21%
Analysis of production results
Mining
Stripping volumes in 2017 grew by 39% to 114 Mt of rock moved, driven mostly by drill-and-blast pre-stripping at Kyzyl and the removal of historic waste stockpiles at Komar.
Underground development increased by a further 25% to 115 km (2016: 92.2 km), with increased capacity to match processing volumes at Kapan underground mine, as well as underground development for new brownfield extensions at an active pace at Omolon hub (Birkachan and Olcha) and at Dukat hub (Perevalnoye and Terem). At Olcha, first
ore stopes were extracted at the underground mine, where development is in full swing. Underground development at Perevalnoye and Terem is making good progress with both ore sources expected to make significant contributions to the feed at the Omsukchan concentrator in 2018.
Ore mined decreased by 6% year-on-year to 12.6 Mt (2016: 13.4 Mt), mainly as a result of the completion of open-pit mining at Oroch and a temporary suspension at Birkachan (where sufficient historic ore stockpiles are available).
1 Based on 1:80 Ag/Au, 5:1 Cu/Au and 2:1 Zn/Au conversion ratios. 2 Based on actual realised prices.
Polymetal International plc 10
Processing
Ore processed increased by 14% to 13.0 Mt (2016: 11.4 Mt), mainly on the back of the resumption of the Birkachan heap leach project and the ramp-up of Svetloye.
As expected, the average gold equivalent grade in ore processed decreased slightly from 4.0 g/t to 3.9 g/t, while remaining close to average reserve grade. The decline came mostly from mature operations: the normalisation of the grade profile at the Dukat and Lunnoye mines; a scheduled slight decline in average grades at the Voro heap leach
facility; and a lower gold average grade at the Omolon’s Kubaka plant due to a change in the feedstock mix.
Production and sales
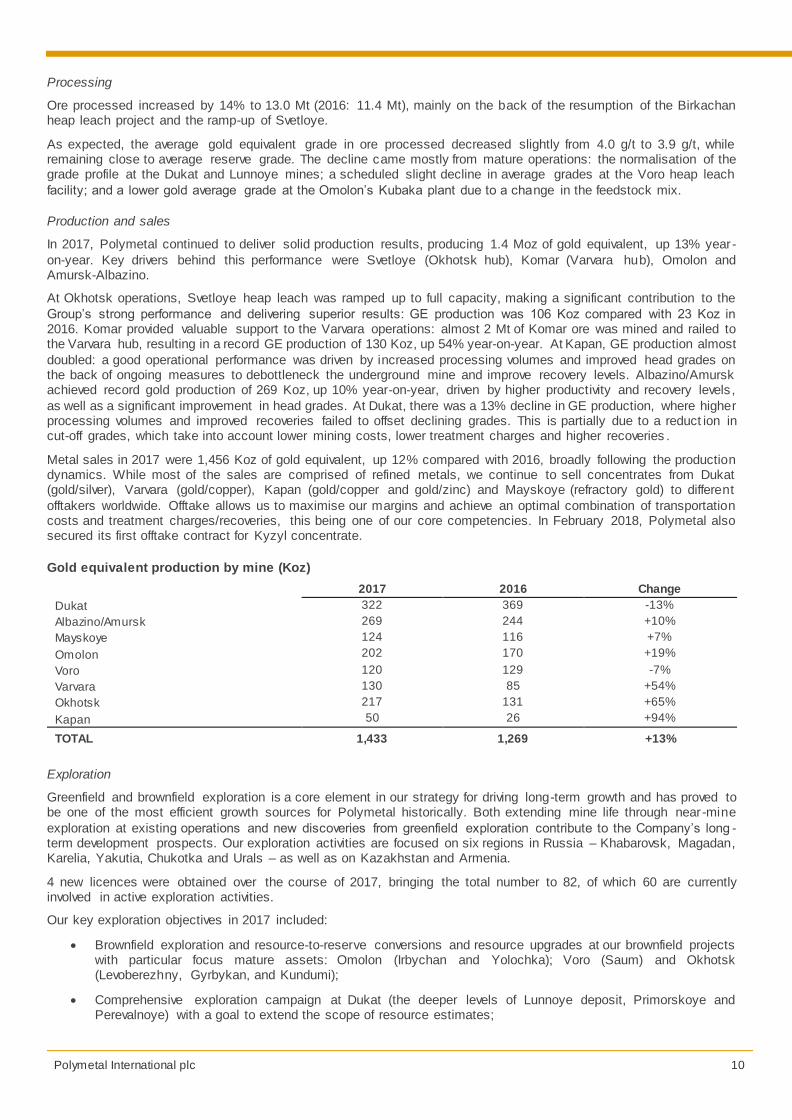
In 2017, Polymetal continued to deliver solid production results, producing 1.4 Moz of gold equivalent, up 13% year-
on-year. Key drivers behind this performance were Svetloye (Okhotsk hub), Komar (Varvara hub), Omolon and Amursk-Albazino.
At Okhotsk operations, Svetloye heap leach was ramped up to full capacity, making a significant contribution to the
Group’s strong performance and delivering superior results: GE production was 106 Koz compared with 23 Koz in 2016. Komar provided valuable support to the Varvara operations: almost 2 Mt of Komar ore was mined and railed to the Varvara hub, resulting in a record GE production of 130 Koz, up 54% year-on-year. At Kapan, GE production almost
doubled: a good operational performance was driven by increased processing volumes and improved head grades on the back of ongoing measures to debottleneck the underground mine and improve recovery levels. Albazino/Amursk achieved record gold production of 269 Koz, up 10% year-on-year, driven by higher productivity and recovery levels ,
as well as a significant improvement in head grades. At Dukat, there was a 13% decline in GE production, where higher processing volumes and improved recoveries failed to offset declining grades. This is partially due to a reduct ion in cut-off grades, which take into account lower mining costs, lower treatment charges and higher recoveries .
Metal sales in 2017 were 1,456 Koz of gold equivalent, up 12% compared with 2016, broadly following the production dynamics. While most of the sales are comprised of refined metals, we continue to sell concentrates from Dukat (gold/silver), Varvara (gold/copper), Kapan (gold/copper and gold/zinc) and Mayskoye (refractory gold) to different
offtakers worldwide. Offtake allows us to maximise our margins and achieve an optimal combination of transportation costs and treatment charges/recoveries, this being one of our core competencies. In February 2018, Polymetal also secured its first offtake contract for Kyzyl concentrate.
Gold equivalent production by mine (Koz)
2017 2016 Change
Dukat 322 369 -13%
Albazino/Amursk 269 244 +10%
Mayskoye 124 116 +7%
Omolon 202 170 +19%
Voro 120 129 -7%
Varvara 130 85 +54%
Okhotsk 217 131 +65%
Kapan 50 26 +94%
TOTAL 1,433 1,269 +13%
Exploration
Greenfield and brownfield exploration is a core element in our strategy for driving long-term growth and has proved to be one of the most efficient growth sources for Polymetal historically. Both extending mine life through near-mine
exploration at existing operations and new discoveries from greenfield exploration contribute to the Company’s long -term development prospects. Our exploration activities are focused on six regions in Russia – Khabarovsk, Magadan, Karelia, Yakutia, Chukotka and Urals – as well as on Kazakhstan and Armenia.
4 new licences were obtained over the course of 2017, bringing the total number to 82, of which 60 are currently involved in active exploration activities.
Our key exploration objectives in 2017 included:
Brownfield exploration and resource-to-reserve conversions and resource upgrades at our brownfield projects with particular focus mature assets: Omolon (Irbychan and Yolochka); Voro (Saum) and Okhotsk (Levoberezhny, Gyrbykan, and Kundumi);
Comprehensive exploration campaign at Dukat (the deeper levels of Lunnoye deposit, Primorskoye and Perevalnoye) with a goal to extend the scope of resource estimates;
Polymetal International plc 11
Initial JORC reserve and resource estimate at Nezhda JV’s Zone 1 and further drilling on smaller, potentially mineralised zones;
37 km of diamond drilling at the Prognoz silver deposit to confirm the resources of Main and Swamp ore zones;
JORC-compliant reserve estimate and a combined LOM plan for Kapan and Lichkvaz;
30 km of step-out drilling at Komar and update of the reserve and resource estimates for the deposit;
Continuing step-out and deep-level drilling at Kyzyl.
In 2017, Polymetal succeeded in extending life-of-mine at producing assets and continued to invest in the next leg of our growth. Polymetal completed 421 km of exploration drilling in 2017, up 48% year-on-year as the scope of
exploration expanded to include new assets, mostly Prognoz and Nezhda, in addition to continued exploration efforts at existing operations. The total capital expenditure on exploration was US$ 58 million, up 43% compared to 2016.
As a result of our exploration efforts, meaningful resource-to-reserve conversions were achieved during the year, along
with new reserve and resource estimates completed for several projects, including:
At Albazino, the initial ore reserve estimate for Farida open pit (169 Koz GE) and Anfisa underground (47 Koz GE);
Significant ore reserves increase of 524 Koz of gold (+49%) at Komar;
An initial JORC-compliant reserve estimate at Kapan, which comprises 558 Koz GE at an average grade of 4.3 g/t. Additional mineral resources were estimated at 1,632 Koz GE at an average grade of 6.1 g/t;
An initial JORC-compliant reserve estimate at Lichkvaz comprised 134 Koz GE at 3.9 g/t, while additional
mineral resources amounted to 257 Koz GE at 5.0 g/t;
At Nezhda, an initial JORC-compliant ore reserve estimate for open pit mining at ore zone 1 that comprised (on a 100% ownership basis) 15.5 Mt of ore with an average grade of 4.0 g/t GE containing 2.0 Moz of GE 1.
Additional mineral resources for Nezhda were estimated at 55.9 Mt of ore with an average grade of GE 5.0 g/t, containing 8.9 Moz of GE2.
In 2018, Polymetal will continue to invest in exploration with the goal to expand the pace and scope of drilling, as well
as prospect evaluation. The key objectives are as follows:
To achieve resource-to-reserve conversions at existing operations with relatively shorter LOM;
Polymetal aims to complete initial ore reserves estimates for the following deposits in 2018: Irbychan and Yolochka at Omolon; Saum and Pesherny at Voro; Levoberezhny and Kundumi at Okhotsk; Primorskoye and
Perevalnoye (revaluation) at Dukat;
To prepare an updated mineral resource estimate and achieve resource-to-reserve conversion at Nezhda to include the southern flank of ore zone 1 and smaller mineralised zones;
To compete an audited JORC-compliant resource estimate for Prognoz largest ore zones, Main and Swamp;
To prepare an updated mineral resources estimate for Viksha based on new drilling data and metallurgical studies;
To continue step-out and in-fill drilling at Kyzyl to increase reserves for open pit mining.
Reserves and resources
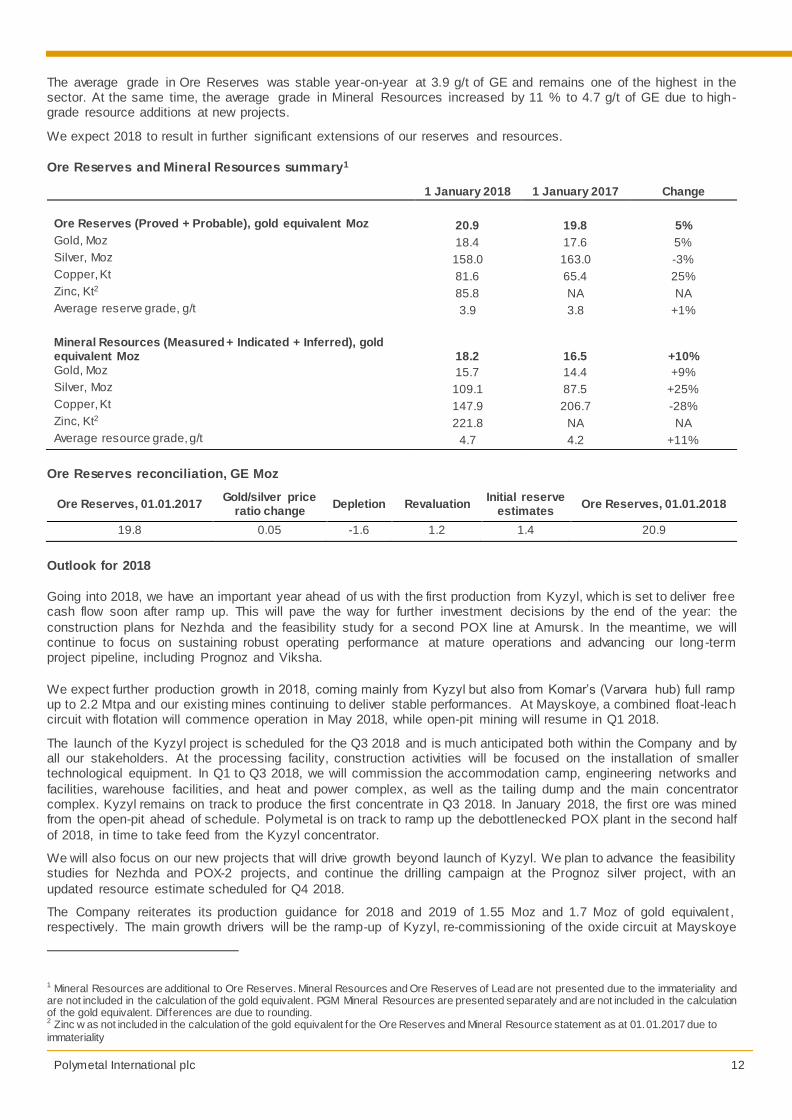
In 2017, the Company increased its Ore Reserves by 5% to 20.9 Moz of gold equivalent (GE) on the back of successful exploration at Albazino, Komar and Dukat, as well as initial reserve estimates at Kapan and Nezhda. Gold reserves
were up 5% at 18.4 Moz, while silver reserves decreased 3% to 158 Moz. At the same time, copper reserves grew 25% to 82 Kt.
Mineral Resources (in addition to Ore Reserves) increased by 10% to 18.2 Moz of GE, mainly driven by initial resource
estimates for the Pesherniy and Nezhda deposits, as well as resource additions at the deeper levels of Mayskoye and Dukat.
1 350 Koz pro rata to Polymetal’s current ow nership of 17.7% 2 1,576 Koz of GE pro rata to Polymetal’s current ow nership of 17.7%
Polymetal International plc 12
The average grade in Ore Reserves was stable year-on-year at 3.9 g/t of GE and remains one of the highest in the sector. At the same time, the average grade in Mineral Resources increased by 11 % to 4.7 g/t of GE due to high-grade resource additions at new projects.
We expect 2018 to result in further significant extensions of our reserves and resources.
Ore Reserves and Mineral Resources summary1
Ore Reserves reconciliation, GE Moz
Ore Reserves, 01.01.2017 Gold/silver price
ratio change Depletion Revaluation Initial reserve
estimates Ore Reserves, 01.01.2018
19.8 0.05 -1.6 1.2 1.4 20.9
Outlook for 2018
Going into 2018, we have an important year ahead of us with the first production from Kyzyl, which is set to deliver free cash flow soon after ramp up. This will pave the way for further investment decisions by the end of the year: the
construction plans for Nezhda and the feasibility study for a second POX line at Amursk. In the meantime, we will continue to focus on sustaining robust operating performance at mature operations and advancing our long-term project pipeline, including Prognoz and Viksha.
We expect further production growth in 2018, coming mainly from Kyzyl but also from Komar’s (Varvara hub) full ramp up to 2.2 Mtpa and our existing mines continuing to deliver stable performances. At Mayskoye, a combined float-leach circuit with flotation will commence operation in May 2018, while open-pit mining will resume in Q1 2018.
The launch of the Kyzyl project is scheduled for the Q3 2018 and is much anticipated both within the Company and by all our stakeholders. At the processing facility, construction activities will be focused on the installation of smaller technological equipment. In Q1 to Q3 2018, we will commission the accommodation camp, engineering networks and
facilities, warehouse facilities, and heat and power complex, as well as the tailing dump and the main concentrator complex. Kyzyl remains on track to produce the first concentrate in Q3 2018. In January 2018, the first ore was mined from the open-pit ahead of schedule. Polymetal is on track to ramp up the debottlenecked POX plant in the second half
of 2018, in time to take feed from the Kyzyl concentrator.
We will also focus on our new projects that will drive growth beyond launch of Kyzyl. We plan to advance the feasibility studies for Nezhda and POX-2 projects, and continue the drilling campaign at the Prognoz silver project, with an
updated resource estimate scheduled for Q4 2018.
The Company reiterates its production guidance for 2018 and 2019 of 1.55 Moz and 1.7 Moz of gold equivalent , respectively. The main growth drivers will be the ramp-up of Kyzyl, re-commissioning of the oxide circuit at Mayskoye
1 Mineral Resources are additional to Ore Reserves. Mineral Resources and Ore Reserves of Lead are not presented due to the immateriality and are not included in the calculation of the gold equivalent. PGM Mineral Resources are presented separately and are not included in the calculation of the gold equivalent. Differences are due to rounding. 2 Zinc w as not included in the calculation of the gold equivalent for the Ore Reserves and Mineral Resource statement as at 01.01.2017 due to
Mineral Resources (Measured + Indicated + Inferred), gold equivalent Moz
18.2
16.5
+10%
Gold, Moz 15.7 14.4 +9%
Silver, Moz 109.1 87.5 +25%
Copper, Kt 147.9 206.7 -28%
Zinc, Kt2 221.8 NA NA
Average resource grade, g/t 4.7 4.2 +11%
Polymetal International plc 13
and incremental improvements at Varvara and Kapan. This should offset anticipated grade declines at Khakanja and Voro. As previously, production in both years will be weighted towards the second of the year due to seasonality.
Our focus remains on health and safety, where we are yet to achieve our principal goal of zero fatalities at all operations.
In 2018, we will continue implementing a geomechanical management system that will help eliminate accidents re lated to mining processes.
Polymetal International plc 14
FINANCIAL REVIEW
MARKET SUMMARY
Precious metals
For the second year in a row, gold is one of the best performing assets after consecutive price declines in 2013-2015. The price of gold grew by 13.5% - its biggest annual gain since 2010 - outperforming all major asset classes other than equities. The positive price momentum was primarily supported by a weakened US dollar, as well as heightened
investor uncertainty on the back of geopolitical instability and a potential pullback on increased P/E ratios and expensive stock valuations that fuelled investor flows into gold.
However, gold demand remained under pressure in 2017, down 7% to 4,0721 tonnes over 2016. The decline was
driven by substantially lower retail investment demand and lagging ETFs that added only one-third of 2016’s inflows. On the other hand, buying from central banks recorded a substantial gain of 36% year-on-year as Russia and Turkey continued to bolster gold reserves. Technology demand recorded its first year of growth as the use of gold in
smartphones and vehicles continues to increase, ending a six-year downtrend. Physical demand remained relatively flat over the previous year, while jewellery demand posted its first annual increase since 2013, but remains weak in historical context.
Although gold traded within a narrow range of US$ 1,200–1,300/oz for most of the year, it closed at US$ 1,297/oz vs US$ 1,159/oz in 2016, averaging US$ 1,257 for the year and recording a year-high of US$ 1,351 in the third quarter. Silver underperformed gold ending the year on par with its 2016 average of US$ 17.0/oz. The spot price at 31
December 2017 comprised US$ 16.9/oz, up 4% compared to 1 January 2017.
Foreign exchange
The Group’s revenues and the majority of its borrowings are denominated in US Dollars, while the majority of the
Group’s operating costs are denominated in Russian Roubles. As a result, changes in exchange rates affect its financial results and performance.
For the Russian economy as a whole, 2017 proved to be a year of moderate improvement as oil continued the positive
price momentum it gained in 2016, finishing the year at US$ 60 per barrel. At the same time, the Russian Rouble appreciated 15% year-on-year from an average of 67.1 RUB/USD in 2016 to 58.3 RUB/USD in 2017, while the spot rate as at 31 December 2017 appreciated by 5% to 57.6 RUB/USD compared to 31 December 2016. However, this
trend had a negative impact on the mining sector, resulting in increased Dollar value of the Group’s Rouble-denominated operating costs and lower Adjusted EBITDA margins in the reported period.
The economics of Kazakh gold mining operations were also impacted by a moderate strengthening of the Kazakh
tenge (up 5% year-on-year, from 342 KZT/USD in 2016 to 326 KZT/USD in 2017). The Armenian dram remains the most stable currency in the CIS region with an average exchange rate of 484 AMD/USD in 2017 (2016: 480 AMD/USD).
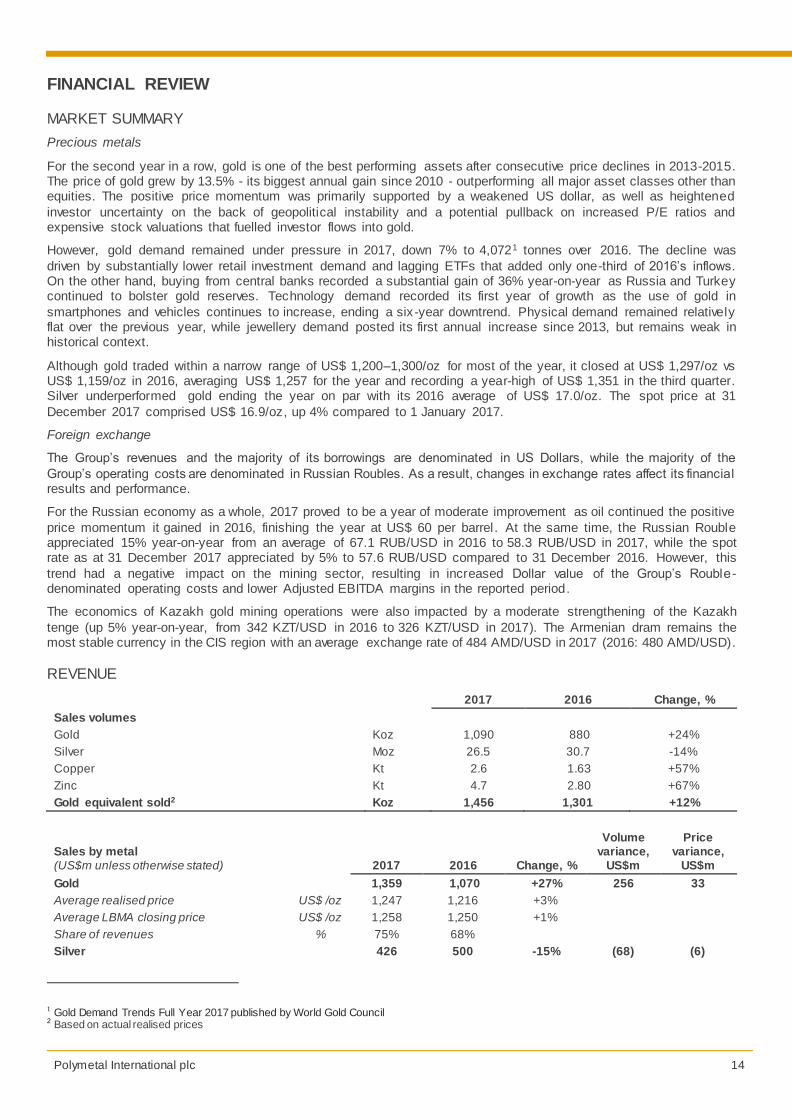
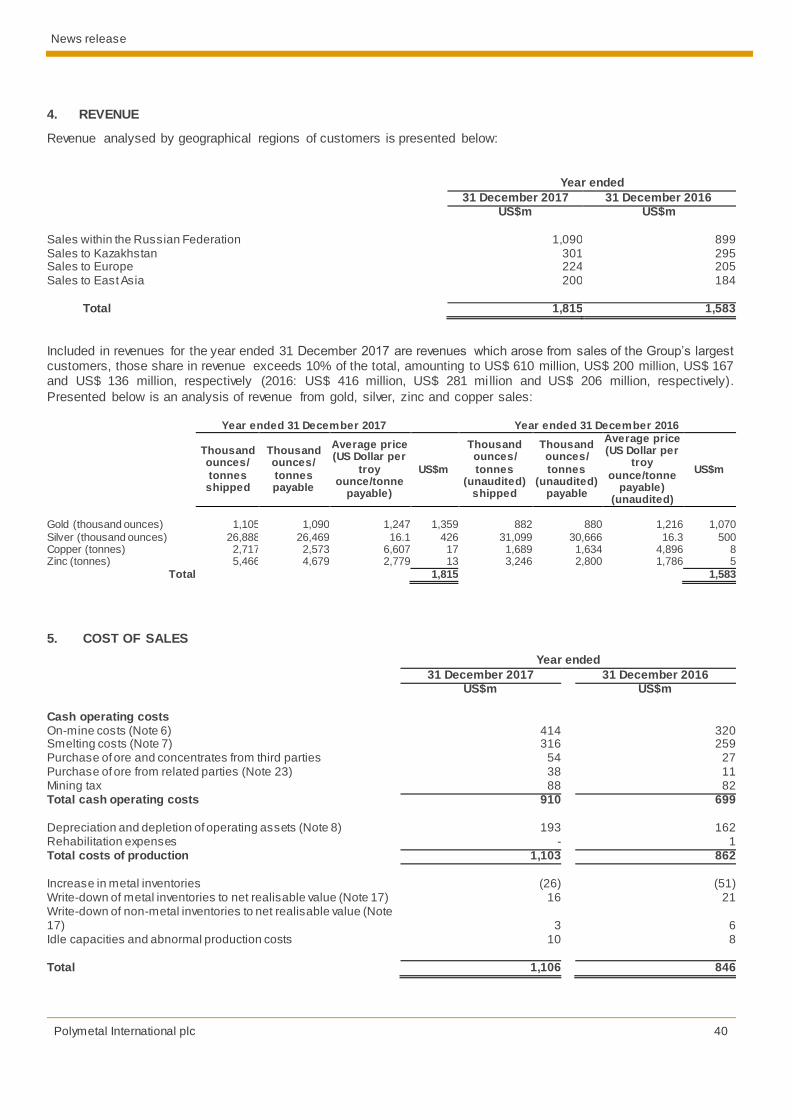
REVENUE
2017 2016 Change, %
Sales volumes Gold Koz 1,090 880 +24%
Silver Moz 26.5 30.7 -14%
Copper Kt 2.6 1.63 +57%
Zinc Kt 4.7 2.80 +67%
Gold equivalent sold2 Koz 1,456 1,301 +12%
Sales by metal (US$m unless otherwise stated) 2017 2016 Change, %
Volume variance,
US$m
Price variance,
US$m
Gold 1,359 1,070 +27% 256 33
Average realised price US$ /oz 1,247 1,216 +3% Average LBMA closing price US$ /oz 1,258 1,250 +1%
1 Gold Demand Trends Full Year 2017 published by World Gold Council
2 Based on actual realised prices
Polymetal International plc 15
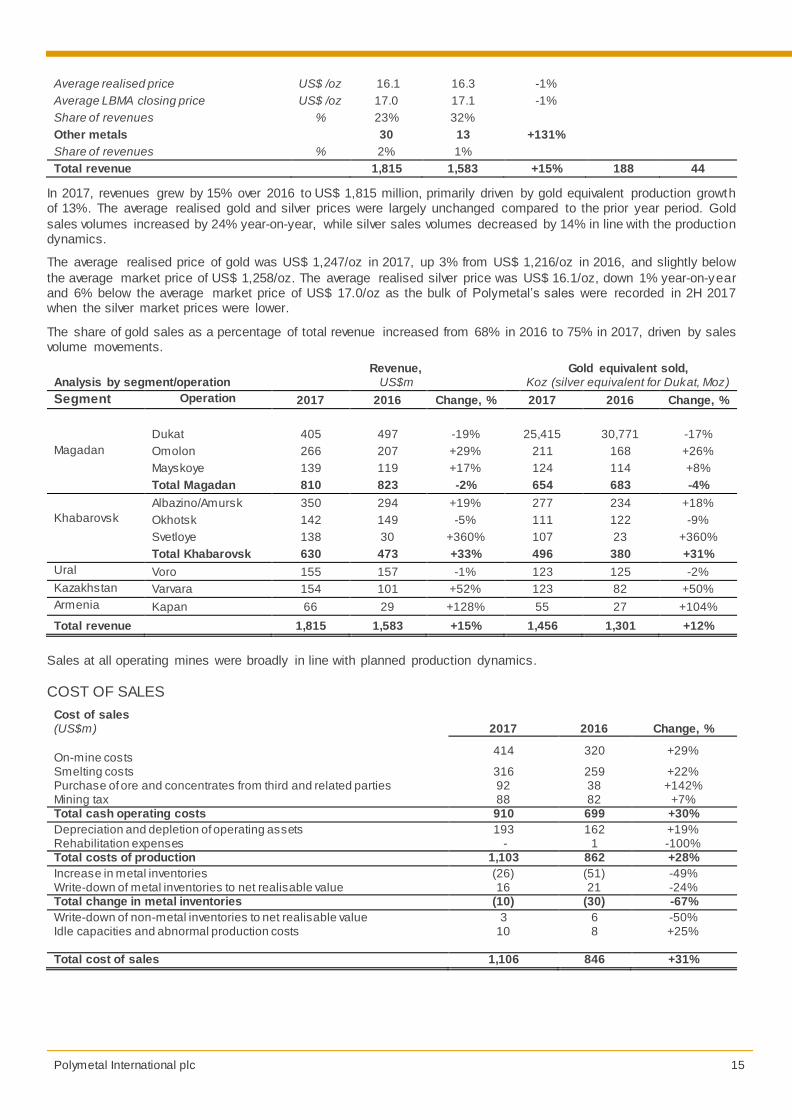
Average realised price US$ /oz 16.1 16.3 -1% Average LBMA closing price US$ /oz 17.0 17.1 -1%
Share of revenues % 23% 32% Other metals 30 13 +131% Share of revenues % 2% 1%
Total revenue 1,815 1,583 +15% 188 44
In 2017, revenues grew by 15% over 2016 to US$ 1,815 million, primarily driven by gold equivalent production growth of 13%. The average realised gold and silver prices were largely unchanged compared to the prior year period. Gold
sales volumes increased by 24% year-on-year, while silver sales volumes decreased by 14% in line with the production dynamics.
The average realised price of gold was US$ 1,247/oz in 2017, up 3% from US$ 1,216/oz in 2016, and slightly below
the average market price of US$ 1,258/oz. The average realised silver price was US$ 16.1/oz, down 1% year-on-year and 6% below the average market price of US$ 17.0/oz as the bulk of Polymetal’s sales were recorded in 2H 2017 when the silver market prices were lower.
The share of gold sales as a percentage of total revenue increased from 68% in 2016 to 75% in 2017, driven by sales volume movements.
Sales at all operating mines were broadly in line with planned production dynamics.
COST OF SALES
Cost of sales (US$m) 2017 2016 Change, % On-mine costs
414 320 +29%
Smelting costs 316 259 +22% Purchase of ore and concentrates from third and related parties 92 38 +142% Mining tax 88 82 +7% Total cash operating costs 910 699 +30% Depreciation and depletion of operating assets 193 162 +19% Rehabilitation expenses - 1 -100% Total costs of production 1,103 862 +28% Increase in metal inventories (26) (51) -49% Write-down of metal inventories to net realisable value 16 21 -24% Total change in metal inventories (10) (30) -67% Write-down of non-metal inventories to net realisable value 3 6 -50% Idle capacities and abnormal production costs 10 8 +25%
Total cost of sales 1,106 846 +31%
Polymetal International plc 16
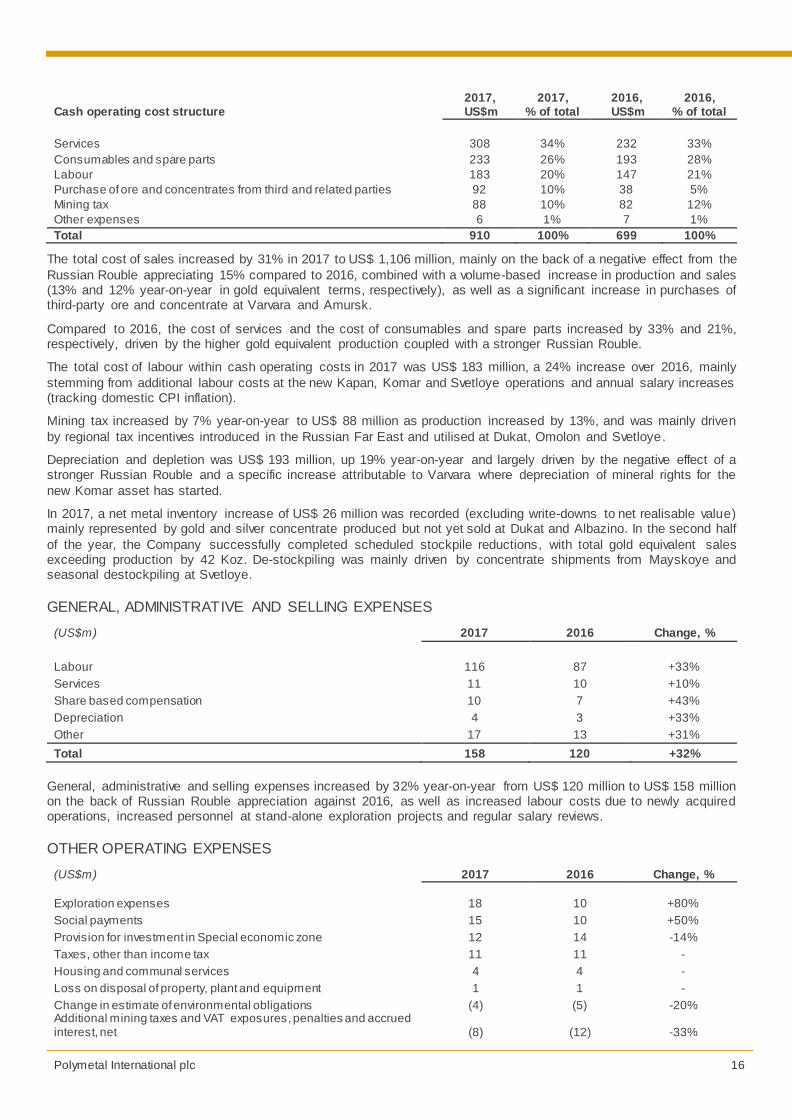
Cash operating cost structure 2017, US$m
2017, % of total
2016, US$m
2016, % of total
Services 308 34% 232 33%
Consumables and spare parts 233 26% 193 28%
Labour 183 20% 147 21%
Purchase of ore and concentrates from third and related parties 92 10% 38 5%
Mining tax 88 10% 82 12%
Other expenses 6 1% 7 1%
Total 910 100% 699 100%
The total cost of sales increased by 31% in 2017 to US$ 1,106 million, mainly on the back of a negative effect from the
Russian Rouble appreciating 15% compared to 2016, combined with a volume-based increase in production and sales (13% and 12% year-on-year in gold equivalent terms, respectively), as well as a significant increase in purchases of third-party ore and concentrate at Varvara and Amursk.
Compared to 2016, the cost of services and the cost of consumables and spare parts increased by 33% and 21%, respectively, driven by the higher gold equivalent production coupled with a stronger Russian Rouble.
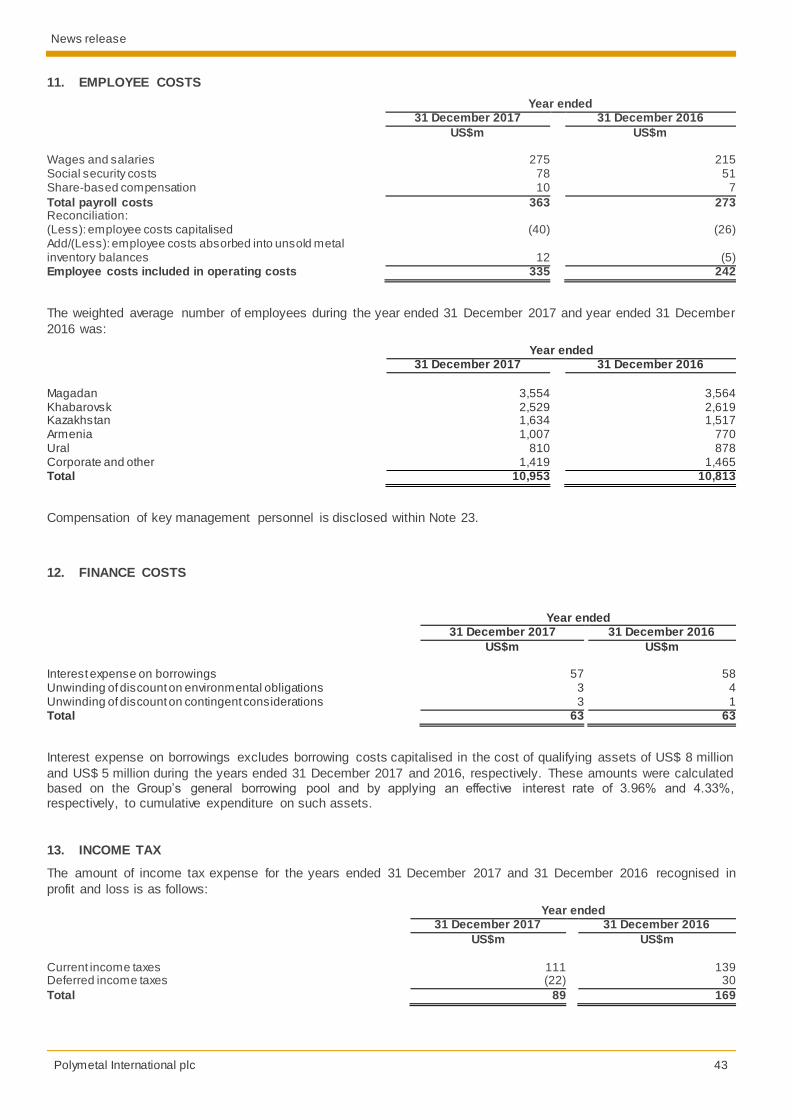
The total cost of labour within cash operating costs in 2017 was US$ 183 million, a 24% increase over 2016, mainly
stemming from additional labour costs at the new Kapan, Komar and Svetloye operations and annual salary increases (tracking domestic CPI inflation).
Mining tax increased by 7% year-on-year to US$ 88 million as production increased by 13%, and was mainly driven
by regional tax incentives introduced in the Russian Far East and utilised at Dukat, Omolon and Svetloye.
Depreciation and depletion was US$ 193 million, up 19% year-on-year and largely driven by the negative effect of a stronger Russian Rouble and a specific increase attributable to Varvara where depreciation of mineral rights for the
new Komar asset has started.
In 2017, a net metal inventory increase of US$ 26 million was recorded (excluding write-downs to net realisable value) mainly represented by gold and silver concentrate produced but not yet sold at Dukat and Albazino. In the second half
of the year, the Company successfully completed scheduled stockpile reductions, with total gold equivalent sales exceeding production by 42 Koz. De-stockpiling was mainly driven by concentrate shipments from Mayskoye and seasonal destockpiling at Svetloye.
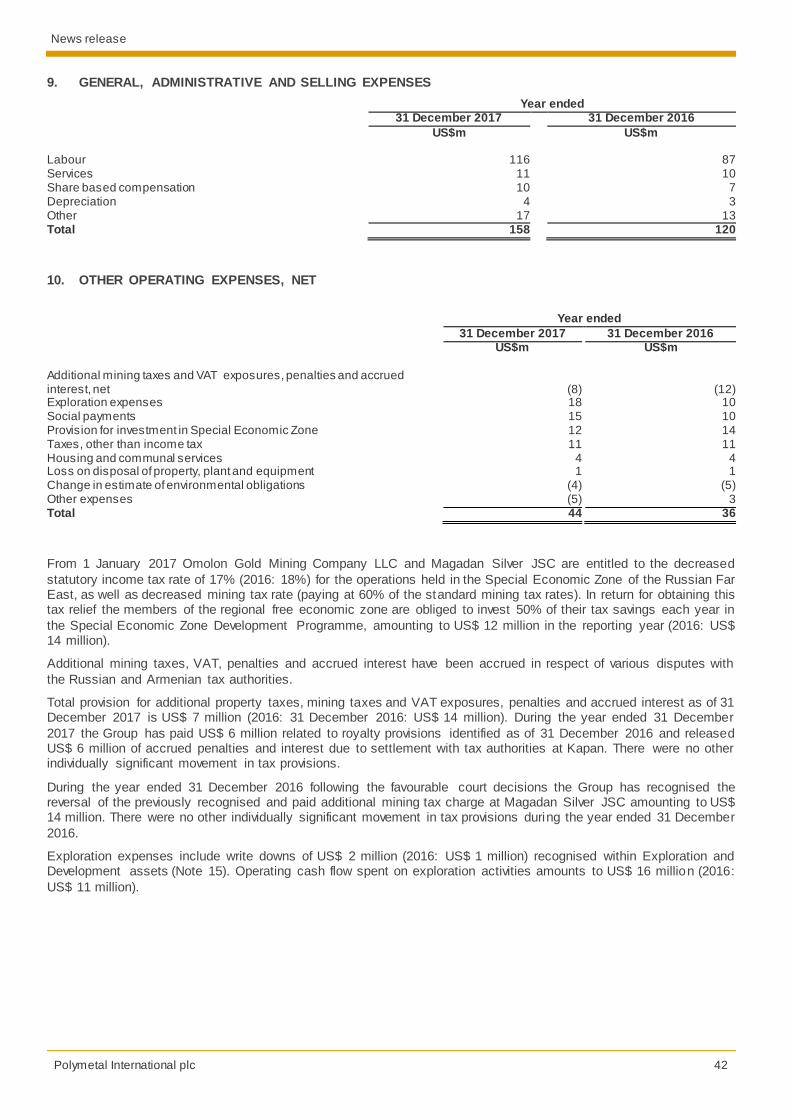
GENERAL, ADMINISTRATIVE AND SELLING EXPENSES
(US$m) 2017 2016 Change, %
Labour 116 87 +33%
Services 11 10 +10%
Share based compensation 10 7 +43%
Depreciation 4 3 +33%
Other 17 13 +31%
Total 158 120 +32%
General, administrative and selling expenses increased by 32% year-on-year from US$ 120 million to US$ 158 million on the back of Russian Rouble appreciation against 2016, as well as increased labour costs due to newly acquired operations, increased personnel at stand-alone exploration projects and regular salary reviews.
OTHER OPERATING EXPENSES
(US$m) 2017 2016 Change, %
Exploration expenses 18 10 +80%
Social payments 15 10 +50%
Provision for investment in Special economic zone 12 14 -14%
Taxes, other than income tax 11 11 -
Housing and communal services 4 4 -
Loss on disposal of property, plant and equipment 1 1 -
Change in estimate of environmental obligations (4) (5) -20% Additional mining taxes and VAT exposures, penalties and accrued interest, net (8) (12) -33%
Polymetal International plc 17
Other expenses (5) 3 NM1
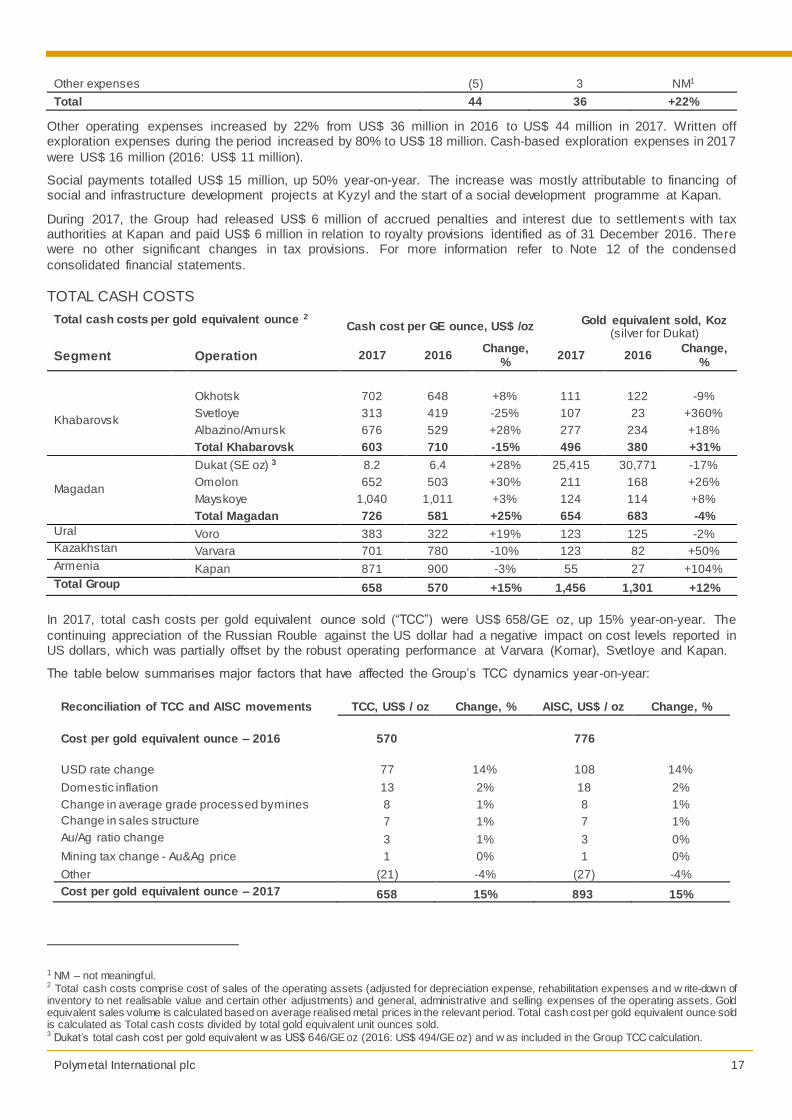
Total 44 36 +22%
Other operating expenses increased by 22% from US$ 36 million in 2016 to US$ 44 million in 2017. Written off exploration expenses during the period increased by 80% to US$ 18 million. Cash-based exploration expenses in 2017
were US$ 16 million (2016: US$ 11 million).
Social payments totalled US$ 15 million, up 50% year-on-year. The increase was mostly attributable to financing of social and infrastructure development projects at Kyzyl and the start of a social development programme at Kapan.
During 2017, the Group had released US$ 6 million of accrued penalties and interest due to settlements with tax authorities at Kapan and paid US$ 6 million in relation to royalty provisions identified as of 31 December 2016. There were no other significant changes in tax provisions. For more information refer to Note 12 of the condensed
In 2017, total cash costs per gold equivalent ounce sold (“TCC”) were US$ 658/GE oz, up 15% year-on-year. The
continuing appreciation of the Russian Rouble against the US dollar had a negative impact on cost levels reported in US dollars, which was partially offset by the robust operating performance at Varvara (Komar), Svetloye and Kapan.
The table below summarises major factors that have affected the Group’s TCC dynamics year-on-year:
Reconciliation of TCC and AISC movements TCC, US$ / oz Change, % AISC, US$ / oz Change, %
Cost per gold equivalent ounce – 2016 570 776
USD rate change 77 14% 108 14%
Domestic inflation 13 2% 18 2%
Change in average grade processed by mines 8 1% 8 1%
1 NM – not meaningful. 2 Total cash costs comprise cost of sales of the operating assets (adjusted for depreciation expense, rehabilitation expenses and w rite-down of inventory to net realisable value and certain other adjustments) and general, administrative and selling expenses of the operating assets. Gold equivalent sales volume is calculated based on average realised metal prices in the relevant period. Total cash cost per gold equivalent ounce sold is calculated as Total cash costs divided by total gold equivalent unit ounces sold. 3 Dukat’s total cash cost per gold equivalent w as US$ 646/GE oz (2016: US$ 494/GE oz) and w as included in the Group TCC calculation.
Polymetal International plc 18
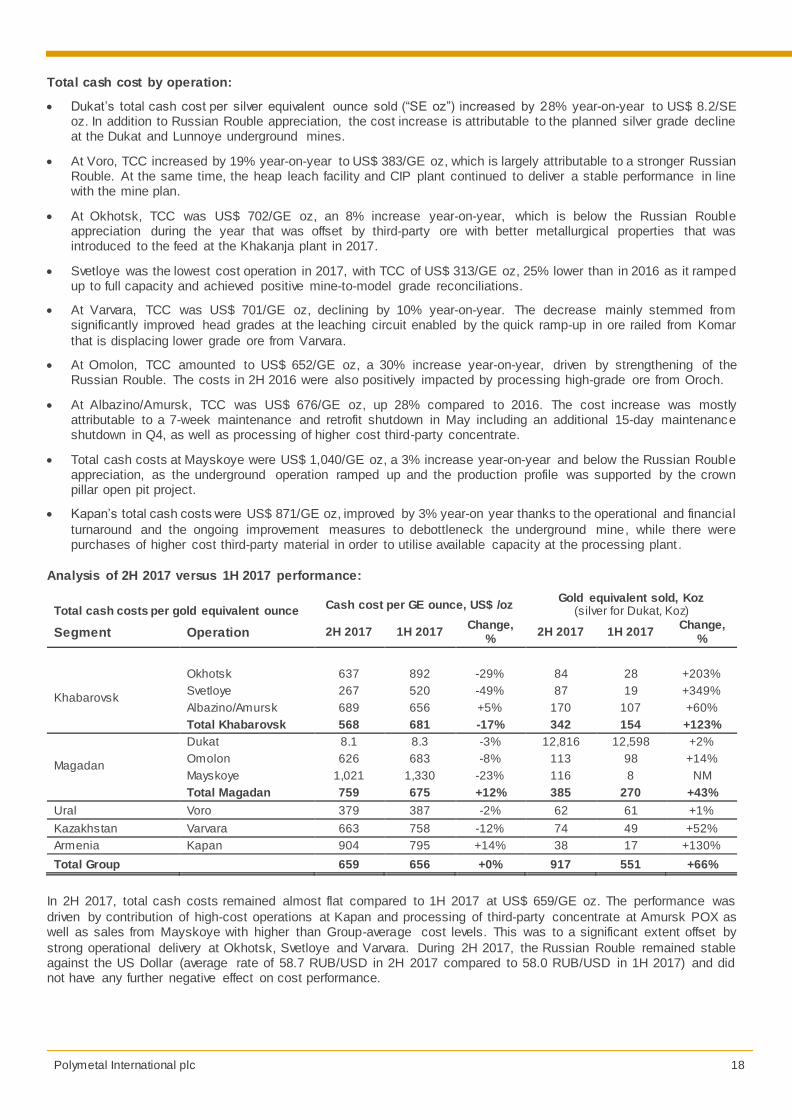
Total cash cost by operation:
Dukat’s total cash cost per silver equivalent ounce sold (“SE oz”) increased by 28% year-on-year to US$ 8.2/SE oz. In addition to Russian Rouble appreciation, the cost increase is attributable to the planned silver grade decline at the Dukat and Lunnoye underground mines.
At Voro, TCC increased by 19% year-on-year to US$ 383/GE oz, which is largely attributable to a stronger Russian Rouble. At the same time, the heap leach facility and CIP plant continued to deliver a stable performance in line with the mine plan.
At Okhotsk, TCC was US$ 702/GE oz, an 8% increase year-on-year, which is below the Russian Rouble appreciation during the year that was offset by third-party ore with better metallurgical properties that was introduced to the feed at the Khakanja plant in 2017.
Svetloye was the lowest cost operation in 2017, with TCC of US$ 313/GE oz, 25% lower than in 2016 as it ramped up to full capacity and achieved positive mine-to-model grade reconciliations.
At Varvara, TCC was US$ 701/GE oz, declining by 10% year-on-year. The decrease mainly stemmed from significantly improved head grades at the leaching circuit enabled by the quick ramp-up in ore railed from Komar
that is displacing lower grade ore from Varvara.
At Omolon, TCC amounted to US$ 652/GE oz, a 30% increase year-on-year, driven by strengthening of the Russian Rouble. The costs in 2H 2016 were also positively impacted by processing high-grade ore from Oroch.
At Albazino/Amursk, TCC was US$ 676/GE oz, up 28% compared to 2016. The cost increase was mostly attributable to a 7-week maintenance and retrofit shutdown in May including an additional 15-day maintenance shutdown in Q4, as well as processing of higher cost third-party concentrate.
Total cash costs at Mayskoye were US$ 1,040/GE oz, a 3% increase year-on-year and below the Russian Rouble appreciation, as the underground operation ramped up and the production profile was supported by the crown pillar open pit project.
Kapan’s total cash costs were US$ 871/GE oz, improved by 3% year-on year thanks to the operational and financial
turnaround and the ongoing improvement measures to debottleneck the underground mine, while there were purchases of higher cost third-party material in order to utilise available capacity at the processing plant .
Analysis of 2H 2017 versus 1H 2017 performance:
Total cash costs per gold equivalent ounce Cash cost per GE ounce, US$ /oz
Gold equivalent sold, Koz (silver for Dukat, Koz)
Segment Operation 2H 2017 1H 2017 Change,
% 2H 2017 1H 2017
Change, %
Khabarovsk
Okhotsk 637 892 -29% 84 28 +203%
Svetloye 267 520 -49% 87 19 +349%
Albazino/Amursk 689 656 +5% 170 107 +60%
Total Khabarovsk 568 681 -17% 342 154 +123%
Magadan
Dukat 8.1 8.3 -3% 12,816 12,598 +2%
Omolon 626 683 -8% 113 98 +14%
Mayskoye 1,021 1,330 -23% 116 8 NM
Total Magadan 759 675 +12% 385 270 +43%
Ural Voro 379 387 -2% 62 61 +1%
Kazakhstan Varvara 663 758 -12% 74 49 +52%
Armenia Kapan 904 795 +14% 38 17 +130%
Total Group 659 656 +0% 917 551 +66%
In 2H 2017, total cash costs remained almost flat compared to 1H 2017 at US$ 659/GE oz. The performance was
driven by contribution of high-cost operations at Kapan and processing of third-party concentrate at Amursk POX as well as sales from Mayskoye with higher than Group-average cost levels. This was to a significant extent offset by
strong operational delivery at Okhotsk, Svetloye and Varvara. During 2H 2017, the Russian Rouble remained stable against the US Dollar (average rate of 58.7 RUB/USD in 2H 2017 compared to 58.0 RUB/USD in 1H 2017) and did not have any further negative effect on cost performance.
Polymetal International plc 19
Total cash cost by operation:
At Dukat and Voro, total cash costs remained almost unchanged half-on-half on the back of stable operating performances during the period.
At Okhotsk, TCC was US$ 637/GE oz and decreased by 29% half-on-half as the seasonally higher share of
Avlayakan ore was shipped to Okhotsk and processed in the second half of the year.
Svetloye heap leach operation enjoyed positive mine-to-model grade reconciliation resulting in a notable decrease of TCC by 49% half-on-half to US$ 267/GE oz.
Varvara experienced positive input of processing high-grade ore railed from Komar, resulting in TCC of US$ 663/GE oz, a 12% decrease half-on-half.
At Omolon, cash costs decreased by 8% compared to 1H 2017 to US$ 626/GE oz on the back of improved gold grades and recovery levels at the Kubaka processing plant as the share of higher-grade ore from the Tsokol and
Birkachan underground mines increased.
At Albazino/Amursk, TCC was US$ 689/ GE oz, up 5% half-on-half due to larger volumes of high-cost third-party concentrate processed at Amursk POX during 2H 2017.
There were no meaningful sales at Mayskoye during 1H 2017, hence the total cash costs for the period are considered unrepresentative of the underlying performance. TCC for 2H 2017 comprised US$ 1,021/GE oz.
Decline of gold and silver grades and lower recoveries at Kapan due to purchases of third-party material resulted in TCC increasing by 14% to US$ 904/GE oz half-on-half. These purchases, however, allowed the project to utilise
available capacity at the processing plant and increase total production and profits .
ALL-IN CASH COSTS
Total, US$m US$ /GE oz
2017 2016 Change, % 2017 2016 Change, %
Total cash costs 955 738 +29% 658 570 +15%
SG&A and other operating expenses not included in TCC 112 98 +14% 77 76 +2% Capital expenditure excluding new projects 141 120 +18% 97 93 +5% Exploration expenditure (capital and current) 87 47 +85% 60 36 +65%
Development capital 170 121 +40% 117 94 +25% SG&A and other expenses for development assets 20 14 +43% 14 11 +27%
All-in costs 1,645 1,376 +20% 1,134 1,063 +7%
All-in sustaining cash costs amounted to US$ 893/GE oz in 2017 and increased by 15% year-on-year, driven mostly by the increase in total cash costs as a result of continued Russian Rouble strengthening, as well as increased exploration spending across the portfolio.
All-in sustaining cash costs by mines were represented as follows:
1 All-in sustaining cash costs comprise total cash costs, all selling, general and administrative expenses for operating mines and head off ice not
included in TCC (mainly represented by head off ice SG&A), other expenses (excluding write-offs and non-cash items, in line w ith the methodology used for calculation of Adjusted EBITDA), and current period capex for operating mines (i.e. excluding new project capex (“Development capital”),
but including all exploration expenditure (both expensed and capitalised in the period) and minor brow nfield expansions).
Polymetal International plc 20
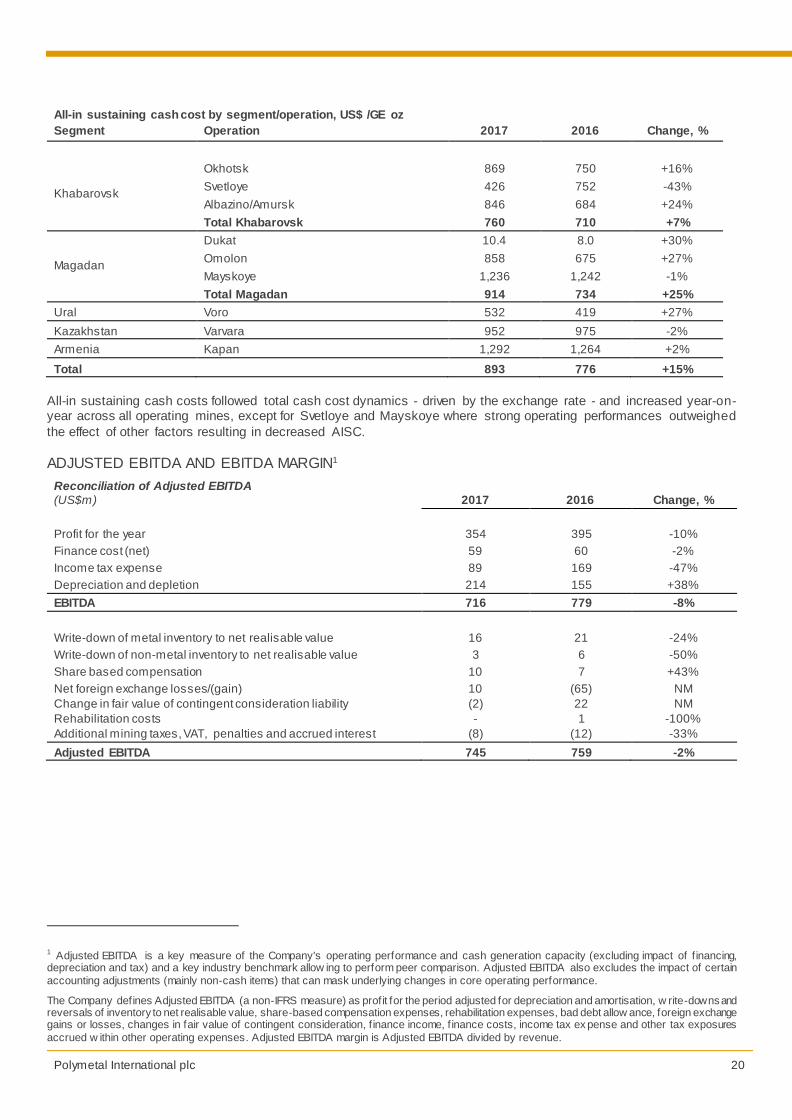
All-in sustaining cash cost by segment/operation, US$ /GE oz Segment Operation 2017 2016 Change, %
Khabarovsk
Okhotsk 869 750 +16%
Svetloye 426 752 -43%
Albazino/Amursk 846 684 +24%
Total Khabarovsk 760 710 +7%
Magadan
Dukat 10.4 8.0 +30%
Omolon 858 675 +27%
Mayskoye 1,236 1,242 -1%
Total Magadan 914 734 +25%
Ural Voro 532 419 +27%
Kazakhstan Varvara 952 975 -2%
Armenia Kapan 1,292 1,264 +2%
Total 893 776 +15%
All-in sustaining cash costs followed total cash cost dynamics - driven by the exchange rate - and increased year-on-year across all operating mines, except for Svetloye and Mayskoye where strong operating performances outweighed
the effect of other factors resulting in decreased AISC.
ADJUSTED EBITDA AND EBITDA MARGIN1
Reconciliation of Adjusted EBITDA (US$m) 2017 2016 Change, %
Profit for the year 354 395 -10%
Finance cost (net) 59 60 -2%
Income tax expense 89 169 -47%
Depreciation and depletion 214 155 +38%
EBITDA 716 779 -8%
Write-down of metal inventory to net realisable value 16 21 -24%
Write-down of non-metal inventory to net realisable value 3 6 -50%
Share based compensation 10 7 +43%
Net foreign exchange losses/(gain) 10 (65) NM
Change in fair value of contingent consideration liability (2) 22 NM
1 Adjusted EBITDA is a key measure of the Company's operating performance and cash generation capacity (excluding impact of f inancing, depreciation and tax) and a key industry benchmark allow ing to perform peer comparison. Adjusted EBITDA also excludes the impact of certain
accounting adjustments (mainly non-cash items) that can mask underlying changes in core operating performance.
The Company defines Adjusted EBITDA (a non-IFRS measure) as profit for the period adjusted for depreciation and amortisation, w rite-downs and reversals of inventory to net realisable value, share-based compensation expenses, rehabilitation expenses, bad debt allow ance, foreign exchange gains or losses, changes in fair value of contingent consideration, f inance income, f inance costs, income tax ex pense and other tax exposures
accrued w ithin other operating expenses. Adjusted EBITDA margin is Adjusted EBITDA divided by revenue.
Polymetal International plc 21
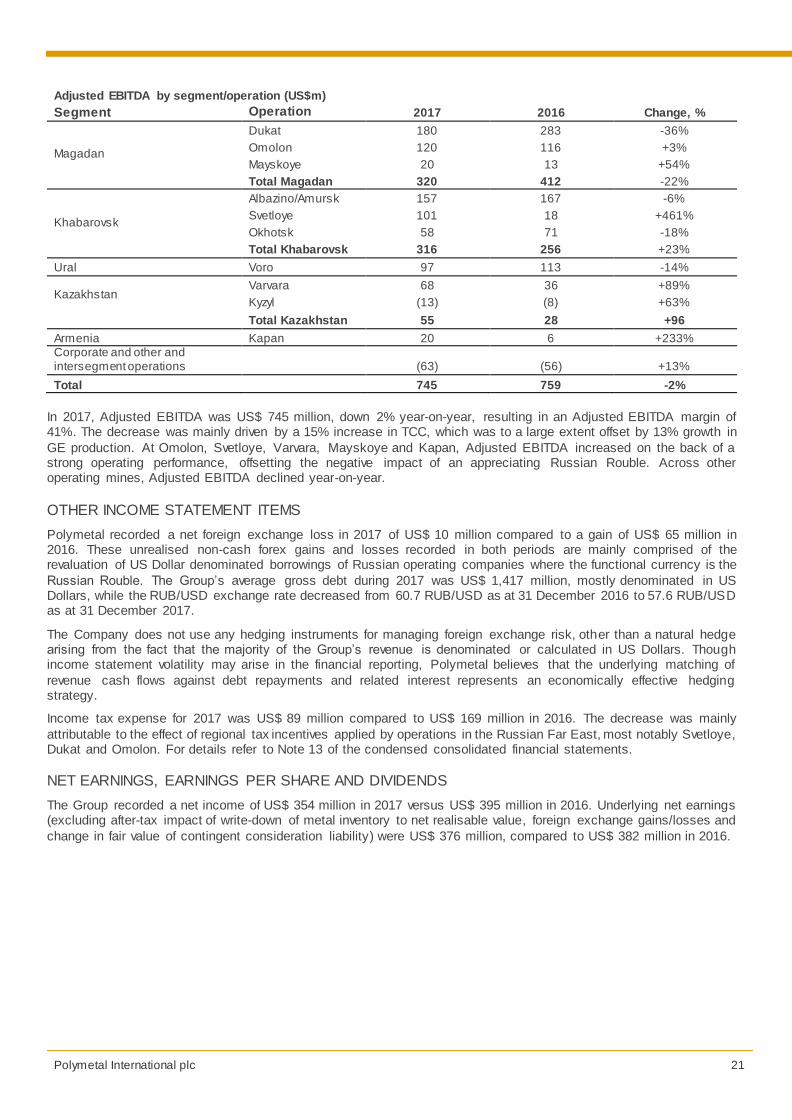
Adjusted EBITDA by segment/operation (US$m)
Segment Operation 2017 2016 Change, %
Magadan
Dukat 180 283 -36%
Omolon 120 116 +3%
Mayskoye 20 13 +54%
Total Magadan 320 412 -22%
Khabarovsk
Albazino/Amursk 157 167 -6%
Svetloye 101 18 +461%
Okhotsk 58 71 -18%
Total Khabarovsk 316 256 +23%
Ural Voro 97 113 -14%
Kazakhstan
Varvara 68 36 +89%
Kyzyl (13) (8) +63%
Total Kazakhstan 55 28 +96
Armenia Kapan 20 6 +233% Corporate and other and intersegment operations (63) (56) +13%
Total 745 759 -2%
In 2017, Adjusted EBITDA was US$ 745 million, down 2% year-on-year, resulting in an Adjusted EBITDA margin of 41%. The decrease was mainly driven by a 15% increase in TCC, which was to a large extent offset by 13% growth in
GE production. At Omolon, Svetloye, Varvara, Mayskoye and Kapan, Adjusted EBITDA increased on the back of a strong operating performance, offsetting the negative impact of an appreciating Russian Rouble. Across other operating mines, Adjusted EBITDA declined year-on-year.
OTHER INCOME STATEMENT ITEMS
Polymetal recorded a net foreign exchange loss in 2017 of US$ 10 million compared to a gain of US$ 65 million in 2016. These unrealised non-cash forex gains and losses recorded in both periods are mainly comprised of the revaluation of US Dollar denominated borrowings of Russian operating companies where the functional currency is the
Russian Rouble. The Group’s average gross debt during 2017 was US$ 1,417 million, mostly denominated in US Dollars, while the RUB/USD exchange rate decreased from 60.7 RUB/USD as at 31 December 2016 to 57.6 RUB/USD as at 31 December 2017.
The Company does not use any hedging instruments for managing foreign exchange risk, other than a natural hedge arising from the fact that the majority of the Group’s revenue is denominated or calculated in US Dollars. Though income statement volatility may arise in the financial reporting, Polymetal believes that the underlying matching of
revenue cash flows against debt repayments and related interest represents an economically effective hedging strategy.
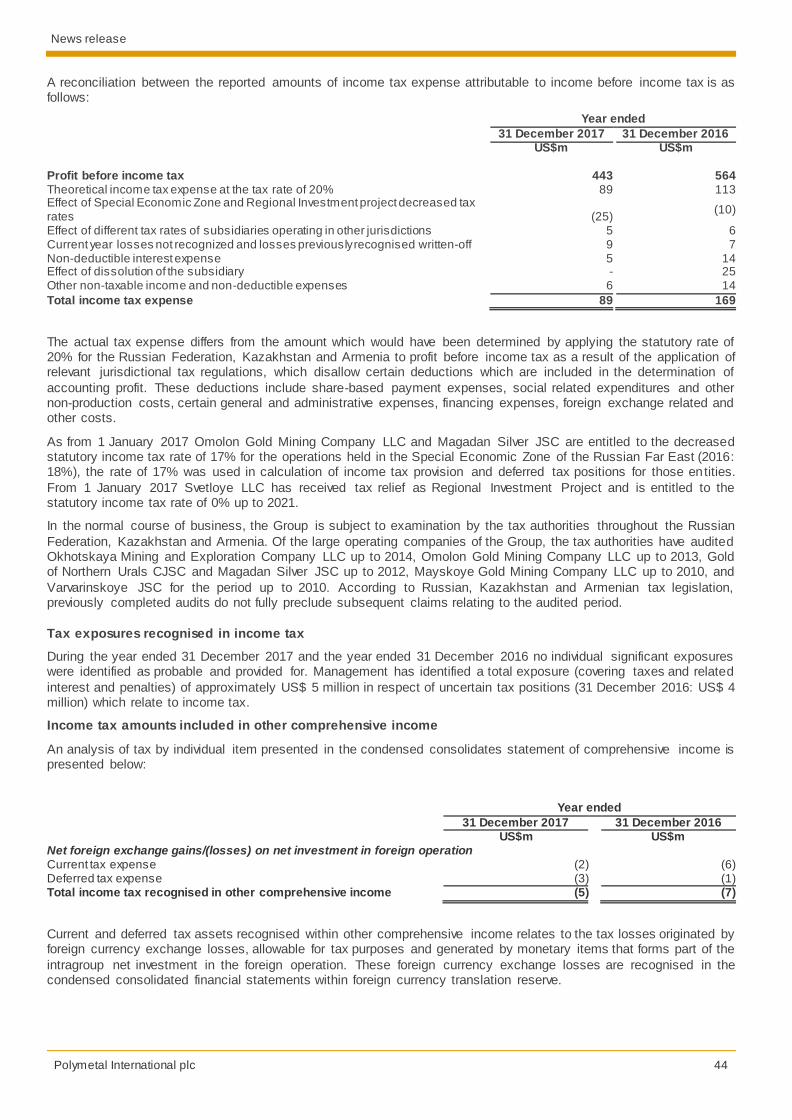
Income tax expense for 2017 was US$ 89 million compared to US$ 169 million in 2016. The decrease was mainly
attributable to the effect of regional tax incentives applied by operations in the Russian Far East, most notably Svetloye, Dukat and Omolon. For details refer to Note 13 of the condensed consolidated financial statements.
NET EARNINGS, EARNINGS PER SHARE AND DIVIDENDS
The Group recorded a net income of US$ 354 million in 2017 versus US$ 395 million in 2016. Underlying net earnings (excluding after-tax impact of write-down of metal inventory to net realisable value, foreign exchange gains/losses and
change in fair value of contingent consideration liability) were US$ 376 million, compared to US$ 382 million in 2016.
Polymetal International plc 22
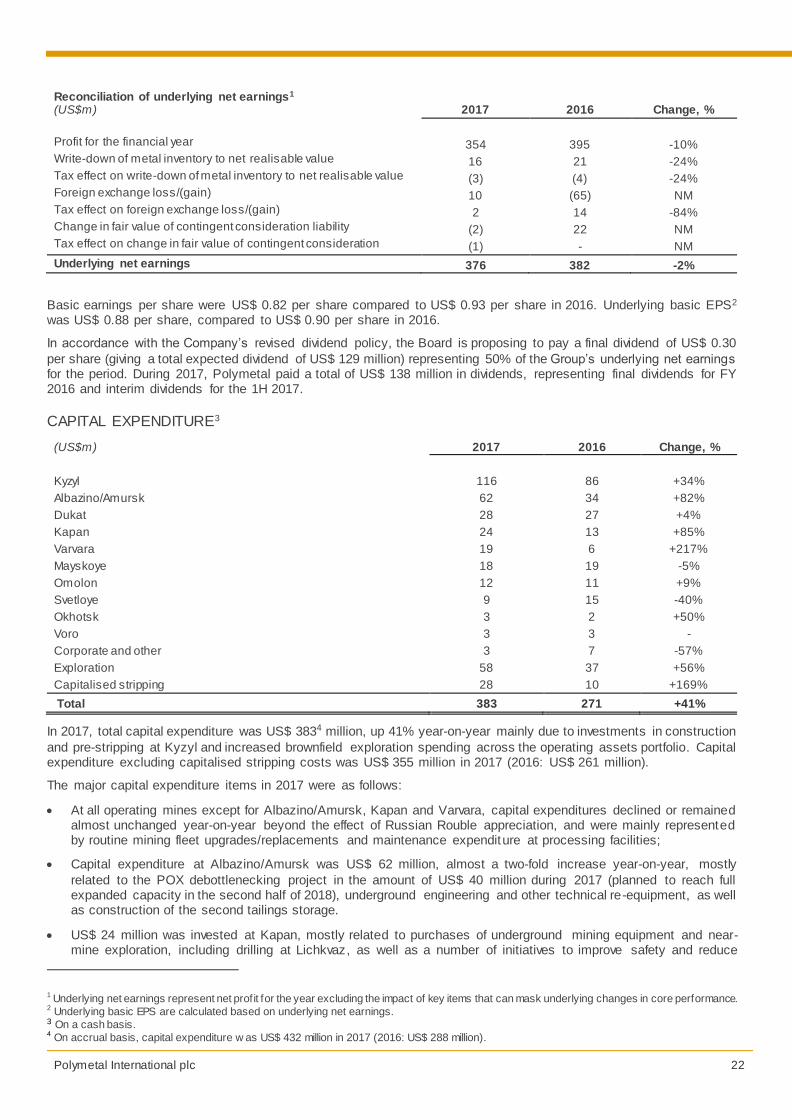
Reconciliation of underlying net earnings1 (US$m) 2017 2016 Change, %
Profit for the financial year 354 395 -10% Write-down of metal inventory to net realisable value 16 21 -24% Tax effect on write-down of metal inventory to net realisable value (3) (4) -24% Foreign exchange loss/(gain) 10 (65) NM Tax effect on foreign exchange loss/(gain) 2 14 -84% Change in fair value of contingent consideration liability (2) 22 NM Tax effect on change in fair value of contingent consideration (1) - NM
Underlying net earnings 376 382 -2%
Basic earnings per share were US$ 0.82 per share compared to US$ 0.93 per share in 2016. Underlying basic EPS2 was US$ 0.88 per share, compared to US$ 0.90 per share in 2016.
In accordance with the Company’s revised dividend policy, the Board is proposing to pay a final dividend of US$ 0.30
per share (giving a total expected dividend of US$ 129 million) representing 50% of the Group’s underlying net earnings for the period. During 2017, Polymetal paid a total of US$ 138 million in dividends, representing final dividends for FY 2016 and interim dividends for the 1H 2017.
CAPITAL EXPENDITURE3
(US$m) 2017 2016 Change, %
Kyzyl 116 86 +34%
Albazino/Amursk 62 34 +82%
Dukat 28 27 +4%
Kapan 24 13 +85%
Varvara 19 6 +217%
Mayskoye 18 19 -5%
Omolon 12 11 +9%
Svetloye 9 15 -40%
Okhotsk 3 2 +50%
Voro 3 3 -
Corporate and other 3 7 -57%
Exploration 58 37 +56%
Capitalised stripping 28 10 +169%
Total 383 271 +41%
In 2017, total capital expenditure was US$ 3834 million, up 41% year-on-year mainly due to investments in construction
and pre-stripping at Kyzyl and increased brownfield exploration spending across the operating assets portfolio. Capital expenditure excluding capitalised stripping costs was US$ 355 million in 2017 (2016: US$ 261 million).
The major capital expenditure items in 2017 were as follows:
At all operating mines except for Albazino/Amursk, Kapan and Varvara, capital expenditures declined or remained almost unchanged year-on-year beyond the effect of Russian Rouble appreciation, and were mainly represented by routine mining fleet upgrades/replacements and maintenance expenditure at processing facilities;
Capital expenditure at Albazino/Amursk was US$ 62 million, almost a two-fold increase year-on-year, mostly
related to the POX debottlenecking project in the amount of US$ 40 million during 2017 (planned to reach full expanded capacity in the second half of 2018), underground engineering and other technical re-equipment, as well as construction of the second tailings storage.
US$ 24 million was invested at Kapan, mostly related to purchases of underground mining equipment and near-mine exploration, including drilling at Lichkvaz, as well as a number of initiatives to improve safety and reduce
1 Underlying net earnings represent net profit for the year excluding the impact of key items that can mask underlying changes in core performance. 2 Underlying basic EPS are calculated based on underlying net earnings. 3 On a cash basis. 4 On accrual basis, capital expenditure w as US$ 432 million in 2017 (2016: US$ 288 million).
Polymetal International plc 23
environmental footprint of operations (centralized mine ventilation, tailings storage facility upgrade, water treatment and recycling facilities).
At Varvara, the increased capital expenditure is mainly related to debottlenecking of the railway station for cargo acceptance and purchases of railway carriages to allow transportation of larger volumes of ores from Komar and
third parties, technical re-equipment and reconstruction of the tailing storage.
At Kyzyl, capital expenditure in 2017 comprised US$ 116 million, mainly representing the main concentrator building, ore-preparation complex (the crusher, conveyor gallery and apron feeder), tailings storage facility, electric
shovels, mechanical and repair shop and purchases of mining machinery, as well as capitalised pre-stripping of US$ 31 million.
The Company invests in standalone exploration projects. Capital expenditures for exploration in 2017 was US$ 58
million compared to US$ 37 million in 2016.
Capitalised stripping costs totalled US$ 28 million in 2017 (2016: US$ 10 million) and are attributable to operations with stripping ratios exceeding their life of mine (“LOM”) averages during the period, including most importantly
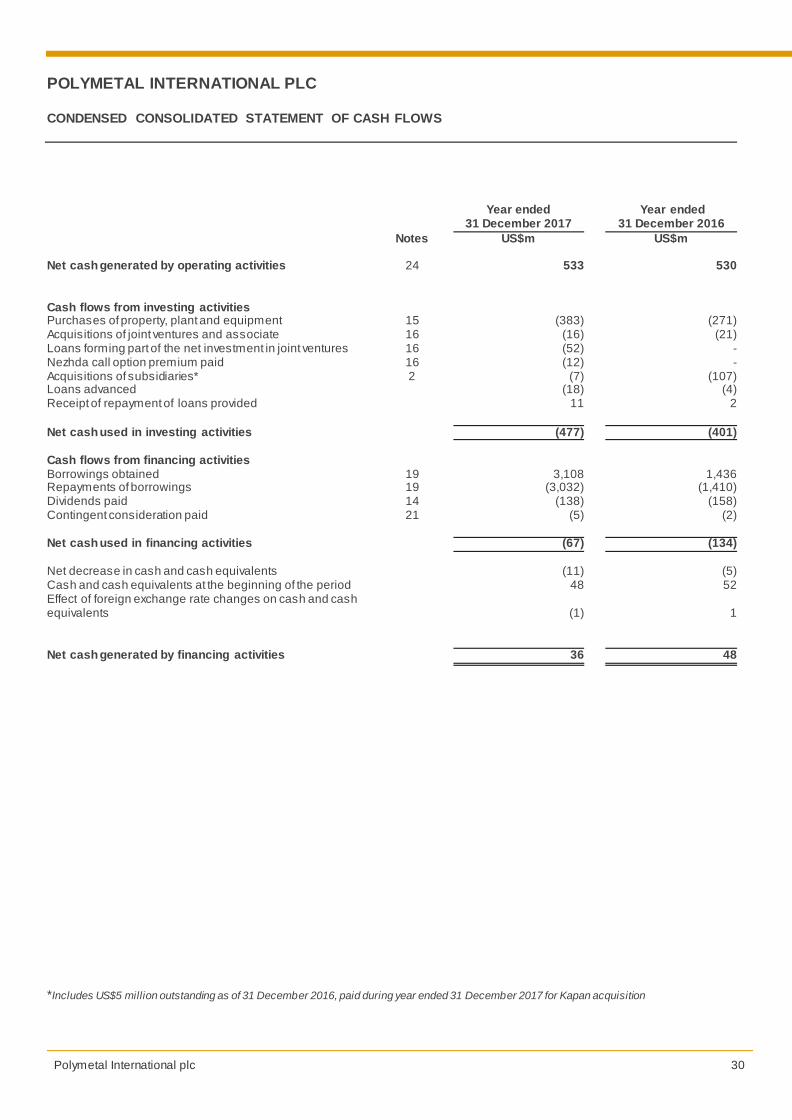
Operating cash flows before changes in working capital 601 557 +8%
Changes in working capital (68) (27) +152%
Total operating cash flows 533 530 +1%
Capital expenditure (383) (271) +41% Acquisition costs in business combinations and investments in associates and joint ventures (87) (128) -32%
Other (7) (2) +250%
Investing cash flows (477) (401) +19% Financing cash flows Net increase in borrowings 76 26 +192%
Dividends paid (138) (158) -13%
Contingent consideration payment (5) (2) +150%
Total financing cash flows (67) (134) -50%
Net decrease/increase in cash and cash equivalents (11) (5) +120%
Cash and cash equivalents at the beginning of the year 48 52 -8%
Effect of foreign exchange rate changes on cash and cash equivalents (1) 1 NM
Cash and cash equivalents at the end of the year 36 48 -25%
Total operating cash flows in 2017 remained stable compared to the prior year. Operating cash flows before changes in working capital grew by 8% year-on-year to US$ 601 million mainly as a result of a decrease in cash tax payments. Net operating cash flows were US$ 533 million, compared to US$ 530 million in 2016. This was also affected by an
increase in working capital in 2017 of US$ 68 million.
Total cash and cash equivalents decreased by 25% compared to 2016 and comprised US$ 36 million, with the following items affecting the cash position of the Group:
Operating cash flows of US$ 533 million;
Investment cash outflows totalled US$ 477 million, up 19% year-on-year and mainly represented by capital expenditure (up 41% year-on-year to US$ 383 million), cash investments in new assets (namely, Nezhda US$ 20
million, Prognoz US$ 5 million, Kapan US$ 5 million) and loans advanced on capital expenditure at growth projects (Nezhda and Prognoz totalling US$ 52 million);
Payment of regular dividends for 2016 and 1H 2017 amounting to US$ 138 million; and
Polymetal International plc 24
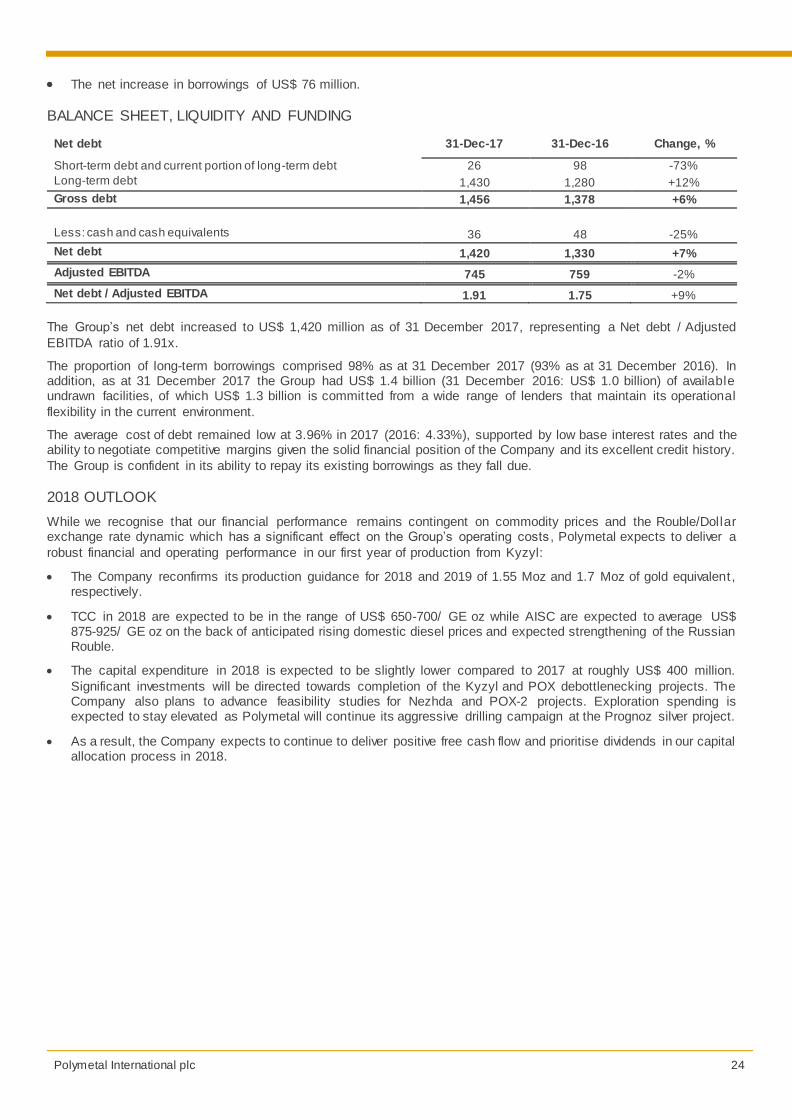
The net increase in borrowings of US$ 76 million.
BALANCE SHEET, LIQUIDITY AND FUNDING
Net debt 31-Dec-17 31-Dec-16 Change, % Short-term debt and current portion of long-term debt 26 98 -73%
Long-term debt 1,430 1,280 +12%
Gross debt 1,456 1,378 +6%
Less: cash and cash equivalents 36 48 -25%
Net debt 1,420 1,330 +7%
Adjusted EBITDA 745 759 -2%
Net debt / Adjusted EBITDA 1.91 1.75 +9%
The Group’s net debt increased to US$ 1,420 million as of 31 December 2017, representing a Net debt / Adjusted
EBITDA ratio of 1.91x.
The proportion of long-term borrowings comprised 98% as at 31 December 2017 (93% as at 31 December 2016). In addition, as at 31 December 2017 the Group had US$ 1.4 billion (31 December 2016: US$ 1.0 billion) of available undrawn facilities, of which US$ 1.3 billion is committed from a wide range of lenders that maintain its operational
flexibility in the current environment.
The average cost of debt remained low at 3.96% in 2017 (2016: 4.33%), supported by low base interest rates and the ability to negotiate competitive margins given the solid financial position of the Company and its excellent credit history.
The Group is confident in its ability to repay its existing borrowings as they fall due.
2018 OUTLOOK
While we recognise that our financial performance remains contingent on commodity prices and the Rouble/Dollar exchange rate dynamic which has a significant effect on the Group’s operating costs , Polymetal expects to deliver a
robust financial and operating performance in our first year of production from Kyzyl:
The Company reconfirms its production guidance for 2018 and 2019 of 1.55 Moz and 1.7 Moz of gold equivalent , respectively.
TCC in 2018 are expected to be in the range of US$ 650-700/ GE oz while AISC are expected to average US$ 875-925/ GE oz on the back of anticipated rising domestic diesel prices and expected strengthening of the Russian Rouble.
The capital expenditure in 2018 is expected to be slightly lower compared to 2017 at roughly US$ 400 million.
Significant investments will be directed towards completion of the Kyzyl and POX debottlenecking projects. The Company also plans to advance feasibility studies for Nezhda and POX-2 projects. Exploration spending is expected to stay elevated as Polymetal will continue its aggressive drilling campaign at the Prognoz silver project.
As a result, the Company expects to continue to deliver positive free cash flow and prioritise dividends in our capital allocation process in 2018.
Polymetal International plc 25
PRINCIPAL RISKS AND UNCERTAINTIES
There are a number of potential risks and uncertainties which could have a material impact on the Group’s performance and could cause actual results to differ materially from expected and historical results.
The principal risks and uncertainties of the Group are listed below:
Market risk;
Production risks;
Construction and development risk;
Tax risks;
Exploration risks;
Health and safety risk;
Environmental risks;
Legal risk;
Political risk;
Currency risk;
Liquidity risk;
Interest rate risk.
A detailed explanation of these risks and uncertainties can be found on pages 66 to 69 of the 2016 annual report which
is available at www.polymetalinternational.com. Further updates will be presented in the full annual financial report for 2017.
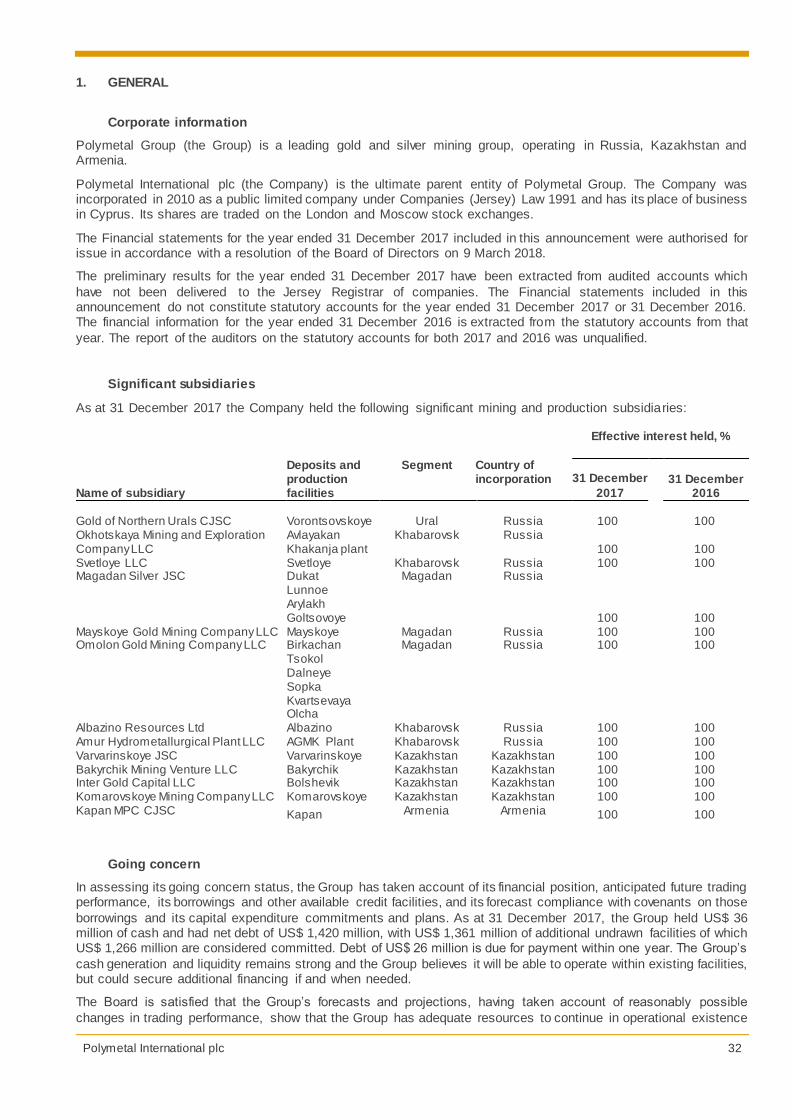
GOING CONCERN
In assessing its going concern status, the Group has taken account of its financial position, anticipated future trading
performance, its borrowings and other available credit facilities, and its forecast compliance with covenants on those borrowings and its capital expenditure commitments and plans. As at 31 December 2017, the Group held US$ 36 million of cash and had net debt of US$ 1,420 million, with US$ 1,361 million of additional undrawn facilities of which
US$ 1,266 million are considered committed. Debt of US$ 26 million is due for payment within one year. The Group’s cash generation and liquidity remains strong and the Group believes it will be able to operate within existing facilities, but could secure additional financing if and when needed.
The Board is satisfied that the Group’s forecasts and projections, having taken account of reasonably possible changes in trading performance, show that the Group has adequate resources to continue in operational existence for at least the next 12 months from the date of this report and that it is appropriate to adopt the going concern basis in preparing
the condensed consolidated financial statements for the year ended 31 December 2017.
The Directors are responsible for preparing the annual report and financial statements in accordance with applicable law and regulations.
Company law requires the Directors to prepare financial statements for each financial year. Under that law the Directors
are required to prepare the Group financial statements in accordance with International Financial Reporting Standards as adopted for use in the European Union (IFRS). The financial statements are required by law to be properly prepared in accordance with the Companies (Jersey) Law 1991. International Accounting Standard 1 requires that financial
statements present fairly for each financial year the Group’s financial position, financial performance and cash flows. This requires the faithful representation of the effects of transactions, other events and conditions in accordance with the definitions and recognition criteria for assets, liabilities, income and expenses set out in the International Accounting
Standards Board’s ‘Framework for the preparation and presentation of financial statements’.
In virtually all circumstances, a fair presentation will be achieved by compliance with all applicable IFRSs. However, the Directors are also required to:
• properly select and apply accounting policies; • present information, including accounting policies, in a manner that provides relevant, reliable, comparable
and understandable information;
• provide additional disclosures when compliance with the specific requirements in IFRSs are insufficient to enable users to understand the impact of particular transactions, other events and conditions on the entity’s financial position and financial performance; and
• make an assessment of the Company’s ability to continue in operation and meet its liabilities as they fall due over the reasonably reliable lookout period of three years.
The Directors are responsible for keeping proper accounting records that disclose with reasonable accuracy at any
time the financial position of the Company and enable them to ensure that the financial statements comply with the Companies (Jersey) Law 1991. They are also responsible for safeguarding the assets of the Company and hence for taking reasonable steps for the prevention and detection of fraud and other irregularities.
The Directors are responsible for the maintenance and integrity of the corporate and financial information included on the Company’s website. Legislation in the UK and Jersey governing the preparation and dissemination of financial statements may differ from legislation in other jurisdictions.
Responsibility statement
We confirm that to the best of our knowledge:
• the financial statements, prepared in accordance with International Financial Reporting Standards, give a true and fair view of the assets, liabilities, financial position and profit or loss of the company and the undertakings
included in the consolidation taken as a whole; and • the management report, which is incorporated into the strategic report, includes a fair review of the
development and performance of the business and the position of the company and the undertakings included
in the consolidation taken as a whole, together with a description of the principal risks and uncertainties that they face.
By order of the Board,
Bobby Godsell
Chairman of the Board of Directors
Vitaly Nesis
Group Chief Executive Officer
9 March 2018
Polymetal International plc 27
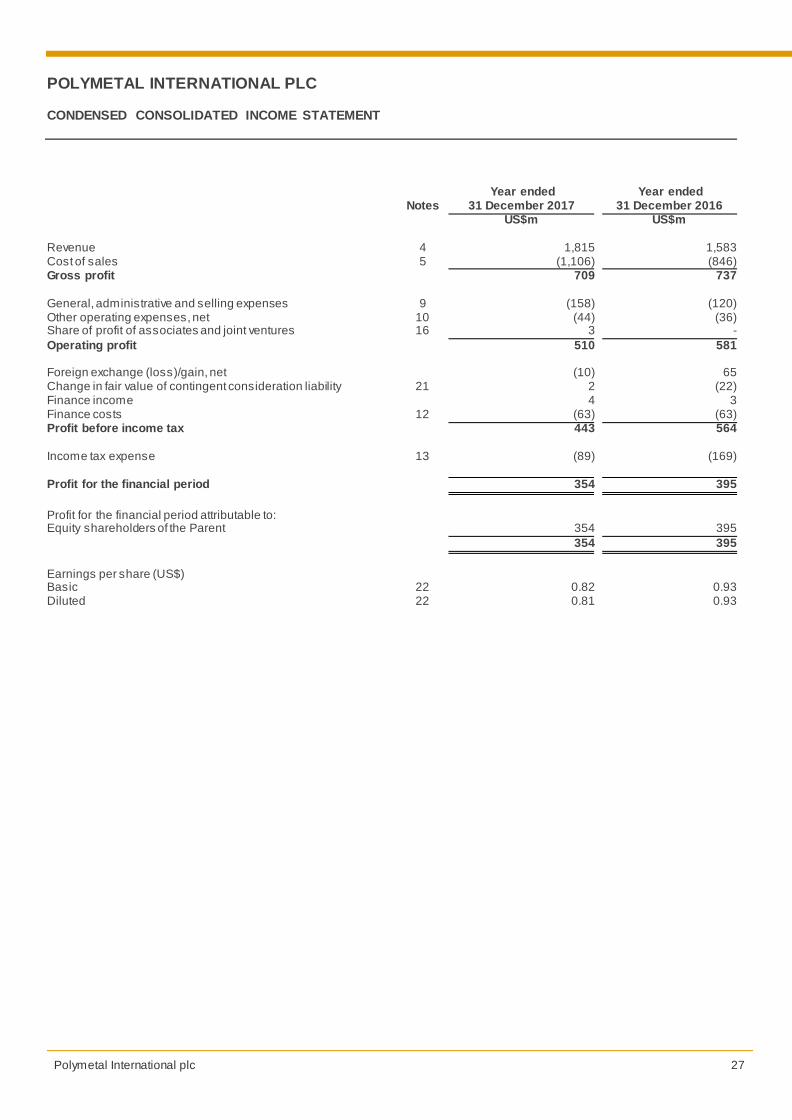
POLYMETAL INTERNATIONAL PLC CONDENSED CONSOLIDATED INCOME STATEMENT
Year ended Year ended Notes 31 December 2017 31 December 2016
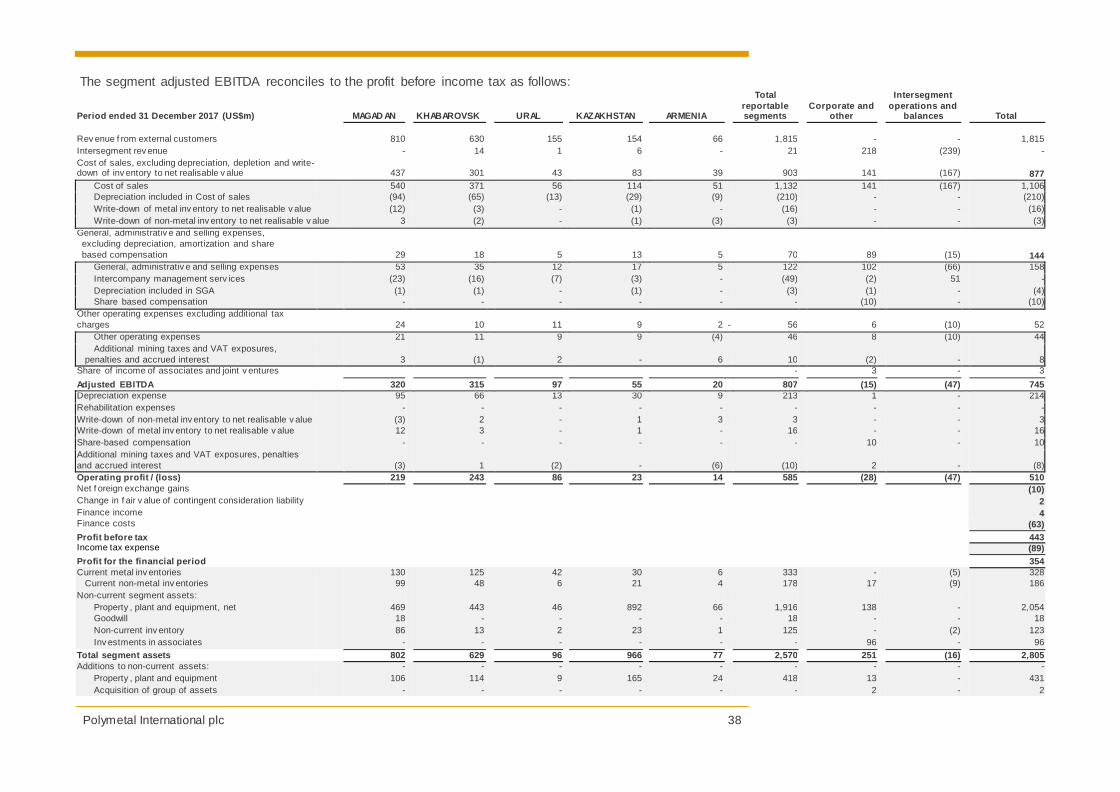
General, administrative and selling expenses 9 (158) (120) Other operating expenses, net 10 (44) (36) Share of profit of associates and joint ventures 16 3 -
Operating profit
510 581
Foreign exchange (loss)/gain, net
(10) 65 Change in fair value of contingent consideration liability 21 2 (22) Finance income
4 3
Finance costs 12 (63) (63) Profit before income tax
443 564
Income tax expense 13 (89) (169)
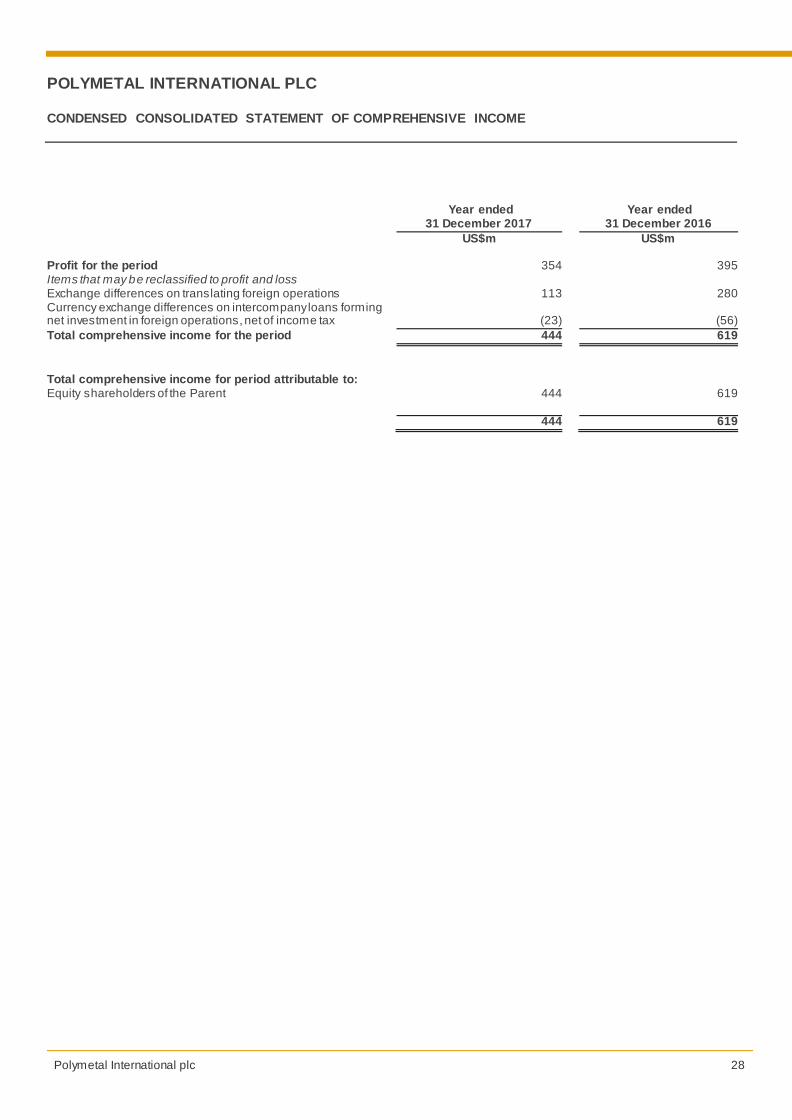
Profit for the financial period
354 395
Profit for the financial period attributable to:
Equity shareholders of the Parent
354 395
354 395
Earnings per share (US$)
Basic 22 0.82 0.93 Diluted 22 0.81 0.93
Polymetal International plc 28
POLYMETAL INTERNATIONAL PLC CONDENSED CONSOLIDATED STATEMENT OF COMPREHENSIVE INCOME
Year ended Year ended 31 December 2017 31 December 2016
US$m US$m Profit for the period 354 395 Items that may be reclassified to profit and loss Exchange differences on translating foreign operations 113 280 Currency exchange differences on intercompany loans forming net investment in foreign operations, net of income tax (23) (56)
Total comprehensive income for the period 444 619
Total comprehensive income for period attributable to: Equity shareholders of the Parent 444 619 444 619
Polymetal International plc 29
POLYMETAL INTERNATIONAL PLC CONDENSED CONSOLIDATED BALANCE SHEET
Notes 31 December 2017 31 December 2016 Assets US$m US$m Property, plant and equipment 15 2,054 1,805 Goodwill 18 17 Investments in associates and joint ventures 16 96 25 Non-current loans and receivables 15 10 Deferred tax asset 13 61 38 Non-current inventories 17 123 113 Total non-current assets 2,367 2,008 Current inventories 17 514 493 VAT receivable 96 61 Trade receivables and other financial instruments 18 71 70 Prepayments to suppliers 38 31 Income tax prepaid 6 18 Cash and cash equivalents 36 48 Total current assets 761 721 Total assets 3,128 2,729
Liabilities and shareholders' equity Accounts payable and accrued liabilities (135) (133) Current borrowings 19 (26) (98) Income tax payable (10) (8) Other taxes payable (38) (34) Current portion of contingent consideration liability 21 (5) (14)
Total current liabilities (214) (287) Non-current borrowings 19 (1,430) (1,280) Contingent consideration liability 21 (57) (62) Deferred tax liability 13 (77) (78) Environmental obligations (39) (37) Other non-current liabilities (4) (4) Total non-current liabilities (1,607) (1,461)
Total liabilities (1,821) (1,748) NET ASSETS 1,307 981
Stated capital account 22 2,031 2,010 Share based compensation reserve 21 12 Translation reserve (1,151) (1,241) Retained earnings 406 200
Total equity 1,307 981
Notes on pages 32 to 57 form part of these financial statements. These financial statements are approved and authorised for issue by the Board of Directors on 9 March 2018 and signed on its behalf by:
Vitaly Nesis
Group Chief Executive
Bobby Godsell
Chairman of the Board of Directors
Polymetal International plc 30
POLYMETAL INTERNATIONAL PLC CONDENSED CONSOLIDATED STATEMENT OF CASH FLOWS
Year ended Year ended
31 December 2017 31 December 2016
Notes US$m US$m Net cash generated by operating activities 24 533 530 Cash flows from investing activities Purchases of property, plant and equipment 15 (383) (271) Acquisitions of joint ventures and associate 16 (16) (21) Loans forming part of the net investment in joint ventures 16 (52) - Nezhda call option premium paid 16 (12) - Acquisitions of subsidiaries* 2 (7) (107) Loans advanced (18) (4) Receipt of repayment of loans provided 11 2
Net cash used in investing activities (477) (401) Cash flows from financing activities Borrowings obtained 19 3,108 1,436 Repayments of borrowings 19 (3,032) (1,410) Dividends paid 14 (138) (158) Contingent consideration paid 21 (5) (2) Net cash used in financing activities (67) (134)
Net decrease in cash and cash equivalents (11) (5) Cash and cash equivalents at the beginning of the period 48 52 Effect of foreign exchange rate changes on cash and cash equivalents
(1)
1
Net cash generated by financing activities 36 48
*Includes US$5 million outstanding as of 31 December 2016, paid during year ended 31 December 2017 for Kapan acquisition
Polymetal International plc 31
POLYMETAL INTERNATIONAL PLC CONDENSED CONSOLIDATED STATEMENT OF CHANGES IN EQUITY
Notes
Number of shares outstanding (unaudited)
Stated capital account
Share based compensation
reserve Translation
reserve Retained earnings
Total equity attributable to
the parent Total equity
Balance at 1 January 2016 424,650,138 1,969 6 (1,465) (23) 487 487 Profit for the financial year - - - - 395 395 395 Other comprehensive income, net of income tax - - - 224 - 224 224 Share based compensation - - 7 - - 7 7 Shares allotted to employees 110,850 1 (1) - - Issue of shares to acquire non-controlling interest 22 898,875 14 - - (14) - - Issue of shares in exchange for asset acquisitions 2 1,120,690 11 - - - 11 11 Issue of shares for business acquisition 2 1,481,785 15 - - - 15 15 Dividends 14 - - - - (158) (158) (158) Balance at 31 December 2016 428,262,338 2,010 12 (1,241) 200 981 981 Profit for the financial year - - - - 354 354 354 Other comprehensive income, net of income tax - - - 90 - 90 90 Share based compensation - - 10 - - 10 10 Shares allotted to employees 144,219 1 (1) - - - - Issue of shares to acquire non-controlling interest 22 893,575 10 - - (10) - - Issue of shares for contingent consideration 815,348 10 - - - 10 10 Dividends 14 - - - - (138) (138) (138)
Balance at 31 December 2017 430,115,480 2,031 21 (1,151) 406 1,307 1,307
Polymetal International plc 32
1. GENERAL
Corporate information
Polymetal Group (the Group) is a leading gold and silver mining group, operating in Russia, Kazakhstan and Armenia.
Polymetal International plc (the Company) is the ultimate parent entity of Polymetal Group. The Company was incorporated in 2010 as a public limited company under Companies (Jersey) Law 1991 and has its place of business in Cyprus. Its shares are traded on the London and Moscow stock exchanges.
The Financial statements for the year ended 31 December 2017 included in this announcement were authorised for issue in accordance with a resolution of the Board of Directors on 9 March 2018.
The preliminary results for the year ended 31 December 2017 have been extracted from audited accounts which
have not been delivered to the Jersey Registrar of companies. The Financial statements included in this announcement do not constitute statutory accounts for the year ended 31 December 2017 or 31 December 2016. The financial information for the year ended 31 December 2016 is extracted from the statutory accounts from that
year. The report of the auditors on the statutory accounts for both 2017 and 2016 was unqualified.
Significant subsidiaries
As at 31 December 2017 the Company held the following significant mining and production subsidiaries:
Effective interest held, %
Name of subsidiary
Deposits and production facilities
Segment Country of incorporation 31 December
2017
31 December
2016 Gold of Northern Urals CJSC Vorontsovskoye Ural Russia 100 100 Okhotskaya Mining and Exploration Company LLC
In assessing its going concern status, the Group has taken account of its financial position, anticipated future trading performance, its borrowings and other available credit facilities, and its forecast compliance with covenants on those
borrowings and its capital expenditure commitments and plans. As at 31 December 2017, the Group held US$ 36 million of cash and had net debt of US$ 1,420 million, with US$ 1,361 million of additional undrawn facilities of which US$ 1,266 million are considered committed. Debt of US$ 26 million is due for payment within one year. The Group’s
cash generation and liquidity remains strong and the Group believes it will be able to operate within existing facilities, but could secure additional financing if and when needed.
The Board is satisfied that the Group’s forecasts and projections, having taken account of reasonably possible
changes in trading performance, show that the Group has adequate resources to continue in operational existence
Polymetal International plc 33
for at least the next 12 months from the date of this report and that it is appropriate to adopt the going concern basis in preparing the condensed consolidated financial statements for the year ended 31 December 2017.
Basis of presentation
The accounting policies applied in these condensed financial statements for the year ended 31 December 2017 are consistent with those of the Financial Statements for the year ended 31 December 2016, as described in these Financial Statements, with the exception of standards, amendments and interpretations effective in 2017 and other
presentational changes.
Amended accounting standards adopted by the Group
The following amendments to IFRSs became mandatory effective during the year ended 31 December 2017. The
amendments generally require full retrospective application, with some amendments requiring prospective application.
Amendments to IAS 7 Disclosure Initiative;
Amendments to IAS 7 Recognition of Deferred Tax Assets for Unrealised Losses ;
Amendments to IFRS 12 included in Annual Improvements to IFRS Standards 2014-2016 Cycle.
The Group has determined these amendments do not have significant impact on its condensed consolidated financial statements.
New accounting standards issued but not yet effective
IFRS 15 Revenue from Contracts with Customers. In May 2014, the IASB issued IFRS 15 Revenue from Contracts with Customers (“IFRS 15”), which covers principles that an entity shall apply to report information to users of
financial statements about the nature, amount, timing, and uncertainty of revenue and cas h flows arising from a contract with a customer. Application of the standard is mandatory for annual reporting periods beginning on or after 1 January 2018, with earlier application permitted. The Group has determined the impact of IFRS 15 on its
consolidated financial statements with the primary focus being understanding those sales contracts where the timing and amount of revenue recognised could differ under IFRS 15, which may occur for example if contracts with customers incorporate performance obligations not currently recognised separately, or where such contracts
incorporate variable consideration.
The Group’s revenue is primarily derived from commodity sales, for which the point of recognition is dependent on the contract sales terms, known as the international commercial terms (Incoterms). As the transfer of risks and
rewards generally coincides with the transfer of control at a point in time under incoterms, the timing and amount of revenue recognised by the Group for the sale of commodities is not materially affected.
For the Incoterms Cost, Insurance and Freight (CIF) and Cost and Freight (CFR) the seller must contract for and
pay the costs and freight necessary to bring the goods to the named port of destination. Consequently, the freight service on export commodity contracts with CIF/CFR incoterms represents a separate performance obligation as defined under the new standard, and a portion of the revenue earned under these contracts, representing the
obligation to perform the freight service, is deferred and recognised over time as this obligation is fulfilled, along with the associated costs.
The impact of applying the change during the year ended 31 December 2017 would be to reduce revenue and
operating costs respectively by US$ 9 million with no impact on profit. There would be no effect on current assets and current liabilities as at 31 December 2017.
The Group plans to use the modified approach, so the cumulative effect of initially applying IFRS 15 will be
recognised as an adjustment to the opening balance of retained earnings as of 1 January 2018.
IFRS 9 Financial instruments. In July 2014, the IASB issued the final version of IFRS 9 Financial instruments (“IFRS 9”). This standard is effective for annual periods beginning on or after 1 January 2018, and permits early adoption.
IFRS 9 provides a revised model for recognition, measurement and impairment of financial instruments. IFRS 9 also includes a substantially reformed approach to hedge accounting. The Group has determined the impact of IFRS 9 on its consolidated financial statements with the primary focus being on the application of the “expected credit loss”
model under which an entity calculates the allowance for credit losses by considering on a discounted basis the cash shortfalls it would incur in various default scenarios for prescribed future periods and multiplying the shortfalls by the probability of each scenario occurring.
The impacts of adopting IFRS 9 on the Group results for the year ended 31 December 2017 are as follows:
Impairment: The impact of the introduction of an ‘expected credit loss’ model for the assessment of impairment of financial assets held under amortised cost would be to increase the Group’s operating costs
by US$ 4 million and decrease the Group’s profit before tax by US$ 4 million for the year ended 31 December 2017, and to reduce current assets by US$ 4 million at 31 December 2017.
Polymetal International plc 34
Classification and measurement: The measurement and accounting treatment of the Group’s financial assets is unchanged on application of the new standard.
Hedge accounting: no impact as the Group does not elect to use hedge accounting.
As these effects are considered immaterial to the Group, the Group has elected not to restate prior period on
adoption of the new standard in 2018.
IFRS 16 Leases. IFRS 16 replaces the following standards and interpretations: IAS 17 Leases and IFRIC 4 Determining whether an Arrangement contains a Lease. The new standard provides a single lessee accounting
model for the recognition, measurement, presentation and disclosure of leases. IFRS 16 applies to all leases including subleases and requires lessees to recognise assets and liabilities for all leases, unless the lease term is 12 months or less, or the underlying asset has a low value. Lessors continue to classify leases as operating or
finance. Application of the standard is mandatory for annual reporting periods beginning on or after 1 January 2019, with earlier application permitted. The Group is in the process of determining the impact of IFRS 16 on its consolidated financial statements.
Amendments to IFRS 10 Consolidated Financial Statements and IAS 28 Joint Ventures : Sale or Contribution of Assets between an Investor and its Associate or Joint Venture remove an inconsistency between the two standards on the accounting treatment for gains and losses arising on the sale or contribution of assets by an investor to its
associate or joint venture. Following the amendment, such gains and losses may only be recognised to the extent of the unrelated investor’s interest, except where the transaction involves assets that constitute a business. In December 2015, the IASB has postponed the effective date of this amendment indefinitely pending the outcome of
its research project on the equity method accounting. The Group doesn’t expect it to have a material impact on its consolidated financial statements.
The following standards and interpretations were in issue but not yet effective as of reporting date and are not
applicable or have no effect to the Group:
Amendments to IAS 40 Investment Property, effective for annual period beginning on or after 1 January 2018;
Amendments to IAS 1 First-time Adoption of International Financial Reporting Standards , effective for annual period beginning on or after 1 January 2018;
Amendments to IFRS 2 Share-based payments, effective for annual period beginning on or after 1 January 2018;
IFRIC 22 Foreign Currency Transactions and Advance Consideration, effective for annual period beginning on or after 1 January 2018;
IFRIC 23 Uncertainty over Income Tax Treatment, effective for annual period beginning on or after 1 January
2019.
2. ACQUISITIONS
(a) Year ended 31 December 2017
Primorskaya GGK LLC
In May 2017 Polymetal purchased a 100% interest in Primorskaya GGK LLC, a company holding several licences for the silver-gold properties located in the Primorskiy region of Russia, from an unrelated party for a cash consideration of US$ 2 million.
The company does not meet the definition of a business pursuant to IFRS 3 and thus it was accounted for as an acquisition of a group of assets. The Group has purchased mineral rights of US$ 2 million.
(b) Year ended 31 December 2016
Kapan
In March 2016 Polymetal entered into binding agreements with Dundee Precious Metals Inc (Dundee) for the
acquisition of CJSC Dundee Precious Metals Kapan (“DPMK”), the holding company for the Kapan Gold Mine (“Kapan”) in the Republic of Armenia.
On 28 April 2016 the Group acquired 100 per cent of the shares of DPMK.
Polymetal International plc 35
The asset comprises a fully mechanised underground mine and a conventional 750 ktpa flotation concentrator and various infrastructure facilities. The mine produces gold, copper, silver and zinc concentrates sold to international markets.
Kapan meets the definition of a business pursuant to IFRS 3 and thus was accounted for at fair value using the acquisition method.
Consideration transferred
The total consideration for the shares at completion comprised US$ 38 million consisting of US$ 14 million payable in cash (including post-closing working capital adjustment amounting to US$ 5 million) and US$ 15 million paid
through the issue of 1,481,785 new ordinary shares of the Company. In addition, Dundee receives a 2% NSR (Net Smelter Return) royalty on the future production from the Kapan Gold Mine capped at US$ 25 million.
The fair value of the 1,481,785 ordinary shares issued as part of the consideration paid for Kapan was determined
based on spot price as of acquisition date, being US$ 10.28, and amounts to US$ 15 million. The net smelter return royalty described above meets the definition of contingent consideration. The fair value of
the contingent consideration was determined based on the life-of-mine model of the Kapan mine by discounting projected cash flows to the acquisition date. The following metal price assumptions, consistent with the assumptions adopted for the long-term planning at the time of acquisition, were used for the fair value calculation: Au – US$
1,250/oz, Ag – US$ 17/oz, Cu – US$ 4,500/tonne, Zinc – US$ 1,800/tonne, real post-tax discount rate of 9.04%. At the acquisition date, the estimated fair value of the contingent consideration amounted to US$ 9 million.
Assets acquired and liabilities recognised at the date of acquisition
As of date of finalisation of the interim consolidated financial statements for the period ended 30 June 2016 the fair
value of the assets acquired and liabilities recognised at the date of acquisition was provisionally accounted for, as well as the amount of the post-closing working capital adjustment. A post-closing working capital adjustment of US$ 5 million was outstanding as of 31 December 2016 and was included in account payable. The amount was paid
during the year ended 31 December 2017.
The amounts recognised in respect of the identifiable assets acquired and liabilities assumed and its reconciliation to the provisionally accounting are set out in the table below:
Provisional accounting
Fair value adjustments
Final accounting
US$m US$m US$m
Assets acquired and liabilities recognised at the date of acquisition Cash and cash equivalents 1 - 1 Mineral rights 17 (17) - Property, plant and equipment 4 17 21 Inventories 11 5 16 Account receivable 12 - 12 Accounts payable and accrued liabilities (8) - (8) Taxes payable (12) - (12) Environmental obligations (1) - (1) Deferred taxes 9 - 9
Net assets acquired 33 5 38
Consideration transferred Cash 9 5 14 Fair value of shares issued 15 - 15 Contingent consideration 9 - 9
Total consideration 33 5 38
Net cash outflow on acquisition 8 - 8 Cash consideration payable as of 31 December 2016 - - 5
No significant financial assets were acquired in business combination. The fair value of the accounts receivable approximates to its carrying value.
Polymetal International plc 36
Komarovskoye
On 4 April 2016 Polymetal entered into a binding agreement with Kazzinc LTD, a subsidiary of Glencore International plc, for the acquisition of Orion Minerals LLC, the holding company for the Komarovskoye Gold Deposit
(“Komarovskoye”) in the Republic of Kazakhstan.
The asset comprises an active open pit mine and a 500 ktpa heap leach facility with grid power available on site. Polymetal aims to mine, deliver by rail and process at Varvara up to 2 Mtpa of ore with potential to increase Varvara’s
annual production at lower cash costs.
The acquisition of the Komarovskoye was completed on 1 August 2016, following receipt of all required regulatory approvals.
Management considers that the control over the Komarovskoye was obtained on the date of the deal completion.
Komarovskoye meets the definition of a business pursuant to IFRS 3 thus it was accounted for at fair value using the acquisition method.
The total consideration for Komarovskoye was US$ 100 million payable in cash. In addition, a deferred consideration contingent upon future production levels and gold price performance, will be paid to Kazzinc LTD. The royalty is calculated on a quarterly basis, based on contained gold in ore mined per relevant quarter and is payable at gold
prices above US$ 1,250 per ounce. The royalty is capped at a total consideration of US$ 80 million.
Consideration transferred
Deferred consideration described above meets definition of the contingent consideration. The fair value of the contingent consideration was determined based on the life-of-mine model of the Komarovskoye mine and calculated using Monte Carlo modelling. Projected cash flows were discounted to the acquisition date at a disc ount rate of
9.04%. Gold price volatility was assessed at 18.08%, average gold price for one quarter to the valuation date was 1,291 USD/ounce. As at acquisition date the estimated contingent consideration amounts to US$ 20 million.
Assets acquired and liabilities recognised at the date of acquisition
As at 31 December 2016, purchase price allocation for the acquisition of Komarovskoye was not completed and mineral rights and environmental obligations were accounted for on a provisional basis. The Group c ompleted the
purchase price allocation review during the year ended 31 December 2017 and made no adjustments to the provisional calculation.
The management believes that this business acquisition does not give rise to goodwill and excess of consideration
over identifiable net asset assets of the acquiree should be fully attributed the mineral rights. The amount recognised in respect of the identifiable assets acquired and liabilities assumed are set out in the table below:
US$m
Assets acquired and liabilities recognised at the date of acquisition Cash and cash equivalents 1 Property, plant & equipment 140 Inventories 7 Accounts receivable 1 Accounts payable and accrued liabilities (2) Environmental obligations (1) Deferred income taxes (25) Other liabilities (1)
Net assets acquired 120
Consideration transferred Cash 100
Contingent consideration 20
Total consideration 120
Net cash out flow on acquisition 99
No significant financial assets were acquired in business combination. No significant acquisition-related costs were incurred.
Polymetal International plc 37
Saum Mining Company LLC
On 2 December 2016 Polymetal International plc acquired an 80% stake in Saum Mining Company LLC, a licence holder for the Saum polymetallic deposit (“Saum”). Polymetal issued 1,120,690 new Company shares
(“Consideration shares”), representing 0.26% of Polymetal’s total increased share capital in connection with the acquisition of an 80% stake in Saum from an unrelated party. The total transaction value is approximately US$ 10. 7 million.
The Saum licence covers an area of 34.2 km2 in Russia’s Sverdlovsk region in the Ural Mountains and is located and approximately 240 km from Polymetal’s Voro processing plant. Polymetal plans to prepare an Ore Reserves estimate in Q4 2017. Further drilling is planned on the property in 2017 and 2018.
Saum does not meet the definition of a business pursuant to IFRS 3, as it represents acquisition of mining license through a non-operating corporate entity, and thus it is accounted for as an acquisi tion of a group of assets. The Group purchased mineral rights of US$ 10 million and other current assets of US$ 1 million.
3. SEGMENT INFORMATION
During the year ended 31 December 2017 management has reviewed the segmental presentation of financial
information it requires to assess performance and allocate resources. It now considers a more geographic -focused reporting format based on the location of operating activities to be more meaningful from a management and forecasting perspective, as well as aligned to the management structure, reporting and practices.
The Group has identified five reportable segments:
Magadan (Omolon Gold Mining Company LLC, Magadan Silver JSC, Mayskoye Gold Mining Company LLC);
Ural (Gold of Northern Urals CJSC);
Khabarovsk (Albazino Resources Ltd, Amur Hydrometallurgical Plant LLC; Okhotskaya Mining and Exploration Company LLC; Svetloye LLC);
Kazakhstan (Varvarinskoye JSC; Komarovskoye Mining Company LLC; Bakyrchik Mining Venture LLC, Inter Gold Capital LLC);
Armenia (Kapan MPC CJSC, Lichkvaz CJSC).
Reportable segments are determined based on the Group’s internal management reports, which are separated
based on the Group’s geographical structure. Minor companies and activities (management, exploration, purchasing and other companies) which do not meet the reportable segment criteria are disclosed within corporate and other segment. Each segment is engaged in gold, silver or copper mining and related activities, including exploration,
extraction, processing and reclamation. The Group’s segments are based in the Russian Federation, Kazakhstan and Armenia.
The measure which management and the Chief Operating Decision Maker (the CODM) use to evaluate the
performance of the Group is segment Adjusted EBITDA, which is defined as profit for the period adjusted for depreciation and amortisation, write-downs and reversals of inventory to net realisable value, share-based compensation expenses, rehabilitation expenses, bad debt allowance, gains or losses arising on acquisition or
disposal of subsidiaries, foreign exchange gains or losses, changes in the fair value of contingent consideration, finance income, finance costs, income tax expenses and tax exposure accrued within other operating expenses. The accounting policies of the reportable segments are consistent with those of the Group’s accounting policies
under IFRS.
Revenue shown as corporate and other comprises, principally, intersegment revenue relating to the supply of inventories, spare parts and fixed assets, and rendering management services to the Group’s production entities.
Intersegment revenue is recognised based on costs incurred plus a fixed margin basis. External revenue shown within corporate and other represents revenue from services provided to third parties by the Group’s non-mining subsidiaries.
Business segment current assets and liabilities, other than current inventory, are not reviewed by the CODM and therefore are not disclosed in these condensed consolidated financial statements. The segment adjusted EBITDA reconciles to the profit before income tax as follows:
Polymetal International plc 38
The segment adjusted EBITDA reconciles to the profit before income tax as follows:
Period ended 31 December 2017 (US$m) MAGAD AN KHABAROVSK URAL KAZAKHSTAN ARMENIA
Total
reportable segments
Corporate and other
Intersegment
operations and balances
Total
Rev enue f rom external customers 810 630 155 154 66 1,815 - - 1,815
Intersegment rev enue - 14 1 6 - 21 218 (239) -
Cost of sales, excluding depreciation, depletion and write-down of inv entory to net realisable v alue 437 301 43 83 39 903 141 (167) 877
Period ended 31 December 2016 (US$m) MAGAD AN KHABAROVSK URAL KAZAKHSTAN ARMENIA
Total
reportable segments
Corporate and other
Intersegment
operations and balances
Total
Rev enue f rom external customers 823 473 157 101 29 1 583 - - 1 583 Intersegment rev enue - 6 - - - 6 196 (202) - Cost of sales, excluding depreciation, depletion and write-down of inv entory to net realisable v alue
362 203 36 61 19 681 134 (149) 666
Cost of sales 461 258 47 72 23 861 134 (149) 846 Write-down of metal inv entory to net realisable v alue (16) (5) - - - (21) - - (21) Depreciation included in cost of sales (79) (47) (11) (11) (4) (152) - - (152) Write-down of non-metal inv entory to net realisable v alue (3) (3) - - - (6) - - (6) Rehabilitation expenses (1) - - - - (1) - - (1)
General, administrativ e and selling expenses,
excluding depreciation, amortization and share
based compensation
23 14 4 9 3 53 69 (12) 110
General, administrativ e and selling expenses 41 27 10 11 3 92 79 (51) 120 Intercompany management serv ices (18) (12) (6) (1) - (37) (2) 39 - Depreciation included in SGA - (1) - (1) - (2) (1) - (3) Share based compensation - - - - - - (7) - (7)
Other operating expenses excluding additional tax charges 26 - 6 4 3 1 - 40 10 (2) 48 Other operating expenses 11 6 5 3 3 28 10 (2) 36 Bad debt allowance - - - - - - - - - Additional mining taxes and VAT exposures, penalties and
accrued interest 15 - (1) - (2) 12 - - 12
Share of income of associates and joint v entures - - - - - - - - -
Adjusted EBITDA 412 256 113 28 6 815 (17) (39) 759 Depreciation expense 79 48 11 12 4 154 1 - 155 Rehabilitation expenses 1 - - - - 1 - - 1 Write-down of non-metal inv entory to net realisable v alue 3 3 - - - 6 - - 6 Write-down of metal inv entory to net realisable v alue 16 5 - - - 21 - - 21 Share-based compensation - - - - - - 7 - 7 Bad debt allowance - - - - - - - - - Additional mining taxes and VAT exposures, penalties and accrued interest
Additions to non-current assets: Property , plant and equipment 78 73 7 108 13 279 9 - 288 Acquisition of group of assets - - - 140 21 161 10 - 171
News release
Polymetal International plc 40
4. REVENUE
Revenue analysed by geographical regions of customers is presented below:
Year ended
31 December 2017 31 December 2016 US$m US$m
Sales within the Russian Federation 1,090 899 Sales to Kazakhstan 301 295 Sales to Europe 224 205 Sales to East Asia 200 184
Total 1,815 1,583
Included in revenues for the year ended 31 December 2017 are revenues which arose from sales of the Group’s largest customers, those share in revenue exceeds 10% of the total, amounting to US$ 610 million, US$ 200 million, US$ 167 and US$ 136 million, respectively (2016: US$ 416 million, US$ 281 mi llion and US$ 206 million, respectively).
Presented below is an analysis of revenue from gold, silver, zinc and copper sales:
Year ended 31 December 2017 Year ended 31 December 2016
31 December 2017 31 December 2016 US$m US$m Cash operating costs On-mine costs (Note 6) 414 320 Smelting costs (Note 7) 316 259 Purchase of ore and concentrates from third parties 54 27 Purchase of ore from related parties (Note 23) 38 11 Mining tax 88 82 Total cash operating costs 910 699 Depreciation and depletion of operating assets (Note 8) 193 162 Rehabilitation expenses - 1 Total costs of production 1,103 862
Increase in metal inventories (26) (51) Write-down of metal inventories to net realisable value (Note 17) 16 21 Write-down of non-metal inventories to net realisable value (Note 17) 3 6 Idle capacities and abnormal production costs 10 8
Total 1,106 846
News release
Polymetal International plc 41
Mining tax includes royalties payable in Russian Federation, Kazakhstan and Armenia. Mining tax in Russian Federation and Kazakhstan is calculated based on the value of the precious metals extracted in the period. This value is usually determined based on the realised selling price of precious metals or, in case if there were no sales during
the period, cost of production of metals extracted (Russian Federation) or the average market price (Kazakhstan) during the period. The royalty payable in Armenia is calculated as a percentage of actual sales during the reporting period.
Mining tax in respect of the metal inventories produced or sold during the year is recognised within cost of sales, while the additional mining tax accruals in respect of various disputes with tax authorities are recognised within other expenses (see Note 10).
Idle capacities and abnormal production costs were expensed as incurred and relate to idle capacities when processing plants are stopped for general maintenance.
6. ON-MINE COSTS
Year ended
31 December 2017 31 December 2016
US$m US$m Services 192 139 Labour 118 97 Consumables and spare parts 101 79 Other expenses 3 5 Total (Note 5) 414 320
7. SMELTING COSTS
Year ended
31 December 2017 31 December 2016
US$m US$m Consumables and spare parts 132 114 Services 116 93 Labour 65 50 Other expenses 3 2
Total (Note 5) 316 259
8. DEPLETION AND DEPRECIATION OF OPERATING ASSETS
Year ended
31 December 2017 31 December 2016
US$m US$m
On-mine 137 117 Smelting 56 45
Total (Note 5) 193 162
Depreciation of operating assets excludes depreciation relating to non-operating assets (included in general, administrative and selling expenses) and depreciation related to assets employed in development projects where the charge is capitalised. Depreciation expense, which is excluded from the Group’s calculation of Adjusted EBITDA (see
Note 3), also excludes amounts absorbed into unsold metal inventory balances.
News release
Polymetal International plc 42
9. GENERAL, ADMINISTRATIVE AND SELLING EXPENSES
Year ended
31 December 2017 31 December 2016
US$m US$m
Labour 116 87 Services 11 10 Share based compensation 10 7 Depreciation 4 3 Other 17 13 Total 158 120
10. OTHER OPERATING EXPENSES, NET
Year ended
31 December 2017 31 December 2016 US$m US$m Additional mining taxes and VAT exposures, penalties and accrued interest, net (8) (12) Exploration expenses 18 10 Social payments 15 10 Provision for investment in Special Economic Zone 12 14 Taxes, other than income tax 11 11 Housing and communal services 4 4 Loss on disposal of property, plant and equipment 1 1 Change in estimate of environmental obligations (4) (5) Other expenses (5) 3 Total 44 36
From 1 January 2017 Omolon Gold Mining Company LLC and Magadan Silver JSC are entitled to the decreased
statutory income tax rate of 17% (2016: 18%) for the operations held in the Special Economic Zone of the Russian Far East, as well as decreased mining tax rate (paying at 60% of the standard mining tax rates). In return for obtaining this tax relief the members of the regional free economic zone are obliged to invest 50% of their tax savings each year in
the Special Economic Zone Development Programme, amounting to US$ 12 million in the reporting year (2016: US$ 14 million).
Additional mining taxes, VAT, penalties and accrued interest have been accrued in respect of various disputes with
the Russian and Armenian tax authorities.
Total provision for additional property taxes, mining taxes and VAT exposures, penalties and accrued interest as of 31 December 2017 is US$ 7 million (2016: 31 December 2016: US$ 14 million). During the year ended 31 December
2017 the Group has paid US$ 6 million related to royalty provisions identified as of 31 December 2016 and released US$ 6 million of accrued penalties and interest due to settlement with tax authorities at Kapan. There were no other individually significant movement in tax provisions.
During the year ended 31 December 2016 following the favourable court decisions the Group has recognised the reversal of the previously recognised and paid additional mining tax charge at Magadan Silver JSC amounting to US$ 14 million. There were no other individually significant movement in tax provisions during the year ended 31 December
2016.
Exploration expenses include write downs of US$ 2 million (2016: US$ 1 million) recognised within Exploration and Development assets (Note 15). Operating cash flow spent on exploration activities amounts to US$ 16 million (2016:
US$ 11 million).
News release
Polymetal International plc 43
11. EMPLOYEE COSTS
Year ended 31 December 2017 31 December 2016
US$m US$m Wages and salaries 275 215 Social security costs 78 51 Share-based compensation 10 7
Total payroll costs 363 273 Reconciliation: (Less): employee costs capitalised (40) (26) Add/(Less): employee costs absorbed into unsold metal inventory balances 12 (5) Employee costs included in operating costs 335 242
The weighted average number of employees during the year ended 31 December 2017 and year ended 31 December
2016 was:
Year ended 31 December 2017 31 December 2016
Magadan 3,554 3,564 Khabarovsk 2,529 2,619 Kazakhstan 1,634 1,517 Armenia 1,007 770 Ural 810 878 Corporate and other 1,419 1,465 Total 10,953 10,813
Compensation of key management personnel is disclosed within Note 23.
12. FINANCE COSTS
Year ended 31 December 2017 31 December 2016
US$m US$m Interest expense on borrowings 57 58 Unwinding of discount on environmental obligations 3 4 Unwinding of discount on contingent considerations 3 1 Total 63 63
Interest expense on borrowings excludes borrowing costs capitalised in the cost of qualifying assets of US$ 8 million
and US$ 5 million during the years ended 31 December 2017 and 2016, respectively. These amounts were calculated based on the Group’s general borrowing pool and by applying an effective interest rate of 3.96% and 4.33%, respectively, to cumulative expenditure on such assets.
13. INCOME TAX
The amount of income tax expense for the years ended 31 December 2017 and 31 December 2016 recognised in
profit and loss is as follows:
Year ended
31 December 2017 31 December 2016
US$m US$m
Current income taxes 111 139 Deferred income taxes (22) 30
Total 89 169
News release
Polymetal International plc 44
A reconciliation between the reported amounts of income tax expense attributable to income before income tax is as follows:
Year ended
31 December 2017 31 December 2016 US$m US$m Profit before income tax 443 564 Theoretical income tax expense at the tax rate of 20% 89 113 Effect of Special Economic Zone and Regional Investment project decreased tax rates
(25)
(10)
Effect of different tax rates of subsidiaries operating in other jurisdictions 5 6 Current year losses not recognized and losses previously recognised written-off 9 7 Non-deductible interest expense 5 14 Effect of dissolution of the subsidiary - 25 Other non-taxable income and non-deductible expenses 6 14
Total income tax expense 89 169
The actual tax expense differs from the amount which would have been determined by applying the statutory rate of 20% for the Russian Federation, Kazakhstan and Armenia to profit before income tax as a result of the application of relevant jurisdictional tax regulations, which disallow certain deductions which are included in the determination of
accounting profit. These deductions include share-based payment expenses, social related expenditures and other non-production costs, certain general and administrative expenses, financing expenses, foreign exchange related and other costs.
As from 1 January 2017 Omolon Gold Mining Company LLC and Magadan Silver JSC are entitled to the decreased statutory income tax rate of 17% for the operations held in the Special Economic Zone of the Russian Far East (2016: 18%), the rate of 17% was used in calculation of income tax provision and deferred tax positions for those entities.
From 1 January 2017 Svetloye LLC has received tax relief as Regional Investment Project and is entitled to the statutory income tax rate of 0% up to 2021.
In the normal course of business, the Group is subject to examination by the tax authorities throughout the Russian
Federation, Kazakhstan and Armenia. Of the large operating companies of the Group, the tax authorities have audited Okhotskaya Mining and Exploration Company LLC up to 2014, Omolon Gold Mining Company LLC up to 2013, Gold of Northern Urals CJSC and Magadan Silver JSC up to 2012, Mayskoye Gold Mining Company LLC up to 2010, and
Varvarinskoye JSC for the period up to 2010. According to Russian, Kazakhstan and Armenian tax legislation, previously completed audits do not fully preclude subsequent claims relating to the audited period.
Tax exposures recognised in income tax
During the year ended 31 December 2017 and the year ended 31 December 2016 no individual significant exposures were identified as probable and provided for. Management has identified a total exposure (covering taxes and related
interest and penalties) of approximately US$ 5 million in respect of uncertain tax positions (31 December 2016: US$ 4 million) which relate to income tax.
Income tax amounts included in other comprehensive income
An analysis of tax by individual item presented in the condensed consolidates statement of comprehensive income is presented below:
Year ended
31 December 2017 31 December 2016 US$m US$m
Net foreign exchange gains/(losses) on net investment in foreign operation Current tax expense (2) (6) Deferred tax expense (3) (1) Total income tax recognised in other comprehensive income (5) (7)
Current and deferred tax assets recognised within other comprehensive income relates to the tax losses originated by foreign currency exchange losses, allowable for tax purposes and generated by monetary items that forms part of the
intragroup net investment in the foreign operation. These foreign currency exchange losses are recognised in the condensed consolidated financial statements within foreign currency translation reserve.
News release
Polymetal International plc 45
Deferred taxation
Deferred taxation is attributable to the temporary differences that exist between the carrying amounts of assets and liabilities for financial reporting purposes and the amounts used for tax purposes.
The following are the major deferred tax liabilities and assets recognised by the Group and movements thereon during the reporting period.
Environmental
obligation Inventories
Property, plant,
and equipment
and other non-current assets
Trade and other payables Tax losses
Long-term
loans and payables
Intercompany loans
Other
current assets Total
US$m US$m US$m US$m US$m US$m US$m US$m US$m
At 1 January 2016
6 (14) (127) 6 130 2 - 4 7
Charge to income statement (1) 6 7 1 (37) - (6) - (30) Acquisition (Note 2) - 1 (21) 2 2 - - - (16) Recognised in other
comprehensiv e income - - - - 1 - - - 1
Exchange dif f erences 2 (3) (12) 1 9 - - 1 (2)
At 31 December 2016 7 (10) (153) 10 105 2 (6) 5 (40)
Charge to income statement - 12 (3) (2) 18 (1) (1) (1) 22 Recognised in other
comprehensiv e income - - - - - - 3 -
3 Exchange dif f erences - (1) (3) - 3 - - - (1)
At 31 December 2017 7 1 (159) 8 126 1 (4) 4 (16)
Deferred tax assets and liabilities are offset where the Group has a legally enforceable right to do so. The following
analysis shows deferred tax balances presented for financial reporting purposes:
The Group believes that recoverability of the recognised deferred tax asset (DTA) of US$ 126 million at 31 December 2017 is more likely than not based upon expectations of future taxable income in the Russian Federation and
Kazakhstan and available tax planning strategies.
Effective from 1 January 2017 there are changes introduced to the Russian Federation tax law regarding loss carryforwards. Loss carryforwards will be limited to 50% of taxable profit in tax years 2017 through 2020. From 2021
the limitation will expire and it will be possible to fully utilise loss carryforwards against the corporate tax base in a given year. In addition to the above, the 10-year carryforward period for losses is eliminated, meaning that losses incurred from 2007 can be carried forward for an indefinite period until fully utilised.
Losses incurred in certain taxable entities in recent years have created a history of losses as of 31 December 2017. The Group has concluded that there is sufficient evidence to overcome the recent history of losses based on forecasts of sufficient taxable income in the carry-forward period.
Tax losses carried forward represent amounts available for offset against future taxable income generated by Mayskoye Gold Mining Company LLC, Varvarinskoye JSC and Bakyrchik Mining Venture LLC. Each legal entity within the Group represents a separate tax-paying component for income tax purposes. The tax losses of one entity cannot
be used to reduce taxable income of other entities of the Group. Tax losses carried forward of US$ 448 million (2016: US$ 435 million) recognised in Varvarinskoye JSC and Bakyrchik Mining Venture LLC are available during the period up to 2026, with the most significant portion expiring in 2025.
The Group’s estimate of future taxable income is based on established proven and probable reserves which can be economically developed. The related detailed mine plans and forecasts provide sufficient supporting evidence that the Group will generate taxable earnings to be able to fully realise its net DTA even under various stressed scenarios. The
amount of the DTA considered realisable, however, could be reduced in the near term if estimates of future taxable income during the carry forward period are reduced due to delays in production start dates, decreases in ore reserve estimates, increases in environmental obligations, or reductions in precious metal prices.
No deferred tax asset has been recognised in respect of US$ 90 million (2016: US$ 96 million) as it is not considered probable that there will be future taxable profits against which the losses can be utilised. No deferred tax was recognised in relation to Svetloye tax losses, accumulated by 1 January 2016, were the entity has received tax relief
as Regional Investment Project and is entitled to the statutory income tax rate of 0% up to 2021, thus will not be able to utilise accumulated losses. Included in unrecognised tax losses are losses of US$ 30 million that mainly expire in
News release
Polymetal International plc 46
2025. Other losses may be carried forward indefinitely in accordance with enacted changes to Russian Federation legislation described above.
The deferred tax liabilities for taxes that would be payable on the unremitted earnings of certain of the Group
subsidiaries have not been recognised as the Group has determined that the undistributed profit of its subsidiaries will not be distributed in the foreseeable future. The temporary differences associated with investments in subsidiaries, for which deferred tax liabilities have not been recognised, amount to US$ 2,737 mil lion (2016: US$ 2,147 million).
14. DIVIDENDS
Dividends recognised during the years ended 31 December 2017 and 31 December 2016 are detailed in the below:
Dividends
cents per share
US$m deducted from the equity during the
period
proposed in relation to the period Paid in
Final dividend 2015 13 56 May 2016 2015 May 2016 Interim dividend 2016 9 38 September 2016 2016 September 2016 Special dividend 2016 15 64 December 2016 2016 December 2016 Final dividend 2016 18 78 March 2017 2016 May 2017 Interim dividend 2017 14 60 September 2017 2017 September 2017 Final dividend 2017 30 129 n/a 2017 n/a Total dividends for the year ended 31 December 2016
158 180 158
Total dividends for the year ended 31 December 2017
US$m US$m US$m US$m US$m US$m Accumulated depreciation, amortisation - - (560) (18) - (578) Charge for the period - - (182) (5) - (187) Disposals and write-offs including fully depleted mines - - 18 1 - 19
News release
Polymetal International plc 47
Translation to presentation currency - - (115) (3) - (118) Balance at 31 December 2016 - - (839) (25) - (864) Charge for the period - - (227) (5) - (232) Disposals and write-offs including fully depleted mines - - 28 - - 28 Translation to presentation currency - - (43) (1) - (44) Balance at 31 December 2017 - - (1,081) (31) - (1,112)
Net book value 31 December 2016 564 140 911 40 150 1,805
31 December 2017 655 150 943 30 276 2,054
Mining assets, exploration and development assets at 31 December 2017 included mineral rights with net book value which amounted to US$ 735 million (31 December 2016: US$ 756 million) and capitalised stripping costs with net book
value of US$ 50 million (31 December 2016: US$ 32 million). Mineral rights of the Group comprise assets acquired upon acquisition of subsidiaries and asset acquisitions.
No property, plant and equipment was pledged as collateral at 31 December 2017 or at 31 December 2016.
16. INVESTMENTS IN ASSOCIATES AND JOINT VENTURES
31 December 2017 31 December 2016 Voting power % Carrying Value
Total 44 25 Loans forming part of the net investment in joint ventures JSC South-Verkhoyansk Mining Company (Nezhda) 39 - Prognoz Serebro LLC 13 - 52 0 Total investments in associates and joint ventures 96 25
JSC South-Verkhoyansk Mining Company
In December 2015 Polymetal International plc entered into a joint arrangement, under which Polymetal participates in advancing the development of the Nezhdaninskoye gold deposit (Nezhda) in Yakutia, Russia. On 19 January 2016
Polymetal obtained a 15.3% interest in the joint venture entity holding the 100% of the Company for the total cash consideration of US$ 18 million. It was determined that the arrangement meets definition of a joint arrangement as per IFRS 11 Joint Arrangements, as joint control of two investors was established. As the arrangement is structured
thorough the separate vehicle and the investors have rights for their share in net assets of the joint arrangement, it was concluded that joint arrangement meets definition of the joint venture and should be accounted for using equity method of accounting.
In November 2016 Polymetal increased its share in JSC South-Verkhoyansk Mining Company (Nezhda) to 17.66% for cash consideration of US$ 3 million.
In July 2017 Polymetal has agreed to acquire an additional 7% in the JSC South-Verkhoyansk Mining Company
(Nezhda) for a cash consideration of US$ 8 million, from its joint venture partner, Ivan Kulakov. Simultaneously, Polymetal has acquired an option to buy out the remaining 75.3% in Nezhda (the “Call option”). The Call Option premium comprised US$ 12 million (Note 18) in cash payable upfront and is exercisable based on the following terms:
Following the preparation of the initial JORC-compliant ore reserve estimate for the open-pittable reserves, Polymetal will have the option to acquire the remaining stake for US$ 100 per ounce of attributable gold reserves (equivalent to US$ 75.3/oz multiplied by total reserve ounces). The total consideration shall not be
News release
Polymetal International plc 48
less than US$ 105 million and not more than US$ 180 million. US$ 10 million of the consideration will be paid in cash, and the remaining amount will be paid in the Polymetal’s shares;
The Call Option is exercisable between 1 February and 1 June 2018 entirely at Polymetal’s discretion;
Should Polymetal decide not to proceed with the exercise of the Call Option, Polymetal will have a put option
to sell its 24.7% stake to Mr. Kulakov’s investment vehicle, Pallavicino Holdings Ltd, an unrelated party, at a notional cost of EUR 1 thousand;
As of the reporting date, the completion of the sale and purchase of the additional 7% share in the JV and
exercise of the Call Option are subject to approval by the Russian Federal Government’s Commission on Foreign Investments into Companies of Strategic Importance. The exercise of the Call Option is also subject to approval by the Russian Federal Antimonopoly Service.
The Group has determined that the increase in shareholding does not represent a significant change in circumstances that indicate a change in joint control and Nezhda continues to meet the definition of a joint venture. Cash consideration of US$ 8 million paid for the additional stake is accounted for as part of the net investment in the joint venture. The
Group has a legal right to recovery of this $8 million in the event that the associated transaction does not receive the required approvals. The Group has performed a fair value valuation of the Call Option at origination date and as of 31 December 2017 (Note 21) and has determined that its fair value approximates to its cost of US$ 12 million (Note 18).
The directors are confident that the necessary approvals will be received before the option expires, and also believe that they will be able to extend the option by taking other mitigating actions if required. However, there remains a risk that the Group will not be able to exercise the option, in which case the management will reassess the recoverabili ty
of the investment which could lead to a material impairment charge.
Prognoz Serebro LLC
In January 2017 the Group entered into an agreement with Polar Acquisition Ltd (PAL), under which Polymetal will
participate in the development of the Prognoz silver deposit in Yakutia, Russia (“Prognoz”). Under the agreement, Polymetal acquired a 5% interest in Prognoz for US$ 5 million (including US$ 2 million of related expenses) in cash through the purchase of 10% of Polar Silver Resources’ share capital, the entity holding a 50% interest in Prognoz,
with the remaining 50% owned by a group of private investors. The arrangement allows Polymetal to acquire from PAL their remaining 45% interest in Prognoz for a consideration based on the JORC compliant reserves estimate upon completion of the technical study. The Group has determined that Prognoz constitutes a joint venture under IFRS 11
Joint Arrangements and therefore the investment was accounted for using the equity method.
GRK Amikan
GRK Amikan is a production company which holds 100% interest in Veduga gold deposit in the Krasnoyarsk region of
the Russian Federation. During the year ended 31 December 2017 the Group has purchased ore from GRK Amikan for the total amount of US$ 35 million (2016: US$ 11 million) (Note 23) and eliminated unrealised profit on inventories not yet processed against its share of net profit in GRK Amikan.
Aktogai Mys LLC
In June 2015 Polymetal purchased a 25% stake in the company Aktogai Mys LLC that owns Dolinnoye exploration licence in Kazakhstan Republic (including part of intracompany loan) from the unrelated party. At the same time
Polymetal has also entered into an agreement to finance, organize and ensure execution of exploration activities: to obtain permission and approvals for drilling from competent authorities, to perform no more than 20 km of exploration drilling, technical research as well as JORC feasibility study in exchange for a right to increase its share in the project
up to 50% after the completion of these tasks.
By 2017 the earn-in conditions have been satisfied by extensive exploration and the preparation of a JORC-compliant reserve estimate for the property. In June 2017 the earn-in arrangement between Polymetal and its partner was
completed and Polymetal has acquired an additional 25% interest in the Aktogai Mys LLC for a net considerati on of US$ 1 million. In September 2017 Polymetal contributed US$ 2 million to Aktogai Mys charter capital.
The Group has determined that Aktogai Mys LLC continues to constitute a joint venture under IFRS 11 Joint
Arrangements and the investment is accounted for using the equity method.
During the year ended 31 December 2017 the Group has purchased ore from Aktogai Mys LLC for the total amount of US$ 3 million (2016: nil) (Note 23) and eliminated unrealised profit on inventories not yet processed against its share
of net profit in Aktogai Mys LLC.
News release
Polymetal International plc 49
Proeks LLC
In November 2015 the Group acquire a 24.9% share in a diamond exploration project located in North-West of Russian Federation for the cash consideration of a US$ 2 million. During the year ended 31 December 2017 the Group has
increased its share in Proeks LLC to 30% for the consideration of US$ 1 million. The Group determined that it has significant influence in the entity and the investment is accounted for using the equity method.
Prognoz Serebro LLC, Aktogai Mys LLC and Proeks LLC do not represent equity method investments that are
individually material.
The following table summarises the aggregate financial position and the Group’s share of net profit/(losses) of the investments:
Nezhda Amikan Non-significant investments Total Total
31 December 2017 31 December 2017 31 December 2017 31 December 2017 31 December 2016
Current assets 18 41 15 74 59 Non-current liabilities (45) (39) (63) (147) (87) Current liabilities (6) (3) (6) (15) (9) Net assets 44 39 (8 ) 75 62
Revenue - 36 3 39 41 (Loss)/ profit for f inancial period (5) 11 (3) 3 10 Group’s share in investment net
income/(loss) less prior year unrecognised losses
(1)
5
(1) 3 2
Share of profit recognised for the year less inventories unrealised
profit eliminations
(1)
6 (2) 3 -
17. INVENTORIES
Year ended
31 December 2017 31 December 2016
US$m US$m Inventories expected to be recovered after twelve months Ore stock piles 86 80 Consumables and spare parts 37 33
Total non-current inventories 123 113
Inventories expected to be recovered in the next twelve months Сopper, gold and silver concentrate 103 95 Ore stock piles 144 157 Work in-process 57 42 Doré 13 12 Refined metals 2 3 Metal for refining 9 6
Total metal inventories 328 315 Consumables and spare parts 186 178 Total 514 493
News release
Polymetal International plc 50
Write-downs of metal inventories to net realisable value
The Group recognised the following (write-downs)/reversals to net realisable value of its metal inventories :
Year ended 31 December 2017 Year ended 31 December 2016
The key assumptions used as at 31 December 2017 in determining net realisable value of inventories (including the commodity price assumptions for long-term stockpiles) were consistent with those used in the goodwill impairment review. For short-term metal inventories applicable forward prices as of 31 December 2017 were used.
During the year ended 31 December 2017 the Group provided for obsolete consumables and spare parts inventory in the amount of US$ 3 million (year ended 31 December 2016: write-down of US$ 6 million).
The amount of inventories held at net realisable value at 31 December 2017 is US$ 60 million (31 December 2016:
US$ 45 million).
18. TRADE RECIEVABLES AND OTHER FINANCIAL INSTRUMENTS
Year ended
31 December 2017 31 December 2016 US$m US$m Receivables from provisional copper, gold and silver concentrate sales 26 35 Other receivables 15 25 Аccounts receivable from related parties (Note 23) 8 - Less: Allowance for doubtful debts (2) (3)
Total trade and other receivables 47 57 Call option related to the Nezhda acquisition (Note 16) 12 - Short-term loans provided to related parties (Note 23) 7 7 Short-term loans provided to third parties 5 6
Total other short-term financial instruments 24 13 Total 71 70
The average credit period on sales of copper, gold and silver concentrate at 31 December 2017 was 20 days (2016: 20 days). No interest is charged on trade receivables. The Group’s allowance for doubtful debt relates to its non -trade receivables. There are no trade receivables either past due or impaired as at 31 December 2017 (31 December 2016:
US$ nil).
19. BORROWINGS
Borrowings at amortised cost:
Actual interest rate at 31 December 2017 31 December 2016
Type of rate 31 Dec 2017 31 Dec 2016 Current Non-current Total Current Non-current Total
US$m US$m US$m US$m US$m US$m Secured loans from third parties
U.S. Dollar denominated f loating 3.85% - - - 98 638 736 U.S. Dollar denominated f ixed 4.10% 4.10% - 436 436 - 61 61
Total - 436 436 98 699 797 Unsecured loans from third parties U.S. Dollar denominated f loating 3.73% 3.96% - 834 834 - 500 500
U.S. Dollar denominated f ixed 6.17% 7.50% 26 152 178 - 78 78 Euro denominated f ixed 2.85% 2.85% - 8 8 - 3 3
Total 26 994 1,020 - 581 581
26 1,430 1,456 98 1,280 1,378
News release
Polymetal International plc 51
Bank loans
The Group has a number of borrowing arrangements with various lenders. These borrowings consist of unsecured and secured loans and credit facilities denominated in U.S. Dollars. Where security is provided it is in form of a pledge of
revenue from certain sales agreements.
Movements in borrowings are reconciled as follows:
1
January
Borrowings
obtained
Repayments
of borrowings
Net foreign exchange
losses
Exchange
differences on
translating foreign
operations
Arrangement fee
amortisation
31
December
US$m US$m US$m US$m US$m US$m US$m
Year ended 31 December
2016
1,350 1,436 (1,410)
(108)
108 2
1,378 Year ended 31 December 2017
1,378 3,108 (3,033)
(14)
14 3
1,456
At 31 December 2017, the Group had undrawn borrowing facilities of US$ 1,361 million (31 December 2016: US$ 998 million). The Group complied with its debt covenants throughout 2017 and 2016.
The table below summarises maturities of borrowings:
Year ended 31 December 2017 31 December 2016
US$m US$m Year ended, 31 December 2017 - 98
31 December 2018 26 632 31 December 2019 105 538 31 December 2020 248 110 31 December 2021 513 - 31 December 2022 414 - 31 December 2023 100 - 31 December 2024 50 -
Total 1,456 1,378
20. COMMITMENTS AND CONTINGENCIES
Commitments
Capital commitments
The Group’s budgeted capital expenditure commitments as at 31 December 2017 amounted to US$ 46 million (2016: US$ 64 million).
Social and infrastructure commitments
During the year ended 31 December 2016 the Group signed a memorandum with East -Kazakhstan Oblast Administration (local Kazakhstan government), where the Group (namely its subsidiaries Bakyrchik Mining Venture
LLC and Inter Gold Capital LLC) agrees to participate in financing of certain social and infrastructure development project of the region. During the year ended 31 December 2017 the Group paid US$ 2 million (2016: US$ 2 million) under this programme and the total social expense commitment as at 31 December 2017 amounts to US$ 28 million,
payable in the future periods as follows:
31 December 2017
US$m Within one year 2 From one to five years 22 Thereafter 4 Total 28
News release
Polymetal International plc 52
Forward sale commitments
The Group has certain physical gold and silver forward sale commitments which are priced at the prevailing market price, calculated with reference to the LBMA or LME gold price, which are accounted for as executed as the Group
expects to and has historically physically delivered into these contracts.
Operating leases: Group as a lessee
During the year ended 31 December 2017 the Group recognised US$ 7 million as operating lease expenses (2016:
US$ 5 million).
The land in the Russian Federation and Kazakhstan on which the Group’s production facilities are located is owned by the state. The Group leases this land through operating lease agreements, which expire in various years through
to 2058.
Future minimum lease payments due under non-cancellable operating lease agreements at the end of the period were as follows:
31 December 2017 31 December 2016 US$m US$m Within one year 3 2 From one to five years 5 3 Thereafter 4 2
Total 12 7
Contingencies
Operating environment
Emerging markets such as Russia and Kazakhstan are subject to different risks than more developed markets, including economic, political and social, and legal and legislative risks. Laws and regulations affecting businesses in Russia continue to change rapidly, tax and regulatory frameworks are subject to varying interpretations. The future
economic direction of Russia and Kazakhstan is heavily influenced by the fiscal and monetary policies adopted by the government, together with developments in the legal, regulatory, and political environment.
Taxation
Russian tax, currency and customs legislation is subject to varying interpretations, and changes, which can occur
frequently. Management’s interpretation of such legislation as applied to the transaction and activity of the companies of the Group may be challenged by the relevant regional and federal authorities and as a result, significant additional taxes, penalties and interest may be assessed. Fiscal periods remain open to review by the authorities in respect of
taxes for three calendar years preceding the year of review. Under certain circumstances reviews may cover longer periods.
During 2017 and 2016 the Group has been involved in a number of litigations in Russia, Kazakhstan and Armenia.
Management has identified a total exposure (covering taxes and related interest and penalties) of US$ 7 million in respect of contingent liabilities (2016: US$ 13 million), including US$ 5 million related to income tax (2016: US$ 4 million).
21. FAIR VALUE ACCOUNTING
The following table provides an analysis of financial instruments that are measured subsequent to initial recognition at
fair value, grouped into Levels 1 to 3 based on the degree to which the fair value is observable as follows:
Level 1 fair value measurements are those derived from quoted prices (unadjusted) in active markets for identical assets or liabilities;
Level 2 fair value measurements are those derived from inputs other than quoted prices included within level 1 that are observable for the asset or liability, either directly or indirectly; and
Level 3 fair value measurements are those derived from valuation techniques that include inputs for the asset or liability
that are not based on observable market data (unobservable inputs).
At 31 December 2017 and 31 December 2016, the Group held the following financial instruments:
News release
Polymetal International plc 53
31 December 2017 Level 1 Level 2 Level 3 Total
US$m US$m US$m US$m Receivables from provisional copper, gold and silver concentrate sales
Level 1 Level 2 Level 3 Total US$m US$m US$m US$m Receivables from provisional copper, gold and silver concentrate sales
- 35 - 35
Contingent consideration liability - - (76) (76)
- 35 (76) (41)
During the reporting periods, there were no transfers between Level 1 and Level 2.
The carrying values of cash and cash equivalents, trade and other receivables, trade and other payables and short -
term debt recorded at amortised cost approximate to their fair values because of the short maturities of these instruments. The estimated fair value of the Group’s debt, calculated using the market interest rate available to the Group as at 31 December 2017, is US$ 1,233 million, and the carrying value as at 31 December 2017 is US$ 1,456
million (see Note 19). Carrying values of the other long-term loans provided to related parties as at 31 December 2017 and 31 December 2016 approximated to their fair values.
Receivables from provisional copper, gold and silver concentrate sales
The fair value of receivables arising from copper, gold and silver concentrate sales contracts that contain provisional pricing mechanisms is determined using the appropriate quoted forward price from the exchange that is the principal active market for the particular metal. As such, these receivables are classified within Level 2 of the fair value hierarchy.
Contingent consideration liabilities
The table below sets forth a summary of changes in the fair value of the Group’s Level 3 financial liabilities for the year ended 31 December 2017:
31 December 2017 31 December 2016
Omolon Kyzyl Primorskoye Lichkvaz Kapan Komar Total Total
less current portion of contingent consideration liability (4) - - - (1) - (5) (14)
7 12 - 3 10 25 57 62
Omolon
In 2008, the Group recorded a contingent consideration liability related to the acquisition of 98.1% of the shares in JSC Omolon Gold Mining Company LLC (Omolon). The fair value of the contingent consideration liability was determined
using a valuation model which simulates expected production of gold and silver at the Kubaka mine and future gold and silver prices to estimate future revenues of Omolon. This liability is revalued at each reporting date based on 2% of the life-of-mine revenues with the resulting gain or loss recognised in the condensed consolidated income statement.
The liability recognised as at 31 December 2017 was US$ 11 million, including current portion of US$ 4 million.
News release
Polymetal International plc 54
Kyzyl
During the year ended 31 December 2014 the Group completed the acquisition of the Kyzyl gold project in Kazakhstan. The fair value of the related contingent consideration liability was estimated using the Monte Carlo model. The liability
was revalued at the 31 December 2017 using the same method with updated inputs as of reporting date and amounts to US$ 12 million (2016: US$ 19 million).
Primorskoye
During the year ended 31 December 2015 the Group recorded a contingent consideration liability related to the acquisition of 100% interest in Primorskoye. Deferred conditional cash consideration, which is determined as the highest of US$ 13,333 per tonne of contained silver equivalent (translating into US$ 0.415 per silver equivalent ounce)
based on the audited reserves estimate of the deposit, and US$ 8 million, was revalued at 31 December 2016 at US$ 8 million. Following the determination of the mineral resource estimate at March 2017, the deferred consideration was calculated at US$ 9.7 million and settled by 815,348 newly issued Polymetal International shares (Note 22).
Lichkvaz
During the year ended 31 December 2015 the Group completed the acquisition of Lichkvaz CJSC (Lichkvaz), the company owning the Lichkvaz exploration licence in Armenia (Note 2). The fair value of the related contingent
consideration liability is calculated using a valuation model which simulates expected production of metals and future gold, silver and copper prices to estimate future value of the metals in the actually extracted ore. The liability recognised at 31 December 2017 was US$ 3 million.
Kapan
During the year ended 31 December 2016 the Group completed the acquisition of DPMK, the company owning the Kapan mine and processing plant in Armenia (Note 2). The seller is entitled to receive a 2% NSR (Net Smelter Return)
royalty on future production from the Kapan Gold Mine capped at US$ 25 million. At the 31 December 2017, the fair value of the contingent consideration was estimated at US$ 11 million, including current portion of US$ 1 million.
Komar
On 1 August 2016 the Group completed the acquisition of Orion Minerals LLP, the holding company for the Komarovskoye Gold Deposit (“Komar”) in the Republic of Kazakhstan (Note 2). The seller is entitled to the contingent consideration that was determined based on the LOM model of the Komarovskoye mine and calculated using Monte
Carlo modelling. At the 31 December 2017, the fair value of the contingent consideration was estimated at US$ 25 million (2016: US$ 18 million), with increase due to growth in ore reserves and change in mine plan.
Assumptions used in the valuation of the Omolon, Kapan and Lichkvaz are consistent with those used in goodwil l
impairment test, such as long-term metal prices and discount rates. Estimated production volumes are based on life of mine plans and are approved by management as part of the long-term planning process.
Monte-Carlo modelling for Kyzyl and Komarovskoye contingent consideration liabilities was performed with following inputs:
Constant correlation between gold and share price: 86% (2016: 90%)
Dividend yield: 2%.
Nezhda Call Option
The Group has valued the Nezhda Call Option (Note 16) using the Black-Scholes option valuation model, with share price volatility assumption approximating to 30%. Exercise price of the option was assessed based on the project NPV,
calculated using Nezhda JORC ore reserves and mineral resources available and gold price and discount rates consistent with assumptions used for the goodwill impairment testing. The fair value of the option approximates to its cost of US$ 12 million as of 31 December 2017.
The Directors consider that a reasonably possible change in a valuation assumption would not have a material impact on the financial statements for contingent considerations payable.
Commodity forward contracts
The Group enters into forward contracts for the physical delivery of metals which will be priced according to the prevailing London Bullion Market Association or London Metal Exchange index. The Group’s policy is not to enter into
News release
Polymetal International plc 55
fixed priced contracts. The forward sales contracts qualify for the normal purchase/sales or “own use” exemption for accounting purposes and are outside the scope of IAS 39 Financial Instruments: Recognition and Measurement.
22. STATED CAPITAL ACCOUNT AND RETAINED EARNINGS
As at 31 December 2017, the Company’s issued share capital consisted of 430,115,480 ordinary shares (2016: 428,262,338 ordinary shares) of no par value, each carrying one vote. The Company does not hold any shares in
treasury (2016: none). The ordinary shares reflect 100% of the total issued share capital of the Company.
The movements in the Stated Capital account in the year were as follows:
Stated capital account
Stated capital account
no. of shares US$m Balance at 31 December 2015 424,650,138 1,969 Issue of shares in accordance with Deferred Share Awards plan 110,850 1 Issue of shares for Kapan (Note 2) 1,481,785 15 Issue of shares to acquire an additional 25% interest in Tarutin 898,875 14 Issue of shares for Saum Mining Company LLC (Note 2) 1,120,690 11 Balance at 31 December 2016 428,262,338 2,010
Issue of shares for Tarutin 893,575 10 Issue of shares for Primorskoye contingent consideration (Note 21) 815,348 10 Issue of shares in accordance with Deferred Share Awards plan 144,219 1
Balance at 31 December 2017 430,115,480 2,031
In January 2017 the Group increased its interest in Vostochny Basis LLC (holder of the licence for the Tarutinskoye copper deposit (Tarutin) by 25% (from 75% to 100%). The Group purchased the additional 25% from an unrelated
party for a consideration of US$ 10 million, payable through the issue of 893,575 new Polymetal International plc shares. The Group has previously determined that Vostochny Basis LLC meets the definition of a subsidiary and therefore it was consolidated from the date of the 25% share acquisition. The increase in interest in Tarutin was
recognised as an acquisition of the non-controlling interest and recognised interest within equity. As of 31 December 2017 and during the years ended 31 December 2017 and 31 December 2016 Tarutin did not give rise to a significant non-controlling interest to be presented within equity, income statement and statement of comprehensive income.
Reserves available for distribution to shareholders are based on the available cash in the Company under Jersey law. As Russian, Kazakh and Armenian legislation identifies the basis of distribution of the dividends as accumulated profit, the ability to distribute cash up to the Company from the Russian, Kazakh and Armenian operating companies will be
based on the statutory historical information of each stand-alone entity. Statutory financial statements in the Russian Federation are prepared in accordance with Russian accounting standards which differs from IFRS, while Kazakhstan and Armenia have adopted IFRS from 1 January 2006 and 1 January 2011, respectively. However, current legislation
and other statutory regulations dealing with distribution rights are open to legal interpretation; consequently, actual distributable reserves may differ from the amount of accumulated profit in accordance with statutory financial statements.
Weighted average number of shares: Diluted earnings per share
Both basic and diluted earnings per share were calculated by dividing profit for the year attributable to equity holders of the parent by the weighted average number of outstanding common shares before/after dilution respectively. The
calculation of the weighted average number of outstanding common shares after dilution is as follows:
Year ended
31 December 2017 31 December 2016
Weighted average number of outstanding common shares 429,880,907 426,135,182
Dilutive effect of share appreciation plan 5,830,775 259,452
Weighted average number of outstanding common shares after dilution
435,711,682 426,394,634
There were no adjustments required to earnings for the purposes of calculating the diluted earnings per share during the year ended 31 December 2017 the current financial year (year ended 31 December 2016: nil).
News release
Polymetal International plc 56
At 31 December 2017 the outstanding LTIP awards issued under 2014-2017 tranches represent dilutive potential ordinary shares with respect to earnings per share from continuing operations as these are in the money as of reporting date (31 December 2016: all tranches represent anti-dilutive potential ordinary shares as these were out of money).
The awards issued under management bonus deferral award plan are dilutive as of 31 December 2017 and 31 December 2016 being contingently issued shares and are included in the calculation of diluted EPS based on the weighted average number of shares that would be issuable if the end of the reporting period were the end of the
contingency period.
23. RELATED PARTIES
Year ended
31 December 2017 31 December 2016 US$m US$m Transactions with related parties Purchases of ore from equity method investments (Note 16) 38 11 Other sales recognised in other operating expenses, net 12 2 Year ended 31 December 2017 31 December 2016
US$m US$m Balances outstanding as of end of reporting period Loans accounted for as a part of net investment in joint venture 52 - Short-term loans provided to equity method investments 8 7 Long-term loans provided to equity method investments 6 1 Accounts receivable from equity method investments 8 - Interest receivable from equity method investments 2 1 Accounts payable to equity method investments 7 (4)
83 5
Related parties are considered to include shareholders, affiliates, associates, joint ventures and entities under common ownership and control with the Group and members of key management personnel.
During the year ended the Group has purchased ore from its associate GRK Amikan (Note 16) for the amount of US$ 35 million (2016: US$ 11 million) and its joint venture Aktogai Mys for the amount of US$ 3 million (2016: nil). Other sales recognised within other operating expenses are mainly represented by sales of machinery and equipment.
Carrying values of other long-term loans provided to related parties as at 31 December 2017 and 31 December 2016 approximate their fair values.
The amounts outstanding at the balance sheet dates are unsecured and expected to be settled in cash. No expense
has been recognised in the reporting period for bad or doubtful debts in respect of the amounts owed by related parties.
The remuneration of directors and other members of key management personnel during the periods was as foll ows:
Year ended 31 December 2017
31 December 2016 US$m US$m Share-based payments 2 2 Short-term benefits of board members 2 2 Short-term employee benefits 2 1
News release
Polymetal International plc 57
24. NOTES TO THE CONDENSED CONSOLIDATED STATEMENT OF CASH FLOWS
Year ended Year ended
Notes 31 December 2017 31 December 2016 US$m US$m
Profit before tax 443 564 Adjustments for:
Depreciation and depletion recognised in the statement of comprehensive income 214 155
Write-down of exploration assets and construction in progress 15 3 2
Write-down of metal inventories to net realisable value 17 16 21 Write-down of non-metal inventories to net realisable value 17 3 6 Additional mining taxes and VAT exposures, penalties and
accrued interest, net (8) (12) Provision for investment in Special Economic Zone 12 14 Share-based compensation 9 10 7 Finance costs 12 63 63 Finance income (4) (3) Loss on disposal of property, plant and equipment 10 1 1 Rehabilitation expenses - 1 Change in contingent consideration liability 21 (2) 22 Share of loss of associates and joint ventures 16 (3) - Foreign exchange gain 10 (65) Change in estimate of environmental obligations (4) (5) Other non-cash expenses 4 1
Movements in working capital
Increase in inventories (35) (50) (Increase)/Decrease in VAT receivable (31) 14 (Increase)/Decrease in trade and other receivables 14 (4) (Increase)/Decrease in prepayments to suppliers (6) 2 (Decrease)/Increase in trade and other payables (20) 17 Increase/(Decrease) in other taxes payable 10 (6)
Cash generated from operations 690 745 Interest paid (63) (61) Interest received 1 1 Income tax paid (95) (155)
Net cash generated by operating activities 533 530
Significant non-cash transactions during the year ended 31 December 2017 represent the issuance of shares to settle Primorskoye contingent consideration of US$ 10 million and the issuance of shares to acquire Tarutin non-controlling
interest of US$ 10 million (2016: the issuance of shares amounting to US$ 40 million in respect of the business combinations, the acquisition of assets and acquisition of non-controlling interest).
Cash flows related to exploration amounted to US$ 33 million for the year ended 31 December 2017 (2016: US$ 56
million). During the year ended 31 December 2017, the capital expenditure, related to the new projects, increasing the operating capacity amounts to US$ 173 million (2016: US$ 121 million).
25. SUBSEQUENT EVENTS
In February 2018 the Group has entered into a legally binding agreement to increase its stake in the Prognoz Serebro LLC (Note 10) from 5% to 50% through the acquisition of a further 45% ownership in the asset from Polar Acquisition
Limited (PAL) for a total consideration of US$ 72 million to be paid in Polymetal shares. 90% of the consideration shares will be subject to a lock-up period of 180 days. Additionally Polymetal commits to pay PAL a net smelter return (“NSR”) royalty of between 2 and 4% (pro rated by the 45% stake being acquired), which will be dependent on the
applicable statutory mineral extraction tax rate at the time when the asset enters commercial production. The royalty agreement is subject to an agreed cap. The transaction is expected to close in first quarter 2018, subject to receipt of the required regulatory approvals.
News release
Polymetal International plc 58
ALTERNATIVE PERFORMANCE MEASURES
Introduction
The financial performance reported by the Group contains certain Alternative Performance Measures (APMs) disclosed
to compliment measures that are defined or specified under International Financial Reporting Standards (IFRS). APMs should be considered in addition to, and not as a substitute for, measures of financial performance, financial position or cash flows reported in accordance with IFRS.
The Company believes that these measures, together with measures determined in accordance with IFRS, provide the readers with valuable information and an improved understanding of the underlying performance of the business.
APMs are not uniformly defined by all companies, including those in the Group’s industry. Therefore, the APMs used
by the Group may not be comparable to similar measures and disclosures made by other companies.
Purpose
APMs used by the Group represent financial KPIs for clarifying the true financial performance of the Company and
measuring it against strategic objectives, given the following background:
- Widely used by the investor and analyst community in mining sector and, together with IFRS measures, APMs
provide a holistic view of the Company;
- Applied by investors to assess earnings quality, facilitate period to period trend analysis and forecasting of
future earnings, understand performance through eyes of management;
- Highlight key value drivers within the business that may not be obvious in the financial statements;
- Ensure comparability of information between reporting periods and operating segments by adjusting for
uncontrollable or one-off factors which impact upon IFRS measures;
- Used internally by management to assess financial performance of the Group and its operating segments;
- Used in the Group’s dividend policy;
- Certain APMs are used in setting directors and management remuneration.
APMs and justification for their use
Group APM Closest equivalent IFRS measure
Adjustments made to IFRS measure
Rationale for adjustments
Underlying net earnings
Profit/(loss) for the financial period attributable to equity shareholders of the Company
Write-down of metal inventory to net realisable value (post-tax)
Foreign exchange (gain)/loss (post-tax)
Change in fair value of contingent consideration liability (post-tax)
Exclude the impact of key significant one-off non-recurring items and significant non-cash items (other than depreciation) that can mask underlying changes in core performance.
Adjusted EBITDA Profit/(loss) before income tax
Finance cost (net) Depreciation and depletion
Write-down of metal and non-metal inventory to net realisable value
Share based compensation
Bad debt allowance Net foreign exchange losses
Exclude the impact of certain non-cash element, either recurring or non-recurring, that can mask underlying changes in core operating performance, to be a proxy for operating cash flow generation.
News release
Polymetal International plc 59
Change in fair value of contingent consideration liability
Rehabilitation costs
Additional mining taxes, VAT, penalties and accrued interest
Net debt Net total of current and non-current borrowings
cash and cash equivalents
n/a Measures the Group’s net indebtedness that provides an indicator of the overall balance sheet strength.
Used by creditors in bank covenants.
Net debt/EBITDA ratio
No equivalent n/a Used by creditors, credit rating agencies and other stakeholders.
Free cash flow Cash flows from operating activity less free cash flow from investing activities
Less cash flows used in investing activities, excluding acquisition costs in business combinations and investments in associates and joint ventures
Reflect cash generating from operations after meeting existing capital expenditure commitments.
Measures the success of the Company in turning profit into cash through the strong management of working capital and capital expenditure.
Total cash costs (TCC)
Total cash operating costs
General, administrative & selling expenses
Depreciation expense Rehabilitation expenses
Write-down of
inventory to net realisable value
Intersegment unrealized profit elimination
Idle capacities and abnormal production costs
Exclude Corporate and Other segment and development assets
Calculated according to common mining industry practice using the provisions of Gold Institute Production Cost Standard.
Give a picture of a Company’s current ability to extract its resources at a reasonable cost and generate earnings and cash flows for use in investing and other activities.
All-in sustaining cash costs (AISC)
Total cash operating costs
General, administrative & selling expenses
AISC is based on total cash costs, and adds items relevant to sustaining production.
Include the components identified in World Gold Council’s Guidance Note
on Non‐GAAP Metrics – All‐In Sustaining Costs and All‐In Costs (June 2013), which is a non‐IFRS financial measure.
Provide investors with better visibility into the true cost of production.