March 27, 2006 March 27, 2006 V&R Training, Los Angeles V&R Training, Los Angeles Edina Bajrektarevi Edina Bajrektarevi ć ć Operations Engineer Operations Engineer POM POM – – OPM at OPM at American Transmission Co. American Transmission Co.
Transcript
March 27, 2006March 27, 2006V&R Training, Los AngelesV&R Training, Los Angeles
Edina BajrektareviEdina BajrektareviććOperations EngineerOperations Engineer
POM POM –– OPM at OPM at American Transmission Co.American Transmission Co.
ATC owns and operates transmission assets in portions of Wisconsin, Michigan, Minnesota and Illinois– 9,100 miles of transmission lines, 480 substations– Serves electric needs of more than 5 million people
ATC OverviewATC Overview
Core businessCore business
ATC is a private transmission-only company owned by 29 entities including investor-owned utilities, municipalities, municipal electric companies, electric cooperatives
Does not own generation or distribution assets
Ensures reliable operation of the transmission network
Provides adequate infrastructure to meet the needs of all customers
invested more than $1 billion in infrastructure in first 6 years
10-year plan outlines an additional $3 billion in investment
Operates independently, providing service without discrimination between customers
Use of POMUse of POM--OPM in OPM in System OperationsSystem Operations
Reliability Analysis to support Real-time Operations and Outage Coordination Process
Impact of Market Operations and System Bias
Voltage Stability P-V Curve Analysis
Power Transfer Analysis with Visualization Tool Implemented for N-1, N-2, …, N-K
Emergency Mitigation Measure Process
Transformer Maintenance Analysis to Support Asset Management Project Prioritization
Future Work and Recommendations
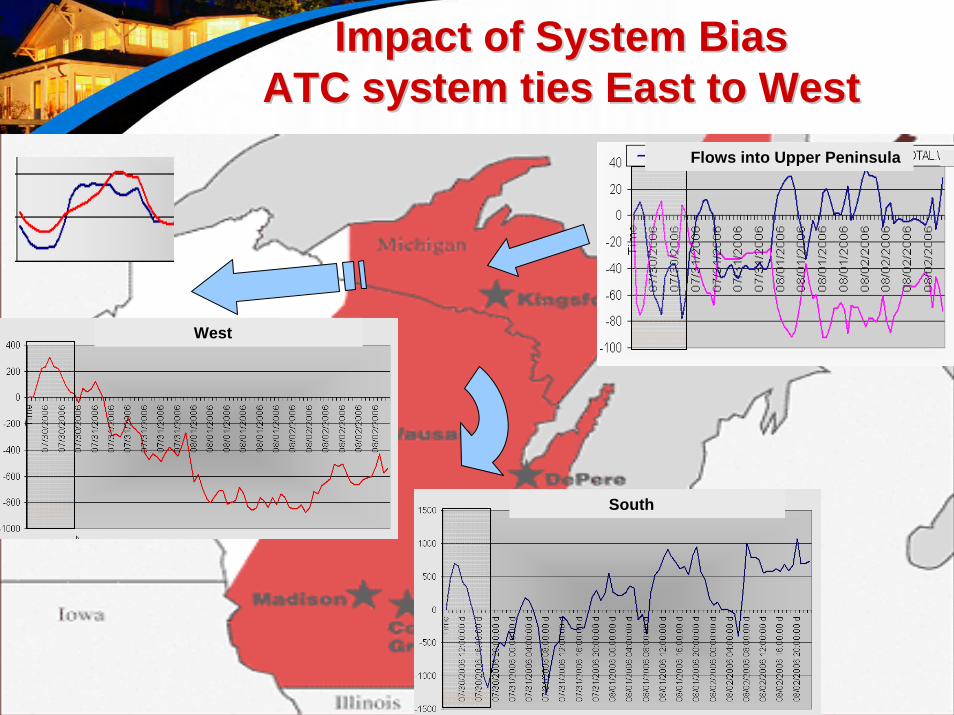
Impact of System Bias Impact of System Bias ATC system ties East to WestATC system ties East to West
West
South
Flows into Upper Peninsula
Impact of System Bias Impact of System Bias ATC system ties West to EastATC system ties West to East
West
Flows into Upper Peninsula
South
Impact of System Bias Impact of System Bias ATC system ties ATC system ties ““ThroughThrough”” FlowFlow
South
West
Flows into Upper Peninsula
Run P-V Curve Analysis for flowgates in ATC System sensitive to voltage collapse. Establish operating limits during different construction phases.
1. EMS cases provided every “X”minutes
2.PSSE Planning Cases
1. EMS cases provided every “X”minutes
2.PSSE Planning Cases
Input Output
If using real time cases to support Operations, verify the voltage contingencies identified by POM-OPM with AREVA Contingency Analysis Tool
Compare the POM-OPM P-V curve results with other tools (i.e, PSSE Flow South P-V Curves) Establish P-V Curve Analysis process in Operations (for different flowgates that are subject to voltage
collapse in ATC System)
PP--V Curve Analysis in V Curve Analysis in Operations by using POMOperations by using POM--OPMOPM
1. Develop PROJECT.prv
2. Use Advanced Mode – PV Script
1. Develop PROJECT.prv
2. Use Advanced Mode – PV Script
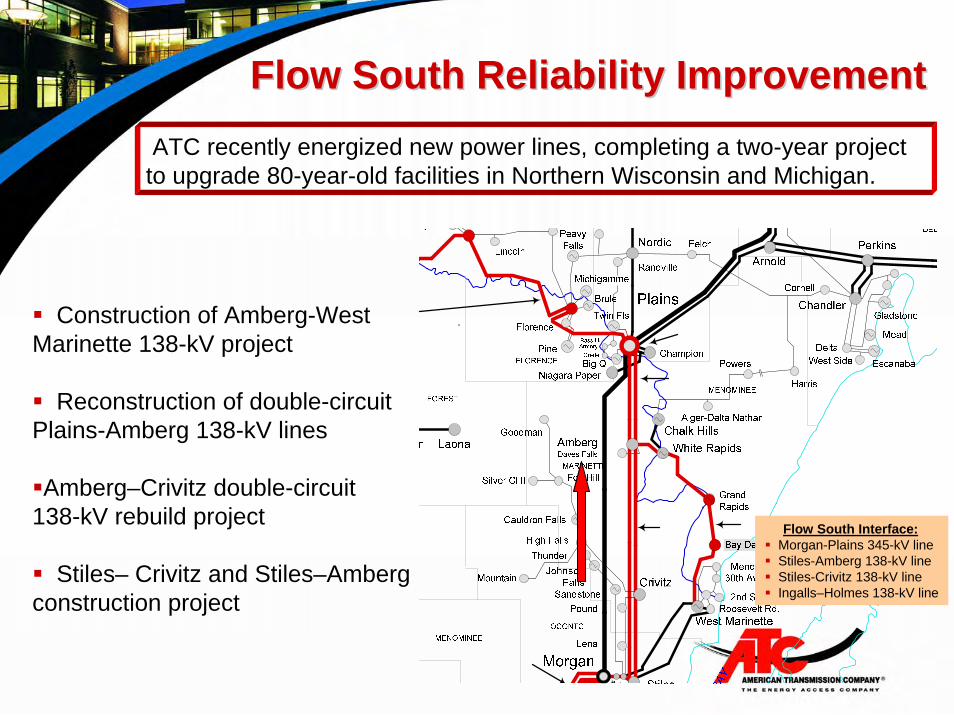
ATC recently energized new power lines, completing a two-year project to upgrade 80-year-old facilities in Northern Wisconsin and Michigan.
Construction of Amberg-West Marinette 138-kV project
Reconstruction of double-circuit Plains-Amberg 138-kV lines
Power Transfer Analysis and Power Transfer Analysis and NN--K Visualization Tool IndicatorK Visualization Tool Indicator
THERMALVOLTAGE 0.9 PU VIOLATIONVOLTAGE STABILITY
User can benchmark results by using EMS Power Flow and simulate the power transfer manually. Results should be identifcal if same input conditions are used (e.g., power compensation etc)
To evaluate “X Interface” and to provide System Operators at ATC with guidance (proposed Reliability Limits) as to possible system conditions that would warrant close observation of the Interfaceflows to ensure system reliability. Identify plans inclusive of emergency generation redispatch (and load curtailment as a last resort) that may guide operators during emergency conditions.
Analyze the impact of “X Interface Imports and Exports” on the ATC transmission system
Monitor the facilities 69 kV and higher in the ATC systemThermal Violations (Summer Emergency Ratings)Voltage Violations (0.9 – 1.1 pu)Voltage Stability
Identify critical N-1 and N-2 contingenciesRun script (developed by Mark Povolotskiy) in POM and
simulate power transfer by visualizing the output of contingencies tested
Run P-V Curve Analysis for the sensitive (critical) buses that may be impacted by increased transfer
Investigate possible IROLs for critical double contingenciesProvide guidelines to System Operators
Power Transfer Analysis and Power Transfer Analysis and NN--K Visualization Tool IndicatorK Visualization Tool Indicator
If first CTG occurs, the System Operator needs to prepare the system for the next contingency as soon as possible (or within 30 minutes if this is an IROL).
Example 1. Potential Loss of the Example 1. Potential Loss of the Power Plant due to Lake MossPower Plant due to Lake Moss
Tool Used: V&R POM-OPM
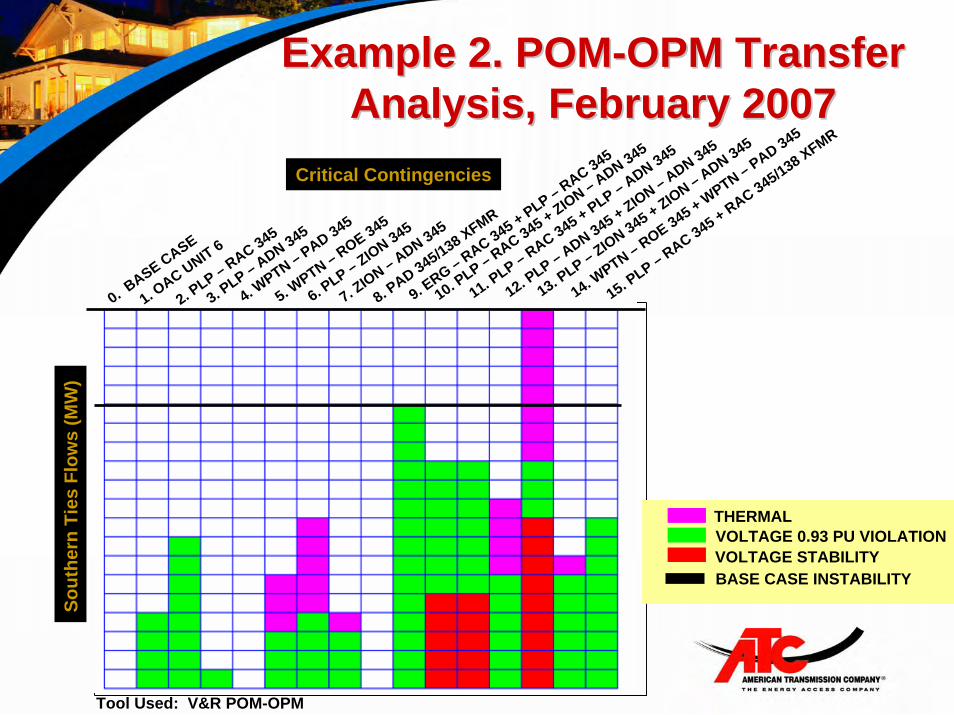
0. BASE CASE
1. OAC UNIT 6
2. PLP – RAC 345
3. PLP – ADN 345
4. WPTN – PAD 345
5. WPTN – ROE 345
6. PLP – ZION 345
7. ZION – ADN 345
8. PAD 345/138 XFMR
9. ERG – RAC 345 + PLP – RAC 345
10. PLP – RAC 345 + ZION – ADN 345
11. PLP – RAC 345 + PLP – ADN 345
12. PLP – ADN 345 + ZION – ADN 345
13. PLP – ZION 345 + ZION – ADN 345
14. WPTN – ROE 345 + W
PTN – PAD 345
15. PLP – RAC 345 + RAC 345/138 XFMR
THERMALVOLTAGE 0.93 PU VIOLATIONVOLTAGE STABILITY BASE CASE INSTABILITY
Sout
hern
Tie
s Fl
ows
(MW
)
Critical Contingencies
Example 2. POMExample 2. POM--OPM Transfer OPM Transfer Analysis, February 2007Analysis, February 2007
Tool Used: V&R POM-OPM
10. PLP – RAC 345 + ZION – ADN 345
11. PLP – RAC 345 + PLP – ADN 345
12. PLP – ADN 345 + ZION – ADN 345
13. PLP – ZION 345 + ZION – ADN 345
14. WPTN – ROE 345 + W
PTN – PAD 345
15. PLP – RAC 345 + RAC 345/138 XFMR
Impact of NImpact of N--K K CTGsCTGson voltages in the areaon voltages in the area
Sout
hern
Tie
s Fl
ows
(MW
)
Critical Contingencies
THERMALVOLTAGE 0.9 PU VIOLATIONVOLTAGE STABILITY BASE CASE INSTABILITY
1. Base Case + 631 Out 2. Base Case + 631 Out + 612 Out
The POM-OPM Transfer Mode Analysis and new Visualization tool (POM-OPM script) provides near real time thermal, voltage violation, and voltage stability analysis
The process quickly identifies reliability limits for “any existing critical Interface” as well as mitigation plan (generation redispatch and if in emergency – load shed recommendations) that can guide System Operators during different system conditions
The present process simulates transfer scenarios by evaluating 15 critical N-1 and N-2 contingencies for South Interface
N-1 and N-2 POM transfer analysis consistently shows same type of issues we are facing at the critical interfaces (confirmed with EMS study in real time)
Power Transfer Analysis and Power Transfer Analysis and NN--K Visualization Tool IndicatorK Visualization Tool Indicator
Benefits:
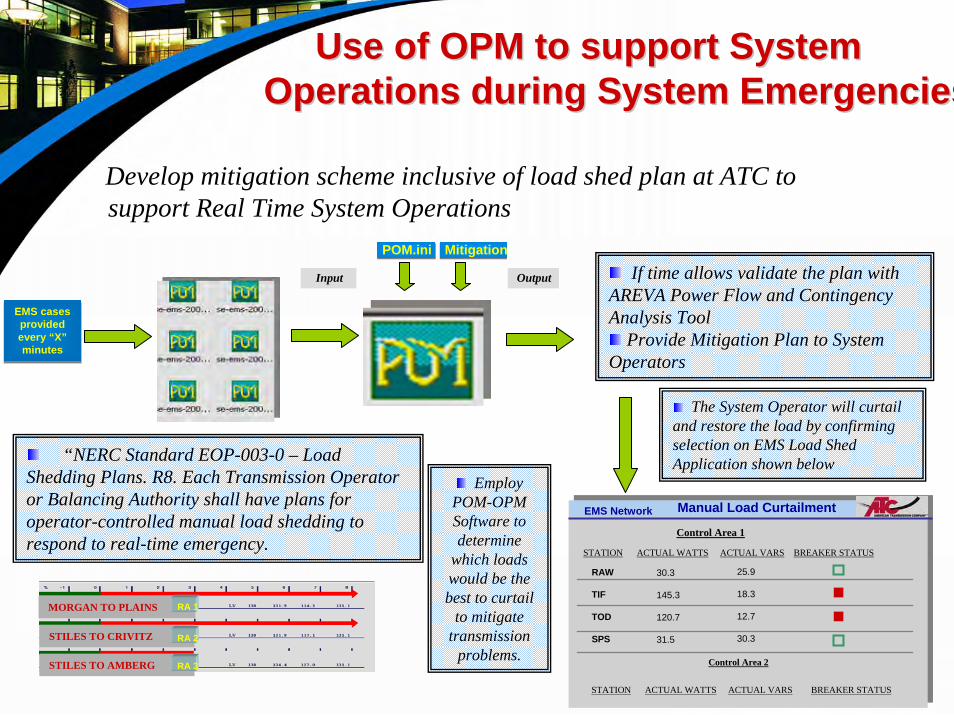
Develop mitigation scheme inclusive of load shed plan at ATC to support Real Time System Operations
EMS cases provided every “X”minutes
EMS cases provided every “X”minutes
Input
POM.ini Mitigation
Manual Load Curtailment
Control Area 1
STATION ACTUAL WATTS ACTUAL VARS BREAKER STATUS
Control Area 2
RAW
TIF
TOD
SPS
30.3
145.3
120.7
31.5
25.9
18.3
12.7
30.3
STATION ACTUAL WATTS ACTUAL VARS BREAKER STATUS
EMS Network
MORGAN TO PLAINS
STILES TO CRIVITZ
STILES TO AMBERG
RA 1
RA 2
RA 3
“NERC Standard EOP-003-0 – Load Shedding Plans. R8. Each Transmission Operator or Balancing Authority shall have plans for operator-controlled manual load shedding to respond to real-time emergency.
Output
Employ POM-OPM Software to determine
which loads would be the best to curtail
to mitigate transmission
problems.
The System Operator will curtail and restore the load by confirming selection on EMS Load Shed Application shown below
If time allows validate the plan with AREVA Power Flow and Contingency Analysis Tool
Provide Mitigation Plan to System Operators
Use of OPM to support System Use of OPM to support System Operations during System EmergenciesOperations during System Emergencies
Support Asset Management Decision Making Process by prioritizing transformer maintenance according to the reliability impact on transmission system
Perform the N-2 contingency analysis by utilizing the primary list of transformers in combination with the rest of the elements in the system (Number of CTG screening = 100,000)
Run POM to identify the following variables: Number of contingencies causing violationsThermal violations (and %)Voltage Violation (and min pu voltage)
Run OPM to identify load at risk for N-2 violations. Record the cumulative amount of load (and after any N-2 contingency
occurrence) necessary to alleviate all thermal, voltage violations, and voltage stability for each transformer in input list.
POM-OPM was able to provide quick answer for ranking various transformer maintenance projects based on as defined reliability criteria and its impact on the transmission system.
POM-OPM was able to overcome the difficulty in simultaneously combining the list of N-1 and critical N-1, N-K and to calculate all contingencies simultaneously.
POM-OPM proved to be a good tool for respecting the evaluation criteria defined in the asset management’s corporate goal.
ATC currently utilizes 4 licenses of POM-OPM to support real-time operations.
Voltage Stability Support to Real Time Operations
Investigating the calculation of dynamic Mvar reserve limits for one or more of the interfaces. Generator sensitivity analysis would help support this.
Modal analysis to identify critical load buses for P-V plots.
Currently enhancing the process to utilize POM-OPM load shed tool to help mitigate system emergencies.
Enhance the process of supporting Asset Management group in prioritizing the transformer maintenance work.
POM-OPM real-time CIM Conversion Project (EPRI).
Future WorkFuture Work
Have ability to calculate LSF’s and GSF’s for selected flowgate
Monitor generator Mvar reserves
One of the NERC recommendations in Northeast Blackout Report - August 2003 is to have VAR-Management process in the place. Having ability to monitor generator Mvarreserves with respect to changes in Net Load (it could be system load or specifically defined zone in the system) would improve the ability to monitor the system changes. It would be preferable to have this monitoring system defined for Base Case and for Contingencies
Compatibility with Real Time Energy Management System.
Ideas for ImprovementIdeas for Improvement
POM-OPM Remedial Action Result
How can Operator interpret this output?Use Bus Names instead of Bus Numbers
Load Sorting Option Selected. OPM load shed recommendations are listed as follows:
If loss of Critical N-K Contingency results in loss of load in the system (or island creation) and no violations of any type in therest of the system occurred POM should have ability to display (as a result) the following:
Which buses (lines) in the system are disconnected How much load is lost
Ideas for ImprovementIdeas for Improvement
Case1. Remove two lines from Saukville to Cedarburg: RemoveBranch 39177,39271,"1 "RemoveBranch 39177,39288,"1 "
Iterations 2
Minimum VM 0.940 (38951)Maximum VM 1.054 (39450)Maximum S Br 84.4% (38888 - 39283 1 )Time 0.2 s
I appreciate Your Attention! I appreciate Your Attention!