24
2017 popular annual financial report FOR YEAR ENDED JUNE 30, 2017 CITY OF ATLANTA, GA MAYOR KASIM REED
2017 popular annualfinancial reportFOR YEAR ENDED JUNE 30, 2017
CITY OF ATLANTA, GA
MAYOR KASIM REED

ABOUTthis report
Photo: Atlanta Metropolitan Area Skyline
The City of Atlanta’s Finance Department is proud to present this
Popular Annual Financial Report (PAFR). This is a short form report that
provides summarized information about the City’s financial activities. It is intended
to give readers an overview of the City and its finances. It is derived from,
but does not provide all the detailed information required by accounting standards
(Generally Accepted Accounting Principles or GAAP). It does not include
information on all of the City’s Funds or Component Units.
Detailed financial information, including the audited financial statements, is
available in the City’s Comprehensive Annual Financial Report, commonly
called the CAFR. The CAFR provides full disclosure of all material events in the
notes to the financial statements, as well as required supplementary information
and historical statistical information.
The CAFR and PAFR are available online at:
www.atlantaga.gov/Government/Departments/Finance/Controller
2017 POPULAR ANNUAL
FINANCIAL REPORT
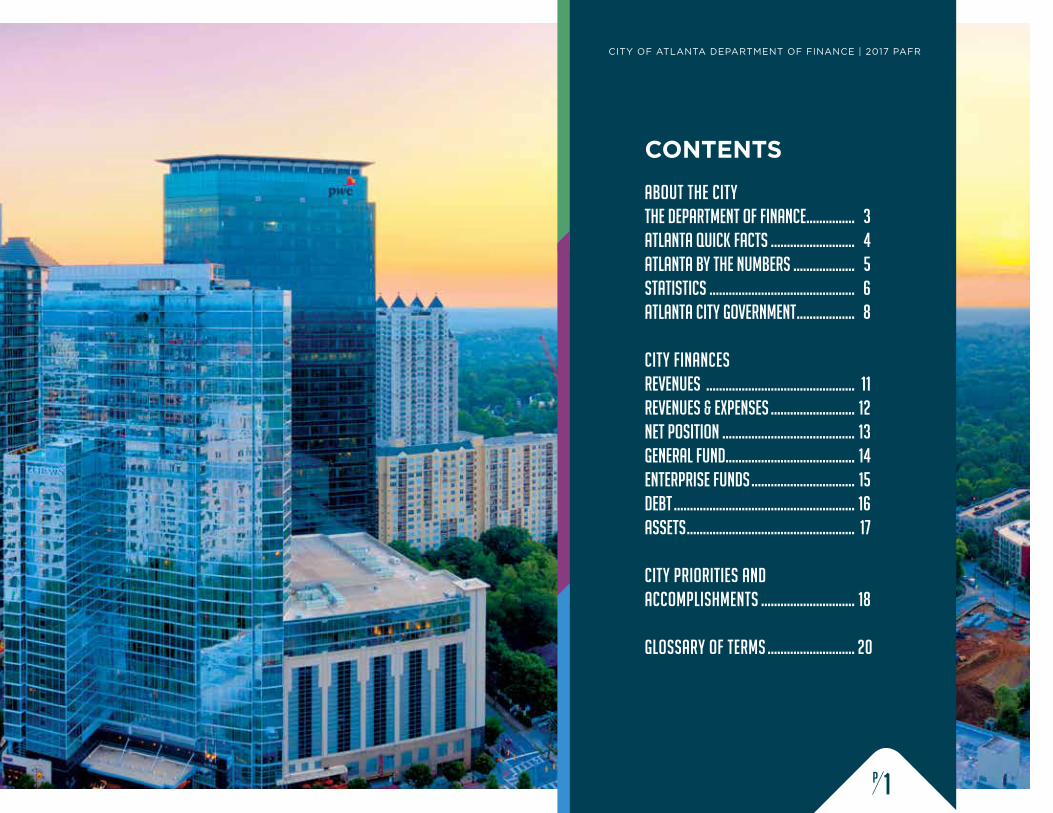
ABOUT THE CITYThe Department of Finance ............... 3Atlanta Quick Facts .......................... 4Atlanta by the Numbers ................... 5Statistics ............................................. 6Atlanta City Government .................. 8
CITY FINANCESRevenues .............................................. 11Revenues & Expenses .......................... 12Net Position ......................................... 13General Fund........................................ 14Enterprise Funds ................................ 15Debt ........................................................ 16Assets .................................................... 17
CITY PRIORITIES AND ACCOMPLISHMENTS ............................. 18
GLOSSARY OF TERMS ........................... 20
CONTENTS
CITY OF ATLANTA DEPARTMENT OF FINANCE | 2017 PAFR
1p

ABOUTthe city
2pPhoto: Ponce City Market Tower Terrace | Ben Rose Photography

3p
THE DEPARTMENT OF
FINANCEABOUT the city
CITY OF ATLANTA DEPARTMENT OF FINANCE | 2017 PAFR
missionExcellence in Municipal Financial Leadership Personified
The Department of Finance serves as a strategic
business partner to provide excellent service to
internal and external customers, deliver a clear and
concise picture of the City’s current and future
financial position and promote actions to achieve
the City’s priorities.
OUTSTANDING ACHIEVEMENT
IN PAFR REPORTING
The Government Finance Officers Association of
the United States and Canada (GFOA) presented
the Award for Outstanding Achievement in Popular
Annual Financial Reporting (PAFR) to the City of
Atlanta for its Popular Annual Financial Report for
the fiscal year ended June 30, 2016. The Award
for Outstanding Achievement in Popular Annual
Financial Reporting is a prestigious national
award recognizing conformance with the highest
national standards for preparation of state and local
government popular reports.
The Comprehensive Annual Financial Report
(CAFR), one of the supporting documents
for this report, also represents award-winning
work, having earned the GFOA’s Certificate
of Achievement for Excellence in Financial
Reporting for 32 consecutive years.
Photos (top to bottom): The Atlanta Ballet’s Nut Cracker; Midtown Business District; Atlanta Botanical Gardens; Atlanta Beltline
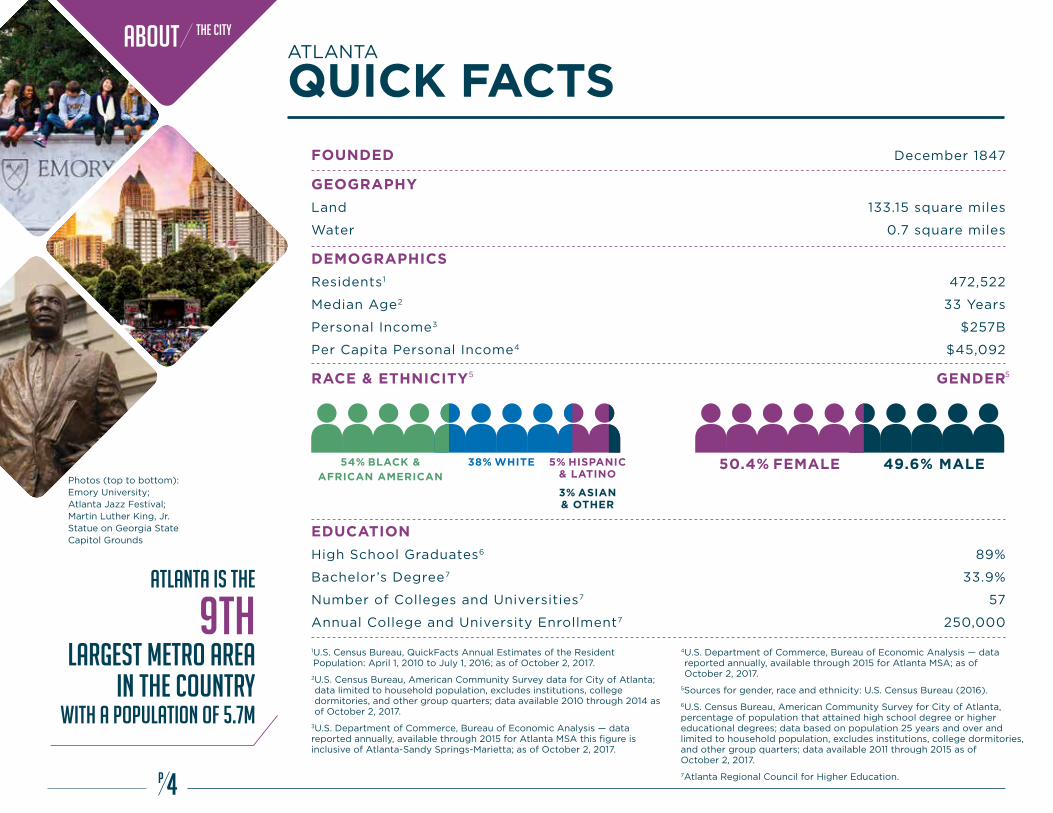
FOUNDED December 1847
GEOGRAPHY
Land 133.15 square miles
Water 0.7 square miles
DEMOGRAPHICS
Residents1 472,522
Median Age2 33 Years
Personal Income3 $257B
Per Capita Personal Income4 $45,092
RACE & ETHNICITY GENDER
EDUCATION
High School Graduates6 89%
Bachelor’s Degree7 33.9%
Number of Colleges and Universities7 57
Annual College and University Enrollment7 250,000
4p
ATLANTA
QUICK FACTSABOUT the city
49.6% MALE50.4% FEMALE54% BLACK & AFRICAN AMERICAN
38% WHITE 5% HISPANIC & LATINO
3% ASIAN & OTHER
1 U.S. Census Bureau, QuickFacts Annual Estimates of the Resident Population: April 1, 2010 to July 1, 2016; as of October 2, 2017.
2 U.S. Census Bureau, American Community Survey data for City of Atlanta; data limited to household population, excludes institutions, college dormitories, and other group quarters; data available 2010 through 2014 as of October 2, 2017.
3U.S. Department of Commerce, Bureau of Economic Analysis — data reported annually, available through 2015 for Atlanta MSA this figure is inclusive of Atlanta-Sandy Springs-Marietta; as of October 2, 2017.
4 U.S. Department of Commerce, Bureau of Economic Analysis — data reported annually, available through 2015 for Atlanta MSA; as of October 2, 2017.
5Sources for gender, race and ethnicity: U.S. Census Bureau (2016).
6U.S. Census Bureau, American Community Survey for City of Atlanta, percentage of population that attained high school degree or higher educational degrees; data based on population 25 years and over and limited to household population, excludes institutions, college dormitories, and other group quarters; data available 2011 through 2015 as of October 2, 2017.
7Atlanta Regional Council for Higher Education.
Photos (top to bottom): Emory University; Atlanta Jazz Festival; Martin Luther King, Jr. Statue on Georgia State Capitol Grounds
atlanta is the
9TH largest metro area
in the country with a population of 5.7M
5 5
5p
ATLANTA BY THE
NUMBERSABOUT the city
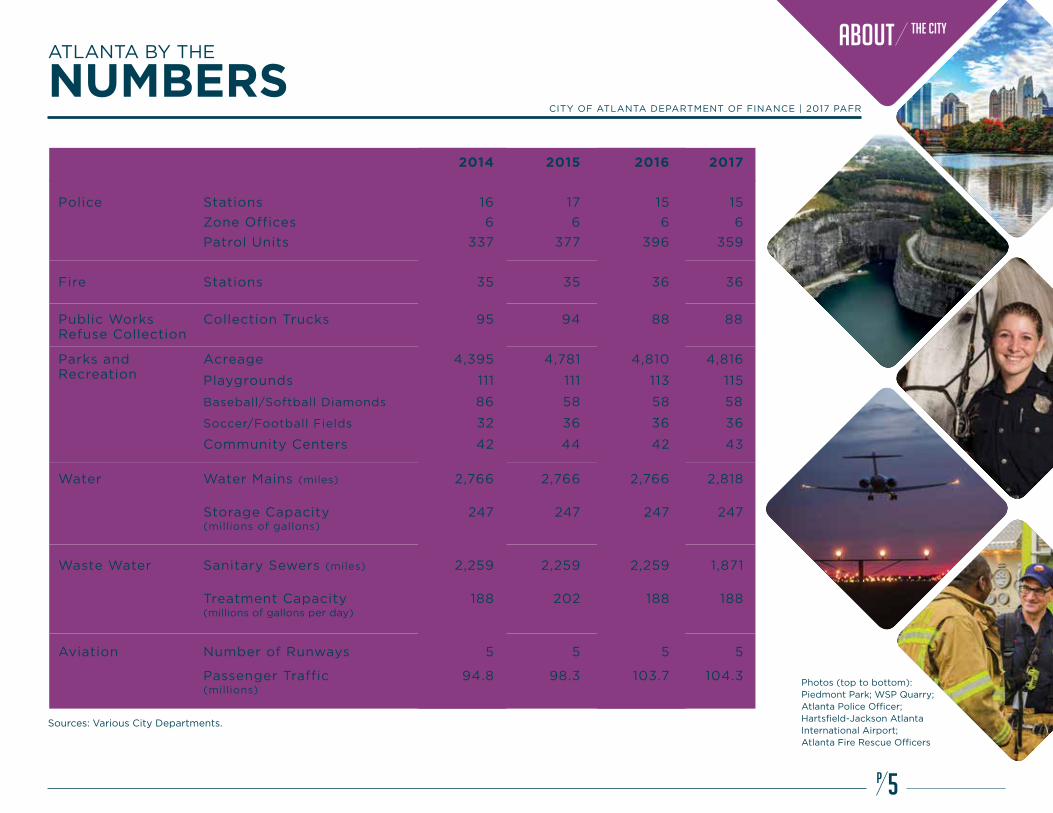
2014 2015 2016 2017
Police Stations 16 17 15 15
Zone Offices 6 6 6 6
Patrol Units 337 377 396 359
Fire Stations 35 35 36 36
Public Works Collection Trucks 95 94 88 88
Parks and Acreage 4,395 4,781 4,810 4,816
Playgrounds 111 111 113 115
Baseball/Softball Diamonds 86 58 58 58
Soccer/Football Fields 32 36 36 36
Community Centers 42 44 42 43
Water Water Mains (miles) 2,766 2,766 2,766 2,818
Storage Capacity 247 247 247 247 (millions of gallons)
Waste Water Sanitary Sewers (miles) 2,259 2,259 2,259 1,871
Treatment Capacity 188 202 188 188 (millions of gallons per day)
Aviation Number of Runways 5 5 5 5
Passenger Traffic 94.8 98.3 103.7 104.3 (millions)
Recreation
Refuse Collection
Sources: Various City Departments.
CITY OF ATLANTA DEPARTMENT OF FINANCE | 2017 PAFR
Photos (top to bottom): Piedmont Park; WSP Quarry; Atlanta Police Officer; Hartsfield-Jackson Atlanta International Airport; Atlanta Fire Rescue Officers

6p
STATISTICS
UNEMPLOYMENT RATES
City of Atlanta unemployment rate has seen a steady decline
since 2013. The unemployment rate in Atlanta in 2013 was
7.2% and is now 2.4% lower at 4.8% as of June 2017.
Source: U.S. Dept of Labor, Bureau of Labor Statistics. This figure is inclusive of Atlanta-Sandy Springs-Marietta.
POPULATION/GROWTH RATES
Atlanta City population continues to steadily increase and remains
the 9th largest metropolitan area in the country growing by
approximately 1.9% between 2015 and 2016. The Atlanta area
has gained a reputation as an ever-changing international city
with much more urban revitalization and growth in central metro
counties. Drawn by job opportunities, a reasonable cost of living
and warm weather, hundreds of thousands of people moved
to metro Atlanta in the last five years, increasing the region’s
population to 5.7M, according to U.S. Census estimates.
Source: U.S. Census Bureau, QuickFacts population estimate 2016.
EMPLOYMENT BY INDUSTRY
The estimated average annual employment, categorized
by industry for the City in 2016, is reflected in this table.
The highest area of employment was in Transportation,
Trade, Professional, Business and Health Services.
Source: Georgia Department of Labor, Industry Mix Analysis.
INDUSTRY PERCENTAGE OF TOTAL EMPLOYMENTTrade, Transportation, and Utilities 22.4%Professional and Business services 19.7%Education and Health Services 12.6%Government 12.5%Leisure and Hospitality 11.1%Manufacturing 6.4%Other 15.3%
A t l a n t a U n i t e d S t a t e s
ABOUT the city
0
1
2
3
4
5
6
7
8
201720142013 2015 2016
4.80%
7.20%
6.80%
6.00%
4.40%
6.30%6.10%
5.30% 5.30%
4.90%
A s o f J u n e 3 0
0.0
0.5
1.0
1.5
2.0
2.5
3.0
2.75%
0.99%
1.69% 1.73% 1.86%
201620132012 2014 2015A s o f J u n e 3 0
0
1
2
3
4
5
6
7
8
201720142013 2015 2016
4.80%
7.20%
6.80%
6.00%
4.40%
6.30%6.10%
5.30% 5.30%
4.90%
A s o f J u n e 3 0
0.0
0.5
1.0
1.5
2.0
2.5
3.0
2.75%
0.99%
1.69% 1.73% 1.86%
201620132012 2014 2015A s o f J u n e 3 0

TOP 10 EMPLOYERS — 2016
Sources: Multiple City of Atlanta Departments
EMPLOYER TYPE OF BUSINESS EMPLOYEES % OF TOTAL CITY EMPLOYMENT
Delta Air Lines, Inc. Transportation 5,348 2.30%
The Coca-Cola Company Marketing and 4,256 1.83% One Coca Cola Manufacturing
Accenture LLP Consulting 2,159 0.93%
AT&T Services, Inc. Telecommunication 2,139 0.92%
The Coca-Cola Company Marketing and 1,737 Manufacturing 0.75%
Air Serv Corp. Transportation 1,733 0.75%
Cable News Network Media 1,732 0.75%
Turner Broadcasting Media/Entertainment 1,614 0.69% System, Inc.
Cap Gemini Consulting 1,516 0.65%
Atlanta Medical Center, Inc. Healthcare 1,425 0.61%
Total 23,659 10.18%
7p
STATISTICSCITY OF ATLANTA DEPARTMENT OF FINANCE | 2017 PAFR
ABOUT the city
Photos (top to bottom): World of Coca-Cola; Hartsfield-Jackson Atlanta International Airport; AT&T Office Building; CNN Studio Tours at CNN Center
Source: Total employment data from City of Atlanta, Office of Revenue, Business License Division.

8p
ATLANTA CITY
GOVERNMENT
The Atlanta City Council prides itself on being responsive to its citizens. If you have a comment or concern and would like to speak to a Council Member, please call (404) 330-6030.
approved by the Mayor and
City Council. The amounts
of anticipated revenues and
appropriated expenditures for
the annual budget are controlled
by the City Charter and various
ordinances adopted by the City
Council. Appropriations for
capital projects are approved by
the City Council principally
on an individual basis, when the
project is initially approved.
THE CITY COUNCIL The City’s policy-making and
legislative authority are vested
in a governing council (City
Council) consisting of fifteen
members and an elected
City Council President who
serves as presiding officer.
The City Council’s primary
responsibilities are adopting
ordinances, adopting the
budget, and setting policy
for the City. Working hand in
hand with Atlanta’s Mayor and
the members of the executive
branch, the Council plays a key
role in the budget process and
financial well-being of Atlanta.
The Mission of the City Council: To ensure that Atlanta is led by a groundbreaking, strong, and capable group of leaders
that work for the good of all citizens across the City.
BUDGET PROCESS Annual budgets are adopted for
the General Fund, Special Revenue
Funds, and Debt Service Funds,
with the level of legal budgetary
control established at the office
level by City Council. The City
is required to adopt a balanced
budget each year and maintain
budgetary controls to ensure
compliance with legal provisions
of the annual appropriated budget
CONSTITUTION The fifteen-member City Council
is elected on a non-partisan
basis. Twelve of the Council
Members are elected by district.
The Mayor, the remaining Council
Members and the Council
President are elected at large.
Council Members serve four-
year terms, as does the Mayor.
The Mayor is limited to two
consecutive terms. There are no
term limits for Council Members
or the Council President.
ABOUT the city
MAYOR KASIM REED

Atlanta Citizens Review Boards
Ethics Office
City Auditor’s Office
Worksource Atlanta
Invest Atlanta
Atlanta Beltline
Atlanta Housing Authority
9p
ORGANIZATIONAL
STRUCTURECITY OF ATLANTA DEPARTMENT OF FINANCE | 2017 PAFR
ABOUT the city
Photos (top to bottom): Municipal Court of Atlanta; Atlanta City Hall Exterior; Public Safety Headquarters; Atlanta City Hall Atrium
JUDICIAL AGENCIES MAYOR CITY COUNCIL
court operations chief operating officer
chief financialofficer
public defender
chief of staff
city attorney
solicitor
finance LawAtlanta Information Management
aviation
corrections
fire & Rescue services
human resources
parks, recreation & cultural affairs
planning & community development
police services
procurement
public works
watershed management
BOARDS & AUTHORITIES

cityfinances
10pPhoto: Mercedes-Benz Stadium
11p
REVENUEScity finances
CITY OF ATLANTA DEPARTMENT OF FINANCE | 2017 PAFR
Others
Solid Waste
Aviation
Watershed
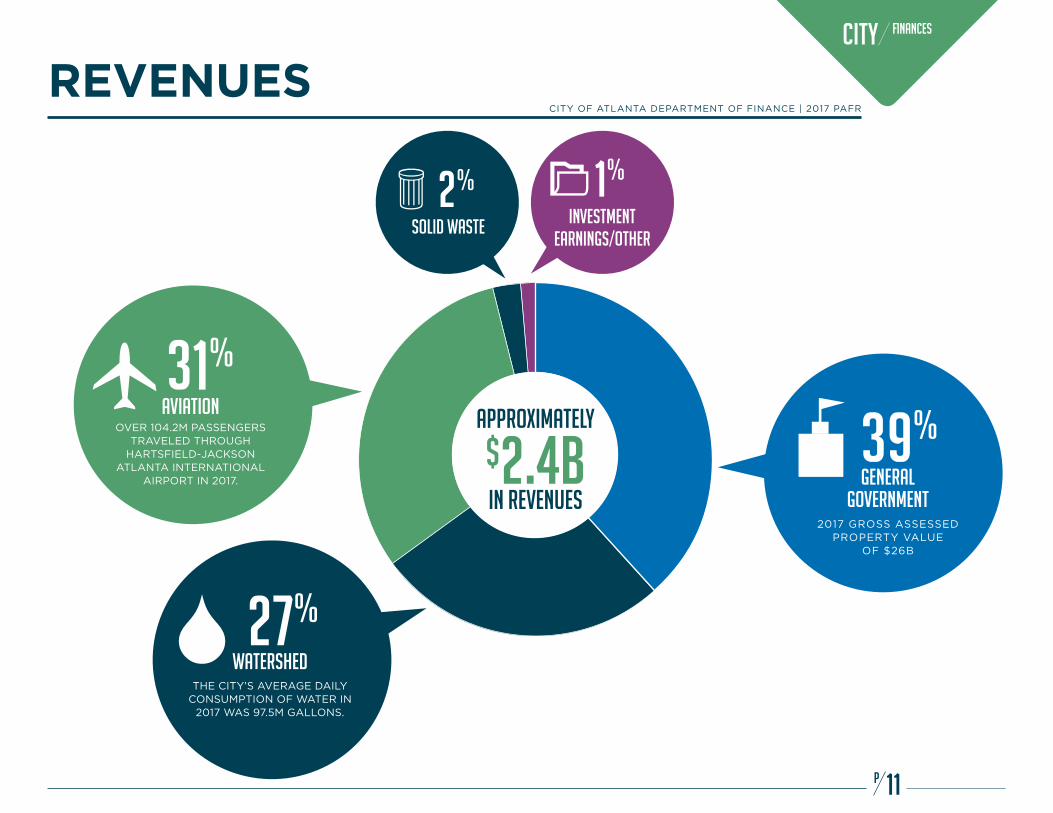
Government Aviation
Approximately
$2.4Bin Revenues
OVER 104.2M PASSENGERS TRAVELED THROUGH
HARTSFIELD-JACKSON ATLANTA INTERNATIONAL
AIRPORT IN 2017.
31% aviation
2017 GROSS ASSESSED PROPERTY VALUE
OF $26B
39% general
government
1%
investment earnings/other
2%
solid waste
THE CITY’S AVERAGE DAILY CONSUMPTION OF WATER IN
2017 WAS 97.5M GALLONS.
27%
watershed

REVENUES AND
EXPENSES
12p
The City’s financial activities in total are made
up of two broad classifications: governmental
and business-type activities. Additionally, there
are two main sources of Revenue for the City:
Program Revenues and General Revenues.
Program Revenues include charges for services
and General Revenues include property and sales
taxes. Revenue for the City in FY2017 totaled
$2.37B, an increase of $50.8M or 2.2% compared
to FY2016. Total expenses for the City totaled
$2.23B in FY2017, an increase of $222.6M or 11%
compared to FY2016.
city finances
(Top to bottom): Watershed Management Green Infrastructure at Adair Park, Wastewater Collection and Employees at Upper Proctor Creek
$
$
$
$
$
$
$
$
STATEMENT OF CHANGES IN NET POSITION AS OF JUNE 30, 2017 (IN THOUSANDS)
Total 2017
Total 2016
GovernmentalActivities
Business-typeActivities
REVENUES
Program Revenues 284,150 1,309,302 1,593,452 1,522,493
General Revenues 760,196 17,283 777,479 797,618
Total Revenues 1,044,346 1,326,585 2,370,931 2,320,111
EXPENSES
General Government 465,965 - 465,965 308,606
Public Safety 347,600 - 347,600 334,147
Water and Wastewater System
- 471,536 471,536 450,896
Department of Aviation - 673,027 673,027 640,793
Sanitation - 40,148 40,148 61,471
Other 233,369 6,835 240,204 219,998
Total Expenses 1,046,934 1,191,546 2,238,480 2,015,911
Increase in Net Position Before Transfers
(2,588) 135,039 132,451 304,200
Transfers In (Out) (34,496) 34,496 - -
Increase (Decrease) in Net Position
(37,084) 169,535 132,451 304,200
Net Position, Beginning of Period
(501,796) 7,475,447 6,973,651 6,669,451
Net Position, End of Period
(538,880) $7,644,982 7,106,102 6,973,651

13p
NET
POSITION
STATEMENT OF NET POSITION AS OF JUNE 30, 2017 (IN THOUSANDS)
The Statement of Net Position presents information
on all of the City’s assets and liabilities, deferred
outflows, and deferred inflows with the difference
between the above reported as Net Position. Net
Position is the difference between what the City
owns and what the City owes. Positive net position
balances indicate a measure of financial stability.
The City’s net position increased from $6.9B in
FY2016 to $7.1B in FY2017.
The City’s financial activities also include
Component Units which are legally separate
organizations for which the City is financially
accountable. Financial information for these
component units is reported
separately from the
financial information
presented for
the primary
government.
CITY OF ATLANTA DEPARTMENT OF FINANCE | 2017 PAFR
city finances
Photos (top to bottom): Atlanta Beltline; Georgia State University; The Center for Civil and Human Rights
Total 2017
Total 2016
GovernmentalActivities
Business-typeActivitiesREVENUES
Program Revenues 284,150 1,309,302 1,593,452 1,522,493
General Revenues 760,196 17,283 777,479 797,618
Total Revenues 1,044,346 1,326,585 2,370,931 2,320,111
EXPENSES
General Government 465,965 - 465,965 308,606
Public Safety 347,600 - 347,600 334,147
Water and Wastewater System
- 471,536 471,536 450,896
Department of Aviation - 673,027 673,027 640,793
Sanitation - 40,148 40,148 61,471
Other 233,369 6,835 240,204 219,998
Total Expenses 1,046,934 1,191,546 2,238,480 2,015,911
Increase in Net Position Before Transfers
(2,588) 135,039 132,451 304,200
Transfers In (Out) (34,496) 34,496 - -
Increase (Decrease) in Net Position
(37,084) 169,535 132,451 304,200
Net Position, Beginning of Period
(501,796) 7,475,447 6,973,651 6,669,451
Net Position, End of Period
(538,880) $7,644,982 7,106,102 6,973,651
$
$
$
$
$
$
$
$
Current Assets 1,091,543 3,765,249 4,856,792 4,732,662
Capital Assets, Net of Depreciation
1,042,996 11,211,876 12,254,872 12,029,625
Deferred Outflows of Resources
236,372 330,707 567,079 468,446
Total Assets and DeferredOutflows
2,370,911 15,307,832 17,678,743 17,230,733
Current Liabilities 231,176 775,977 1,007,153 663,889
Non-Current Liabilities 2,586,686 6,872,312 9,458,998 9,461,034
Deferred Inflows of Resources
91,929 14,561 106,490 132,159
Total Liabilities and Deferred Inflows
2,909,791 7,662,850 10,572,641 10,257,082
Net Invesment in Capital Assets
86,340 5,687,008 5,773,348 5,386,932
Restricted Net Position
744,874 1,069,578 1,814,452 1,681,277
Unrestricted Net Position
(1,370,094) 888,396 (481,698) (94,558)
Total Net Position (538,880) 7,644,982 7,106,102 6,973,651

city financesGENERAL
FUND
14p
WHERE THE MONEY GOES
WHERE THE MONEY COMES FROM
THIS Includes $194M in Unrestricted and $6M in Restricted fund balance
THE FY17 Total Fund Balance WAS
$200M the highest in
the city’s history.
u n r e s t r i c t e d R e s t r i c t e d
Photos (top to bottom): Atlanta Property on the Atlanta Beltline; Historic Fox Theatre in Midtown; APD Officer
GENERAL FUND — FUND BALANCE
31%
16%16%
18%
3%16%
6%
10%
6%2%
Other
Debt ServiceParks, Recreation and Cultural Affairs
Public Works
Corrections
Fire
Police
General Government
33%
30%
13%
Fines, forfeitures and penalties property taxes
local optionsales taxespublic utility,
alcohol & other taxes
licenses & permits
where the money comes from
where the money goes
FY13 FY16FY15FY14 FY17
142 153151138
200
Y e a r E n d i n g a s o f J u n e 3 0 , 2 0 1 7
0
50
100
150
200
fund
bal
ance
in
MIL
LIO
NS
$47M increase in unrestricted net position is due to the consolidation of the Building Permit Fund into General Fund.
Total Revenue $644M Total Expenses $597M
ENTERPRISE
FUNDS
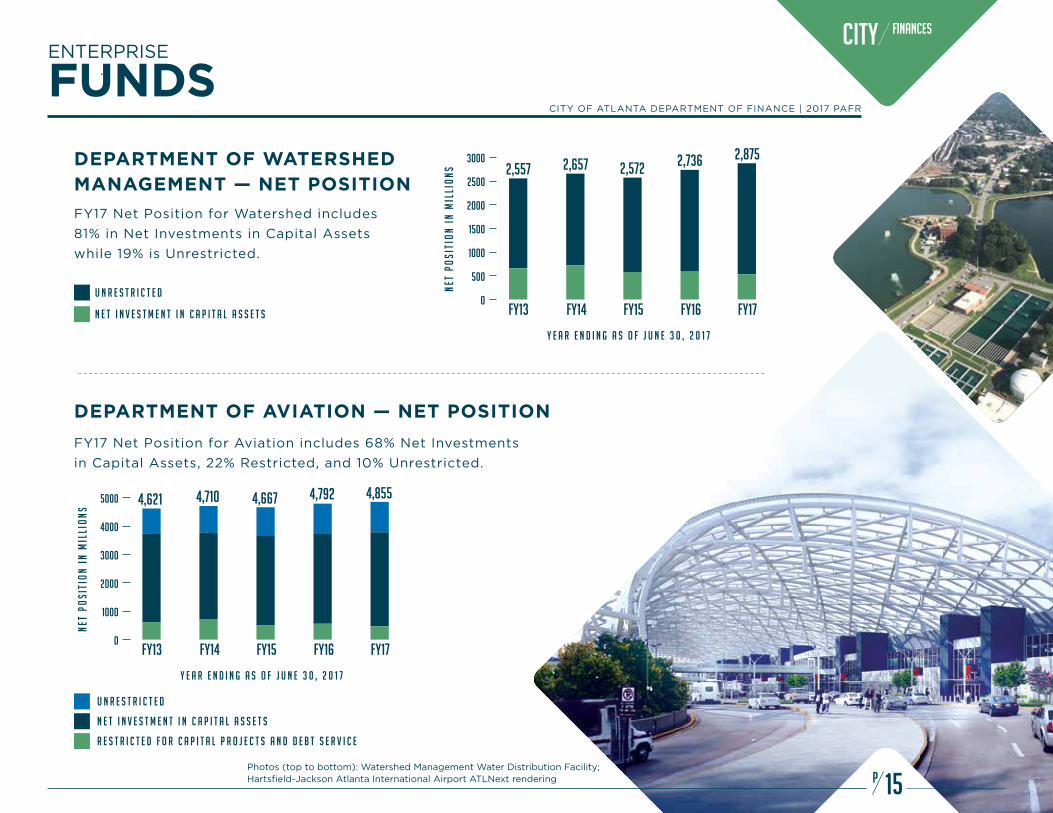
DEPARTMENT OF WATERSHED MANAGEMENT — NET POSITION
FY17 Net Position for Watershed includes
81% in Net Investments in Capital Assets
while 19% is Unrestricted.
DEPARTMENT OF AVIATION — NET POSITION
FY17 Net Position for Aviation includes 68% Net Investments
in Capital Assets, 22% Restricted, and 10% Unrestricted.
CITY OF ATLANTA DEPARTMENT OF FINANCE | 2017 PAFR
u n r e s t r i c t e d
N e t I n v e s t m e n t i n C a p i t a l A s s e t s
u n r e s t r i c t e d
N e t I n v e s t m e n t i n C a p i t a l A s s e t s
R e s t r i c t e d f o r c a p i t a l p r o j e c t s a n d d e b t s e r v i c e
city finances
15pPhotos (top to bottom): Watershed Management Water Distribution Facility; Hartsfield-Jackson Atlanta International Airport ATLNext rendering
FY13 FY16FY15FY14 FY17
2,657 2,7362,5722,5572,875
Y e a r E n d i n g a s o f J u n e 3 0 , 2 0 1 7
0
500
1000
1500
2000
2500
3000
NET
POSI
TIO
N IN
MIL
LIO
NS
FY13 FY16FY15FY14 FY17
142 153151138
Y e a r E n d i n g a s o f J u n e 3 0 , 2 0 1 7
0
1000
2000
3000
4000
5000
NET
POSI
TIO
N IN
MIL
LIO
NS
4,710 4,7924,6674,621 4,855

DEBT
16p
city finances
The City’s long-term debt, including capital leases,
at June 30, 2017 totaled
$7.6Ba net decrease of $102m or 1.3% from the prior year’s balance of $7.7b
Photo: Ariel View of the Atlanta Metropolitan Area
GovernmentalActivities30-Jun-17
Business-typeActivities30-Jun-17
Total As of30-Jun-17
Total As of 30-Jun-16
$
$
$
$
$
$
$
$
LONG-TERM DEBT (IN THOUSANDS)
General Obligation and Annual Bonds 350,285 - 350,285 357,955
Premium on Bonds 33,773 - 33,773 37,668
Certificate of Participation 29,780 - 29,780 32,160
Deferred Issuance Premiums 3,924 - 3,924 4,729
SWMA Revenue Refunding Bonds 9,360 - 9,360 10,980
Limited Obligation Bonds 526,535 - 526,535 471,830
Premium on Bonds 20,267 - 20,267 6,532
Section 108 Loans 660 - 660 930
Other General Long-term Obligations 47,774 - 47,774 62,829
Intergovernmental Agreements-AHOI 376,552 - 376,552 343,455
Notes Payable 2,054 - 2,054 4,016Commercial Paper - - - -
Water and Wastewater Revenue Bonds - 2,740,300 2,740,300 2,814,455
Premium on Bonds - 234,491 234,491 209,685GEFA Notes Payable - 176,874 176,874 168,222Airport Facilities Revenue Bonds - 2,580,645 2,580,645 2,580,645 2,702,125
Issuance Premiums - 127,339 127,339 143,436
Bond Anticipation Notes - 300,000 300,000 300,000
Parking Deck - 15,605 15,605 -
Deferred Issuance Premiums - 2 ,191 2,191 -
City Plaza - 9,230 9,230 9,465 Deferred Issuance Premiums - 1,086 1,086 1,215
Capital Leases 23,544 7,143 30,687 40,464
Total 1,424,508 6,194,904 7,619,412 7,722,151

17p
The Standard & Poor’s rating service, Moody’s Investors service and Fitch ratings have all upgraded
the City of Atlanta’s general obligation debt over the last 8 years. In June 2017, Moody’s Investors
Service upgraded the City of Atlanta’s Water and Wastewater Revenue Bonds from Aa3 to Aa2.
The upgraded credit ratings are a sign of confidence in the strong financial position of the City and
can impact the bottom line by reducing the cost of borrowing for new infrastructure. The upgrades
represent the highest credit rating the City of Atlanta has had in more than two decades.
CITY OF ATLANTA DEPARTMENT OF FINANCE | 2017 PAFR
city finances
Photos (top to bottom): Ponce City Market; ATLNext construction at Hartsfield-Jackson Atlanta International Airport; New Underground Atlanta Development Rendering
Photo: Ariel View of the Atlanta Metropolitan Area
CITY OF ATLANTA MUNICIPAL BOND RATINGS
Moody’s InvestorServices
Standard &Poor’s
Fitch
General Obligation Bonds
Water and Wastewater Revenue Bonds
Hartsfield-Jackson Atlanta International AirportRevenue Bonds
ASSETSCAPITAL ASSETS (IN THOUSANDS)
GovernmentalActivities30-Jun-17
Business-typeActivities30-Jun-17
Total As of30-Jun-17
Total As of 30-Jun-16
Land
Land Improvements
Buildings & BuildingImprovements
Other Propertyand Equipment
Infrastructure
ConstructionIn Progress
Total
208,721
20,022
278,925
88,723
354,667
95,938
1,042,996
$
$
$
$
$
$
$
$
1,215,872
1,922,744
7,268,382
278,411
358,927
985,289
12,029,625
993,051
1,822,814
6,829,097
278,926
-
1,287,988
11,211,876
1,201,772
1,842,836
7,108,022
343,649
354,667
1,383,926
12,234,872
Aa1
Aa2
Aa3
AA+
AA-
AA-
AA+
A+
A+

citypriorities &
accomplishments
18p
a safe citypublic safety
a financially strong cityfiscal accountability and
efficient government
a caring citycenters of hope and
the mayor’s youth program
a world class citybusiness growth,
tourism and conventions
a leading citytransportation,
sustainability and greenspace
THE REED COMMITMENT
Photo: Atlanta Metropolitan Area Skyline
19p
CITY PRIORITIES AND
ACCOMPLISHMENTSCITY OF ATLANTA DEPARTMENT OF FINANCE | 2017 PAFR
prioritiespriorities & accomplishments
Photos (top to bottom): Hartsfield-Jackson Atlanta International Airport; Westside Trail Opening Event; Renovated Hawks Court at Coan Park; MARTA Train
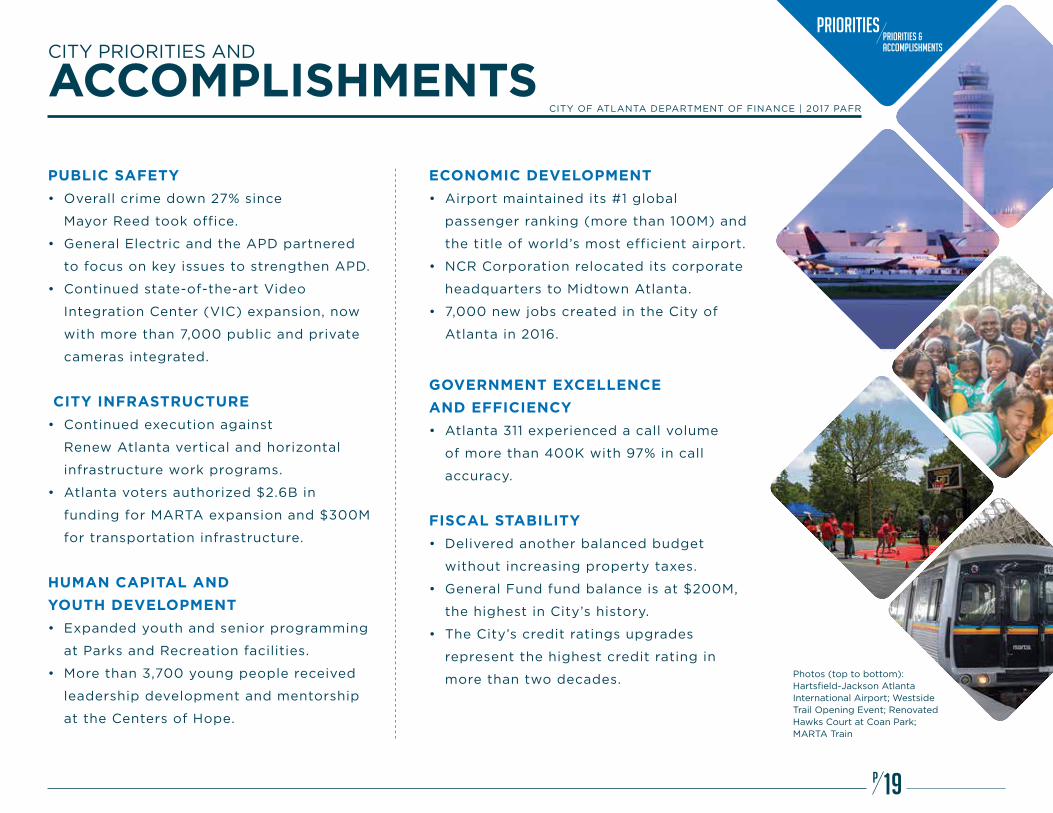
PUBLIC SAFETY
• Overall crime down 27% since
Mayor Reed took office.
• General Electric and the APD partnered
to focus on key issues to strengthen APD.
• Continued state-of-the-art Video
Integration Center (VIC) expansion, now
with more than 7,000 public and private
cameras integrated.
CITY INFRASTRUCTURE
• Continued execution against
Renew Atlanta vertical and horizontal
infrastructure work programs.
• Atlanta voters authorized $2.6B in
funding for MARTA expansion and $300M
for transportation infrastructure.
HUMAN CAPITAL AND
YOUTH DEVELOPMENT
• Expanded youth and senior programming
at Parks and Recreation facilities.
• More than 3,700 young people received
leadership development and mentorship
at the Centers of Hope.
ECONOMIC DEVELOPMENT
• Airport maintained its #1 global
passenger ranking (more than 100M) and
the title of world’s most efficient airport.
• NCR Corporation relocated its corporate
headquarters to Midtown Atlanta.
• 7,000 new jobs created in the City of
Atlanta in 2016.
GOVERNMENT EXCELLENCE
AND EFFICIENCY
• Atlanta 311 experienced a call volume
of more than 400K with 97% in call
accuracy.
FISCAL STABILITY
• Delivered another balanced budget
without increasing property taxes.
• General Fund fund balance is at $200M,
the highest in City’s history.
• The City’s credit ratings upgrades
represent the highest credit rating in
more than two decades.

GLOSSARY OF
TERMS
20p
AHOI Atlanta Housing Opportunity, Inc.
APSJFAAtlanta Public Safety and Judicial Facilities Authority
ASSETS What the City owns.
BUSINESS-TYPE ACTIVITIES Activities financed through fees charged to external parties. Includes Hartsfield-Jackson Atlanta International Airport, the Department of Watershed Management,Sanitation, and other non-major business-type activities, including Underground Atlanta.
CIP Construction-In-Progress
COMPONENT UNITS Legally separate organizations for which the City is financially accountable. Includes the Atlanta Development Authority (Invest Atlanta), Atlanta Housing Opportunity Inc., The Atlanta Fulton County Recreation Authority and the Atlanta Urban Redevelopment Agency (AURA).
DEFERRED INFLOW OF RESOURCES An acquisition of net position by the government that is applicable to a future reporting period.
DEFERRED OUTFLOW OF RESOURCES A consumption of net position by the government that is applicable to a future reporting period.
DOA Department of Aviation
DWM Department of Watershed Management GEFA Georgia Environmental Finance Authority
GENERAL REVENUES General Revenues includes property and sales taxes. This is the primary form of funding for governmental funds.
GOVERNMENTAL ACTIVITIES Activities generally financed through taxes and intergovernmental revenues. Includes primary governmental functions like public safety, public works, parks and recreation, and general government. LIABILITIES What the City owes.
NET POSITION Difference between assets and liabilities.
PROGRAM REVENUES Program Revenues represents the City’s main source of funding (inflow of assets) and is made up mostly of charges for services (both governmental and business-type activities), but also includes operating and capital grants (state or federal).
SWMA Solid Waste Management Authority
Photos (top to bottom): Zoo Atlanta; ELEVATE; Parking Day Activity; Atlanta Botanical Gardens; High Musuem of Atlanta
terms glossary of

COMMENTS AND
QUESTIONSThe Department of Finance is committed to accomplishing the Mayor’s priorities and providing clear and transparent reporting of the City’s financial activities. We hope this report has been helpful in providing a brief overview of the City and its finances. Questions concerning any of the information provided in this report or requests for additional financial information should be addressed to:
City of Atlanta Department of FinanceAttention: Chief Financial Officer11100 City Hall Tower68 Mitchell St., SW Atlanta, Georgia 30303

produced by the City of Atlanta Department of Finance | 11100 City Hall Tower | 68 Mitchell St., SW | Atlanta, Georgia 30303 | web: www.atlantaga.gov | PH: (404) 330-6430
CARLA SMITH DISTRICT 1
KWANZA HALL DISTRICT 2
IVORY LEE YOUNG, JR. DISTRICT 3
CLETA WINSLOW DISTRICT 4
NATALYN MOSBY ARCHIBONG DISTRICT 5
CEASAR MITCHELL ATLANTA CITY COUNCIL, PRESIDENT
MEMBERS OF CITY COUNCIL
ALEX WAN DISTRICT 6
HOWARD SHOOK DISTRICT 7
YOLANDA ADREAN DISTRICT 8
FELICIA MOORE DISTRICT 9
C.T. MARTIN DISTRICT 10
KEISHA LANCE BOTTOMS DISTRICT 11
JOYCE M. SHEPERD DISTRICT 12
MICHAEL JULIAN BOND POST 1 AT-LARGE
MARY NORWOOD POST 2 AT-LARGE
ANDRE DICKENS POST 3 AT-LARGE
KASIM REED Mayor
J. ANTHONY BEARD CHIEF FINANCIAL OFFICER
DANIEL L. GORDON CHIEF OPERATING OFFICER
CANDACE L. BYRD CHIEF OF STAFF
CATHY HAMPTON CITY ATTORNEY
RHONDA DAUPHIN-JOHNSON MUNICIPAL CLERK


