Page 1
Population Characteristics, Habitat Utilization, and Movement
Patterns of Lake Sturgeon in the White River, Ontario
Andrew Ecclestone Fisheries Biologist
February, 2012
Anishinabek/Ontario Fisheries Resource Centre 755 Wallace Road, Unit 5 North Bay, ON, P1A 0E7
Phone: (705) 472-7888 Fax: (705) 472-6333 Email: [email protected]
www.aofrc.org
Page 2
i
Summary
The Anishinabek/Ontario Fisheries Resource Centre (A/OFRC), and various other
partners, have been conducting Lake Sturgeon research in the Pic River of northeastern Lake
Superior since 2006. From 2008 to 2010 a Lake Sturgeon radio telemetry study was undertaken
to identify critical habitat and monitor movement patterns in the Pic River (Ecclestone, 2011). In
July of 2010, the A/OFRC and Pukaskwa National Park partnered together to identify whether
Lake Sturgeon existed in the White River, which is approximately 10 km south of the Pic River
and protected by Pukaskwa National Park. Eight gill nets were set overnight and a total of 10
Lake Sturgeon were captured, indicating that Lake Sturgeon persisted in the White River and in
relatively good abundance. The presence of Lake Sturgeon in the White River was encouraging
as they were previously classified as extirpated from this system. Given this new evidence, the
A/OFRC and Parks Canada, with funding from the Ontario Ministry of Natural Resources (SAR
Stewardship Fund), initiated a Lake Sturgeon radio telemetry project in 2011 for the White
River. This objectives of this project were to asses baseline population characteristics, identify
critical habitat, and monitor Lake Sturgeon movement patterns and habitat utilization in the
White River.
Field work was conducted from May 20th to August 29th of 2011 when mean daily water
temperatures ranged from 10.92°C and 24.97°C. A total of 132 gill nets were set and 82 Lake
Sturgeon were captured, resulting in a CPUE of 0.62 sturgeon per 100’ net per day. The majority
of nets were set immediately below Chigamiwinigum Falls (4.5 km from Lake Superior), in
Stan’s Honey Hole (3.5 km from Lake Superior), at the S-bend (2.5 km from Lake Superior), or
near the mouth of the White River (0 km from Lake Superior). Once captured, physical attributes
were recorded and radio tags were surgically implanted into forty adult Lake Sturgeon that
exceeded 5 kg. Lake Sturgeon movements and habitat utilization were manually monitored
throughout the river by boat and by two automatic base station receivers that were located at the
mouth of the White River and near Chigamiwinigum Falls. A temperature data logger was also
present near Chigamiwinigum Falls, which is the most likely spawning site in the White River.
Lake Sturgeon growth parameters and CPUE were elevated in the White River compared
to other locations across its geographical range, however their condition factor and weight-length
relationship was comparable to other populations that have been studied. Habitat utilization and
Page 3
ii
movement patterns were comparable to observations in other spawning tributaries, whereby Lake
Sturgeon showed a strong preference for pool mesohabitats and decreased their movements as
water temperatures and GDD increased. Lake Sturgeon demonstrated a non-random distribution
in the White River and were frequently located immediately below Chigamiwinigum Falls and in
Stan’s Honey Hole. The overall rate of emigration from the White River to the Pic River, and
vice versa, was 15% and 10.4% respectively. Future studies in this Lake Sturgeon system should
employ larger and smaller mesh sizes and conduct habitat mapping and spawning assessments.
Additionally, two base stations in the White and Pic Rivers should continue to operate to monitor
rates of immigration and emigration between each system, which has not been well studied in the
literature. Finally, we conclude that the White River should be considered a priority tributary for
Lake Sturgeon rehabilitation in Lake Superior as it contains a healthy and fast growing
population that is ensured long-term protection from Pukaskwa National Park.
Acknowledgements This project was graciously funded through the Species at Risk Stewardship Program, which is
administered by the Ontario Ministry of Natural Resources (OMNR). Parks Canada and
Pukaskwa National Park provided additional funding and onsite logistical support for the project.
The A/OFRC and its board of directors also deserve recognition for their commitment and
dedication to Lake Sturgeon research in northeastern Lake Superior. Other project partners
included; Pic River First Nation, Pic Mobert First Nation, Fisheries and Oceans Canada (Sault
Ste. Marie), and Wawa district OMNR. This project would not have been possible without the
cumulative and collaborative efforts of each partner.
Page 4
iii
Table of Contents Summary …………………………………………………………………… i Acknowledgements …………………………………………………………………… ii Table of Contents …………………………………………………………………… iii List of Figures …………………………………………………………………… iv List of Tables …………………………………………………………………… v List of Appendices …………………………………………………………………… vi
1.0 Introduction …………………………………… 1 1.1 Study Background & Objectives …………………………………… 5 1.2 Study Area …………………………………… 6 2.0 Methods …………………………………… 7 2.1 Gill Netting …………………………………… 8 2.2 Radio Telemetry …………………………………… 9 2.3 Temperature Logger …………………………………… 12 2.4 Data Analysis …………………………………… 12 3.0 Results …………………………………… 14 3.1 Population Characteristics …………………………………… 16 3.2 Habitat Utilization & Movement Patterns …………………………………… 20 4.0 Discussion …………………………………… 31 4.1 Population Characteristics …………………………………… 31 4.2 Habitat Utilization & Movement Patterns …………………………………… 37 4.3 Conclusions & Future Directions …………………………………… 40 5.0 Appendix …………………………………… 42 6.0 Literature Cited …………………………………… 74
Page 5
iv
List of Figure Figure 1: Study area for the White River Lake Sturgeon project, with the four significant
areas that are frequently referred to throughout this report. Figure 2a: Size class frequency of captured Lake Sturgeon in the White River from 2010 and
2011. Figure 2b: Lake Sturgeon CPUE in different locations of the White River in 2011. Figure 3: Least-squares regression of log10WT x log10TL for Lake Sturgeon in the White
River. Figure 4: Mean body condition as measured by Fulton’s condition factor and the relative
condition factor for each year class of Lake Sturgeon that was captured in the White River. The area between the orange and blue lines represents the average value for the respective condition factor across the geographic distribution of Lake Sturgeon.
Figure 5: Mean length at age for captured Lake Sturgeon in the White River during 2011. Figure 6: Von Bertalanffy growth model for Lake Sturgeon in the White River (red line,
equation above chart) with the actual age and length of sampled individuals plotted in blue.
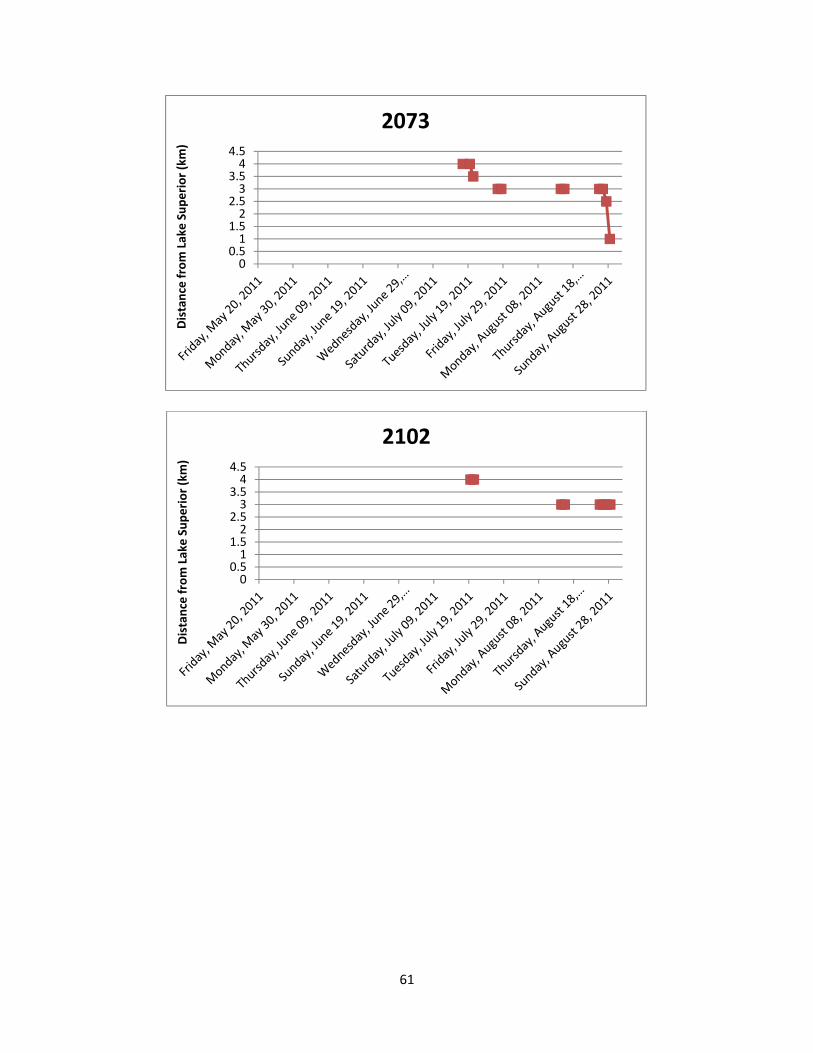
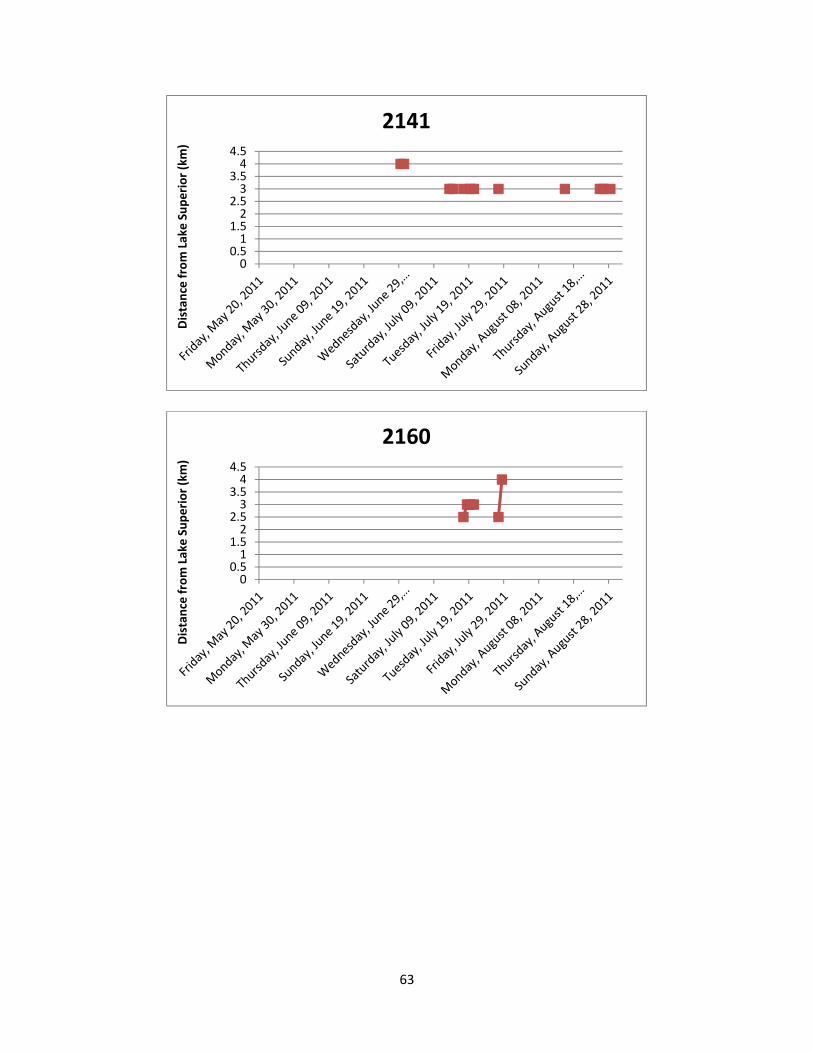
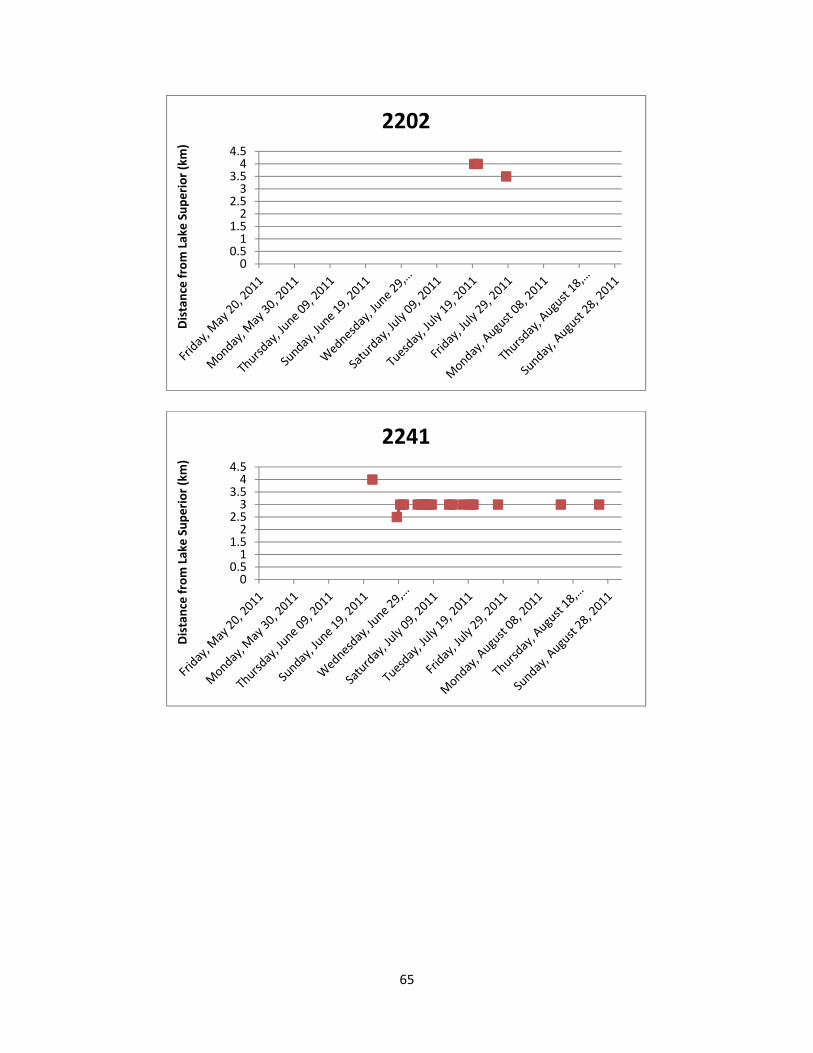
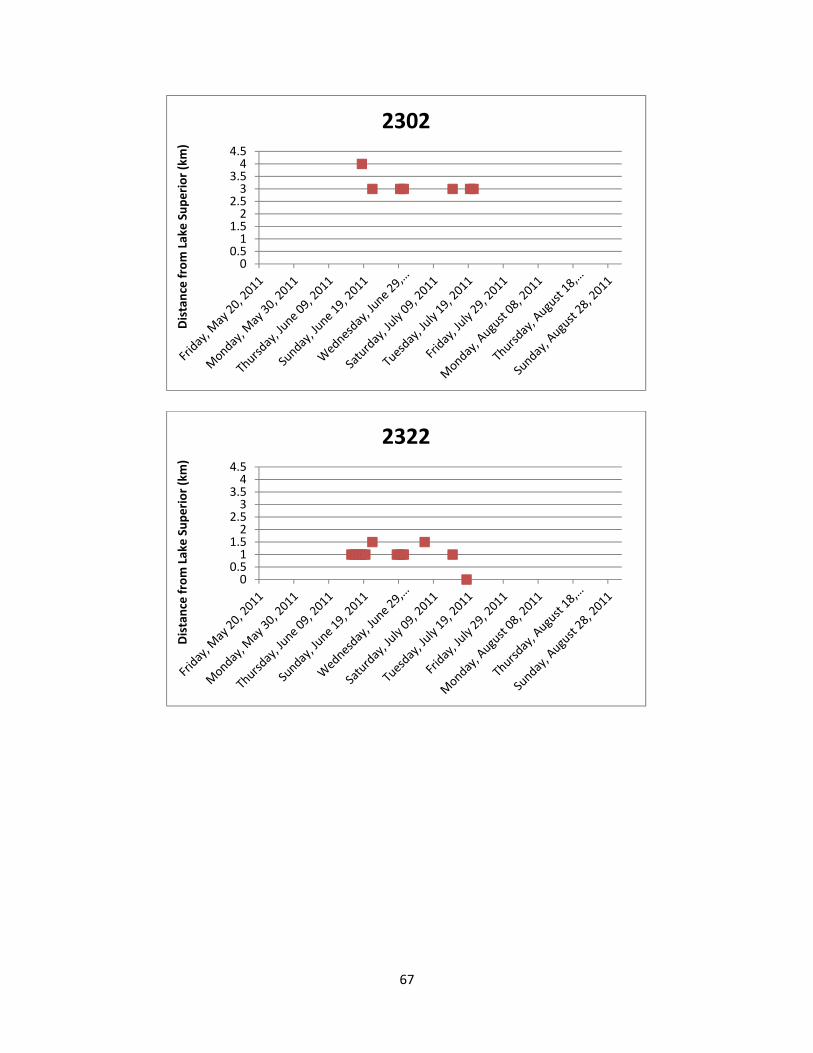
Figure 7: The location of Lake Sturgeon throughout the White River from May to August
of 2011. A total of 36 manual telemetry sweeps were performed and radio tagged Lake Sturgeon were detected a total of 617 times. Each colour/symbol represents the movements of one radio tagged individual throughout the sampling period.
Figure 8: The location of Lake Sturgeon in the two most frequently used locations of the
White River from May to August of 2011. Both locations are deep pools in excess of 16 m and serve as either foraging and/or staging habitat. Each colour/symbol represents the movements of one radio tagged individual throughout the sampling period.
Figure 9: The density of Lake Sturgeon in the White River from May to August of 2011
indicating that Lake Sturgeon were significantly clustered below Chigamiwinigum Falls and at Stan’s Honey Hole.
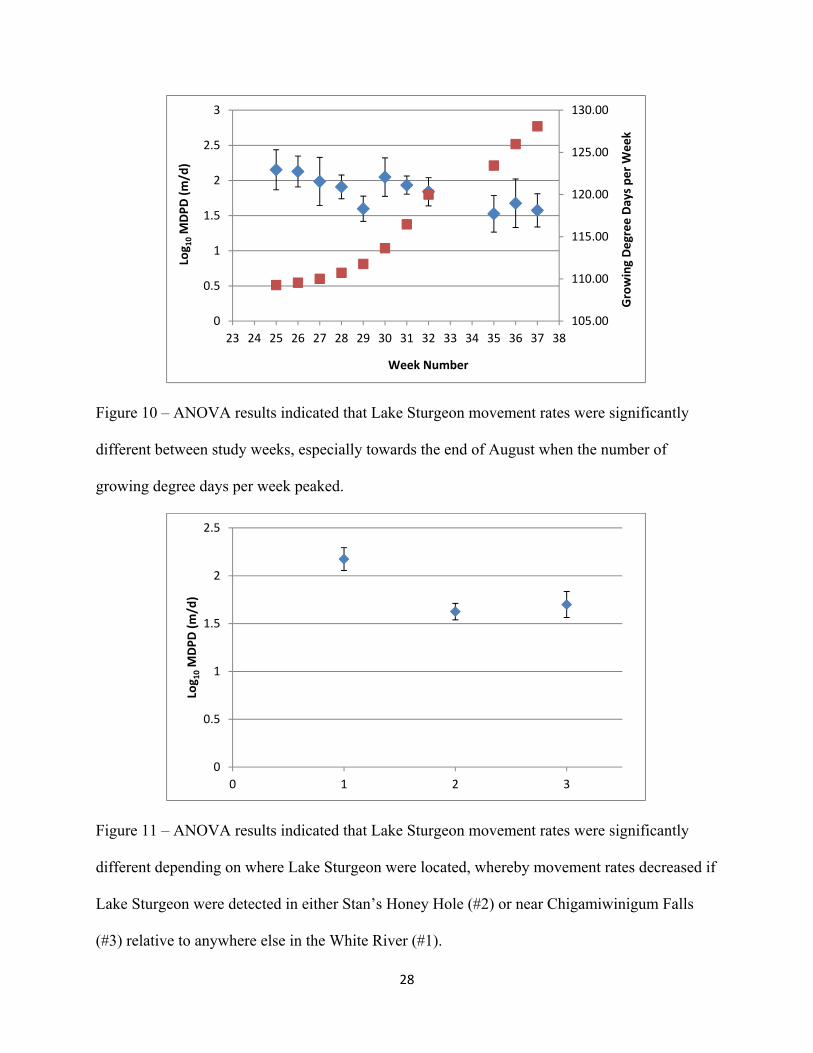
Figure 10: ANOVA results indicated that Lake Sturgeon movement rates were significantly
different between study weeks, especially towards the end of August when the number of growing degree days per week peaked.
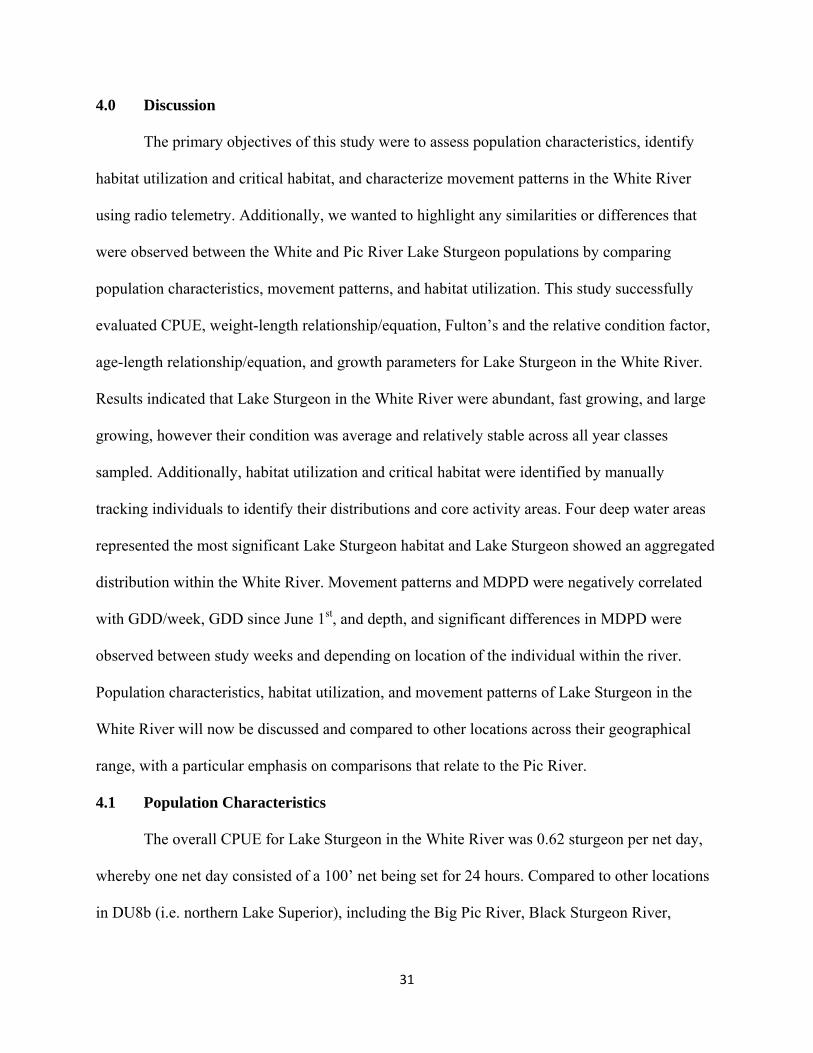
Figure 11: ANOVA results indicated that Lake Sturgeon movement rates were significantly
different depending on where Lake Sturgeon were located, whereby movement
Page 6
v
rates decreased if Lake Sturgeon were detected in either Stan’s Honey Hole (#2) or near Chigamiwinigum Falls (#3) relative to anywhere else in the White River (#1).
Figure 12: Log10MDPD was significantly and negatively correlated with depth (β=-7.8590,
p<0.001). Figure 13: Log10MDPD was significantly and negatively correlated with GDD per week
(β=0.0954, p=0.0063). Figure 14: Log10MDPD was significantly and negatively correlated with GDD since June 1st
(β=-0.0014, p=0.0025). Figure 15: Length at age as modelled by the von Bertalanffy growth model for the White
River, Pic River (Ecclestone, unpublished), Lake Nipigon (Tremblay, 2010), Lake of the Woods (Harkness, 1923), and each designatable subunit of the Great Lakes (Valez-Espino & Koops, 2007).
List of Tables
Table 1: Specifications for the two different radio tags that were used in this study and purchased from Advanced Telemetry Systems Inc. (Isanti, Minnesota).
Table 2: A comparison of the CPUE for Lake Sturgeon in selected tributaries and lakes,
whereby the CPUE is expressed as the number of fish captured per 100’ net per day.
Page 7
vi
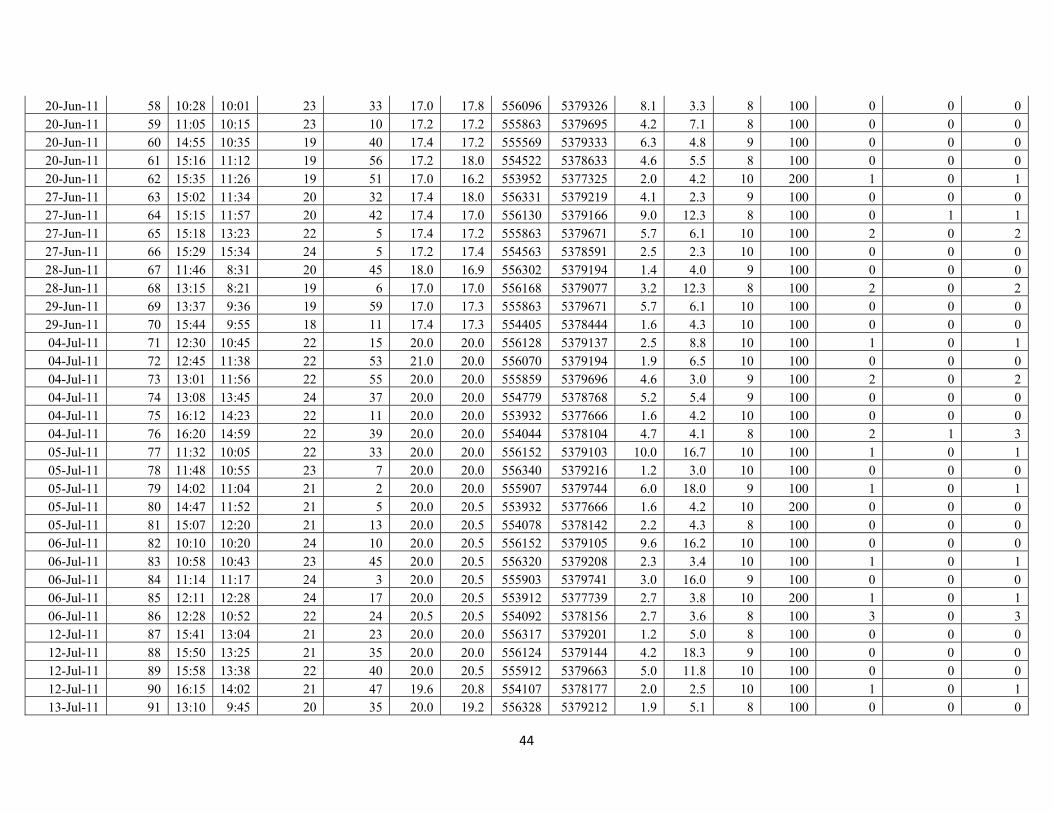
List of Appendices Appendix 1: Date, time, duration, temperature, location, depth, size, and number of captured
Lake Sturgeon in each net that was set in the White River throughout the spring and summer of 2011.
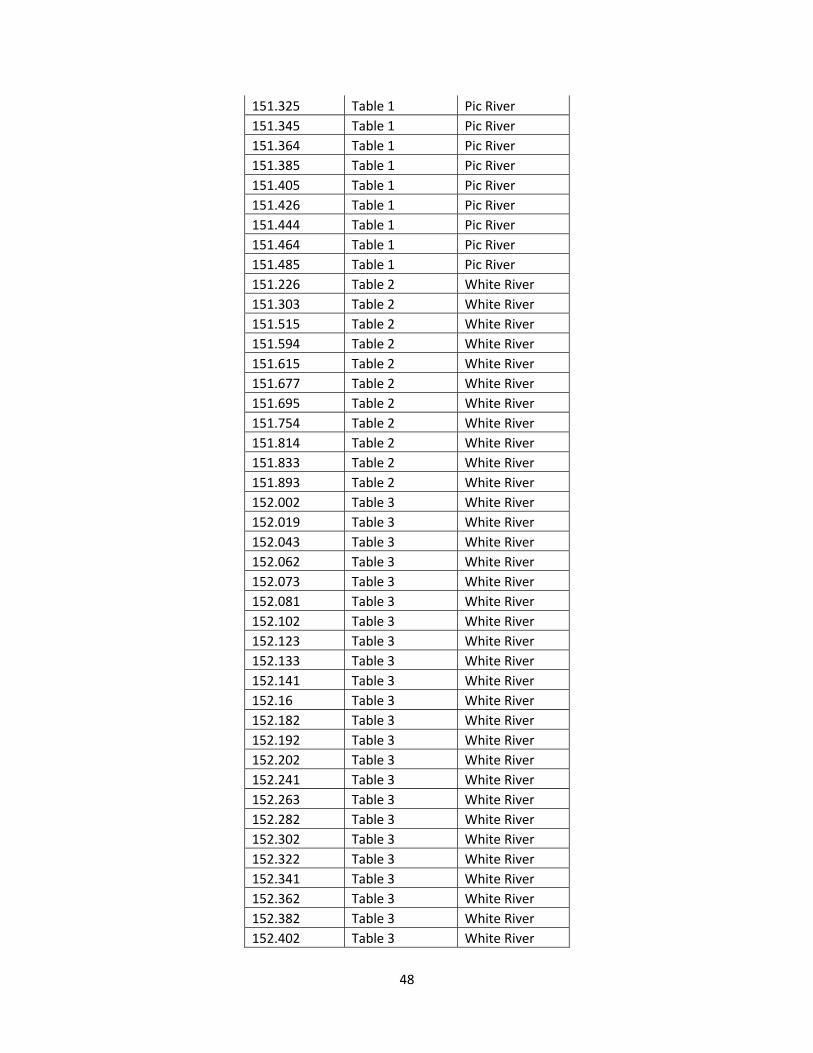
Appendix 2: Arrangement of radio frequencies in the frequency tables of base stations. Radio
frequencies were sorted by pulse rate and contained radio tag frequencies from the White and Pic Rivers.
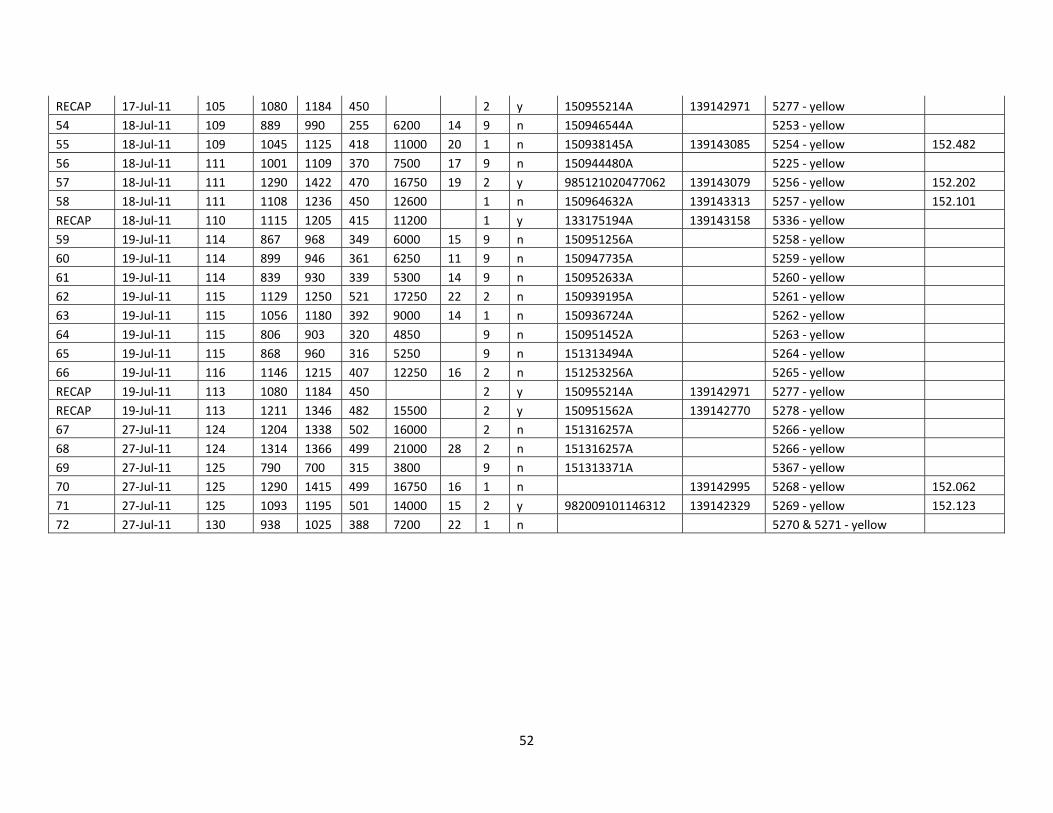
Appendix 3: Raw data from the 82 Lake Sturgeon that were captured in the White River in
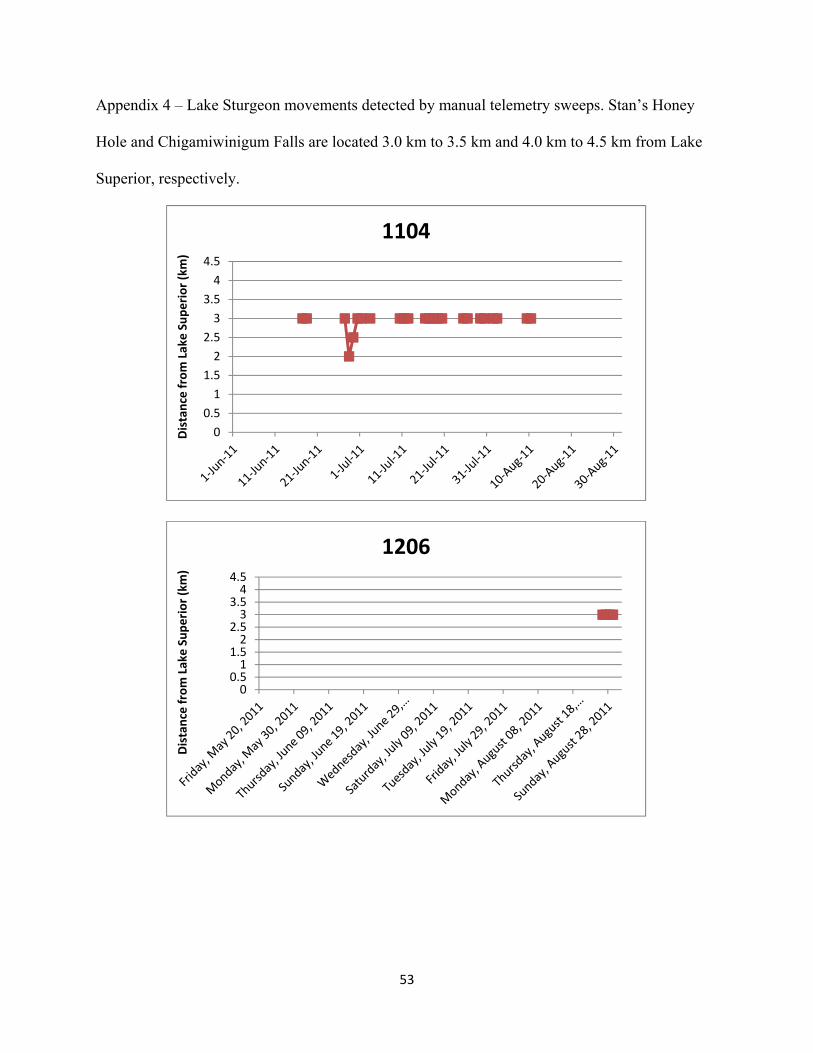
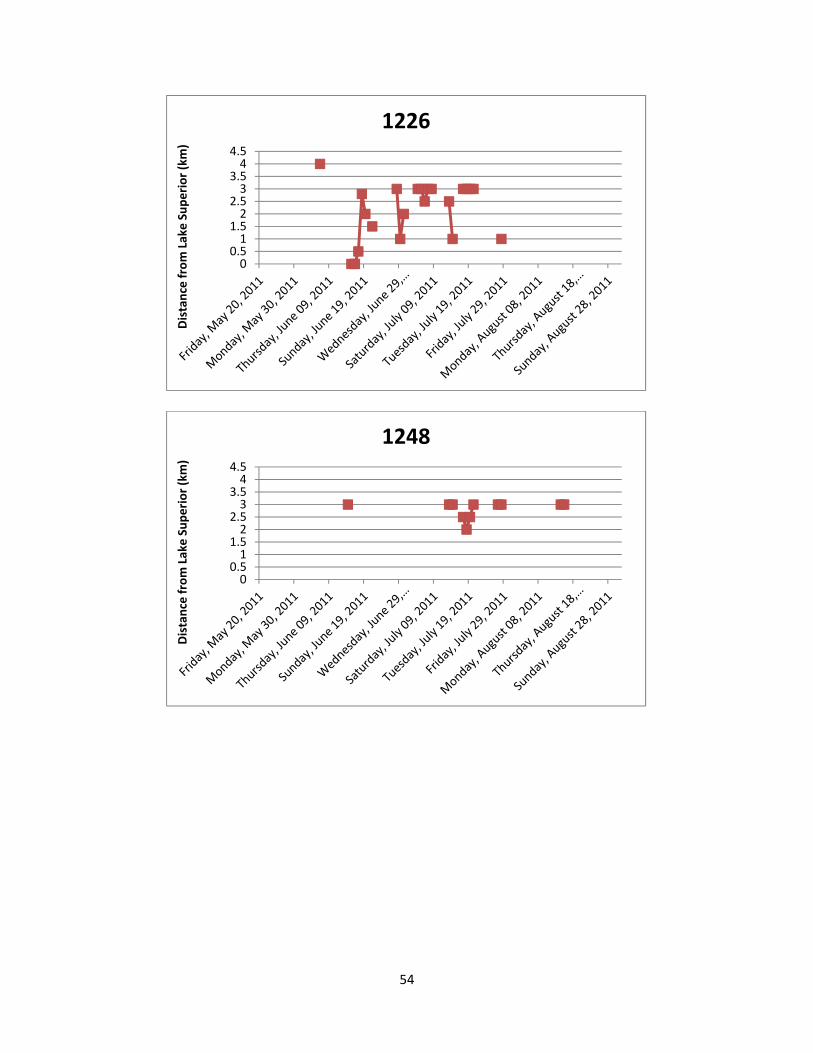
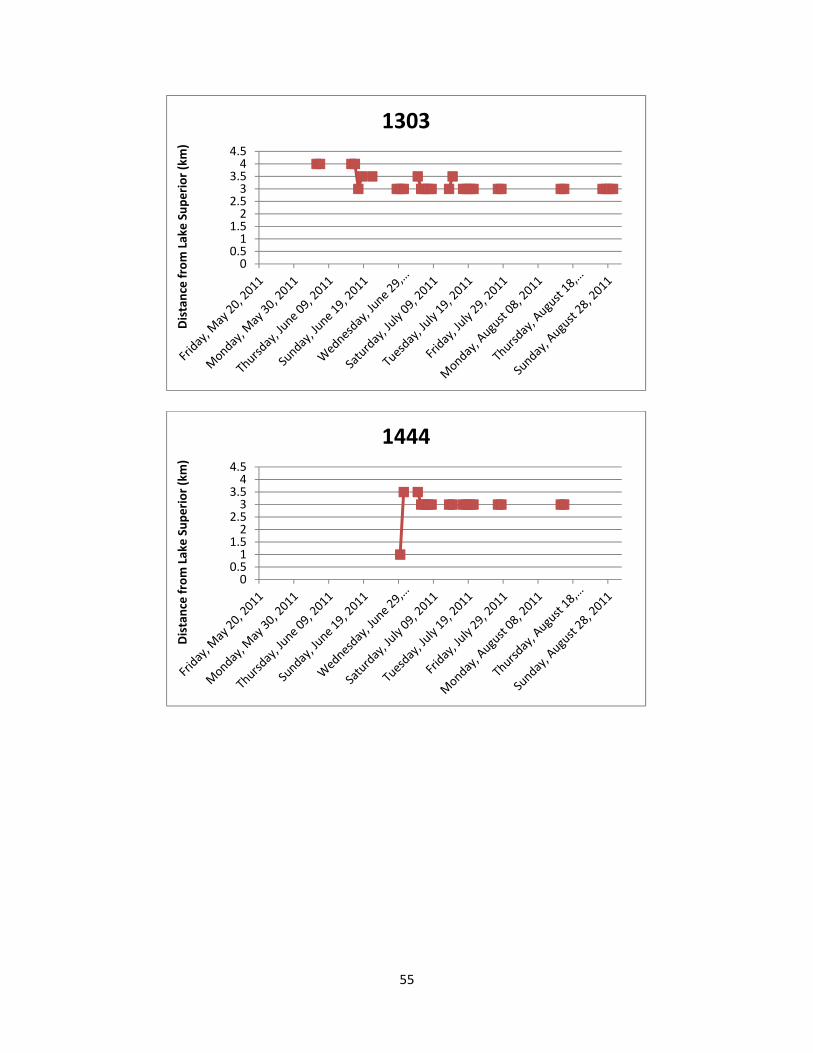
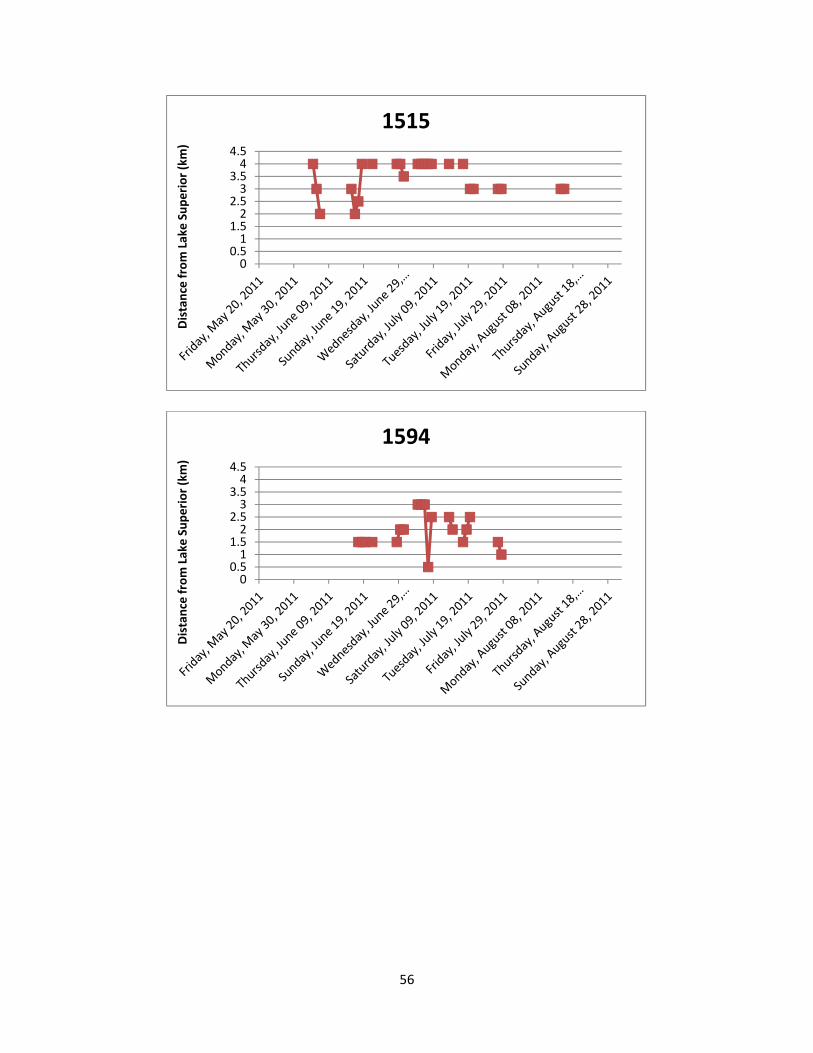
2011. Appendix 4: Lake Sturgeon movements detected by manual telemetry sweeps. Stan’s Honey
Hole and Chigamiwinigum Falls are located 3.0 km to 3.5 km and 4.0 km to 4.5 km from Lake Superior, respectively.
Appendix 5: Bonferoni’s post-hoc test to test for significant differences between different
weeks.
Page 8
1
1.0 Introduction
Lake Sturgeon (Acipenser fulvescens) are one of the world’s largest and longest lived
freshwater fish species, and the only sturgeon species that is native to the Laurentian Great Lakes
(Scott & Crossman, 1998). These potamodromous bottom-feeders have a primitive appearance
and a downward facing snout that enables them to detect prey in soft bottom sediment using
sensory pits and barbels (Harkness & Dymond, 1961; Peterson et al., 2007; Stelzer et al., 2008).
Juveniles allocate a disproportionate amount of energy towards somatic growth (Beamish et al.,
1996), and therefore sexual maturity is not reached until approximately 12-15 years for males
and 18-27 years for females (Kempinger, 1988; Bruch & Binkowski, 2002; Peterson et al., 2007;
Barth et al., 2009). These extreme life history characteristics of the Lake Sturgeon make it a
difficult species to manage and research given the resource and time constraints of most fisheries
projects.
Each spring, when water temperatures are between 11ºC to 21ºC, a portion of the adult
population migrate upriver to reproduce at their natal spawning grounds that contain cobble-
boulder-gravel substrates and fast flowing water (Harkness & Dymond, 1961; McKinley et al.,
1998; Bruch & Binkowski, 2002; Peterson et al., 2007). Bruch & Binkowski (2002) found that
spawning sites in the Winnebago system were close to deep overwintering pools (<2 km), had an
extensive amount of spawning substrate (>700 m2) that was comprised of clean rock and
interstitial spaces, and high flows for aerating eggs. Several other studies report Lake Sturgeon
spawning at depths of 0.1 m to 2.0 m over gravel or cobble substrate, and at water velocities that
range from 15 cm/s to 70 cm/s (Priegel and Wirth, 1974; LaHaye et al., 1992; McKinley et al.,
1998; Auer & Baker, 2002). Spawning temperatures can also vary quite substantially. A long-
term study in the Wolf River found evidence of spawning at temperatures between 8.3ºC and
23.3ºC (Kempinger, 1988) and up to 21.5ºC in the L’Assomption River (LaHaye et al., 1992).
Page 9
2
Most spawning, however, is observed between 13ºC to 18ºC (Scott & Crossman, 1973; Bruch &
Binkowski, 2002; Peterson et al., 2007). Lake Sturgeon have a polyandrous mating system,
whereby two to five males will fertilize eggs that are broadcasted by a spawning female while
traversing the length of the spawning habitat (Harkness, 1988; Auer & Baker, 2002; Bruch &
Binkowski, 2002; Hodgeson et al., 2006; Peterson et al., 2007). Since females only spawn every
3-5 years, and males every 1-3 years, inter and intra population variation in movement patterns
and habitat utilization are often observed throughout the spring (Kempinger, 1988; Fortin et al.,
1996; Rusak & Mosindy, 1997; Peterson et al., 2007). By late-summer, and throughout the fall
and winter, populations typically reduce their home range size and show strong site fidelity for
deep-water pools, which are typically located in the lower sections of rivers, or a connected lake
(Hay-Chmielewski, 1987; Lyons & Kempinger, 1992; Fortin et al., 1993; Rusak & Mosindy,
1997; McKinley et al., 1998; Auer, 1999; Knight et al., 2002; Haxton, 2003b; Lallaman et al.,
2008).
Lake Sturgeon were once considered one of the Great Lake’s most abundant and widely
distributed endemic fish species (Hay-Chmielewski & Whelan, 1997; Auer, 1999; Peterson,
2007). In the early-1800s Lake Sturgeon were so abundant and widely distributed that they were
considered a nuisance species by most commercial fisheries (Stone & Vincent, 1900; Harkness,
1961; Hay-Chmielewski & Whelan, 1997). They were an essential bartering commodity during
the fur trade era and have always been traditionally important to aboriginal peoples for
subsistence and cultural purposes, especially in northern Ontario (Hannibal-Paci, 1998;
Holzkamm & Waisberg, 2005; Ontario Ministry of Natural Resources, 2009; Kline et al., 2010).
At the Rainy River, the 1868 spawning run attracted roughly 1,000 Ojibwa people from as far
east as Winnipeg and as far west as Lake Superior (Holzkamm et al., 1988). While the purpose
Page 10
3
of these trips was to harvest the meat and medicinal benefits (Hopper & Power, 1991), the
spawning runs also served as social gatherings where political discussions, religious ceremonies,
or traditional teachings would occur (Holzkamm et al., 1988). Historical accounts report Lake
Sturgeon being brought into the Detroit fish markets by the wagon load and piled like cord-wood
where they would be sold for as low as 50 cents apiece and used for fertilizer or fuel (Stone &
Vincent, 1900).
Beginning in the mid-1800s, a valuable and targeted commercial fishery for Lake
Sturgeon developed, which was driven by the demand for fertilizer, isinglass, biofuel, and
towards the start of the 20th century, caviar (Stone & Vincent, 1900; Harkness, 1988; Hay-
Chmielewski & Whelan, 1997; Williamson, 2003). As catches exceeded the maximum
sustainable yield in the late 1800s, Lake Sturgeon stocks rapidly collapsed throughout the Great
Lakes (Baldwin et al., 1979; Hay-Chmielewski & Whelan, 1997; Auer, 1999; Baker &
Borgeson, 1999). This led to heavy regulations in the 1920s followed by the closure of most
American commercial fisheries by 1980 (Baldwin et al., 1979; Auer, 2003; Peterson et al., 2007)
and the recent closure of the recreational fishery in Ontario and bordering states (Ontario
Ministry of Natural Resources, 2009). Despite these mitigation measures, however, the majority
of sturgeon populations have still not rebounded in the Great Lakes.
In more recent decades, the most prominent anthropogenic threat that is inhibiting the
recovery of populations is habitat degradation and fragmentation (Hay-Chmielewski & Whelan,
1997; Auer, 1999; Peterson et al., 2007). Estimates suggest that Lake Sturgeon require 250 km to
300 km of unimpeded river-lake habitat as a minimum home range size to complete their life
cycle (Auer, 1996). If Lake Sturgeon do not have access to this large river-lake habitat, then
populations may become vulnerable to immediate extirpation when habitat is severely impacted
Page 11
4
or unreachable (Harkness & Dymond, 1961; Baker & Borgeson, 1999). Even if the effects of
habitat fragmentation are not immediately felt, over time populations residing in unimpeded
stretches of river have greater abundances and faster growth rates compared to populations
occupying impounded sections of river (Haxton, 2002, 2003a; Haxton & Findlay, 2008). Natural
barriers, such as fast flowing rapids or small waterfalls, may not fragment habitat or population
connectivity (Welsh & McLeod, 2010). However artificial developments, such as hydroelectric
developments or water diversions, have resulted in severely fragmented habitats, isolated
populations, and altered spawning behaviour (Haxton, 2002; Daugherty et al., 2008a, 2008b;
Paragamian et al., 2001). Furthermore, the altered flow regimes that often accompany such
developments can also hinder the spawning ability and behavior of Lake Sturgeon, thus having
an equally negative impact on the spawning success (Haxton, 2002; Paragamian et al., 2001).
Beyond overfishing and habitat fragmentation, several other threats continue to inhibit the
recovery of Lake Sturgeon, including invasive species and their control measures (Boogard et al.,
2003), pollution and poaching (Auer, 1999), and the potential erosion of locally adapted genes
(Welsh et al., 2008; Welsh et al., 2010).
Currently, the abundance of Lake Sturgeon in the Great Lakes is estimated to be less than
1 % of its historical level and 27 populations have become extirpated from historically active
tributaries in the Great Lakes (Scott & Crossman, 1973; Hay-Chmielewski & Whelan, 1997;
Auer, 1999; Ontario Ministry of Natural Resources, 2009). In response to this weakened state,
Lake Sturgeon populations have been grouped into eight designatable conservation units
throughout their native Canadian range by COSEWIC (Ferguson & Duckworth, 1997;
COSEWIC, 2006; Welsh et al., 2008; Kjartanson, 2008; Hutchings & Festa-Bianchet, 2009).
Designatable unit 8 (DU8) contains the Upper Great Lakes and the St. Lawrence River system,
Page 12
5
which has been further broken down into three designatable subunits (Lake Erie-Lake Huron
(DU8a); Northern Lake Superior (DU8b); and St. Lawrence River (DU8c)) (Velez-Espino &
Koops, 2009) and six genetically significant units (Welsh et al., 2010). These designatable
subunits and genetically significant units have been developed in light of new evidence that
focuses on population trends, biogeography, genetic differences, and life history characteristics
within each area (Velez-Espino & Koops, 2009; Welsh et al., 2010). Furthermore, they have
been listed as threatened or endangered by all states and provinces surrounding the Laurentian
Great Lakes, which has led to an increasing amount of conservation and research efforts (Auer,
2003; Peterson et al., 2007; Ontario Ministry of Natural Resources, 2009).
1.1 Study Background and Objectives
Since 2006, the A/OFRC has undertaken several projects on northeastern Lake Superior
tributaries that support Lake Sturgeon spawning, most notably in the Pic River from 2006 to
2010. In July of 2010, the A/OFRC and Pukaskwa National Park set nets in the White River to
identify the presence of Lake Sturgeon in this tributary, which were listed as extirpated
according to the Ontario Ministry of Natural Resources. A total of 9 Lake Sturgeon were
captured in 8 overnight sets in 2010, which confirmed the presence of Lake Sturgeon in the
White River and prompted further research initiatives for this tributary. In January of 2011 the
A/OFRC and Parks Canada began formally discussing the possibility of undertaking a Lake
Sturgeon research project in the White River. The project was officially undertaken in May of
2011 when the OMNR provided financial support through the Species at Risk Stewardship
Program. The primary objectives of this study were to assess population characteristics, identify
habitat utilization and critical habitat, and characterize movement patterns in the White River
using radio telemetry. Additionally, we wanted to highlight any similarities or differences that
Page 13
6
were observed between the White and Pic River Lake Sturgeon populations by comparing
population characteristics, movement patterns, and habitat utilization. We conclude this report by
providing an overall assessment of the White River Lake Sturgeon population in relation to other
Lake Superior populations and by identifying future research priorities that will contribute to the
conservation and management of this extant Lake Sturgeon population.
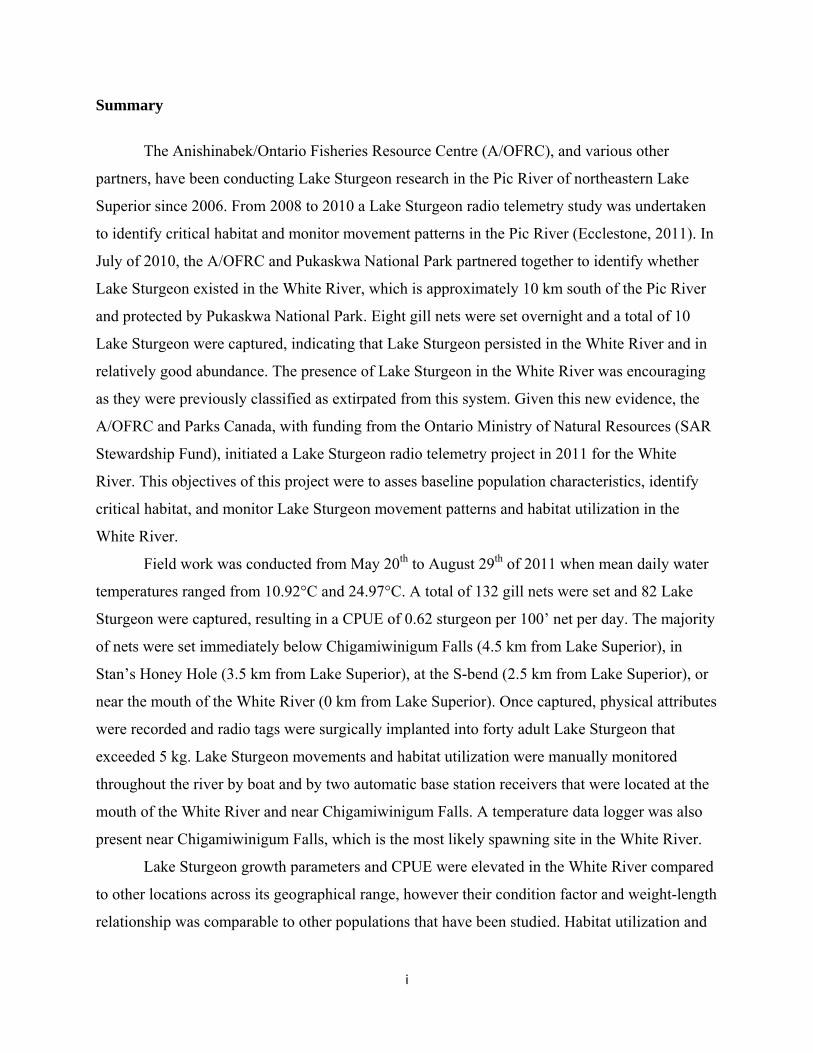
1.2 Study Area
The White River is located in Pukaskwa National Park and is only accessible by boat via
Lake Superior or by foot via the Lake Superior Coastal Hiking Trail. Lake Sturgeon are
restricted to the lower 4.5 km of the river, from Lake Superior to the uppermost natural barrier of
Chigamiwinigum Falls (Figure 1). The nearest communities to this section of the White River
are Pic River First Nation and the town of Marathon, Ontario. There is no development as the
study area is entirely protected by Pukaskwa National Park, however above Chigamiwinigum
Falls there is an operating and a proposed hydroelectric development. Until 2010, Lake Sturgeon
were believed to be extirpated from the White River. The nearest Lake Sturgeon spawning
tributaries are the Pic and Michipicoten Rivers, which are located 10 km north and 150 km south
of the White River, respectively. Throughout this report, four areas will be frequently referred to,
they include; Chigamiwinigum Falls (4.5 km from Lake Superior), Stan’s Honey Hole (3.5 km
from Lake Superior), the S-Bend (2.5 km from Lake Superior), and the mouth of the White River
(0 km from Lake Superior).
Page 14
7
Figure 1 – Study Area for the White River Lake Sturgeon project, with the four significant areas
that are frequently referred to throughout this report.
2.0 Methods
In 2011, field work at the White River began on May 20th when water temperatures were
10.92°C and finished by August 29th when water temperatures were 20.00°C. Mean water
Page 15
8
temperature during this period was 20.36°C, with a maximum water temperature of 24.97°C on
August 8th and a minimum water temperature of 10.92°C on May 20th. Throughout this period,
various sampling methods were applied to identify Lake Sturgeon movement patterns and habitat
utilization in the White River. The various methods and equipment that were used to undertake
this study will now be discussed.
2.1 Gill Netting
Gill netting in the White River occurred from May 20th, 2011, to July 28th, 2011, at which
point gill netting was stopped due to concerns of Lake Sturgeon becoming stressed from warm
water conditions (Appendix 1). A total of 132 nets were set during this time. Nylon gill nets were
set perpendicular to shore at an angle of roughly 90°. Stretch mesh sizes ranged from 20.32 cm
(8”) to 25.4 cm (10”). Net lengths ranged from 30.5 m (100’) to 60.7 m (200’) depending on the
width of the river where it was being set. Gill nets were set overnight for approximately 24 hours
and upon retrieval the location, duration, depth, water temperature, net length, mesh size, cloud
cover, and precipitation type were recorded for each set. Nets were set throughout the lower 4.5
km of the White River, from Lake Superior to Chigamiwinigum Falls. The majority of nets were
set immediately below Chigamiwinigum Falls (4.5 km from Lake Superior), in Stan’s Honey
Hole (3.5 km from Lake Superior), at the S-bend (2.5 km from Lake Superior), or near the mouth
of the White River (0 km from Lake Superior). The distance of each net from Lake Superior, in
kilometers, was calculated using ArcMap.
Physical attributes of all captured Lake Sturgeon were recorded, including; fork length
(mm), total length (mm), round weight (g), girth (mm), and the presence of sea lamprey wounds.
If distinguishable, the sex and stage of gonadal development were also recorded based on criteria
provided by Bruch et al. (2001). As well, the first fin ray from the left pectoral fin was removed
Page 16
9
for ageing and a small tissue sample from this location was taken for future genetic analysis.
Ageing analysis was done by Aqua-Tech Services in Perth, Ontario. Lake Sturgeon were tagged
with a 12 mm passive integrated transponder (PIT) tag under their third dorsal scute, a 32 mm
PIT tag in their stomach, and a Floy tag to the left of their dorsal fin to identify and track future
recaptures. Individuals exceeding 5000 g (5.0 kg) were given an internal radio tag to monitor
their future movement patterns within the Pic River.
2.2 Radio Telemetry
Radio Tags and Surgeries
For this study, internal radio tags were surgically implanted into the abdominal cavity of
Lake Sturgeon. Radio tags and receivers were purchased from Advanced Telemetry Systems Inc.
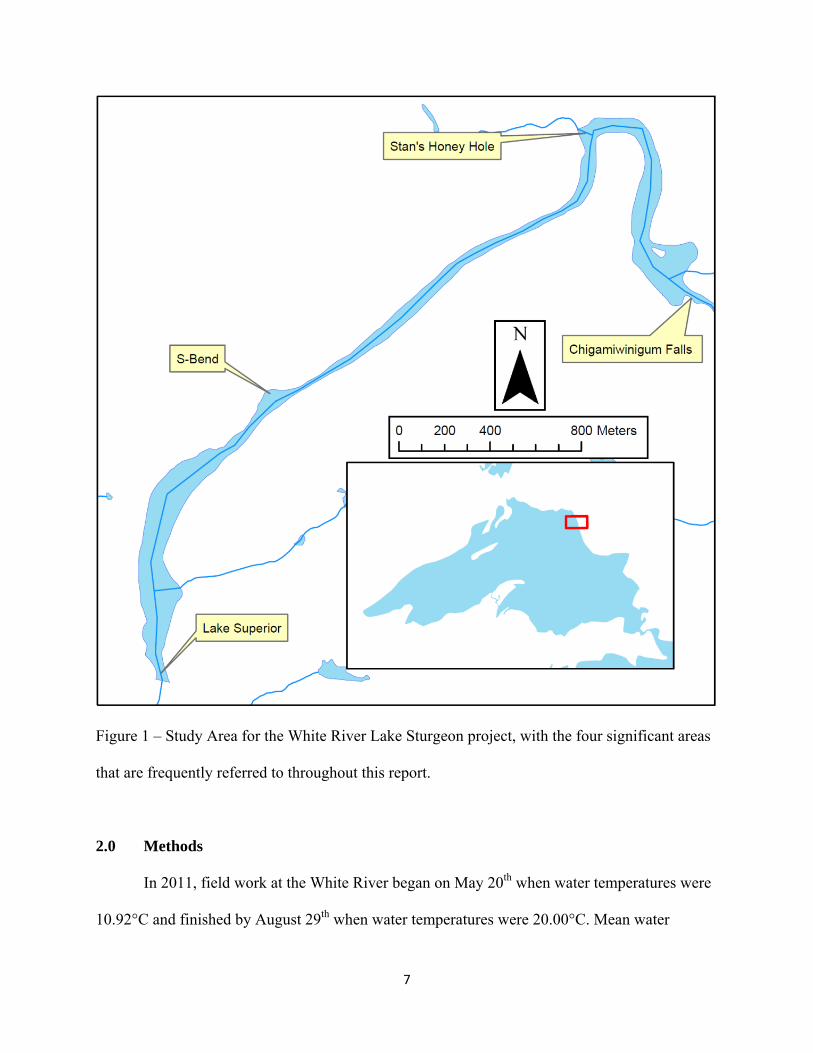
(Isanti, Minnesota). Two different radio tags with unique frequencies and settings were used in
this study (Table 1). Radio tags were only implanted in Lake Sturgeon that exceeded 9000 g (9
kg). Lake Sturgeon of this size were selected in order to minimize any harm or unnatural
behaviour that may result from the application of the tag.
Table 1 – Specifications for the two different radio tags that were used in this study and
purchased from Advanced Telemetry Systems Inc. (Isanti, Minnesota).
Model Number F1850 Model Number F1855 Pulse Rate
(pulses per minute) 35 55
Pulse Width (milliseconds)
22 20
Frequency Range (kHz)
152.002 to 152.523 151.226 to 151.893
Weight (g)
25 87
Battery Life (days)
1941 1095
Number of Tags
29 11
Page 17
10
Surgical procedures were adopted from Friday’s (2005a; 2005b; 2011) work on the
Kaministiquai and Black Sturgeon Rivers and from guidelines provided by the Canadian Council
on Animal Care (Ackerman et al., 2000). Lake Sturgeon were sampled and put into a large tub
(Rubbermaid Commercial 4244-Bla 70 Gallon Stock Tank Black) with 60 L of river water, to
which 32 mL of a clove oil and ethanol solution (1.2 mL clove oil to 10.8 mL of ethanol) was
added as an anesthetizing agent. Fish remained in the anesthetizing tub until they could no longer
control their orientation in the water, lacked locomotory skills, and their stomachs appeared to
have a concave indent. Once fish showed these symptoms of the anesthetic (Ackerman et al.,
2000), they were removed from the tub and placed in a canvas surgery sling that provided
adequate water circulation around the gills. All surgical tools were thoroughly cleaned and
decontaminated before commencing the surgical procedure using isopropyl alcohol. A 4 cm to 6
cm incision was then made along the mid-ventral line of the fish, using a size 10 scalpel, to
expose the Lake Sturgeon’s body cavity. Another small incision, using a 14 gauge needle tip,
was then made posterior to the initial incision to feed the antenna tail of the radio tag outside of
the body cavity. The radio tag was then activated, the frequency recorded, and carefully inserted
into the body cavity. The 4 cm to 6 cm incision was then sutured together with three to five
stitches (Ethicon Monocryl Plus, CT-1 36 mm ½ Circle, Violet Monofilament) and strengthened
using tissue adhesive (3M™ Vetbond™). The Lake Sturgeon were immediately immersed in
fresh river water and constantly monitored until they showed symptoms of recovery from the
anesthetizing agent (Ackerman et al., 2000). The entire procedure took roughly 30 minutes and
upon completion the Lake Sturgeon was then released in the river, away from any nets or debris.
Base Station Receivers
Page 18
11
Base stations (model number: R4500S) (Advanced Telemetry Inc., Insanti, Minnesota)
were powered by a deep cycle marine battery and charged by a solar panel. Each station had a 10
foot aluminum pole with two antennas, one antenna pointed directly upriver while the other
pointed directly downriver or out to Lake Superior. The base stations could collect and store up
to 88,000 bytes of information before overwriting previously recorded data, therefore
downloading times were coordinated to avoid losing any data (roughly every week during the
spring/summer and twice during the fall/winter). The stationary defaults of the base stations were
set to a time out of 3 seconds, a scan time of 15 seconds, and a store rate of 60 minutes. Radio
frequencies were inputted to frequency tables in the receiver once they were surgically implanted
into Lake Sturgeon (Appendix 2). Two base stations were setup up on the White River, one was
located at the mouth of the river (Easting: 553917, Northing: 5377629) and the other was 150 m
below Chigamiwinigum Falls (Easting: 556165, Northing: 5379305). Upon setup, the location of
each base station (UTM), the direction of each antenna (upriver or downriver), and the distance
of the base station from Lake Superior were recorded. These base stations will provide critical
data on the long term movements of Lake Sturgeon in the White River and on their
overwintering habitat. At the time of this report, the base station receivers continue to collect
data and will do so until spring of 2012 at which point the data will downloaded, compiled, and
analysed. Once downloaded, we will report on the results of this data, however for the purposes
of this report we will focus on the manual telemetry data as it provides more accurate results on
the habitat utilization and movement patterns of Lake Sturgeon in the White River.
Manual Telemetry
Manual telemetry sweeps of the river were frequently performed throughout the spring
and summer to detect the location of radio tagged Lake Sturgeon. The radio telemetry receiver
Page 19
12
was purchased from Advanced Telemetry System Inc. (Isanti, Minnesota) (model number:
R410). Telemetry sweeps were performed by travelling in a boat at a speed of approximately 6 to
8 km/h while scanning the active radio frequencies (3 – 4 seconds per frequency). Once detected
from afar, the precise location of the individual (±1.5 m) would be identified by reducing the
boat’s speed and the amount of gain on the manual receiver (i.e. its search radius). Typically the
location of radio tagged Lake Sturgeon was recorded with the manual receiver at 2 full bars of
gain, however if Lake Sturgeon were in very deep water, then their location was recorded at 3 to
4 bars of gain at which point they became undetectable. When radio tagged Lake Sturgeon were
found, the location, date, time, depth, and temperature were recorded at that location. Whenever
a Lake Sturgeon was recorded, either manually or by base station, the distance of that Lake
Sturgeon from Lake Superior was determined using ArcMap.
2.3 Temperature Data Logger
Water temperature was recorded once every two hours using a temperature data logger
(model number: HOBO Water Temp Pro v2 Data Logger) that was located near
Chigamiwinigum Falls (Easting: 556165, Northing: 5379305). The temperature data logger was
attached to an anchor and recorded temperature at the bottom of the river where Lake Sturgeon
were most likely to be. Mean daily temperature was based on 12 daily reading from the
temperature data logger. Growing degree days (GDD) per week and since June 1st were
calculated based on mean daily water temperature.
2.4 Data Analysis
The overall catch per unit of effort (CPUE) was calculated to determine the relative
abundance and density of Lake Sturgeon in the White River. Fulton’s condition factor was
calculated using the equation K= RWT/TL3, whereby K is Fulton’s condition factor, RWT is the
Page 20
13
round weight of the individual in grams, and TL3 is the cubed total length of the individual in
centimeters. To calculate the relative condition factor of Lake Sturgeon, a log10 transformed
length-weight relationship was generated to determine the equation for the line of best fit. Once
determined, the equation Kn=W/αTLn was used to calculate the relative condition of each
individual, whereby Kn is the relative condition factor, W is the actual weight of the individual,
and α and n are the respective intercept and slope of the log10 transformed total length and weight
relationship. Upon determining Fulton’s condition factor (K) and the relative condition factor
(Kn) for each Lake Sturgeon, the mean and standard error for K and Kn was plotted for each year
class. To evaluate the length and age relationship for Lake Sturgeon in the White River, a von
Bertalanffy growth model was generated using the program FAST (Fisheries Analyses and
Simulation Tools, Version 2.1, Auburn University).
ArcMap™ 10.0 (ESRI® Canada, Inc.) was used to evaluate the spatial distribution,
location, and habitat utilization of radio tagged Lake Sturgeon. Point density analysis was used to
identify areas of the White River that were frequently utilized by radio tagged Lake Sturgeon.
The spatial test statistic module from the telemetry software analysis package FishTel version 1.4
was used (Colorado Division of Wildlife, Denver) to determine whether radio tagged Lake
Sturgeon exhibited a random or non-random distribution in the White River. Instructions for this
analysis were taken from chapter 14 of Analysis and Interpretation of Freshwater Fisheries Data
(Rogers & White, 2007). Five control subjects, with 25 randomly located detections per control
subject, were included in the analysis to ensure that FishTel modelling could reliably detect a
random distribution pattern in the White River. Minimum displacement per day (MDPD),
measured in meters per day, was used to evaluate differences and/or relationships in the
movement patterns of radio tagged Lake Sturgeon. MDPD was only evaluated if an individual
Page 21
14
was detected two or more times within a 48-hour interval to ensure that movement rates were
accurately calculated and not underestimated. ANOVAs were used to identify significant
differences in Log10 MDPD between sexes, size classes, study weeks, and locations. Multiple
regression analysis was performed to determine if Log10 MDPD was correlated with size classes,
mean daily water temperature, depth, growing degree days (GDD) since June 1st, or GDD per
week. All statistical analyses were considered significant at a p-value of 0.05 and were
performed using XL Toolbox in Microsoft Excel 2007.
3.0 Results
In 2011 a total of 82 Lake Sturgeon were captured, 15 of these individuals were
recaptured and 40 of these individuals were radio tagged (Appendix 3). The overall CPUE,
which is a measure of fish density and relative abundance, was 0.62 sturgeon per net day,
whereby one net day consisted of a single 100’ gang that was set for 24 hours. The mean total
length and round weight for all of the captured individuals (n=82) was 1205.0 mm (+/- 20.5 mm)
and 12,195.5 g (+/- 565.3 g), respectively. The mean total length and round weight of the radio
tagged individuals (n=40) was 1,275.7 mm (+/- 18.5 mm) and 13,666.1 g (+/- 555.0 g),
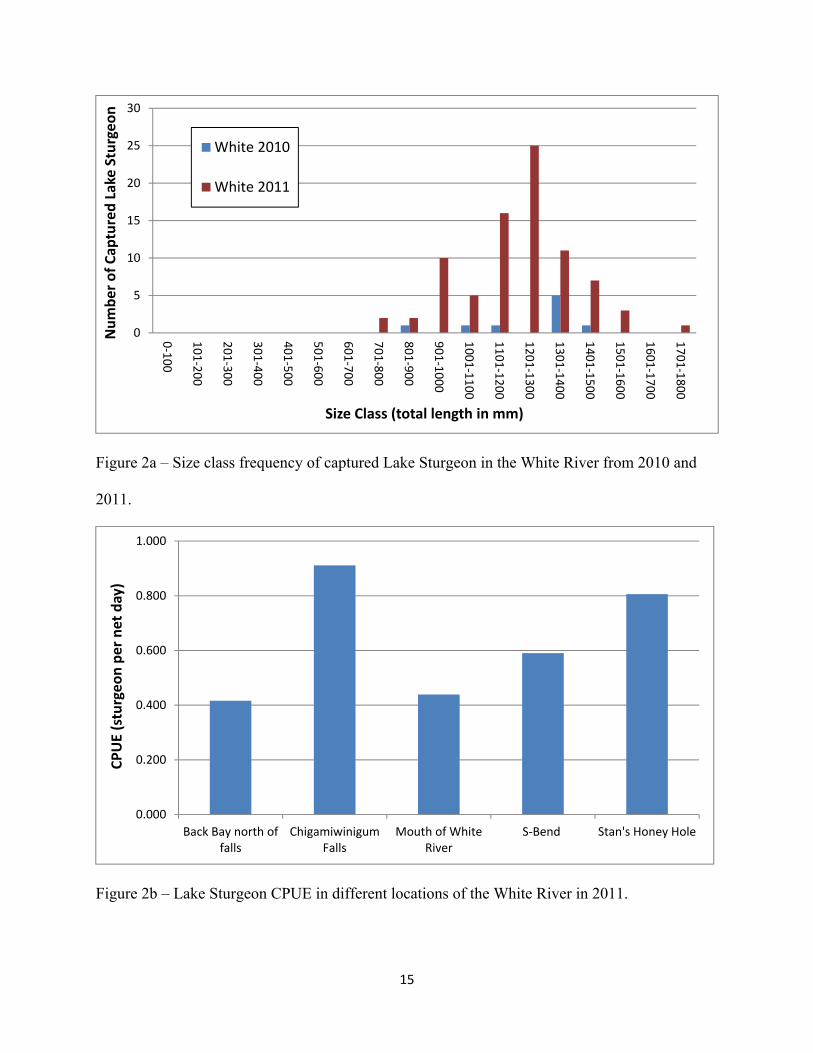
respectively. The frequency of catches in each size class is presented in Figure 2a, while the
CPUE by location is presented in Figure 2b. The greatest CPUE was observed near
Chigamiwinigum Falls (0.911 sturgeon/net day), which was closely followed by Stan’s Honey
Hole (0.806 sturgeon/net day). CPUE at other locations in the White River, which include the
mouth of the river, the S-Bend, and the back bay north of Chigamiwinigum Falls, ranged from
0.416 to 0.509 sturgeon/net day.
Page 22
15
Figure 2a – Size class frequency of captured Lake Sturgeon in the White River from 2010 and
2011.
Figure 2b – Lake Sturgeon CPUE in different locations of the White River in 2011.
0
5
10
15
20
25
30
0‐100
101‐200
201‐300
301‐400
401‐500
501‐600
601‐700
701‐800
801‐900
901‐1000
1001‐1100
1101‐1200
1201‐1300
1301‐1400
1401‐1500
1501‐1600
1601‐1700
1701‐1800
Number of Cap
tured Lake Sturgeon
Size Class (total length in mm)
White 2010
White 2011
0.000
0.200
0.400
0.600
0.800
1.000
Back Bay north offalls
ChigamiwinigumFalls
Mouth of WhiteRiver
S‐Bend Stan's Honey Hole
CPUE (sturgeon per net day)
Page 23
16
3.1 Population Characteristics
Length-Weight Relationship and Condition
The log10 transformed length-weight relationship for all Lake Sturgeon was
log10(WT)=2.7412log10(TL)-7.3821, which can be rewritten as (WT)=(4.15x10⁻⁸)(TL2.7412)
(Figure 3). Using this equation, the relative condition factor for all Lake Sturgeon was calculated
using the equation Kn=W/αTLn, whereby Kn is the relative condition factor, W is the actual
weight of the individual, and α and n are the respective intercept and slope of the log10
transformed total length and weight data. Overall, the relative condition factor for Lake Sturgeon
was 1.009, indicating that the population is healthy and in relatively good condition. Fulton’s
condition factor for the entire population was 0.6697, indicating that Lake Sturgeon condition in
the White River is average compared to other locations across its geographical range. Figure 4
shows Fulton’s condition factor and the relative condition factor for each year class of Lake
Sturgeon that was captured in the White River (n=62). Fulton’s condition factor decreased
slightly with age (slope = -0.003), while the relative condition factor increased slightly with age
(slope = 0.0003). Given that both condition indices were relatively unchanged with age, and one
showed a positive trend (K) while the other showed a negative trend (Kn), we conclude that Lake
Sturgeon condition was not influenced by year class in the White River as reported by previous
studies (Craig et al., 2005).
Page 24
17
Figure 3 – Least-squares regression of log10WT x log10TL for Lake Sturgeon in the White River.
y = 2.7412x ‐ 7.3821R² = 0.9106
0
0.2
0.4
0.6
0.8
1
1.2
1.4
1.6
2.85 2.9 2.95 3 3.05 3.1 3.15 3.2 3.25 3.3
Log 1
0WT (kg)
Log10 TL (mm)
Page 25
18
Figure 4 – Mean body condition as measured by Fulton’s condition factor and the relative
condition factor for each year class of Lake Sturgeon that was captured in the White River. The
area between the orange and blue lines represents the average value for the respective condition
factor across the geographic distribution of Lake Sturgeon.
Relative Conditiony = 0.0003x + 1.0245
R² = 0.0004
Fulton's Conditiony = ‐0.003x + 0.7421
R² = 0.0996
0.000
0.200
0.400
0.600
0.800
1.000
1.200
1.400
1.600
0 5 10 15 20 25 30 35 40
Condition Factor
Age (years)
Relative Condition (Kn)
Fulton's Conditions (K)
Page 26
19
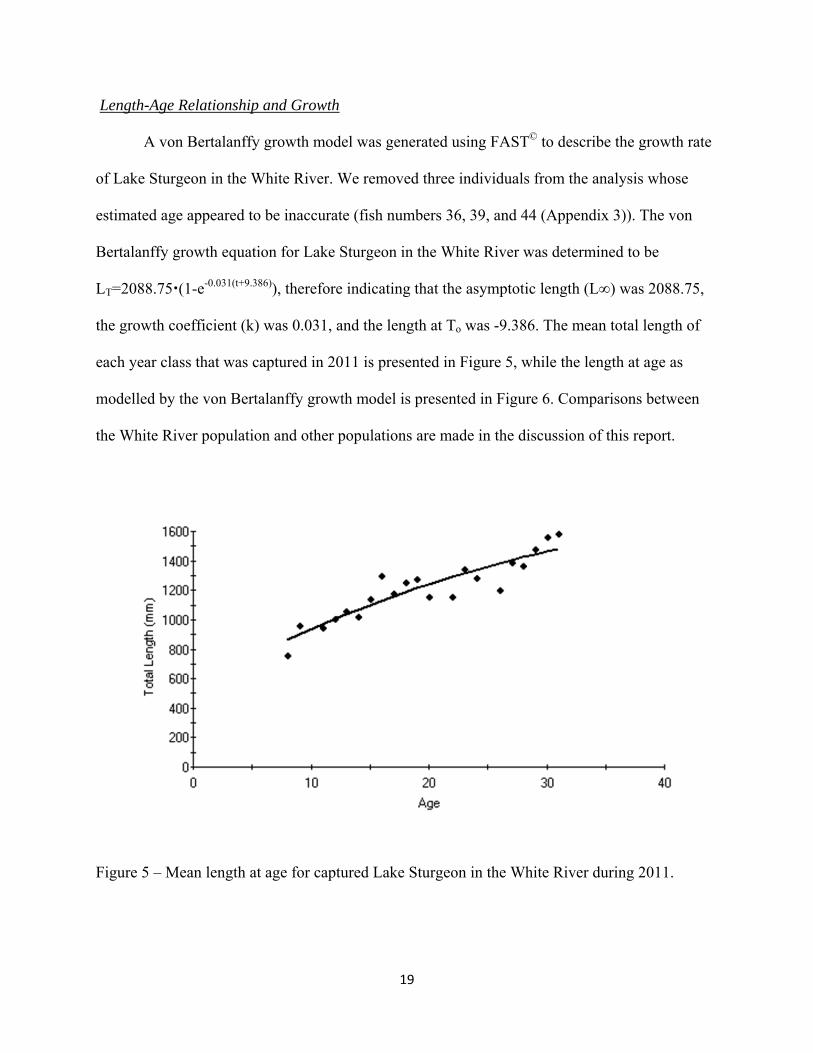
Length-Age Relationship and Growth
A von Bertalanffy growth model was generated using FAST© to describe the growth rate
of Lake Sturgeon in the White River. We removed three individuals from the analysis whose
estimated age appeared to be inaccurate (fish numbers 36, 39, and 44 (Appendix 3)). The von
Bertalanffy growth equation for Lake Sturgeon in the White River was determined to be
LT=2088.75(1-e-0.031(t+9.386)), therefore indicating that the asymptotic length (L∞) was 2088.75,
the growth coefficient (k) was 0.031, and the length at To was -9.386. The mean total length of
each year class that was captured in 2011 is presented in Figure 5, while the length at age as
modelled by the von Bertalanffy growth model is presented in Figure 6. Comparisons between
the White River population and other populations are made in the discussion of this report.
Figure 5 – Mean length at age for captured Lake Sturgeon in the White River during 2011.
Page 27
20
Figure 6 – Von Bertalanffy growth model for Lake Sturgeon in the White River (red line,
equation above chart) with the actual age and length of sampled individuals plotted in blue.
3.2 Habitat Utilization and Movement Patterns
Thirty-six manual telemetry sweeps of the White River were performed from May to
August and forty four radio tagged individuals were detected a total of 617 times. Five of the
forty four Lake Sturgeon were previously radio tagged in the Pic River, which is approximately
10 km north of the White River via Lake Superior. The movement of these individuals indicates
that Lake Sturgeon immigration and emigration occurs with some regularity between the Pic and
White Rivers. For example, fish 151.206 was detected near the mouth of the Pic River during the
fall of 2010 and approximately 23 km up the Pic River on May 31st and again on June 24th in
2011. It then travelled to the White River where it was detected in Stan’s honey hole from July
13th to July 28th and again from August 14th and 15th. Fish 151.248 showed a similar movement
0
500
1000
1500
2000
2500
0 20 40 60 80 100 120
Total Length (mm)
Age (years)
LT = 2088.75�(1‐e‐0.031(t+9.386))
Page 28
21
pattern whereby it was detected throughout the lower 20 km of the Pic River from May 10th to
July 9th and in the White River from August 26th to August 29th. These two individuals showed
evidence of emigration from the Pic River to the White River, however the opposite trend was
also observed. Six of the forty four individuals that were radio tagged in the White River in 2011
were later detected in the Pic River, showing emigration from the White River to the Pic River.
For example fish 152.192 was radio tagged on July 14th and was last detected in the White River
on August 16th. By August 22nd this individual had travelled to the Pic River and was located
near the Highway 17 Bridge, which is approximately 15 km from Lake Superior. The habitat
utilization and movement patterns of each individual Lake Sturgeon are shown in Appendix 4
and summarized below.
Lake Sturgeon were most heavily concentrated in two areas of the White River, while the
rest of the river served as a corridor to facilitate movements (Figure 7). Two of the deepest pools
(16 m to 22 m), which were located immediately below Chigamiwinigum Falls (4.5 km from
Lake Superior) and at Stan’s Honey Hole (3.5 km from Lake Superior), served as primary habitat
for Lake Sturgeon in the White River (Figure 8). Lake Sturgeon were also detected near the
vicinity of the S-bend (2.5 km from Lake Superior), however they were not detected here as
frequently as the two aforementioned locations. Lake Sturgeon detected outside of these areas
were typically migrating between locations or to and from Lake Superior. Based on the timing of
movements and the duration of time spent at each location, it is believed Stan’s Honey Hole is a
significant foraging location, while the pool below Chigamiwinigum Falls serves as an important
staging and foraging location. The small bay to the north of Chigamiwinigum Falls may also
serve as important staging habitat for spawning Lake Sturgeon or as a refuge area to shelter Lake
Sturgeon from woody debris in the spring. Spawning is believed to occur immediately below
Page 29
22
Chigamiwinigum Falls, however we were unable to confirm this via the collection of eggs or
larvae in 2011.
Page 30
23
Figure 7 – The location of Lake Sturgeon throughout the White River from May to August of
2011. A total of 36 manual telemetry sweeps were performed and radio tagged Lake Sturgeon
were detected a total of 617 times. Each colour/symbol represents the movements of one radio
tagged individual throughout the sampling period.
Page 31
24
Figure 8 – The location of Lake Sturgeon in the two most frequently used locations of the White
River from May to August of 2011. Both locations are deep pools in excess of 16 m and serve as
either foraging and/or staging habitat. Each colour/symbol represents the movements of one
radio tagged individual throughout the sampling period.
Page 32
25
To test whether Lake Sturgeon showed a random or non-random distribution in the White
River, the spatial test statistic module from the telemetry software analysis package FishTel
version 1.4 was used (Colorado Division of Wildlife, Denver). First, the average mean variance
for 5 control subjects that were hypothetically detected 25 times in randomly selected locations
was 2,814.44 m2, whereby the probability of obtaining a mean variance of 2,814.44m2 or greater
by random chance is extremely high (p=0.8864). This indicates that the spatial test statistic
module could accurately distinguish between a random and non-random distribution pattern in
the White River. Upon testing the model using our control subjects, the average mean variance
for 38 Lake Sturgeon that were detected 6 to 21 times was 662,371 m2, whereby the probability
of obtaining a mean variance of 662,371.91 m2 or greater by random chance is extremely low
(p<0.001). At an individual level, 34 individuals showed a non-random distribution at the 99%
confidence interval, 3 individuals showed a non-random distribution at the 95% confidence
interval, and only 1 individual showed a random distribution (p=0.0786). This indicates that
Lake Sturgeon distribution in the White River is significantly non-random, therefore suggesting
that their distribution is aggregated. Point density analysis (ArcMap 10.0™, ESRI® Canada Inc.)
was then used to confirm where Lake Sturgeon clusters were located. This analysis indicated that
Lake Sturgeon distribution was highly clustered below Chigamiwinigum Falls and at Stan’s
Honey Hole (Figure 9). Therefore radio tagged Lake Sturgeon showed a non-random distribution
in the White River and were heavily clustered near Chigamiwinigum Falls and at Stan’s Honey
Hole. These two locations represent the deepest habitat within the navigable portion of the White
River, indicating the Lake Sturgeon were seeking deep cool water refuges that provided oxygen
rich conditions.
Page 33
26
Figure 9 – The density of Lake Sturgeon in the White River from May to August of 2011
indicating that Lake Sturgeon were significantly clustered below Chigamiwinigum Falls and at
Stan’s Honey Hole.
Page 34
27
The mean minimum displacement per day (MDPD) for all radio tagged Lake Sturgeon
was 248.51 m/day. MDPD ranged from 1.74 m/day to 3524.60 m/day with a median of 53.66
m/day. An ANOVA found no significant differences in MDPD between different size classes or
sex (F(9,352)=1.71, p=0.085 and F(1,361)=1.69, p=0.194, respectively), indicating that neither
variable significantly influenced the movement rates of Lake Sturgeon. MDPD did significantly
differ over the course of the summer though, with Lake Sturgeon movement rates decreasing as
weeks passed and growing degree days (GDD) per week increased (F(10,351)=3.357, p<0.001)
(Figure 10). A Bonferoni’s post-hoc test indicated that movement rates significantly decreased
during weeks 35 to 37 when growing degree days per week peaked towards the end of August
(Appendix 5). MDPD was also significantly different depending on the location of Lake
Sturgeon within the White River, whereby movement rates were significantly lower when Lake
Sturgeon were located near Stan’s Honey Hole (3 km to 3.5 km from Lake Superior) or
Chigamiwinigum Falls (4 km to 4.5 km from Lake Superior) (F(2,360)=31.180, p<0.001) (Figure
11). Therefore it appears that Lake Sturgeon movement rates are heavily influenced by their
location within the White River and by time which was measured in weekly intervals, with each
week having an increase in GDD per week.
Page 35
28
Figure 10 – ANOVA results indicated that Lake Sturgeon movement rates were significantly
different between study weeks, especially towards the end of August when the number of
growing degree days per week peaked.
Figure 11 – ANOVA results indicated that Lake Sturgeon movement rates were significantly
different depending on where Lake Sturgeon were located, whereby movement rates decreased if
Lake Sturgeon were detected in either Stan’s Honey Hole (#2) or near Chigamiwinigum Falls
(#3) relative to anywhere else in the White River (#1).
105.00
110.00
115.00
120.00
125.00
130.00
0
0.5
1
1.5
2
2.5
3
23 24 25 26 27 28 29 30 31 32 33 34 35 36 37 38
Growing Degree Days per Week
Log 1
0MDPD (m/d)
Week Number
0
0.5
1
1.5
2
2.5
0 1 2 3
Log 1
0MDPD (m/d)
Page 36
29
For the multiple regression analysis, the dependent variable (DV) was log10 MDPD and
the independent variables (IV) were fish size, mean daily water temperature, depth, GDD since
June 1st, and GDD per week. Overall there was a significant correlation between Lake Sturgeon
movement rates and the aforementioned IVs (R2=0.1449, F(5,357)=12.0949, p<0.001), whereby
MDPD was significantly and negatively correlated with depth (β=-7.8590, p<0.001) (Figure 12),
GDD per week (β=0.0954, p=0.0063) (Figure 13), and GDD since June 1st (β=-0.0014,
p=0.0025) (Figure 14). Despite there being a significant and negative correlative between these
IVs and MDPD, only a small proportion of the variation could be explained (R2overall=0.1449)
indicating that MDPD is highly variable for individual Lake Sturgeon in the White River.
Log10MDPD was not significantly correlated with fish size (β=-0.0001, p=0.6685) or mean daily
water temperature (β=0.0226, p=0.2922), indicating that neither variable significantly influences
MDPD for Lake Sturgeon.
Figure 12 – Log10MDPD was significantly and negatively correlated with depth (β=-7.8590,
p<0.001).
y = ‐0.0479x + 2.3821R² = 0.1147
0.0000
0.5000
1.0000
1.5000
2.0000
2.5000
3.0000
3.5000
4.0000
0.0 5.0 10.0 15.0 20.0 25.0 30.0 35.0
Log 1
0MDPD (m/day)
Depth (m)
Page 37
30
Figure 13 – Log10MDPD was significantly and negatively correlated with GDD per week
(β=0.0954, p=0.0063).
Figure 14 – Log10MDPD was significantly and negatively correlated with GDD since June 1st
(β=-0.0014, p=0.0025).
y = ‐0.0183x + 3.9548R² = 0.0198
0.0000
0.5000
1.0000
1.5000
2.0000
2.5000
3.0000
3.5000
4.0000
105 110 115 120 125 130
Log 1
0MDPD (m/day)
GDD per week (°C)
y = ‐0.0003x + 2.0717R² = 0.0328
0.0000
0.5000
1.0000
1.5000
2.0000
2.5000
3.0000
3.5000
4.0000
0 500 1000 1500 2000
Log 1
0MDPD (m/day)
GDD since June 1st (°C)
Page 38
31
4.0 Discussion
The primary objectives of this study were to assess population characteristics, identify
habitat utilization and critical habitat, and characterize movement patterns in the White River
using radio telemetry. Additionally, we wanted to highlight any similarities or differences that
were observed between the White and Pic River Lake Sturgeon populations by comparing
population characteristics, movement patterns, and habitat utilization. This study successfully
evaluated CPUE, weight-length relationship/equation, Fulton’s and the relative condition factor,
age-length relationship/equation, and growth parameters for Lake Sturgeon in the White River.
Results indicated that Lake Sturgeon in the White River were abundant, fast growing, and large
growing, however their condition was average and relatively stable across all year classes
sampled. Additionally, habitat utilization and critical habitat were identified by manually
tracking individuals to identify their distributions and core activity areas. Four deep water areas
represented the most significant Lake Sturgeon habitat and Lake Sturgeon showed an aggregated
distribution within the White River. Movement patterns and MDPD were negatively correlated
with GDD/week, GDD since June 1st, and depth, and significant differences in MDPD were
observed between study weeks and depending on location of the individual within the river.
Population characteristics, habitat utilization, and movement patterns of Lake Sturgeon in the
White River will now be discussed and compared to other locations across their geographical
range, with a particular emphasis on comparisons that relate to the Pic River.
4.1 Population Characteristics
The overall CPUE for Lake Sturgeon in the White River was 0.62 sturgeon per net day,
whereby one net day consisted of a 100’ net being set for 24 hours. Compared to other locations
in DU8b (i.e. northern Lake Superior), including the Big Pic River, Black Sturgeon River,
Page 39
32
Kaministiquia River, and Lake Nipigon, the CPUE for Lake Sturgeon was relatively high in the
White River (Table 2). The CPUE in the White River was comparable to the Groundhog River,
where Lake Sturgeon are listed as a species of special concern and not threatened as is the case
for the White River. This suggests that Lake Sturgeon abundance and density in the White River
is between 132% to 364% higher compared to other Lake Superior tributaries and to the
Groundhog River. It is important to note that nets were not randomly set in any of these rivers
and therefore CPUE can be sensitive to researcher bias. Furthermore, CPUE could be elevated in
the White River because it is a relatively short tributary, therefore inflating CPUE and fish
density. Despite this limitation, CPUE can provide a relative estimate of fish abundance and
density in each location, which enables us to compare population statuses across geographical
locations.
Table 2 – A comparison of the CPUE for Lake Sturgeon in selected tributaries and lakes,
whereby the CPUE is expressed as the number of fish captured per 100’ net per day.
Location Designatable Unit Year(s) CPUE (fish per net day)
Source
White River Upper Great Lakes
(DU8b) 2011 0.62 Ecclestone, 2012
Kaministiquia River Upper Great Lakes
(DU8b) 2001 to 2006 0.47 Friday, 2005a
Big Pic River Upper Great Lakes
(DU8b) 2008 to 2010 0.28 Ecclestone, 2011
Black Sturgeon River
Upper Great Lakes (DU8b)
2002 to 2004 0.017 Friday, 2005a
Lake Nipigon Upper Great Lakes
(DU8b) 2006 to 2009 0.26 Tremblay, 2010
Groundhog River Southern James
Bay (DU7) 1996 0.43 Seylor, 1997
Page 40
33
The equation of the log10 transformed length-weight relationship for Lake Sturgeon in the
White River was log10(WT)=2.7412log10(TL)-7.3821, whereby the length-weight relationship is
equal to the slope (slope=2.74). Typically, the length-weight relationship for Lake Sturgeon is
approximately 3.3 (Beamish et al., 1996; Power & McKinley, 1997). A slope of 2.74 indicates
that Lake Sturgeon in the White River are less plump compared to other populations across their
geographical range. There are few populations where the length-weight relationship is less the
3.0. Values of less than 3.0 have been reported in the Mattagami River (slope=2.923) (Power &
Mckinley, 1997), Lake of the Woods (slope=2.974) (Rusak & Mosindy, 1997), Nelson River
(Patalas, 1988), Black Sturgeon River (slope=2.7814) (Friday, 2005a), and Smoothrock Lake
(slope=2.4519) (Tremblay, 2010). In the Pic River, the length-weight relationship varied from
3.0898 to 3.4438 between 2007 and 2009 with an overall relationship of 3.3911 (Ecclestone,
unpublished). The most likely explanation for a reduced length-weight relationship in the White
River is latitudinal variation and decreased thermal opportunity for growth (Beamish et al., 1996;
Power & McKinley, 1997). Food availability and reproductive status could also influence this
relationship, whereby a decreased food supply or the ripeness of individuals could influence the
plumpness of individuals (Beamish et al., 1996; Power & McKinley, 1997).
Despite having a decreased length-weight relationship, the overall relative condition (Kn)
and Fulton’s condition factor (K) for Lake Sturgeon in the White River was 1.009 and 0.6697,
respectively. These values are consistent with other body condition values across the Lake
Sturgeon’s geographical range. Fortin et al. (1996) reported that K ranges from 0.51 to 0.68, with
a high degree of variability across its geographical range and age distribution. In the Pic River,
the relative condition and Fulton’s condition factor were 1.031 and 0.561, respectively,
indicating that the Pic River Lake Sturgeon population had a slightly higher relative condition
Page 41
34
factor and a slightly lower Fulton’s condition factor. A relative condition factor of 1.0 should be
expected for a healthy population; however for Lake Sturgeon this can be highly variable
because of seasonal changes in gonadal development, temporal variability in food supply, or
temperature fluctuations (Bruch, 2008). For example, Lallaman et al. (2008) determined that the
Kn for Lake Sturgeon in the Manistee River was only 0.72, however this population is highly
disturbed and sampling may not have adequately captured a range of sexes and ages (Peterson et
al., 2002). Craig et al. (2005) found that the overall Kn for Lake Sturgeon in the St. Clair River
system was 1.009 (+/-0.004), but for females it was slightly higher (1.045 +/-0.010) and for
males it was slightly lower (0.985 +/-0.046). One finding that this study did not uncover was an
increasing K and Kn with age, which has been reported in numerous studies for Lake Sturgeon
(Beamish et al., 1996; Craig et al., 2005). In this study the slope of K and Kn as they related to
age was -0.003 and 0.0003, indicating that body condition was essentially parallel across the age
distribution. Fulton’s condition factor increased with age in the Pic River at a slope of 0.0041,
but relative condition factor decreased with age at a slope of -0.0011. Typically, increases in
body condition with age are associated with Lake Sturgeon becoming sexually mature and
therefore increasing their length-weight relationship (Beamish et al., 1996; Craig et al., 2005). In
this study, the majority of individuals that were sampled were captured after spawning, therefore
we believe that increases in body condition with age were not observed because girthy spawning
females were not captured in great abundances during the study period.
The growth curve for Lake Sturgeon in the White River according to the von Bertalanffy
growth model was LT=2088.75(1-e-0.031(t+9.386)), indicating that the asymptotic length (L∞) was
2088.75mm, the growth coefficient (k) was 0.031, and To was -9.386. In relation to other Lake
Sturgeon spawning tributaries and nearby systems, the growth rate for Lake Sturgeon in the
Page 42
35
White River is comparable; however L∞ is much higher in the White River compared to most
other locations (Figure 15). In the Pic River for example, L∞ was 1506.14 mm with a growth rate
of 0.092 and a To of -1.077 (Ecclestone, unpublished). The Pic River growth curve is very
similar to the modelled growth curve for Lake Sturgeon in DU 8b, which found a L∞ of 1528.3
with a growth rate of 0.058 (Velez-Espino & Koops, 2007) (To was assumed to be equal to 0). L∞
in the White River was comparable to growth models for Lake of the Woods, which is a
population of special concern and sampled prior to any major exploitation (Harkness, 1923). We
believe that k, L∞, and To are elevated in these results partially because juveniles (< 8 years) and
old adults (>40 years) were not captured and sampled in great abundances in either the White or
Pic Rivers. A lack juveniles could inflate To, while a lack of old adults could inflate L∞,
cumulatively these inflated variables could influence the modelled growth rates for Lake
Sturgeon in the White and Pic Rivers (also see Figure 6). Despite this limitation, which we hope
to resolve in the 2012 field season by setting larger and smaller mesh nets, we believe that the
von Bertalanffy growth models that have been developed for the White and Pic River Lake
Sturgeon populations provide a relatively good characterization of the populations’ growth
patterns.
Page 43
36
Figure 15 – Length at age as modelled by the von Bertalanffy growth model for the White River,
Pic River (Ecclestone, unpublished), Lake Nipigon (Tremblay, 2010), Lake of the Woods
(Harkness, 1923), and each designatable subunit of the Great Lakes (Valez-Espino & Koops,
2007).
Velez-Espino & Koops (2007) determined that the mean length at age 25 (TL25) for DU
8b was 1172.0 mm. Our growth models for both the Pic River and the White River indicated that
TL25 was 1369.39 mm and 1369.38 mm, respectively. Fortin et al. (1997) developed a regression
equation for Lake Sturgeon growth that incorporated latitude and longitude (LAT/LON) in its
predictions to estimate TL23-27. Using the LAT/LON’s of Stan’s Honey Hole, the growth model
predicts TL23-27 to be 1168.06 mm (Fortin et al., 1997). However mean TL23-27 ranged from
1170.0 to 1402.0 in the White River with a mean of 1308.67 m, while the growth model for the
White River had a mean TL23-27 of 1368.70 mm. Therefore it appears that that the White River
0
500
1000
1500
2000
2500
0 20 40 60 80 100
Tota
l Len
gth
(mm
)
Age (years)
White RiverPic RiverDU 8ADU 8BDU 8CLake NipigonLake of the Woods
Page 44
37
Lake Sturgeon population, and to a lesser extent the Pic River population, are relatively fast
growing and grow to a large L∞ compared to other populations that exist in their local and long-
range geographical distribution.
4.2 Habitat Utilization and Movement Patterns
Lake Sturgeon showed a strong site fidelity for two locations in the White River, which
included Stan’s Honey Hole and the pool below Chigamiwinigum Falls. The non-random
distribution analysis (FishTel version 1.4) and point-density analysis (ArcMap™ 10) (Figure 9)
that was performed in this study provided strong evidence to support this claim. Lake Sturgeon
habitat utilization varies quite substantially between and within different systems, and especially
between natural and modified systems. One consistent finding, regardless of the system, is that
Lake Sturgeon show strong site fidelity for specific pool mesohabitats within riverine systems. In
the Pic River, Lake Sturgeon regularly congregated in six deep pools that were dispersed
throughout a 5 km section of rapids (Ecclestone, 2011). In the Grasse River, 60% of all manual
telemetry detections occurred within three areas over a 22-month period (Trested, 2010). In the
Mississippi River, 50% of all manual telemetry detections occurred within one area over an 18-
month period (Knight et al., 2002). In a natural reach of the Ottawa River, Lake Sturgeon had a
tendency to remain within one basin, and although they may have left periodically, they always
returned to the same basin (Haxton, 2003b). Finally, in the Kettle River, 80% of all manual
telemetry detections occurred within a 1 km portion of the lower river over a 23-month study
period (Borkholder et al., 2002). These locations have been identified as core areas (Knights et
al., 2002) or activity centers (Borkholder et al., 2002) that Lake Sturgeon depend upon for
foraging and/or spawning purposes.
Page 45
38
Movement rates and MDPD were negatively correlated with GDD per week and GDD
since June 1st, which resulted in significantly reduced movements as time progressed from early-
spring to late-summer. MDPD was also negatively correlated with depth, which resulted in
significantly less movement at Henry’s Honey Hole and at the pool below Chigamiwinigum
Falls. Several studies have reported a decrease in the movement rates of Lake Sturgeon as
temperatures and GDD per week increase, such as Rusak and Mosindy (1997) in Lake of the
Woods and Knights et al. (2002) in the Mississippi River. Trested et al. (2011) found that Lake
Sturgeon MDPD in the Grasse River decreased from 930 m/day (± 110 m/day) in the spring to
100 m/day (± 170 m/day) in the summer. Rusak and Mosindy (1997) found that Lake Sturgeon
movements decreased from 840 m/day (± 670 m/day) in the spring to 758 m/day (± 560 m/day)
in the summer. If we use the same criteria to delineate spring and summer as these two studies,
we find that Lake Sturgeon movement rates in the White River decreased from 386 m/day (± 75
m/day) in the spring to 197.5 m/day (± 24 m/day) in the summer. Therefore Lake Sturgeon
movement rates decreased throughout the sampling period and from spring to summer, which is
common amongst most Lake Sturgeon populations across their geographical range. Although not
statistically tested in the Pic River because of sampling limitations, an observation was made that
Lake Sturgeon displacement followed a similar pattern in this system (Ecclestone, 2011).
McKinley et al. (1998) suggest that populations reduce MDPD during the summer to avoid
thermal stress that is induced from increasing water temperatures; we suggest that this
explanation serves well for our observations in the White River as well. Furthermore, we suggest
that Lake Sturgeon selected deep water habitat and reduced their movements once encountering
deep water as this habitat serves as a thermal refuge from elevated summer water temperatures.
Finally, movements associated with spawning and reproduction could elevate springtime
Page 46
39
displacement rates as Lake Sturgeon ascend rivers to spawn at the uppermost navigable barrier
(Bruch & Binkowski, 2002).
One finding that this study did uncover, which has been underreported for most Lake
Sturgeon systems, is the magnitude and frequency of immigration and emigration that occurs
between the White and Pic Rivers. Of the 48 individuals that had been radio tagged from 2008 to
2010 in the Pic River, five of them appeared in the White River at some point throughout the
summer of 2011 and four of them appeared in both the Pic and White Rivers throughout 2011.
Of the 40 individuals that were radio tagged in the White River in 2011, six of these individuals
were later picked up in the Pic River within the same year. Therefore we can conservatively
estimate that emigration from the White River to the Pic River occurs at a rate of approximately
15.0 % per year (6 emigrating individuals ÷ 40 radio tagged individuals), while emigration from
the Pic River to the White River occurs at a rate of 10.4% per year (5 emigrating individuals ÷ 48
radio tagged individuals). In 2008, two Lake Sturgeon were captured in the Pic River that had
originally been tagged in the Black Sturgeon River, approximately 200 km west of the Pic River
near the city of Thunder Bay, Ontario (Dreary, 2008; Ecclestone, 2011). In the Sturgeon River,
radio tagged Lake Sturgeon were captured 230 km east and 280 km west of the river, however
they were captured in bays of Lake Superior and not within other spawning tributaries (Auer,
1999). Although it has been acknowledged in the literature that site fidelity and homing
capabilities appear to be strong for Lake Sturgeon, these results suggest that straying is
somewhat common amongst Lake Sturgeon populations. In light of this evidence, it is advocated
that the concept of a metapopulation be given greater consideration for Lake Sturgeon.
Metapopulation dynamics have been suggested for Lake Sturgeon in the St. Marys River
(Bauman et al., 2011), for populations in the Lower Niagara and Detroit/St. Clair Rivers (Welsh
Page 47
40
& McLeod, 2010), and for White Sturgeon in the highly fragmented Columbia River system
(Jager et al., 2001; Coutant, 2004). The rate of immigration and emigration between the Pic and
White Rivers will continue to be monitored in the coming years using the automated base station
receivers. Genetic analysis will also be performed on Lake Sturgeon from the White and Pic
Rivers to evaluate genetic similarities between these populations and to speculate on the
magnitude of genetic exchange between these populations.
4.3 Conclusions & Future Directions
Lake Sturgeon growth parameters and CPUE were elevated in the White River compared
to other locations across its geographical range, however their condition factor and weight-length
relationship was comparable to other populations that have been studied. Habitat utilization and
movement patterns were comparable to observations in other spawning tributaries, whereby Lake
Sturgeon showed a strong preference for pool mesohabitats and decreased their movements as
water temperatures and GDD increased. Although this study uncovered a lot of information on
the White River Lake Sturgeon population, especially in regards to their movements between the
Pic and White Rivers, there is still some information that needs to be collected in order to fully
understand this system. First it is suggested that future studies incorporate larger (> 10”) and
smaller (< 8”) mesh sizes to collect physical attributes from juvenile and old adult Lake Sturgeon
in the White River. Secondly, it is encouraged that base stations remain at the mouth of both the
Pic and White Rivers and at a second location further upstream on both rivers to continue
monitoring the rate of immigration and emigration from and to both systems. Genetic studies
could also be undertaken to identify genetic similarities and/or differences between the two
populations, which could provide further resolution to the amount and rate of genetic exchange
Page 48
41
between these two systems. Consecutive day manual telemetry should also continue for the next
one to two years in order to maximize the value of each radio tag since one to two years of
battery life remains on each tag. Geospatial habitat mapping, which includes georeferenced
information on the substrate and depth of the White River, should also be performed to identify
the habitat characteristics that are associated with critical or frequently used habitat in the White
River. Upon collecting this data, a habitat suitability model for Lake Sturgeon could be
performed to assess and monitor changes in the quality and/or quality of significant Lake
Sturgeon habitat. There may also be a spring or some other source of highly oxygenated water at
the bottom of Stan’s Honey Hole, which could explain the aggregated distribution at this
location. Finally because of time constraints associated with labour intensive radio telemetry, we
were not able to perform spawning assessments in the White River during the spring of 2012. To
this point, we have captured ripe individuals near Chigamiwinigum Falls and suspect that this
acts as the main spawning site within the river. However without the collection of eggs or larvae
as evidence to confirm that spawning is occurring in the White River, we cannot conclusively
suggest that Lake Sturgeon spawn in the White River. Therefore we strongly encourage that
spawning surveys be undertaken in the White River to assess Lake Sturgeon spawning efforts in
this tributary. Despite the aforementioned list of information gaps still required for the White
River Lake Sturgeon population, this study has made great progress towards understanding this
population, especially if you consider that no information existed prior to July of 2010. With the
publication of this report we hope that other Lake Sturgeon biologists and management agencies
will make the White River a priority tributary for Lake Sturgeon rehabilitation in Lake Superior
as it contains a healthy and fast growing population that is ensured long-term protection from
development and anthropogenic pressures.
Page 49
42
Appendix
Appendix 1 – Date, time, duration, temperature, location, depth, size, and number of captured Lake Sturgeon in each net that was set
in the White River throughout the spring and summer of 2011.
Set Date Effort
Number Set
Time Lift
Time Duration
(hrs.) Duration (mins.)
Set Temp. (°C)
Lift Temp. (°C)
Easting Northing Start Depth
(m)
End Depth
(m)
Mesh Size
(inch)
Net Length (feet)
Total New
Captures
Total Recaptures
Total Captures
20-May-11 1 13:53 11:26 21 33 10.9 11.8 556291 5379125 3.3 13.6 9 100 0 0 0 20-May-11 2 14:18 12:00 21 42 11.0 11.8 556290 5379037 4.5 1.7 8 100 1 0 1 20-May-11 3 15:36 15:00 23 24 11.2 11.8 552936 5377622 1.2 8.9 10 300 0 0 0 20-May-11 4 16:23 17:09 24 46 11.1 11.5 555838 5379740 4.5 17.5 9 100 0 0 0 21-May-11 5 13:45 11:26 21 41 11.8 11.8 556263 5379034 0.5 2.0 9 100 0 0 0 21-May-11 6 17:14 18:05 24 51 11.6 12.0 555818 5379789 0.8 10.5 10 300 0 0 0 21-May-11 7 18:06 11:58 25 52 11.6 11.8 556286 5379143 1.4 5.2 9 100 1 0 1 22-May-11 8 14:37 11:35 20 58 11.8 12.0 556286 5379143 1.4 5.2 9 100 0 0 0 22-May-11 9 19:42 11:44 16 2 11.8 12.0 556282 5379210 2.8 5.4 10 200 0 0 0 23-May-11 10 11:41 10:22 22 41 12.0 11.0 556286 5379143 1.4 5.2 9 100 0 0 0 23-May-11 11 12:00 10:49 22 49 12.0 11.0 556340 5379217 2.1 4.5 10 200 2 0 2 23-May-11 12 17:30 10:17 16 47 12.0 11.0 556346 5379208 NA NA 10 200 0 0 0 02-Jun-11 13 16:46 10:22 17 36 13.0 12.8 556339 5379210 2.0 5.2 9 100 0 0 0 02-Jun-11 14 17:04 10:41 17 37 13.0 12.8 556067 5379330 6.5 4.9 10 100 0 0 0 02-Jun-11 15 17:30 17:42 24 12 12.4 13.8 555842 5379758 2.5 6.3 9 200 0 1 1 02-Jun-11 16 17:30 10:57 17 27 13.0 12.7 556133 5379131 5.3 8.9 10 200 4 0 4 03-Jun-11 17 16:46 14:48 22 2 12.8 13.6 556339 5379210 2.0 5.3 9 100 1 0 1 03-Jun-11 18 17:20 16:20 23 0 13.8 13.6 556097 5379193 8.3 2.7 10 100 0 1 1 03-Jun-11 19 19:03 16:52 21 49 14.0 13.6 555852 5379793 1.7 17.0 9 100 0 0 0 04-Jun-11 20 15:00 11:32 20 32 13.6 14.0 556339 5379210 2.0 5.2 9 100 2 0 2 04-Jun-11 21 16:43 14:22 21 39 13.6 14.0 556213 5379049 6.1 3.2 9 100 0 0 0 04-Jun-11 22 17:08 15:08 22 0 13.8 13.8 555901 5379750 2.4 12.7 10 100 0 0 0 05-Jun-11 23 11:50 10:38 22 48 14.0 14.2 556339 5379210 2.0 5.2 9 100 0 0 0 05-Jun-11 24 14:55 10:49 19 54 13.8 14.0 556173 5379215 2.7 10.7 10 200 0 0 0
Page 50
43
05-Jun-11 25 15:14 11:32 20 18 13.8 14.0 555901 5379750 2.4 12.7 10 100 0 0 0 06-Jun-11 26 10:45 9:35 22 50 14.2 15.2 556339 5379210 2.0 5.2 9 100 2 0 2 06-Jun-11 27 11:05 10:48 23 43 14.0 15.0 556127 5379380 4.4 3.4 10 100 0 0 0 06-Jun-11 28 11:35 10:58 23 23 14.0 15.0 555865 5379693 5.2 16.9 10 100 2 0 2 06-Jun-11 29A 16:50 14:34 21 44 15.0 14.8 553928 5377976 1.1 6.6 10 200 0 0 0 14-Jun-11 29B 15:45 13:11 21 26 15.8 16.3 556338 5379228 3.0 3.3 10 100 1 0 1 14-Jun-11 30 16:00 13:34 21 34 15.8 16.2 556097 5379210 2.9 8.7 10 100 0 0 0 14-Jun-11 31 16:15 14:00 21 45 15.8 16.2 555898 5379714 8.3 17.0 9 100 0 0 0 14-Jun-11 32 15:05 9:34 18 29 15.8 16.0 553979 5377742 2.3 9.6 10 200 0 0 0 15-Jun-11 33 13:15 17:15 28 0 16.1 17.0 556318 5379321 4.9 4.8 10 100 0 0 0 15-Jun-11 34 13:47 17:34 27 47 16.3 17.0 556234 5379202 2.7 8.8 10 100 0 0 0 15-Jun-11 35 14:10 17:52 27 42 16.2 17.0 555859 5379678 25.6 7.3 10 100 2 0 2 15-Jun-11 36 9:46 13:53 29 7 16.1 17.0 553934 5537618 0.7 3.0 10 200 0 0 0 15-Jun-11 37 15:56 13:25 21 29 16.2 17.0 556140 5379132 12.6 14.9 8 100 1 1 2 15-Jun-11 38 16:11 14:45 22 34 16.2 17.0 555842 5379601 5.3 5.2 8 100 0 1 1 16-Jun-11 39 14:13 11:52 21 39 17.0 17.8 554006 5377526 5.8 4.3 10 200 0 0 0 16-Jun-11 40 17:30 9:41 16 11 17.0 17.2 556303 5379189 3.1 3.3 10 100 0 0 0 16-Jun-11 41 18:00 10:22 16 22 17.0 17.2 555859 5379678 12.9 7.3 9 100 0 0 0 16-Jun-11 42 16:00 9:53 17 53 17.0 17.0 556159 5379124 16.9 21.2 10 100 0 0 0 17-Jun-11 43 10:07 16:44 30 37 17.0 17.8 556268 5379043 1.2 1.6 8 100 0 0 0 17-Jun-11 44 10:40 17:23 30 43 17.0 17.4 555891 5379748 16.4 12.6 9 100 1 0 1 17-Jun-11 45 9:50 17:07 31 17 17.2 18.2 556323 5379222 6.2 5.2 10 100 0 0 0 17-Jun-11 46 12:10 18:00 29 50 17.8 17.2 553924 5377693 5.1 1.0 10 200 0 0 0 18-Jun-11 47 16:58 11:07 18 9 17.8 17.6 556182 5379065 6.2 8.7 8 100 1 0 1 18-Jun-11 48 17:16 10:55 17 39 18.2 17.8 556279 5379219 4.6 5.2 10 100 0 0 0 18-Jun-11 49 17:42 12:32 18 50 17.4 18.0 555887 5379755 6.1 18.1 9 100 0 0 0 18-Jun-11 50 18:08 12:51 18 43 17.2 18.0 553947 5377682 5.1 1.0 10 200 0 0 0 19-Jun-11 51 11:04 10:30 23 26 17.8 17.5 556345 5379218 4.4 6.2 10 100 0 0 0 19-Jun-11 52 11:16 10:17 23 1 17.6 17.2 556182 5379065 6.2 8.7 8 100 0 0 0 19-Jun-11 53 12:42 14:39 25 57 18.0 17.2 555878 5379557 11.4 9.7 9 100 0 0 0 19-Jun-11 54 13:10 15:30 26 20 17.8 17.0 554006 5377576 4.9 4.1 10 200 0 0 0 19-Jun-11 55 13:46 10:54 21 8 18.0 17.2 555863 5379695 4.2 12.1 8 100 3 0 3 19-Jun-11 56 15:47 16:02 24 15 17.6 17.2 554471 5378610 4.1 7.1 8 100 0 1 1 20-Jun-11 57 10:46 9:49 23 3 17.4 17.5 556277 5379131 5.2 6.6 10 100 0 0 0
Page 51
44
20-Jun-11 58 10:28 10:01 23 33 17.0 17.8 556096 5379326 8.1 3.3 8 100 0 0 0 20-Jun-11 59 11:05 10:15 23 10 17.2 17.2 555863 5379695 4.2 7.1 8 100 0 0 0 20-Jun-11 60 14:55 10:35 19 40 17.4 17.2 555569 5379333 6.3 4.8 9 100 0 0 0 20-Jun-11 61 15:16 11:12 19 56 17.2 18.0 554522 5378633 4.6 5.5 8 100 0 0 0 20-Jun-11 62 15:35 11:26 19 51 17.0 16.2 553952 5377325 2.0 4.2 10 200 1 0 1 27-Jun-11 63 15:02 11:34 20 32 17.4 18.0 556331 5379219 4.1 2.3 9 100 0 0 0 27-Jun-11 64 15:15 11:57 20 42 17.4 17.0 556130 5379166 9.0 12.3 8 100 0 1 1 27-Jun-11 65 15:18 13:23 22 5 17.4 17.2 555863 5379671 5.7 6.1 10 100 2 0 2 27-Jun-11 66 15:29 15:34 24 5 17.2 17.4 554563 5378591 2.5 2.3 10 100 0 0 0 28-Jun-11 67 11:46 8:31 20 45 18.0 16.9 556302 5379194 1.4 4.0 9 100 0 0 0 28-Jun-11 68 13:15 8:21 19 6 17.0 17.0 556168 5379077 3.2 12.3 8 100 2 0 2 29-Jun-11 69 13:37 9:36 19 59 17.0 17.3 555863 5379671 5.7 6.1 10 100 0 0 0 29-Jun-11 70 15:44 9:55 18 11 17.4 17.3 554405 5378444 1.6 4.3 10 100 0 0 0 04-Jul-11 71 12:30 10:45 22 15 20.0 20.0 556128 5379137 2.5 8.8 10 100 1 0 1 04-Jul-11 72 12:45 11:38 22 53 21.0 20.0 556070 5379194 1.9 6.5 10 100 0 0 0 04-Jul-11 73 13:01 11:56 22 55 20.0 20.0 555859 5379696 4.6 3.0 9 100 2 0 2 04-Jul-11 74 13:08 13:45 24 37 20.0 20.0 554779 5378768 5.2 5.4 9 100 0 0 0 04-Jul-11 75 16:12 14:23 22 11 20.0 20.0 553932 5377666 1.6 4.2 10 100 0 0 0 04-Jul-11 76 16:20 14:59 22 39 20.0 20.0 554044 5378104 4.7 4.1 8 100 2 1 3 05-Jul-11 77 11:32 10:05 22 33 20.0 20.0 556152 5379103 10.0 16.7 10 100 1 0 1 05-Jul-11 78 11:48 10:55 23 7 20.0 20.0 556340 5379216 1.2 3.0 10 100 0 0 0 05-Jul-11 79 14:02 11:04 21 2 20.0 20.0 555907 5379744 6.0 18.0 9 100 1 0 1 05-Jul-11 80 14:47 11:52 21 5 20.0 20.5 553932 5377666 1.6 4.2 10 200 0 0 0 05-Jul-11 81 15:07 12:20 21 13 20.0 20.5 554078 5378142 2.2 4.3 8 100 0 0 0 06-Jul-11 82 10:10 10:20 24 10 20.0 20.5 556152 5379105 9.6 16.2 10 100 0 0 0 06-Jul-11 83 10:58 10:43 23 45 20.0 20.5 556320 5379208 2.3 3.4 10 100 1 0 1 06-Jul-11 84 11:14 11:17 24 3 20.0 20.5 555903 5379741 3.0 16.0 9 100 0 0 0 06-Jul-11 85 12:11 12:28 24 17 20.0 20.5 553912 5377739 2.7 3.8 10 200 1 0 1 06-Jul-11 86 12:28 10:52 22 24 20.5 20.5 554092 5378156 2.7 3.6 8 100 3 0 3 12-Jul-11 87 15:41 13:04 21 23 20.0 20.0 556317 5379201 1.2 5.0 8 100 0 0 0 12-Jul-11 88 15:50 13:25 21 35 20.0 20.0 556124 5379144 4.2 18.3 9 100 0 0 0 12-Jul-11 89 15:58 13:38 22 40 20.0 20.5 555912 5379663 5.0 11.8 10 100 0 0 0 12-Jul-11 90 16:15 14:02 21 47 19.6 20.8 554107 5378177 2.0 2.5 10 100 1 0 1 13-Jul-11 91 13:10 9:45 20 35 20.0 19.2 556328 5379212 1.9 5.1 8 100 0 0 0
Page 52
45
13-Jul-11 92 13:30 9:54 20 24 20.0 19.0 556126 5379166 4.0 8.8 9 100 2 0 2 13-Jul-11 93 13:49 12:16 22 27 20.5 20.2 555886 5379735 7.9 15.2 10 100 2 1 3 13-Jul-11 94 14:18 15:50 25 32 20.8 20.1 554107 5378177 2.0 2.5 10 100 0 0 0 13-Jul-11 95 14:25 15:21 24 56 19.8 20.1 553945 5377296 5.4 6.2 8 100 0 0 0 14-Jul-11 96 9:47 11:02 25 15 19.2 20.5 556283 5379144 4.2 6.0 8 100 0 0 0 14-Jul-11 97 10:06 11:22 25 16 20.0 20.5 556126 5379166 4.0 8.8 9 100 0 1 1 14-Jul-11 98 12:30 11:49 23 19 20.0 20.5 555886 5379735 7.9 15.2 10 100 0 0 0 14-Jul-11 99 15:05 12:11 21 6 20.1 20.5 554338 5378379 4.1 7.6 10 100 0 0 0 15-Jul-11 100 11:11 16:02 28 51 20.5 20.5 556075 5379284 6.1 4.1 9 100 0 0 0 15-Jul-11 101 11:36 16:15 28 39 20.5 20.5 556237 5379092 5.4 13.0 9 100 3 1 4 15-Jul-11 102 11:55 19:18 31 23 20.5 20.5 555862 5379658 5.9 8.8 10 100 0 0 0 15-Jul-11 103 12:20 17:29 29 9 20.5 20.5 553954 5378093 4.1 5.0 10 100 0 0 0 16-Jul-11 104 16:08 10:22 18 14 20.5 20.8 556055 5379819 6.9 13.2 9 100 0 0 0 16-Jul-11 105 16:22 10:02 17 40 20.5 20.5 556237 5379092 5.4 13.0 9 100 0 1 1 16-Jul-11 106 19:21 10:57 15 36 20.5 21.0 555862 5379658 5.9 8.8 10 100 1 0 1 16-Jul-11 107 12:20 12:59 24 39 20.5 20.8 553954 5378093 4.1 5.0 10 100 0 0 0 17-Jul-11 108 10:13 9:41 23 28 20.5 21.2 556209 5379051 2.9 4.3 9 100 0 0 0 17-Jul-11 109 10:31 10:02 23 31 20.5 21.2 556138 5379610 5.9 3.1 9 100 2 0 2 17-Jul-11 110 10:48 11:39 24 51 21.8 22.0 555886 5379794 2.9 15.7 8 100 0 1 1 17-Jul-11 111 13:15 12:27 23 12 21.0 21.5 553947 5377630 5.5 1.4 10 200 2 1 3 17-Jul-11 112 13:45 12:08 22 23 20.5 22.0 554441 5378572 4.8 7.5 10 100 0 0 0 18-Jul-11 113 9:48 11:06 25 18 21.2 22.8 556167 5379187 3.4 21.2 9 100 0 2 2 18-Jul-11 114 10:31 11:38 25 7 21.2 22.8 556138 5379610 5.9 3.1 9 100 3 0 3 18-Jul-11 115 11:58 12:36 24 38 22.0 23.0 555862 5379700 8.9 8.5 8 100 4 0 4 18-Jul-11 116 12:14 13:55 25 41 22.0 23.0 554527 5378577 3.0 3.1 10 100 1 0 1 18-Jul-11 117 12:41 14:20 25 39 21.5 23.0 553945 5377600 1.9 4.1 10 200 0 0 0 19-Jul-11 118 11:39 10:03 22 24 22.8 23.0 556076 5379771 4.1 12.4 9 100 0 0 0 19-Jul-11 119 13:50 10:23 20 33 23.0 23.0 555350 5379233 7.0 4.6 8 100 0 0 0 19-Jul-11 120 14:00 10:43 20 43 23.0 22.5 554527 5378577 3.0 3.1 10 100 0 0 0 19-Jul-11 121 14:27 11:04 20 37 22.8 22.8 553945 5377600 1.9 4.1 10 200 0 0 0 26-Jul-11 122 13:47 10:10 20 23 20.8 20.5 556235 5379082 2.3 11.5 10 100 0 0 0 26-Jul-11 123 13:50 10:22 20 32 22.0 20.5 556329 5379218 3.9 5.7 8 100 0 0 0 26-Jul-11 124 14:11 10:32 20 21 21.0 21.1 555854 5379634 9.7 4.7 8 100 2 0 2 26-Jul-11 125 14:27 12:32 22 5 21.0 20.2 553949 5378021 5.1 3.3 10 200 2 1 3
Page 53
46
26-Jul-11 126 14:36 12:04 21 28 21.0 20.2 554457 5378599 4.1 7.2 9 100 0 0 0 27-Jul-11 127 10:17 9:31 23 14 20.5 20.1 556137 5379143 3.4 16.6 10 100 0 0 0 27-Jul-11 128 10:26 9:41 23 15 20.5 20.1 556280 5379214 3.1 4.7 8 100 0 0 0 27-Jul-11 129 10:46 17:46 7 0 20.5 20.8 555854 5379634 9.7 4.7 8 100 0 0 0 27-Jul-11 130 12:12 9:57 21 45 20.2 20.1 554327 5378441 3.9 10.8 9 100 1 0 1 27-Jul-11 131 12:54 10:27 21 33 20.2 20.1 553949 5378021 5.1 3.1 10 200 1 0 1
Page 54
47
Appendix 2 – Arrangement of radio frequencies in the frequency tables of base stations. Radio
frequencies were sorted by pulse rate and contained radio tag frequencies from the White and Pic
Rivers.
Frequency (kHz)
Frequency Table #
Tag Implanted in:
150.011 Table 1 Pic River
150.055 Table 1 Pic River
150.073 Table 1 Pic River
150.095 Table 1 Pic River
150.116 Table 1 Pic River
150.147 Table 1 Pic River
150.164 Table 1 Pic River
150.185 Table 1 Pic River
150.205 Table 1 Pic River
150.244 Table 1 Pic River
150.264 Table 1 Pic River
150.285 Table 1 Pic River
150.303 Table 1 Pic River
150.324 Table 1 Pic River
150.344 Table 1 Pic River
150.363 Table 1 Pic River
150.384 Table 1 Pic River
150.533 Table 1 Pic River
150.553 Table 1 Pic River
150.593 Table 1 Pic River
150.654 Table 1 Pic River
150.673 Table 1 Pic River
151.002 Table 1 Pic River
151.023 Table 1 Pic River
151.045 Table 1 Pic River
151.065 Table 1 Pic River
151.087 Table 1 Pic River
151.104 Table 1 Pic River
151.124 Table 1 Pic River
151.145 Table 1 Pic River
151.165 Table 1 Pic River
151.185 Table 1 Pic River
151.206 Table 1 Pic River
151.248 Table 1 Pic River
151.266 Table 1 Pic River
151.286 Table 1 Pic River
Page 55
48
151.325 Table 1 Pic River
151.345 Table 1 Pic River
151.364 Table 1 Pic River
151.385 Table 1 Pic River
151.405 Table 1 Pic River
151.426 Table 1 Pic River
151.444 Table 1 Pic River
151.464 Table 1 Pic River
151.485 Table 1 Pic River
151.226 Table 2 White River
151.303 Table 2 White River
151.515 Table 2 White River
151.594 Table 2 White River
151.615 Table 2 White River
151.677 Table 2 White River
151.695 Table 2 White River
151.754 Table 2 White River
151.814 Table 2 White River
151.833 Table 2 White River
151.893 Table 2 White River
152.002 Table 3 White River
152.019 Table 3 White River
152.043 Table 3 White River
152.062 Table 3 White River
152.073 Table 3 White River
152.081 Table 3 White River
152.102 Table 3 White River
152.123 Table 3 White River
152.133 Table 3 White River
152.141 Table 3 White River
152.16 Table 3 White River
152.182 Table 3 White River
152.192 Table 3 White River
152.202 Table 3 White River
152.241 Table 3 White River
152.263 Table 3 White River
152.282 Table 3 White River
152.302 Table 3 White River
152.322 Table 3 White River
152.341 Table 3 White River
152.362 Table 3 White River
152.382 Table 3 White River
152.402 Table 3 White River
Page 56
49
152.421 Table 3 White River
152.441 Table 3 White River
152.461 Table 3 White River
152.482 Table 3 White River
152.502 Table 3 White River
152.523 Table 3 White River
Page 57
50
Appendix 3 – Raw data from the 82 Lake Sturgeon that were captured in the White River in 2011.
Fish Number
Lift Date Sample
# FL
(mm) TL
(mm) Girth (mm)
Round Weight (g)
Age Sex Recap 12mm PIT Tag 32mm PIT
Tag Floy Tag #
Radio Tag #
1 21‐May‐11 2 1388 1508 572 21000 31 2 n 151315793A 5326 ‐ yellow
2 22‐May‐11 7 1150 1285 435 12750 19 1 n 151316137A 139143245 5327 ‐ yellow 151.677
3 23‐May‐11 11 1425 1559 558 24500 30 2 n 150962354A 139142769 5328 ‐ yellow 151.814
4 23‐May‐11 11 1121 1262 423 12100 18 1 n 151315215A 139143245 5329 ‐ yellow 151.833
5 03‐Jun‐11 16 1295 1375 430 17750 27 2 n 122129497A 139143170 5330 ‐ yellow 151.893
6 03‐Jun‐11 16 1100 1231 440 14000 26 1 n 133147467A 139143094 5331 ‐ yellow 151.754
7 03‐Jun‐11 16 1239 1361 480 17000 2 n 132776650A 139142978 5332 ‐ yellow 151.515
8 03‐Jun‐11 16 1170 1289 450 13500 18 1 n 133356522A 139142771 5333 ‐ yellow 151.695
9 03‐Jun‐11 15 1265 1450 420 12500 1 y 9820091011340411 139142893 DFO‐GLLFAS 6661 ‐ yellow 151.615
10 04‐Jun‐11 17 1237 1332 501 17500 24 1 n 133263394A 139143236 5334 ‐ yellow 151.594
RECAP 04‐Jun‐11 18 1121 1262 423 12100 1 y 151315215A 139143245 5329 ‐ yellow 151.833
11 05‐Jun‐11 20 1118 1218 498 14250 17 2 n 132855463A 139143136 5335 ‐ yellow 151.226
12 05‐Jun‐11 20 1115 1205 415 11200 12 1 n 133175194A 139143158 5336 ‐ yellow 151.303
13 07‐Jun‐11 26 1109 1232 367 11000 15 1 n 133265632A 5337 ‐ yellow
14 07‐Jun‐11 26 1128 1235 412 11200 24 1 n 133277311A 139143272 5338 ‐ yellow 152.322
15 07‐Jun‐11 28 1464 1525 521 22000 31 2 n 132636173A 139143114 5339 ‐ yellow 152.362
16 07‐Jun‐11 28 1190 1305 492 15200 23 2 n 132915632A 139143279 5340 ‐ yellow 152.461
17 16‐Jun‐11 35 1259 1170 470 14750 26 1 n 132812323A 139143120 5342 ‐ yellow 152.133
18 16‐Jun‐11 35 1104 1191 420 11000 19 2 n 133316530A 139143082 5343 ‐ yellow 152.282
19 16‐Jun‐11 37 1370 1490 472 17750 1 y 151315793A 139143282 5326 ‐ yellow 152.441
20 16‐Jun‐11 37 1151 1264 488 14500 16 1 n 133309797A 139143004 5341 ‐ yellow 152.382
RECAP 16‐Jun‐11 38 1119 1214 y 150962260A
21 18‐Jun‐11 44 1055 1188 430 11100 20 1 n 132856734A 139142846 5344 ‐ yellow 152.402
22 19‐Jun‐11 47 1089 1202 382 9200 18 1 n 133136680A 139143010 5345 ‐ yellow 152.302
23 20‐Jun‐11 55 1025 1120 375 9100 22 2 n 132729540A 139143167 5346 ‐ yellow 152.421
24 20‐Jun‐11 55 1117 1216 422 11400 22 2 n 133352621A 139143138 5347 ‐ yellow 152.341
25 20‐Jun‐11 55 1040 1155 404 10000 12 1 n 132757525A 139143171 5348 ‐ yellow 152.241
Page 58
51
RECAP 20‐Jun‐11 56 1128 1235 412 11200 1 y 133277311A 139143272 5338 ‐ yellow 152.322
26 21‐Jun‐11 62 1350 1480 482 17750 29 2 n 151347446A 139143109 5439 ‐ yellow 152.263
27 29‐Jun‐11 64 1260 1337 505 16500 2 y 431049772C 139142899 DFO‐GLLFAS 7364 ‐ yellow 152.523
28 29‐Jun‐11 65 1245 1382 483 15750 23 2 n 151348167A 139143276 5350 ‐ yellow 152.141
29 29‐Jun‐11 65 961 1060 388 7500 17 2 n 132666131A 139142090 5300 ‐ yellow 152.502
30 30‐Jun‐11 68 768 880 340 4900 12 9 n 151348161A 5398 and 5299 ‐ yellow
31 30‐Jun‐11 68 907 1010 375 7125 12 1 n 151347047A 139143238 5297 ‐ yellow 152.081
32 05‐Jul‐11 71 1155 1260 515 13500 19 9 n 151347721A 5296 ‐ yellow
33 05‐Jul‐11 73 880 962 311 6750 9 2 n 151347731A 5295 ‐ yellow
34 05‐Jul‐11 73 1215 1305 425 15500 16 9 n 151347476A 5294 ‐ yellow
35 05‐Jul‐11 76 1075 1180 415 11150 22 2 n 151347770A 5293 ‐ yellow
36 05‐Jul‐11 76 1110 1232 428 11900 8 2 y 150962260A 151348223A 5292 ‐ yellow
37 05‐Jul‐11 76 1560 1720 563 27500 31 2 n 150952634A 5290 ‐ yellow
38 06‐Jul‐11 77 885 990 360 7300 14 2 n 150953096A 5282 ‐ yellow
39 06‐Jul‐11 79 1088 1185 444 12300 8 1 n 150945270A 5288 ‐ yellow
40 07‐Jul‐11 83 1178 1293 460 15000 19 1 n 151348142A 5287 ‐ yellow
41 07‐Jul‐11 86 1094 1182 433 11450 13 2 n 151348316A 5286 ‐ yellow
42 07‐Jul‐11 86 840 933 320 6000 12 2 n 151348194A 5285 ‐ yellow
43 07‐Jul‐11 86 708 760 295 4600 8 1 n 151347462A 5284 ‐ yellow
44 07‐Jul‐11 85 1375 1470 500 20000 36 2 n 151347271A 5283 ‐ yellow
44 13‐Jul‐11 90 1118 1214 452 12000 17 2 n 150944117A 139143123 5282 ‐ yellow 152.160
45 14‐Jul‐11 92 1121 1250 453 12900 18 2 n 150944496A 139143275 5281 ‐ yellow 152.192
46 14‐Jul‐11 92 1140 1281 421 13400 17 2 n 150957356A 139143169 5280 ‐ yellow 152.073
47 14‐Jul‐11 93 825 930 350 5500 13 9 n 150958593A 5279 ‐ yellow
48 14‐Jul‐11 93 1211 1346 482 15500 23 2 n 150951562A 139142770 5278 ‐ yellow 152.182
RECAP 14‐Jul‐11 93 907 1010 375 7125 1 y 151347047A 139143238 5297 ‐ yellow
RECAP 15‐Jul‐11 97 961 1060 388 7500 2 y 132666131A 139142090 5300 ‐ yellow
49 16‐Jul‐11 101 1080 1184 450 15 2 n 150955214A 139142971 5277 ‐ yellow 152.123
50 16‐Jul‐11 101 773 854 335 2750 12 9 n 150965113A 5276 ‐ yellow
51 16‐Jul‐11 101 1080 1210 420 9000 19 1 n 150955754A 139143265 5251 ‐ yellow 152.002
52 16‐Jul‐11 101 1075 1180 415 11150 2 y 151347770A 139142901 5293 ‐ yellow 152.019
53 17‐Jul‐11 106 1297 1402 465 16750 27 2 n 150937213A 139142784 5252 ‐ yellow 152.043
Page 59
52
RECAP 17‐Jul‐11 105 1080 1184 450 2 y 150955214A 139142971 5277 ‐ yellow
54 18‐Jul‐11 109 889 990 255 6200 14 9 n 150946544A 5253 ‐ yellow
55 18‐Jul‐11 109 1045 1125 418 11000 20 1 n 150938145A 139143085 5254 ‐ yellow 152.482
56 18‐Jul‐11 111 1001 1109 370 7500 17 9 n 150944480A 5225 ‐ yellow
57 18‐Jul‐11 111 1290 1422 470 16750 19 2 y 985121020477062 139143079 5256 ‐ yellow 152.202
58 18‐Jul‐11 111 1108 1236 450 12600 1 n 150964632A 139143313 5257 ‐ yellow 152.101
RECAP 18‐Jul‐11 110 1115 1205 415 11200 1 y 133175194A 139143158 5336 ‐ yellow
59 19‐Jul‐11 114 867 968 349 6000 15 9 n 150951256A 5258 ‐ yellow
60 19‐Jul‐11 114 899 946 361 6250 11 9 n 150947735A 5259 ‐ yellow
61 19‐Jul‐11 114 839 930 339 5300 14 9 n 150952633A 5260 ‐ yellow
62 19‐Jul‐11 115 1129 1250 521 17250 22 2 n 150939195A 5261 ‐ yellow
63 19‐Jul‐11 115 1056 1180 392 9000 14 1 n 150936724A 5262 ‐ yellow
64 19‐Jul‐11 115 806 903 320 4850 9 n 150951452A 5263 ‐ yellow
65 19‐Jul‐11 115 868 960 316 5250 9 n 151313494A 5264 ‐ yellow
66 19‐Jul‐11 116 1146 1215 407 12250 16 2 n 151253256A 5265 ‐ yellow
RECAP 19‐Jul‐11 113 1080 1184 450 2 y 150955214A 139142971 5277 ‐ yellow
RECAP 19‐Jul‐11 113 1211 1346 482 15500 2 y 150951562A 139142770 5278 ‐ yellow
67 27‐Jul‐11 124 1204 1338 502 16000 2 n 151316257A 5266 ‐ yellow
68 27‐Jul‐11 124 1314 1366 499 21000 28 2 n 151316257A 5266 ‐ yellow
69 27‐Jul‐11 125 790 700 315 3800 9 n 151313371A 5367 ‐ yellow
70 27‐Jul‐11 125 1290 1415 499 16750 16 1 n 139142995 5268 ‐ yellow 152.062
71 27‐Jul‐11 125 1093 1195 501 14000 15 2 y 982009101146312 139142329 5269 ‐ yellow 152.123
72 27‐Jul‐11 130 938 1025 388 7200 22 1 n 5270 & 5271 ‐ yellow
Page 60
53
Appendix 4 – Lake Sturgeon movements detected by manual telemetry sweeps. Stan’s Honey
Hole and Chigamiwinigum Falls are located 3.0 km to 3.5 km and 4.0 km to 4.5 km from Lake
Superior, respectively.
0
0.5
1
1.5
2
2.5
3
3.5
4
4.5
Distance from Lake Superior (km)
1104
00.51
1.52
2.53
3.54
4.5
Distance from Lake Superior (km)
1206
Page 61
54
00.51
1.52
2.53
3.54
4.5
Distance from Lake Superior (km)
1226
00.51
1.52
2.53
3.54
4.5
Distance from Lake Superior (km)
1248
Page 62
55
00.51
1.52
2.53
3.54
4.5
Distance from Lake Superior (km)
1303
00.51
1.52
2.53
3.54
4.5
Distance from Lake Superior (km)
1444
Page 63
56
00.51
1.52
2.53
3.54
4.5
Distance from Lake Superior (km)
1515
00.51
1.52
2.53
3.54
4.5
Distance from Lake Superior (km)
1594
Page 64
57
00.51
1.52
2.53
3.54
4.5
Distance from Lake Superior (km)
1615
00.51
1.52
2.53
3.54
4.5
Distance from Lake Superior (km)
1677
Page 65
58
00.51
1.52
2.53
3.54
4.5
Distance from Lake Superior (km)
1695
00.51
1.52
2.53
3.54
4.5
Distance from Lake Superior (km)
1754
Page 66
59
00.51
1.52
2.53
3.54
4.5
Distance from Lake Superior (km)
1893
00.51
1.52
2.53
3.54
4.5
Distance from Lake Superior (km)
2002
Page 67
60
00.51
1.52
2.53
3.54
4.5
Distance from Lake Superior (km)
2019
00.51
1.52
2.53
3.54
4.5
Distance from Lake Superior (km)
2043
Page 68
61
00.51
1.52
2.53
3.54
4.5
Distance from Lake Superior (km)
2073
00.51
1.52
2.53
3.54
4.5
Distance from Lake Superior (km)
2102
Page 69
62
00.51
1.52
2.53
3.54
4.5
Distance from Lake Superior (km)
2123
00.51
1.52
2.53
3.54
4.5
Distance from Lake Superior (km)
2133
Page 70
63
00.51
1.52
2.53
3.54
4.5
Distance from Lake Superior (km)
2141
00.51
1.52
2.53
3.54
4.5
Distance from Lake Superior (km)
2160
Page 71
64
00.51
1.52
2.53
3.54
4.5
Distance from Lake Superior (km)
2182
00.51
1.52
2.53
3.54
4.5
Distance from Lake Superior (km)
2192
Page 72
65
00.51
1.52
2.53
3.54
4.5
Distance from Lake Superior (km)
2202
00.51
1.52
2.53
3.54
4.5
Distance from Lake Superior (km)
2241
Page 73
66
00.51
1.52
2.53
3.54
4.5
Distance from Lake Superior (km)
2263
00.51
1.52
2.53
3.54
4.5
Distance from Lake Superior (km)
2282
Page 74
67
00.51
1.52
2.53
3.54
4.5
Distance from Lake Superior (km)
2302
00.51
1.52
2.53
3.54
4.5
Distance from Lake Superior (km)
2322
Page 75
68
00.51
1.52
2.53
3.54
4.5
Distance from Lake Superior (km)
2341
00.51
1.52
2.53
3.54
4.5
Distance from Lake Superior (km)
2362
Page 76
69
00.51
1.52
2.53
3.54
4.5
Distance from Lake Superior (km)
2382
00.51
1.52
2.53
3.54
4.5
Distance from Lake Superior (km)
2402
Page 77
70
00.51
1.52
2.53
3.54
4.5
Distance from Lake Superior (km)
2421
00.51
1.52
2.53
3.54
4.5
Distance from Lake Superior (km)
2441
Page 78
71
00.51
1.52
2.53
3.54
4.5
Distance from Lake Superior (km)
2461
00.51
1.52
2.53
3.54
4.5
Distance from Lake Superior (km)
2482
Page 79
72
00.51
1.52
2.53
3.54
4.5
Distance from Lake Superior (km)
2502
00.51
1.52
2.53
3.54
4.5
Distance from Lake Superior (km)
2523
Page 80
73
Appendix 5 – Bonferoni’s post-hoc test to test for significant differences between different
weeks.
25 26 27 28 29 30 31 32 35 36 37
25
26 >0.05
27 >0.05 >0.05
28 >0.05 >0.05 >0.05
29 0.0119 0.0005 >0.05 0.022
30 >0.05 >0.05 >0.05 >0.05 0.03
31 >0.05 >0.05 >0.05 >0.05 0.003 >0.05
32 >0.05 >0.05 >0.05 >0.05 >0.05 >0.05 >0.05
35 0.0033 0.0036 0.048 0.024 >0.05 0.011 0.009 >0.05
36 0.046 0.0425 >0.05 >0.05 >0.05 >0.05 >0.05 >0.05 >0.05
37 0.0059 0.0137 >0.05 >0.05 >0.05 0.02 0.035 >0.05 >0.05 >0.05
Page 81
74
6.0 Literature Cited:
Ackerman, P.A., J.D. Morgan, and G.K. Iwama. 2000. Fish Anesthetics. Unpublsihed. Canadian Council for Animal Care. Technical Report. (pp22).
Auer, N.A. 1996. Importance of habitat and migration to sturgeons with emphasis on lake sturgeon. Canadian Journal of Fisheries and Aquatic Sciences, 53: 152-160.
Auer, N.A. 1999. Population characteristics and movements of Lake Sturgeon in the Sturgeon River and Lake Superior. Journal of Great Lakes Research, 25: 282-293.
Auer, N.A., and E.A. Baker. 2002. Duration and drift of larval lake sturgeon in the Sturgeon River. Michigan Journal of Applied Ichthyology, 18: 557-564.
Auer, N.A. 2003. A lake sturgeon rehabilitation plan for Lake Superior. Department of Biological Sciences. Michigan Technology University. Houghton, Michigan. (pp28).
Baker, E.A., and D.J. Borgeson. 1999. Lake sturgeon abundance and harvest in Black Lake, Michigan, 1975-1999. North American Journal of Fisheries Management, 19: 1080-1088.
Baldwin, N.S., R.W. Saalfeld, M.A. Ross, and J.J. Buettner. 1979. Commercial fish production in the Great Lakes 1867-1977. Great Lakes Fisheries Commission. Ann Arbor, Michigan. Technical Report #3. (pp53).
Barth, C.C., S.J. Peake, P.J. Allen, and W.G. Anderson. 2009. Habitat utilization of juvenile lake sturgeon, Acipenser fulvescens, in a large Canadian river. Journal of Applied Ichtyology, 25: 18-26.
Bauman, J.M., A. Moerke, R. Greil, B. Gerig, E. Baker, and J Chiotti. 2011. Population demographics of lake sturgeon (Acipenser fulvescens) in the St. Marys River, from 2000 to 2007. Journal of Great Lakes Research, in press.
Beamish, F.W.H., J.A. Jebbink, A. Rossiter, and D.L.G. Noakes. 1996. Growth strategy of juvenile lake sturgeon (Acipenser fulvescens) in a northern river. Canadian Journal of Fisheries and Aquatic Sciences, 53: 481-489.
Boogard, M.A., T.D. Bills, and D.A. Johnson. 2003. Acute toxicity of TFM and a TFM/niclosamide mixture to selected species of fish, including lake sturgeon (Acipenser fulvescens) and mudpuppies (Necturus maculosus), in laboratory and field exposures. Journal of Great Lakes Research, 29: 529-541.
Borkholder, B.D., S.D. Morse, H.T. Weaver, R.A. Hugill, A.T. Linder, L.M. Schwarzkopf, T.E. Perrault, M.J. Zacher, and J.A. Frank. 2002. Evidence of a year-round resident population of Lake Sturgeon in the Kettle River, Minnesota, based on radiotelemetry and tagging. North American Journal of Fisheries Management, 22: 888-894.
Bruch, R.M., and F.P. Binkowski. 2002. Spawning behaviour of Lake Sturgeon (Acipenser fulvescens). Journal of Applied Ichtyology, 18: 570-579.
Page 82
75
Bruch, R.M. 2008. Modelling the population dynamics and sustainability of lake sturgeon in the Winnebago system, Wisconsin. Ph.D. Dissertation. University of Wisconsin. Milwaukee, Wisconsin. (247pp).
COSEWIC 2006. COSEWIC assessment and update status report on the lake sturgeon Acipenser fulvescens in Canada. Committee on the Status of Endangered Wildlife in Canada. Ottawa, Ontario. (pp107).
Coutant, C.C. 2004. A riparian habitat hypothesis for successful reproduction of White Sturgeon. Review in Fisheries Sciences, 12: 23-73.
Craig, J.M., M.V. Thomas, and S.J. Nichols. 2005. Length-weight relationship and a relative condition factor equation for lake sturgeon (Acipenser fulvescens) from the St. Clair River system (Michigan, USA). Journal of Applied Ichthyology, 21: 81-85.
Daugherty, D.J., T.M. Sutton, and R.F. Elliot. 2008a. Potential for reintroduction of lake sturgeon in five northern Lake Michigan tributaries: a habitat suitability perspective. Aquatic Conservation: Marine and Freshwater Ecosystems, 18: 692-702.
Daugherty, D.J., T.M. Sutton, and R.F. Elliot. 2008b. Suitability modeling of Lake Sturgeon habitat in hive northern Lake Michigan tributaries: implications for population rehabilitation. Restoration Ecology, 17: 245-257.
Deary, C. 2008. Lake Sturgeon (Acipenser fulvescens) Migration Patterns in the Pic River, ON, 2008. Unpublished. Anishinabek/Ontario Fisheries Resource Centre; Technical Report. (pp13).
Ecclestone, A.E. 2011. Movement patterns, habitat utilization, and spawning habitat of Lake Sturgeon (Acipenser fulvenscens) in the Pic River, a northeastern Lake Superior tributary in Ontario, Canada. M.Sc. Dissertation. Trent University. Peterborough, Ontario. (pp173).
Ferguson, M.M., and G.A. Duckworth. 1997. The status and distribution of Lake Sturgeon, Acipenser fulvescens, in the Canadian provinces of Manitoba, Ontario, and Quebec: a genetic perspective. Environmental Biology of Fishes, 48: 299-309.
Fortin, R., J-R. Mongeau, G. DesJardins, P. Dumont. 1993. Movements and biological statistics of the lake sturgeon (Acipenser fulvescens) populations from the St. Lawrence and Ottawa River system, Quebec. Canadian Journal of Zoology, 71: 638-650.
Fortin, R., P. Dumont, and S. Guenette. 1996. Determinants of growth and body condition of Lake Sturgeon (Acipenser fulvescens). Canadian Journal of Fisheries and Aquatic Sciences, 53: 1150-1156.
Friday, M. 2005a. Lake Sturgeon Radio Telemetry Study. Unpublished. Ontario Ministry of Natural resources; Technical Report. (pp3).
Friday, M. 2005b. The migratory and reproductive response of spawning lake sturgeon to controlled flows over Kakabeka Falls on the Kaministiquia River, Ontario, 2005.
Page 83
76
Unpublished. Upper Great Lakes Management Unit, Ontario Ministry of Natural Resources; Technical Report (05-01). (pp23).
Friday, M.J. 2011. Seasonal distribution and movement of Lake Sturgeon in the Black Sturgeon River and Black Bay, Lake Superior. Upper Great Lakes Management Unit, Ontario Ministry of Natural Resources; Technical Report. (pp37).
Hannibal-Paci, C. 1998. Historical representations of Lake Sturgeon by native and non-native artists. The Canadian Journal of Native Studies, 2: 203-232.
Harkness, W.J.K. 1923. The rate of growth and food of the lake sturgeon (Acipenser fulvescens). University of Toronto Studies. Biological Sciences 24. Publication of the Ontario Fisheries Research Laboratory. Toronto, Ontario.
Harkness, W.J.K., and J.R. Dymond. 1961. The lake sturgeon: the history of its fishery and problems of conservation. Fish and Wildlife Branch. Ontario Department of Lands and Forests. Toronto, Ontario. (pp121).
Hay-Chmielewski, E.M., and G.E. Whelan. 1997. Lake Sturgeon Rehabilitation Strategy. Fisheries Division. Michigan Department of Natural Resources. Lansing, Michigan. (pp51)
Haxton, T.J. 2003a. An assessment of lake sturgeon (Acipenser fulvescens) in various reaches of the Ottawa River. Journal of Applied Ichtyology, 18: 449-454.
Haxton, T.J. 2003b. Movement of Lake Sturgeon, Acipenser fulvescens, in a natural reach of the Ottawa River. Canadian Field-Naturalist, 117: 541-545.
Haxton, T.J., C.S. Findlay, and R.W. Threader. 2008. Predictive value of a Lake Sturgeon habitat suitability model. North American Journal of Fisheries Management, 28: 1373-1383.
Haxton, T.J., and C.S. Findlay. 2008. Variation in lake sturgeon (Acipenser fulvescens) abundance and growth among river reaches in a large regulated river. Canadian Journal of Fisheries and Aquatic Sciences, 65: 645-657.
Holzkamm, T.E., V.P. Lytwyn, and L.G. Waisberg. 1988. Rainy River Sturgeon: an Ojibway resource in the fur trade economy. The Canadian Geographer, 32: 194-205.
Hodgeson, S., T.P. Quinn, R. Hilborn, R.C. Francis, and D.E. Rogers. 2006. Marine and freshwater climatic factors affecting interannual variation in the timing of return migration to fresh water of sockeye salmon. Fisheries Oceanography, 15: 1-24.
Hopper, M., and G. Power. 1991. The fisheries of an Ojibwa Community in Northern Ontario. Arctic, 44: 267-274.
Hutchings, J.A., and M. Festa-Bianchet. 2009. Canadian species at risk (2006-2008), with particular emphasis on fishes. Environmental Reviews, 17: 53-65.
Page 84
77
Jager, H.I., J.A. Chandler, K.B. Lepla, and W. Van Winkle. 2001. A theoretical study of river fragmentation by dams and its effects on white sturgeon populations. Environmental Biology of Fishes, 60: 347-361.
Kempinger, J.J. 1988. Spawning and early life history of lake sturgeon in the Lake Winnebago system, Wisconsin. American Fisheries Society Symposium, 5: 110-122.
Kjartanson, S. L. 2008. Population structure and genetic diversity of lake sturgeon (Acipenser fulvescens) in Canada: evaluation of designable units for conservation. University of Toronto. Toronto, Ontario. (pp123).
Kline, K.S., R.M. Bruch, F.P. Binkowski. 2010. People of the Sturgeon: Wisconsin’s love affair with an ancient fish. Wisconsin Historical Society Press. Madison, Wisconsin. (pp304).
Knight, B.C., J.M. Vallazza, S.J. Zigler, and M.R. Dewey. 2002. Habitat and movement of Lake Sturgeon in the Upper Mississippi River System, USA. Transactions of the American Fisheries Society, 131: 507-522.
Lallaman, J.J., R.A. Damstra, and T.L. Galarowicz. 2008. Population assessment and movement patterns of lake sturgeon (Acipenser fulvescens) in the Manistee River, Michigan, USA. Journal of Applied Ichtyology, 24: 1-6.
Le Haye, M., A. Branchaud, M. Gendron, R. Verdon, and R. Fortin. 1992. Reproduction, early life history, and characteristics of the spawning grounds of the lake sturgeon (Acipenser fulvescens) in Des Prairies and L’Assomption rivers, near Montreal, Quebec. Canadian Journal of Zoology, 70: 1681-1689.
Lyons, J., and J.J. Kempinger. 1992. Movements of adults lake sturgeon in the Lake Winnebago system. Wisconsin Department of Natural Resources Madison, Wisconsin. (pp86).
McKinley, S., G. Van Der Kraak, and G. Power. 1998. Seasonal migrations and reproductive patterns in the lake sturgeon, Acipenser fulvescens, in the vicinity of hydroelectric stations in northern Ontario. Environmental Biology of Fishes, 51: 245-256.
Ontario Ministry of Natural Resources. 2009. The Lake Sturgeon in Ontario. Fish and Wildlife Branch. Peterborough, Ontario. (pp48).
Paragamian, V.L., G. Kruse, and V. Wakkinen. 2001. Spawning habitat of Kootenai River White Sturgeon, post-Libby Dam. North American Journal of Fisheries Management, 21: 22-33.
Paragamian, V.L., V.D. Wakkinen, and G. Kruse. 2002. Spawning locations and movement of Kootenai River white sturgeon. Journal of Applied Ichtyology, 18: 608-616.
Patalas, J.W. 1988. The effects of commercial fishing on lake sturgeon (Acipenser fulvescens) populations in the Sipiwesk Lake area of the Nelson River. Manitobe, 1987-1988. Manitoba Department of Natural Resources, Fisheries Branch Manuscript Report 88-14, Winnipeg.
Page 85
78
Peterson, D.L., P. Vecsei, and C.A. Jennings. 2007. Ecology and biology of the lake sturgeon: a synthesis of current knowledge of a threatened North American Acipenseridae. Reviews of Fish Biology and Fisheries, 17: 59-76.
Power, M., and R.S. McKinley. 1997. Latitudinal variation in Lake Sturgeon size as related to the thermal opportunity for growth. Transactions of the American Fisheries Society, 126: 549-558.
Priegel, G.R., and T.L. Wirth. 1974. The Lake Sturgeon: it’s life history, ecology and management. Wisconsin Department of Natural Resources. Madison, Wisconsin. (pp74).
Rogers, K.B., and G.C. White. 2007. Analysis of movement and habitat use from radio telemetry. In Guy, C.S., and M.L. Brown, Analysis and Interpretation of Freshwater Fisheries Data. Maryland (USA): American Fisheries Society.
Rusak, J.A., and T. Mosindy. 1997. Seasonal movements of lake sturgeon in Lake of the Woods and the Rainy River, Ontario. Canadian Journal of Zoology, 74: 383-395.
Scott, W.B., and E.J. Crossman. 1973. Freshwater fishes of Canada. Fisheries Research Board of Canada. Ottawa, Ontario. (pp966).
Seylor, J. 1997. Adult Lake Sturgeon (Acipenser fulvescens) habitat use, Groundhog River 1996. Ontario Ministry on Natural Resources, Timmins, Ontario. Technical Report TR-035. (pp20).
Stelzer, R.S., H.G. Drecktrah, M.P. Shupryt, and R.M. Bruch. 2008. Carbon sources for Lake Sturgeon in Lake Winnebago, Wisconsin. Transactions of the American Fisheries Society, 137: 1018-1028.
Stone, L, and C. Vincent. 1900. The spawning habits of the Lake Sturgeon (Acipenser rubicundus). Transactions of the American Fisheries Society, 29: 118-128.
Tremblay, K. 2010. Namaygoosisagagun First Nation Lake Sturgeon (Acipenser fulvescens) spawning assessments: Smoothrock Lake 2006, 2007, 2008. Anishinabek/Ontario Fisheries Resource Centre. Technical Report IS07_NA1. North Bay, Ontario. (pp24).
Trested, D. 2010. Biology and ecology of Lake Sturgeon (Acipenser fulvescens) in the Grasse River, New York. Clemson University, Clemson. (pp98).
Trested, D.G., and J.J. Isely. 2011. Age, growth, mortality, and abundance of lake sturgeon in the Grasse River, New York, USA. Journal of Applied Ichthyology, 27: 13-19.
Williamson, D.F. 2003. Caviar and conservation; status, management, and trade of North American Sturgeon and Paddlefish. World Wildlife Fund. Washington, DC. (pp240).
Welsh, A.B., T. Hill, H. Quinlan, C. Robinson, and B. May. 2008. Genetic assessment of Lake Sturgeon in the Laurentian Great Lakes. North American Journal of Fisheries Management, 28: 572-591.
Page 86
79
Welsh, A.B., and D.T. McLeod. 2010. Detection of natural barriers to movement of lake sturgeon (Acipenser fulvescens) within the Namakan River, Ontario. Canadian Journal of Zoology, 88: 390-397.
Velez-Espino, L.A., and M.A. Koops. 2009. Recovery potential assessment for Lake Sturgeon in Canadian designatable units. North American Journal of Fisheries Management, 29: 1065-1090.