11 CHAPTER - 2 POPULATION COMPOSITION The data on population by age and sex is vital for demographers, health administrators etc. for planning and evaluation of various developmental and health programs. The classification of rural/urban, sex and marital status by age unveils the characteristics of population composition and provides disaggregated data for target oriented projects. Being one of the most important demographic characteristics, data on age is collected and updated in both half-yearly surveys of SRS for all the members of the household covered in the sample units. 2.2 As per available data from SRS, there has been a gradual decline in the share of population in the age group 0-14 from 41.2 to 38.1 per cent during 1971 to 1981 and 36.3 to 29.5 percent during 1991 to 2011, whereas, the proportion of economically active population (15-59 years) has increased from 53.4 to 56.3 percent during 1971 to 1981 and 57.7 to 62.5 per cent during 1991 to 2011. On account of better education, health facilities and increase in life expectancy, the percentage of elderly population (60+) has gone up from 5.3 to 5.7 percent and 6.0 to 8.0 percent respectively during the periods under reference. Marital status and Female mean age at marriage are essential constituents to monitor fertility and population growth. The data on marital status has been included in SRS from 1991, whereas on Female mean age at marriage is from 1990. There is a marginal increase in the proportion of married Female from 45.7 in 1991 to 48.9 in 2011, whereas the proportion of widowed/divorced/separated female has remained stagnant at 8.2. The mean age at effective marriage for Female has improved from 19.3 years in 1990 to 21.2 years in 2011. 2.3 This chapter provides data on percentage distribution of population by age, sex and residence for all broad age groups from 0-4, 0-14, 15-59 and 60+ for India and bigger States. It also includes data on percentage distribution of population by marital status for total population, 10+ and 15+ ages by sex and residence. The state-wise variations in Female age at effective marriage and their corresponding proportions have also been presented in this chapter.
Transcript
11
CHAPTER - 2 POPULATION COMPOSITION The data on population by age and sex is vital for demographers, health administrators etc. for planning and evaluation of various developmental and health programs. The classification of rural/urban, sex and marital status by age unveils the characteristics of population composition and provides disaggregated data for target oriented projects. Being one of the most important demographic characteristics, data on age is collected and updated in both half-yearly surveys of SRS for all the members of the household covered in the sample units. 2.2 As per available data from SRS, there has been a gradual decline in the share of population in the age group 0-14 from 41.2 to 38.1 per cent during 1971 to 1981 and 36.3 to 29.5 percent during 1991 to 2011, whereas, the proportion of economically active population (15-59 years) has increased from 53.4 to 56.3 percent during 1971 to 1981 and 57.7 to 62.5 per cent during 1991 to 2011. On account of better education, health facilities and increase in life expectancy, the percentage of elderly population (60+) has gone up from 5.3 to 5.7 percent and 6.0 to 8.0 percent respectively during the periods under reference. Marital status and Female mean age at marriage are essential constituents to monitor fertility and population growth. The data on marital status has been included in SRS from 1991, whereas on Female mean age at marriage is from 1990. There is a marginal increase in the proportion of married Female from 45.7 in 1991 to 48.9 in 2011, whereas the proportion of widowed/divorced/separated female has remained stagnant at 8.2. The mean age at effective marriage for Female has improved from 19.3 years in 1990 to 21.2 years in 2011. 2.3 This chapter provides data on percentage distribution of population by age, sex and residence for all broad age groups from 0-4, 0-14, 15-59 and 60+ for India and bigger States. It also includes data on percentage distribution of population by marital status for total population, 10+ and 15+ ages by sex and residence. The state-wise variations in Female age at effective marriage and their corresponding proportions have also been presented in this chapter.
12
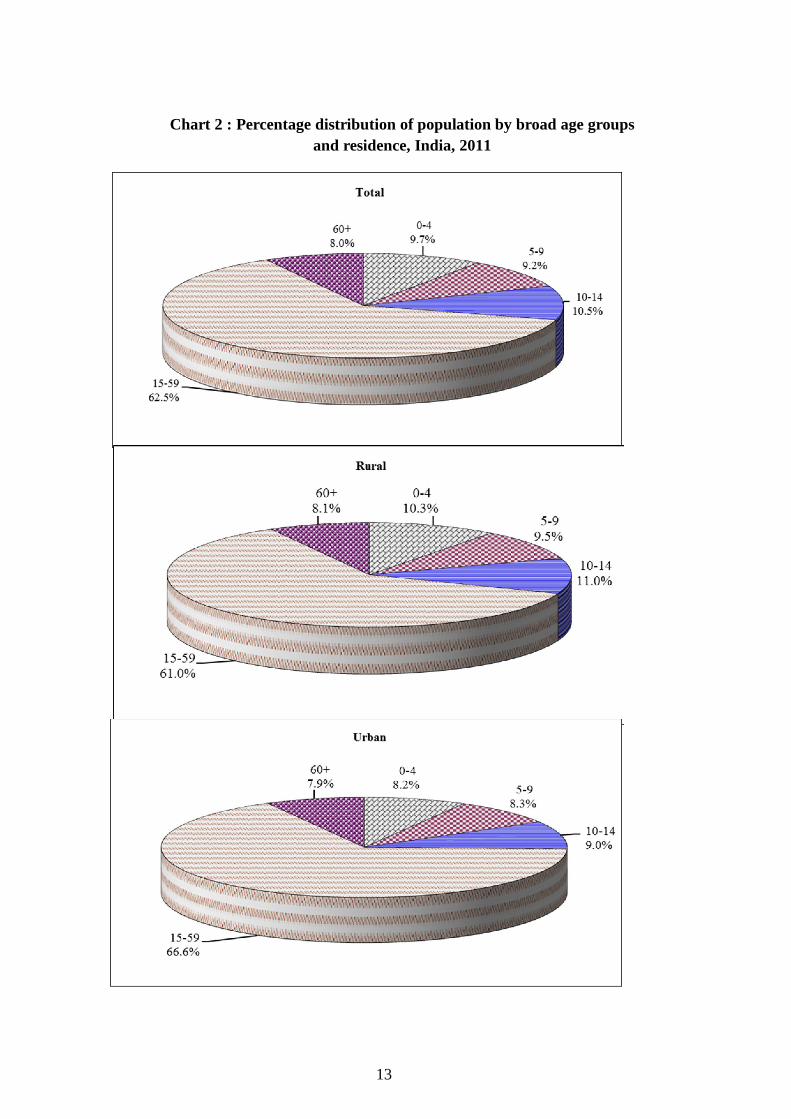
Age composition 2.4 Age composition by residence and broad age groups 0-14, 15-59 and 60+ for the year 2011 at the National level is shown below in Statement 3. The age group 0-14 is further sub-categorized into the age groups 0-4, 5-9 and 10-14. It is observed that for most of the age groups, Male-Female differences in the age distribution of population are negligible except in the combined age-group of 0-14, 15-59, 60+ & 65+. In the age-group 0-14, Male population is about one percent more than Female, whereas in the age-group 60+ as also 65+, percentage of Female is 0.7 percent more than Male. The proportion of young children in the age group 0-4 and also the proportion of population in the age group 0-14 are higher in rural areas than in urban areas both for Male and Female. A higher proportion of Male and Female in the working age group 15-59 live in urban areas as compared to rural areas. Chart 2 gives pictorial presentation of data shown in Statement 3. Table 1 gives percentage distribution of estimated population by quinquennial age groups, sex and residence for India and bigger States.
Statement 3
Percentage distribution of population by broad age groups to total population by sex and residence, India, 2011
Residence Sex Broad age groups (years)
0-4 5-9 10-14 0-14 15-59 60+ 15-64 65+
Total 9.7 9.2 10.5 29.5 62.5 8.0 65.2 5.3
Total Male 9.9 9.4 10.7 30.0 62.2 7.7 65.0 5.0
Female 9.5 9.0 10.3 28.8 62.8 8.4 65.5 5.7
Total 10.3 9.5 11.0 30.9 61.0 8.1 63.7 5.4
Rural Male 10.5 9.7 11.3 31.5 60.7 7.8 63.4 5.1
Female 10.1 9.4 10.8 30.3 61.3 8.4 63.9 5.8
Total 8.2 8.3 9.0 25.5 66.6 7.9 69.4 5.1
Urban Male 8.3 8.6 9.2 26.1 66.2 7.6 69.1 4.8
Female 8.0 8.1 8.8 24.9 66.9 8.2 69.7 5.5 Note: Total percentage may not add to 100 on account of rounding in broad age groups
13
Chart 2 : Percentage distribution of population by broad age groups
and residence, India, 2011
14
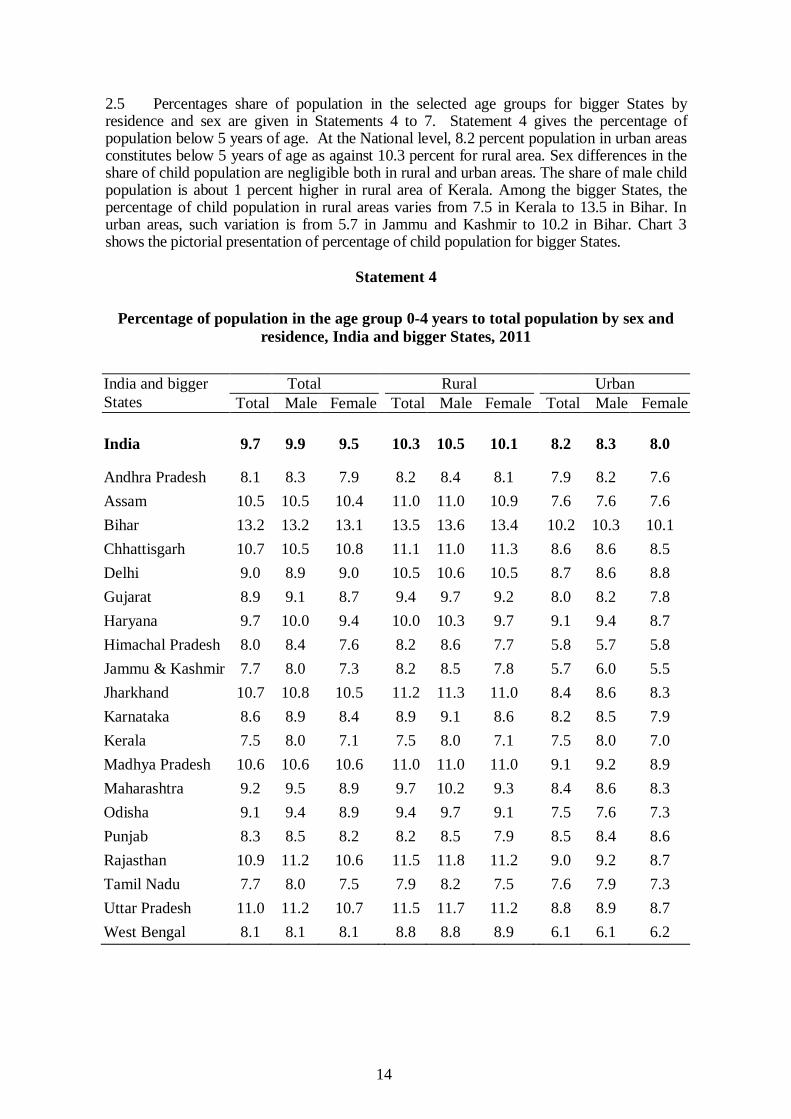
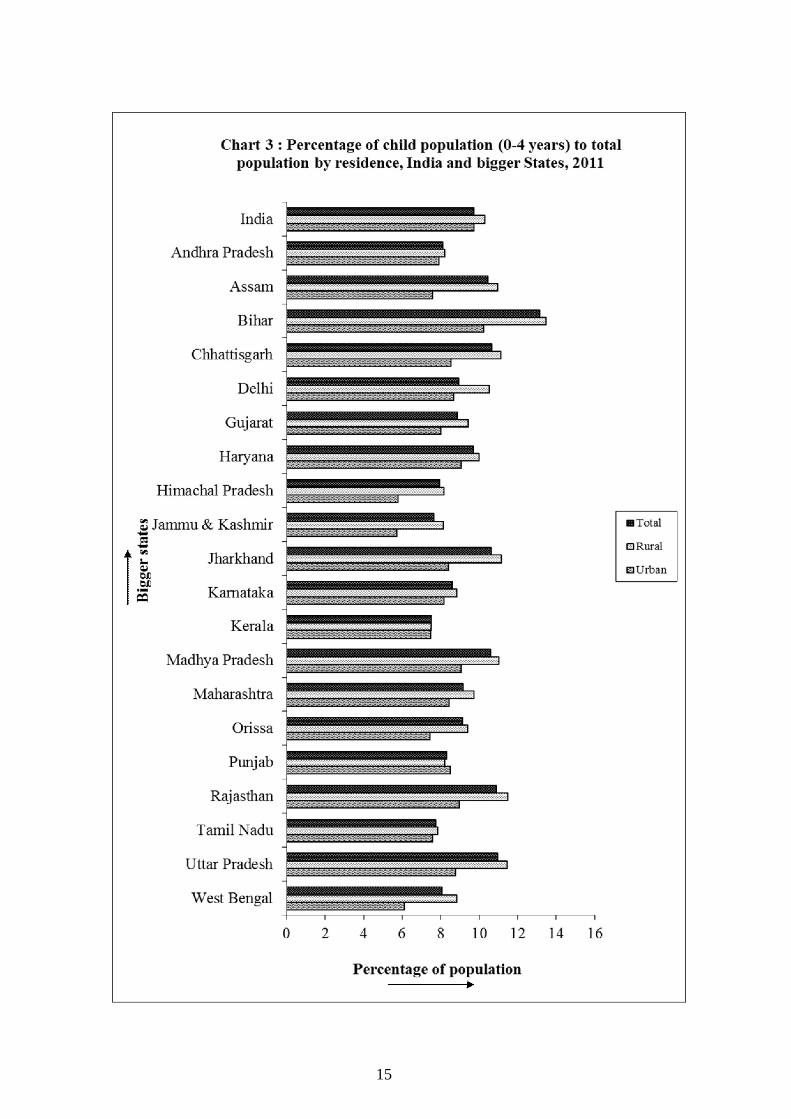
2.5 Percentages share of population in the selected age groups for bigger States by residence and sex are given in Statements 4 to 7. Statement 4 gives the percentage of population below 5 years of age. At the National level, 8.2 percent population in urban areas constitutes below 5 years of age as against 10.3 percent for rural area. Sex differences in the share of child population are negligible both in rural and urban areas. The share of male child population is about 1 percent higher in rural area of Kerala. Among the bigger States, the percentage of child population in rural areas varies from 7.5 in Kerala to 13.5 in Bihar. In urban areas, such variation is from 5.7 in Jammu and Kashmir to 10.2 in Bihar. Chart 3 shows the pictorial presentation of percentage of child population for bigger States.
Statement 4
Percentage of population in the age group 0-4 years to total population by sex and residence, India and bigger States, 2011
India and bigger States
Total Rural Urban Total Male Female Total Male Female Total Male Female
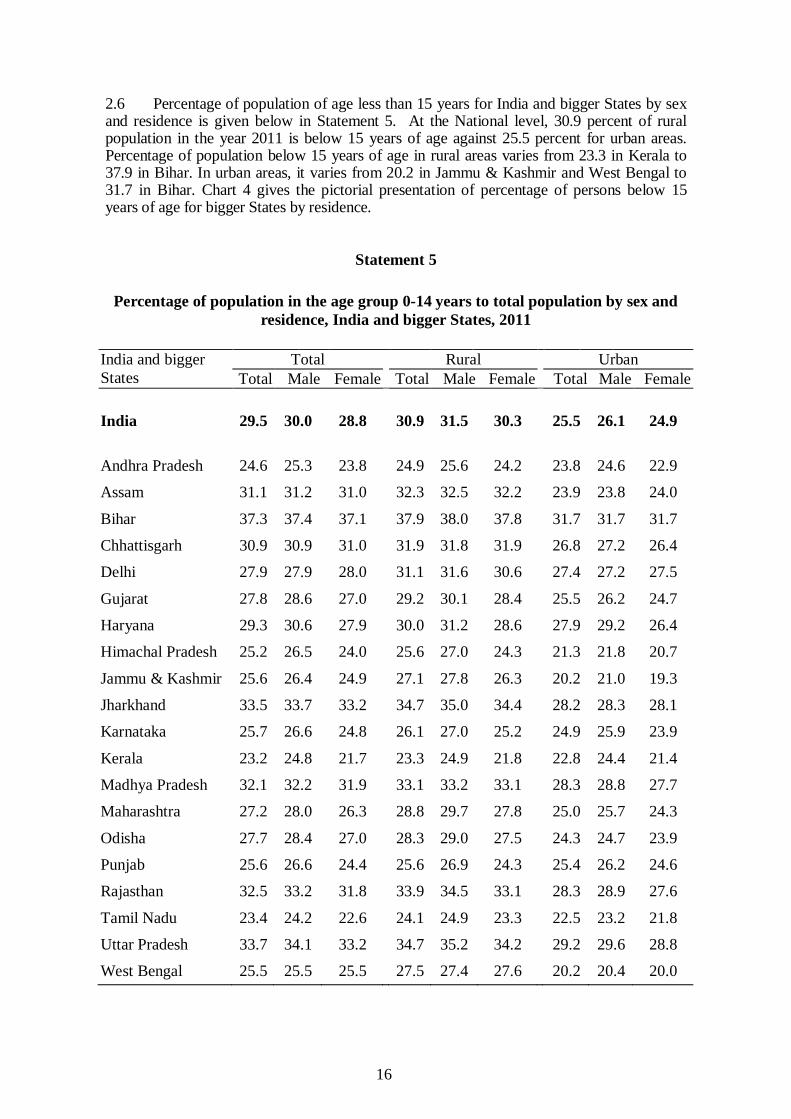
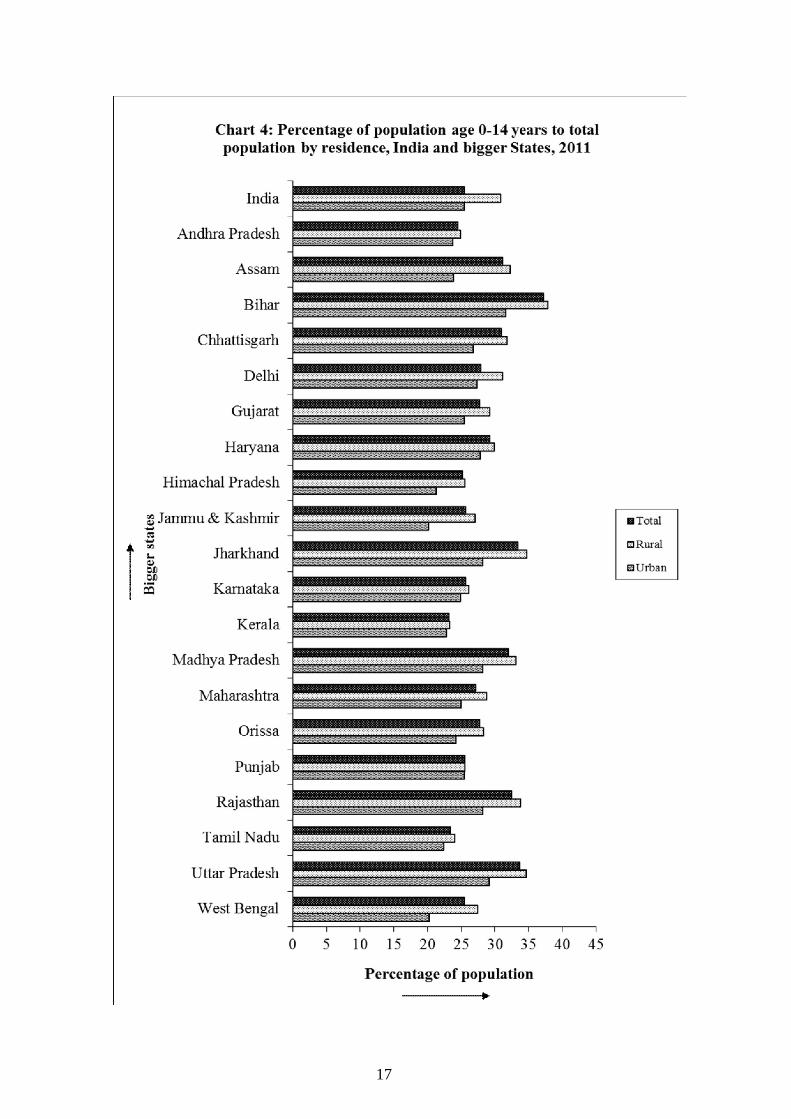
2.6 Percentage of population of age less than 15 years for India and bigger States by sex and residence is given below in Statement 5. At the National level, 30.9 percent of rural population in the year 2011 is below 15 years of age against 25.5 percent for urban areas. Percentage of population below 15 years of age in rural areas varies from 23.3 in Kerala to 37.9 in Bihar. In urban areas, it varies from 20.2 in Jammu & Kashmir and West Bengal to 31.7 in Bihar. Chart 4 gives the pictorial presentation of percentage of persons below 15 years of age for bigger States by residence.
Statement 5
Percentage of population in the age group 0-14 years to total population by sex and residence, India and bigger States, 2011
India and bigger States
Total Rural Urban Total Male Female Total Male Female Total Male Female
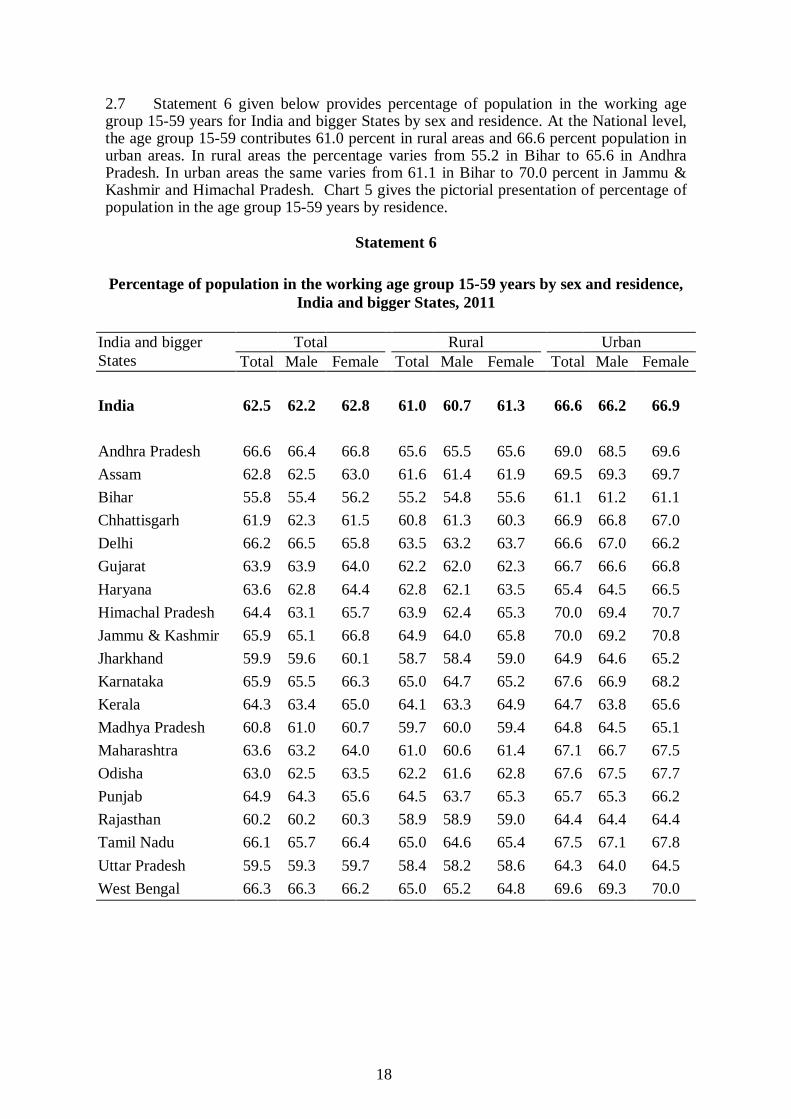
2.7 Statement 6 given below provides percentage of population in the working age group 15-59 years for India and bigger States by sex and residence. At the National level, the age group 15-59 contributes 61.0 percent in rural areas and 66.6 percent population in urban areas. In rural areas the percentage varies from 55.2 in Bihar to 65.6 in Andhra Pradesh. In urban areas the same varies from 61.1 in Bihar to 70.0 percent in Jammu & Kashmir and Himachal Pradesh. Chart 5 gives the pictorial presentation of percentage of population in the age group 15-59 years by residence.
Statement 6
Percentage of population in the working age group 15-59 years by sex and residence, India and bigger States, 2011
India and bigger States
Total Rural Urban Total Male Female Total Male Female Total Male Female
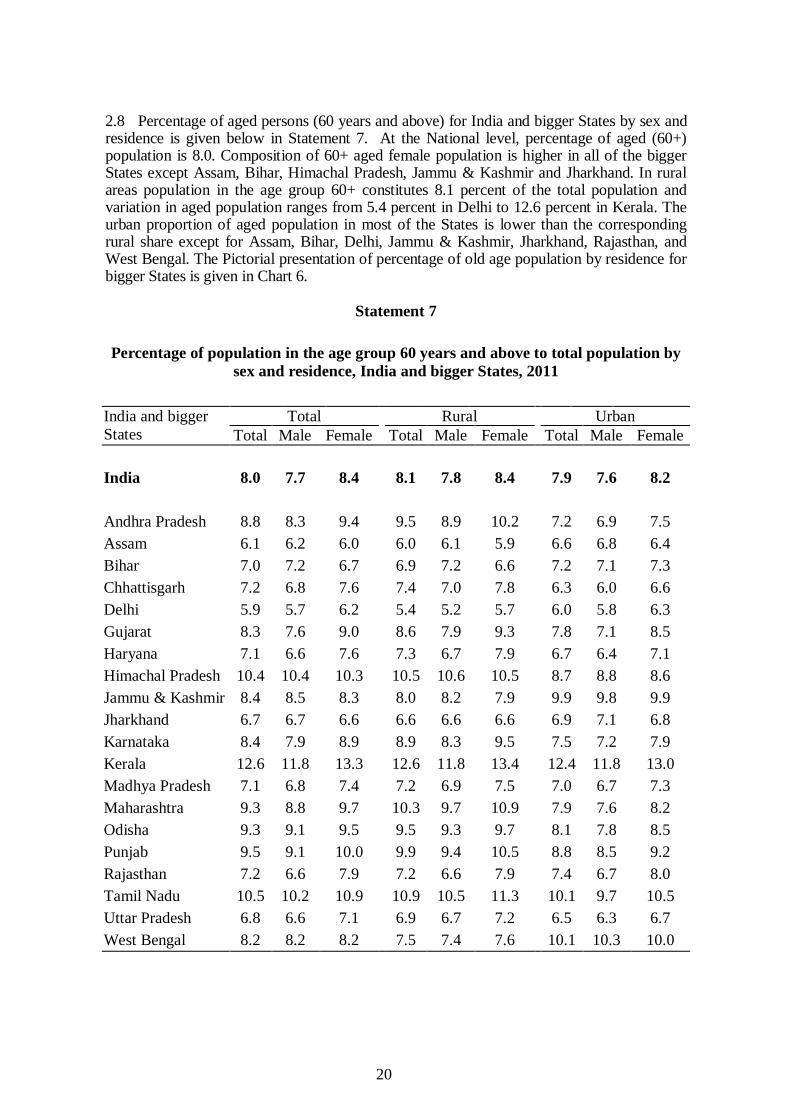
2.8 Percentage of aged persons (60 years and above) for India and bigger States by sex and residence is given below in Statement 7. At the National level, percentage of aged (60+) population is 8.0. Composition of 60+ aged female population is higher in all of the bigger States except Assam, Bihar, Himachal Pradesh, Jammu & Kashmir and Jharkhand. In rural areas population in the age group 60+ constitutes 8.1 percent of the total population and variation in aged population ranges from 5.4 percent in Delhi to 12.6 percent in Kerala. The urban proportion of aged population in most of the States is lower than the corresponding rural share except for Assam, Bihar, Delhi, Jammu & Kashmir, Jharkhand, Rajasthan, and West Bengal. The Pictorial presentation of percentage of old age population by residence for bigger States is given in Chart 6.
Statement 7
Percentage of population in the age group 60 years and above to total population by sex and residence, India and bigger States, 2011
India and bigger States
Total Rural Urban Total Male Female Total Male Female Total Male Female
Marital Status 2.9 Besides age, the other important demographic characteristic collected and subsequently updated during each half yearly survey of the SRS is the marital status. Distribution of the population by marital status is thus available from SRS. 2.10 Statement 8 given below shows the percentage distribution of population by sex and marital status for India and bigger States for the year 2011. During this year, 47.8 percent of the population at the National level is reported as never married. Married population constitutes 47.0 percent of the total population whereas widowed/divorced/separated constitutes 5.2 percent. The proportion of W/D/S female population is higher than males at the National level as well as in the bigger States. The gap is significantly wide in respect of Andhra Pradesh, Karnataka, Kerala, Maharashtra, West Bengal and Tamil Nadu. Andhra Pradesh (52.9) recorded the highest percentage of married population whereas the lowest was recorded for Uttar Pradesh (41.6). Married Females recorded a higher percentage as compared to Males at the National level and similarly for all of the bigger States. The percentage distribution of population by sex, marital status, residence and age-group for India and bigger States is detailed in Table-2.
Statement 8
Percentage distribution of population by marital status and sex, India and bigger States, 2011
India and bigger States
Never married Married W/D/S Total Male Female Total Male Female Total Male Female
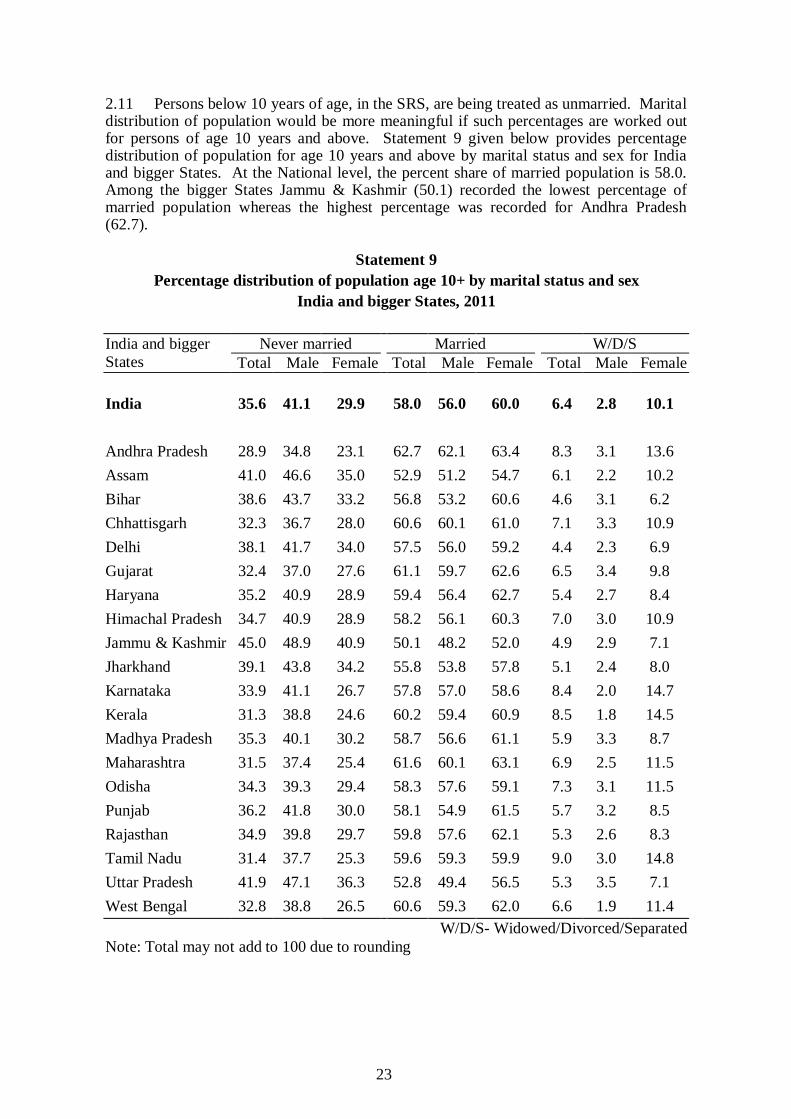
2.11 Persons below 10 years of age, in the SRS, are being treated as unmarried. Marital distribution of population would be more meaningful if such percentages are worked out for persons of age 10 years and above. Statement 9 given below provides percentage distribution of population for age 10 years and above by marital status and sex for India and bigger States. At the National level, the percent share of married population is 58.0. Among the bigger States Jammu & Kashmir (50.1) recorded the lowest percentage of married population whereas the highest percentage was recorded for Andhra Pradesh (62.7).
Statement 9 Percentage distribution of population age 10+ by marital status and sex
India and bigger States, 2011
India and bigger States
Never married Married W/D/S Total Male Female Total Male Female Total Male Female
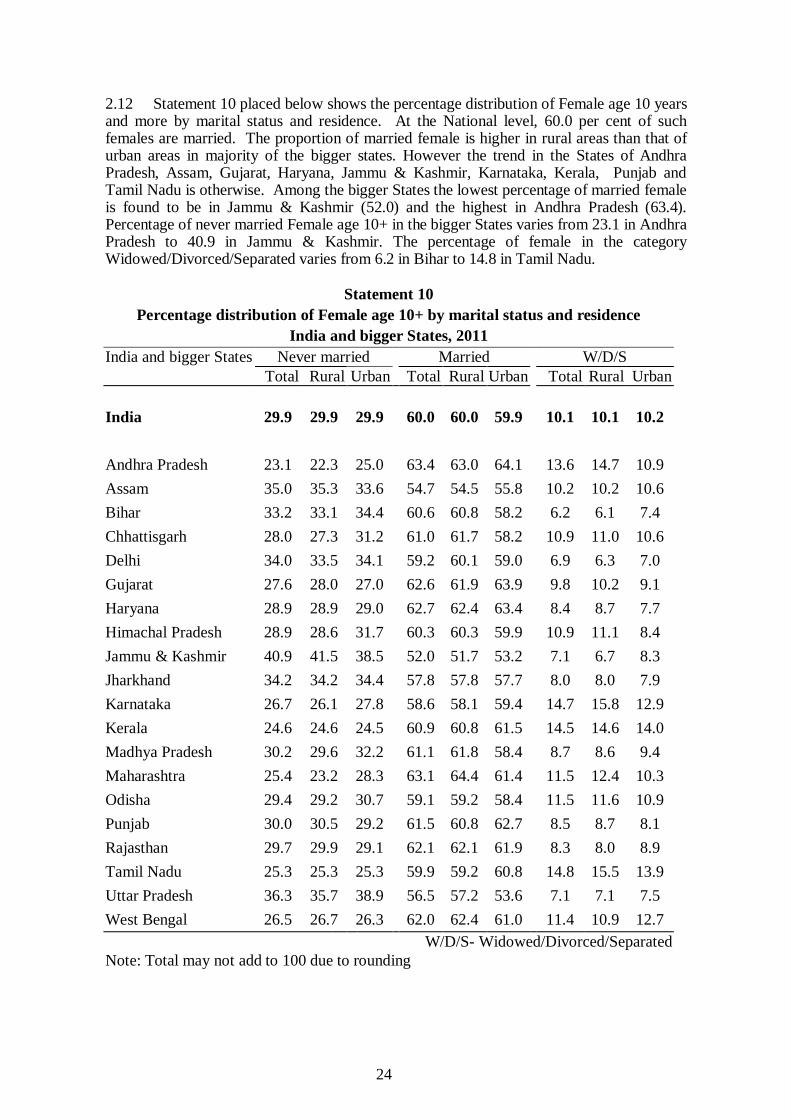
2.12 Statement 10 placed below shows the percentage distribution of Female age 10 years and more by marital status and residence. At the National level, 60.0 per cent of such females are married. The proportion of married female is higher in rural areas than that of urban areas in majority of the bigger states. However the trend in the States of Andhra Pradesh, Assam, Gujarat, Haryana, Jammu & Kashmir, Karnataka, Kerala, Punjab and Tamil Nadu is otherwise. Among the bigger States the lowest percentage of married female is found to be in Jammu & Kashmir (52.0) and the highest in Andhra Pradesh (63.4). Percentage of never married Female age 10+ in the bigger States varies from 23.1 in Andhra Pradesh to 40.9 in Jammu & Kashmir. The percentage of female in the category Widowed/Divorced/Separated varies from 6.2 in Bihar to 14.8 in Tamil Nadu.
Statement 10 Percentage distribution of Female age 10+ by marital status and residence
India and bigger States, 2011 India and bigger States Never married Married W/D/S Total Rural Urban Total Rural Urban Total Rural Urban
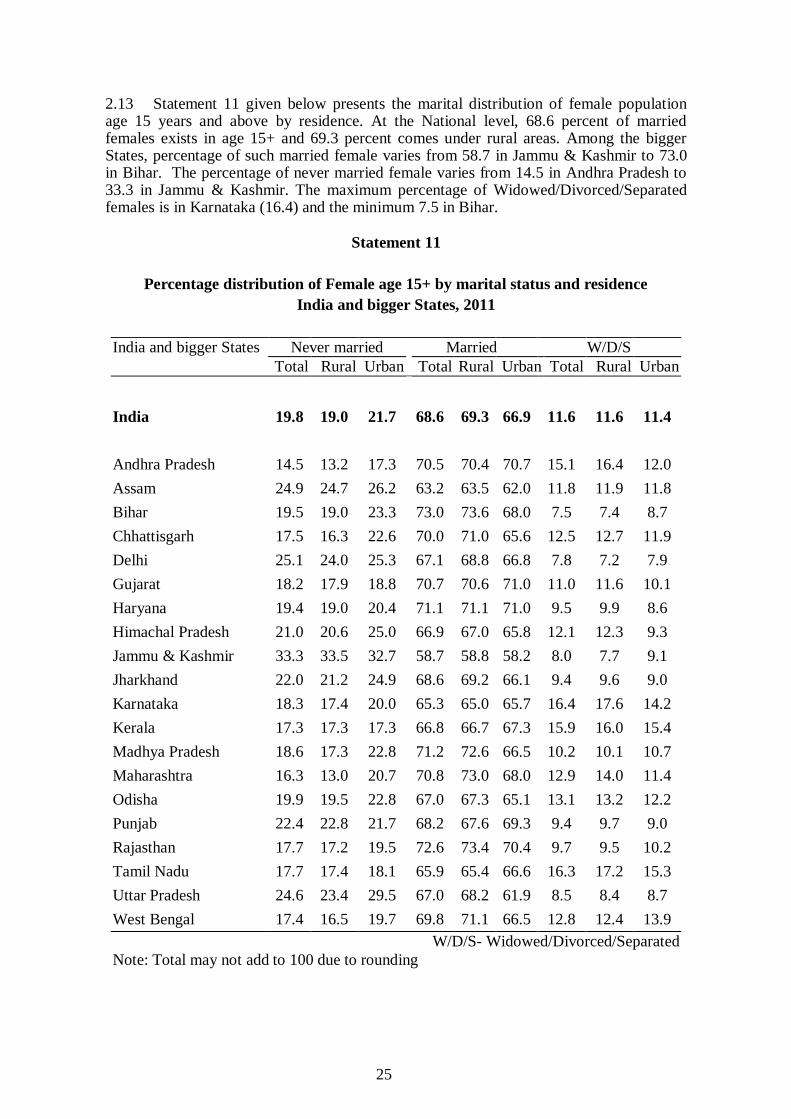
2.13 Statement 11 given below presents the marital distribution of female population age 15 years and above by residence. At the National level, 68.6 percent of married females exists in age 15+ and 69.3 percent comes under rural areas. Among the bigger States, percentage of such married female varies from 58.7 in Jammu & Kashmir to 73.0 in Bihar. The percentage of never married female varies from 14.5 in Andhra Pradesh to 33.3 in Jammu & Kashmir. The maximum percentage of Widowed/Divorced/Separated females is in Karnataka (16.4) and the minimum 7.5 in Bihar.
Statement 11
Percentage distribution of Female age 15+ by marital status and residence India and bigger States, 2011
India and bigger States Never married Married W/D/S Total Rural Urban Total Rural Urban Total Rural Urban
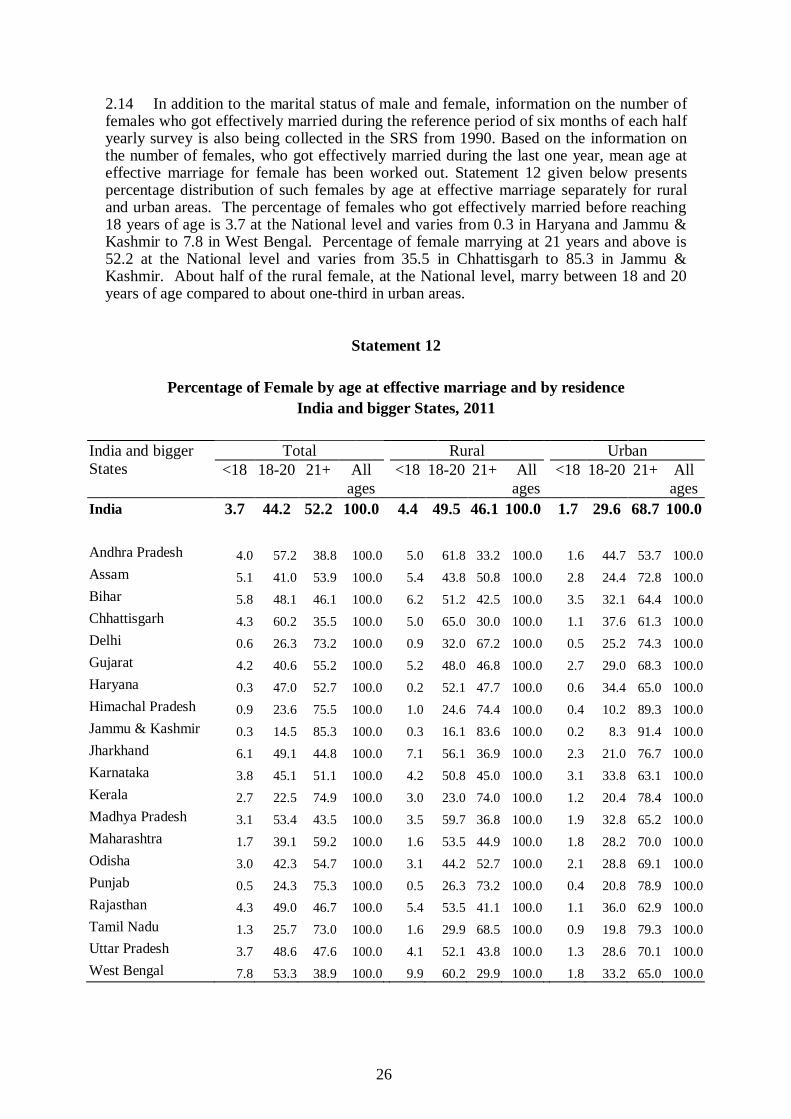
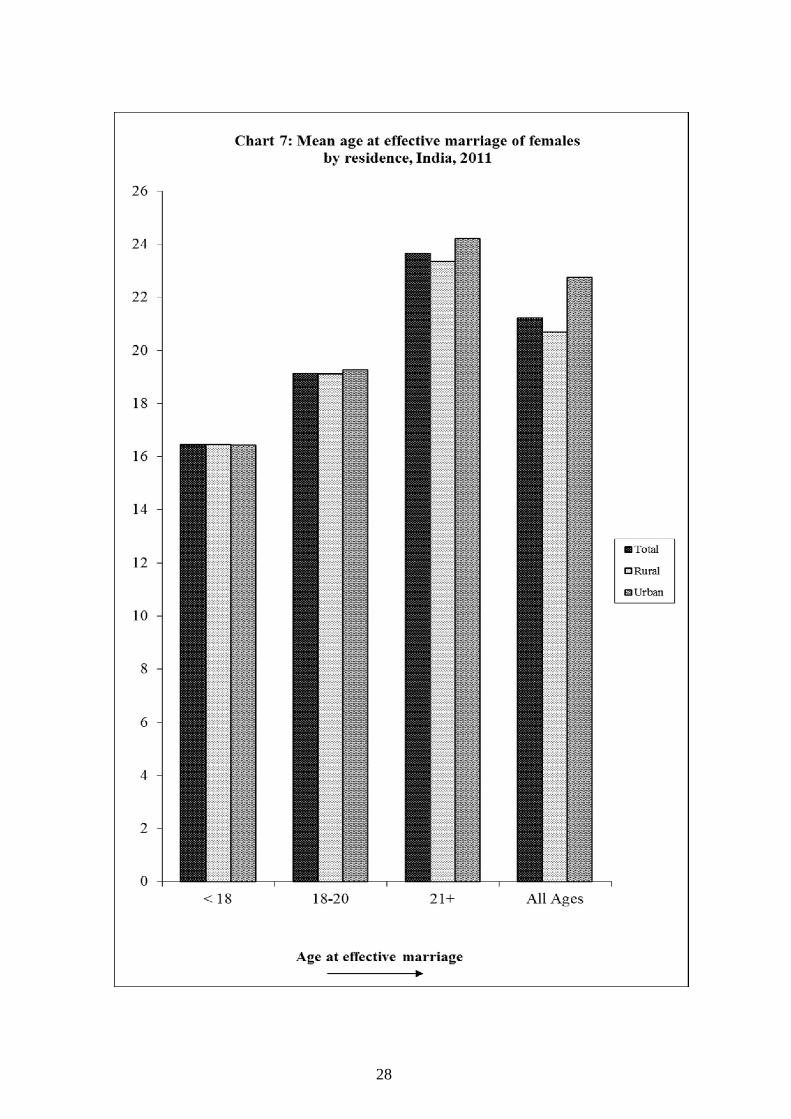
2.14 In addition to the marital status of male and female, information on the number of females who got effectively married during the reference period of six months of each half yearly survey is also being collected in the SRS from 1990. Based on the information on the number of females, who got effectively married during the last one year, mean age at effective marriage for female has been worked out. Statement 12 given below presents percentage distribution of such females by age at effective marriage separately for rural and urban areas. The percentage of females who got effectively married before reaching 18 years of age is 3.7 at the National level and varies from 0.3 in Haryana and Jammu & Kashmir to 7.8 in West Bengal. Percentage of female marrying at 21 years and above is 52.2 at the National level and varies from 35.5 in Chhattisgarh to 85.3 in Jammu & Kashmir. About half of the rural female, at the National level, marry between 18 and 20 years of age compared to about one-third in urban areas.
Statement 12 Percentage of Female by age at effective marriage and by residence
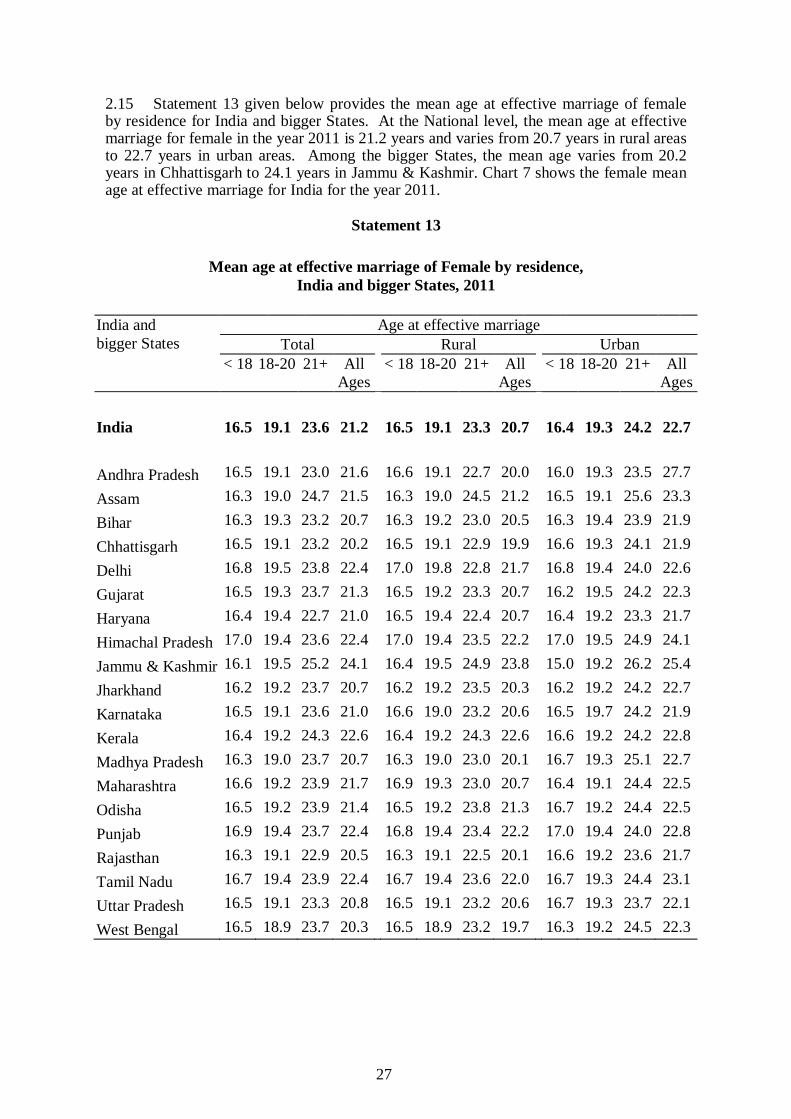
2.15 Statement 13 given below provides the mean age at effective marriage of female by residence for India and bigger States. At the National level, the mean age at effective marriage for female in the year 2011 is 21.2 years and varies from 20.7 years in rural areas to 22.7 years in urban areas. Among the bigger States, the mean age varies from 20.2 years in Chhattisgarh to 24.1 years in Jammu & Kashmir. Chart 7 shows the female mean age at effective marriage for India for the year 2011.
Statement 13
Mean age at effective marriage of Female by residence, India and bigger States, 2011