21
Population Population Dynamics Dynamics
| Date post: | 31-Dec-2015 |
| Category: |
Documents |
| Upload: | kory-short |
| View: | 217 times |
| Download: | 1 times |

Population Population DynamicsDynamics
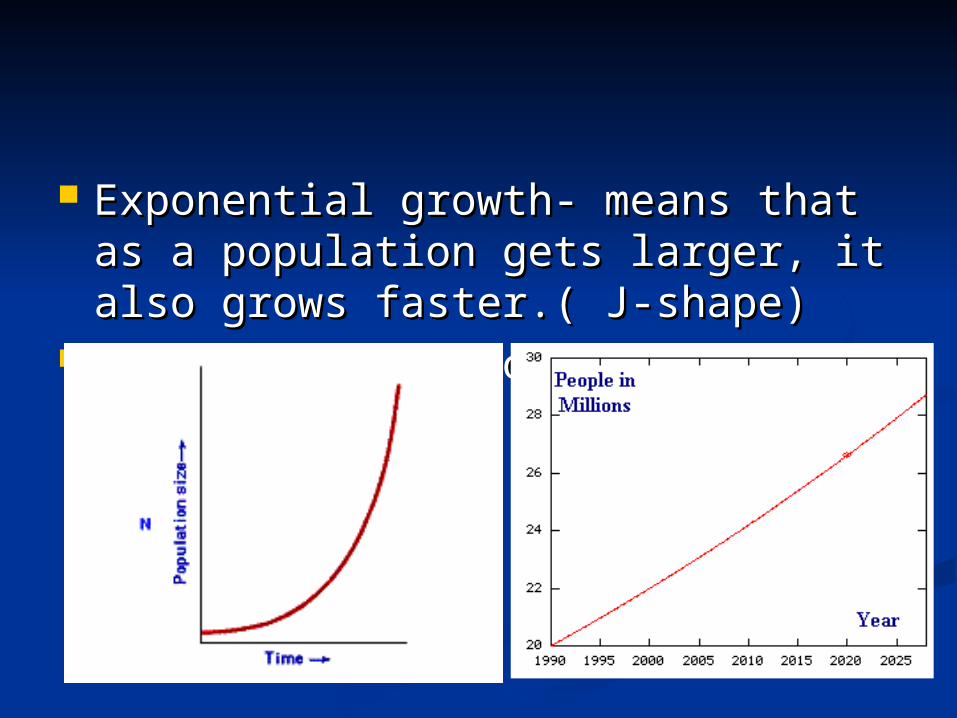
Exponential growth- means that as a Exponential growth- means that as a population gets larger, it also grows population gets larger, it also grows faster.( J-shape)faster.( J-shape)
Straight line growth- a steady Straight line growth- a steady growth over time. growth over time.


Carrying capacity- the number of Carrying capacity- the number of organisms of one species that an organisms of one species that an environment can support environment can support indefinitely. indefinitely.

Density-dependent factors are things Density-dependent factors are things like competition, parasites, and food.like competition, parasites, and food.
This is a type of limiting factor that is This is a type of limiting factor that is biotic. biotic.
Density-independent factors- affect all Density-independent factors- affect all populations, regardless of their density.populations, regardless of their density.
This is a type of limiting factor that is This is a type of limiting factor that is abiotic like storms, floods, and droughts. abiotic like storms, floods, and droughts.

DemographyDemography
Demography is the study of human Demography is the study of human populations growth characteristics. populations growth characteristics.

http://math.berkeley.edu/~galen/popclk.html

Birth rate- the rate at which babies are Birth rate- the rate at which babies are born. born.
Death rate- the rate at which people Death rate- the rate at which people die. die.
If the birth rate is higher than the If the birth rate is higher than the death rate you have a growth rate. death rate you have a growth rate.
If the birth rate is less than the death If the birth rate is less than the death rate you have a population shrinkage rate you have a population shrinkage (lower total population). (lower total population).

Age structure graph- shows what Age structure graph- shows what percentage of the population falls in percentage of the population falls in what age range. what age range.

Immigration= into population (I=in)Immigration= into population (I=in) Emigration = out of a population Emigration = out of a population
(E=Exit)(E=Exit)
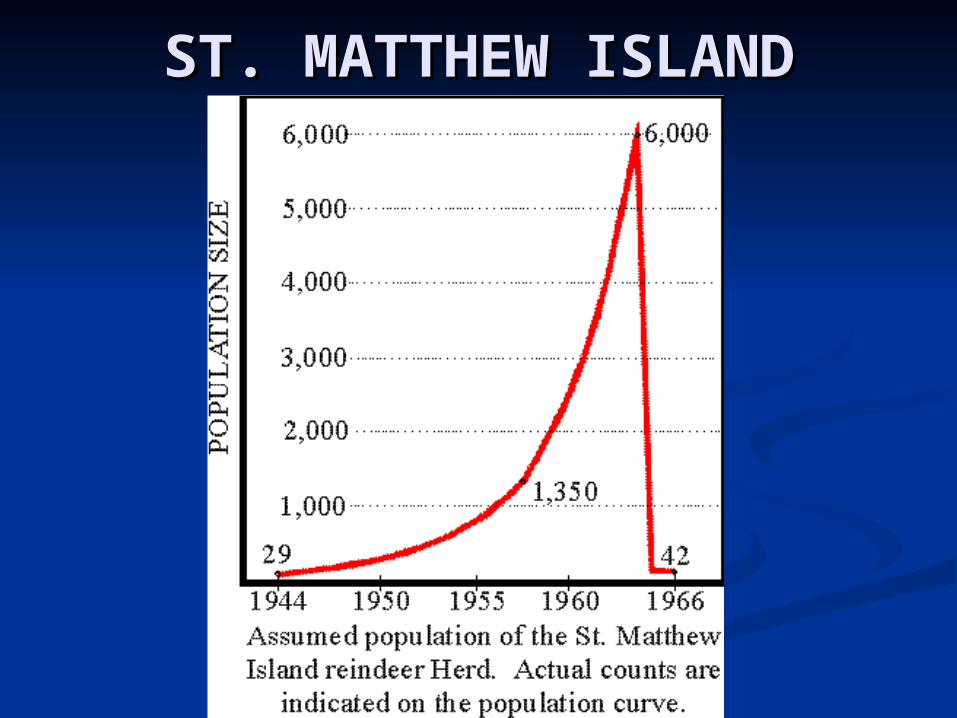
ST. MATTHEW ISLANDST. MATTHEW ISLAND
#1#1
Which of the following factors is Which of the following factors is density-dependentdensity-dependent
a.a. DroughtDrought
b.b. FloodFlood
c.c. FoodFood
d.d. Wind speedWind speed

#2#2
When populations increase, When populations increase, resource depletion may result in resource depletion may result in _________._________.
a.a. Exponential growthExponential growth
b.b. Straight-line growthStraight-line growth
c.c. CompetitionCompetition
d.d. Increase in predatorsIncrease in predators

#3#3
Storms, cold temperatures, and Storms, cold temperatures, and drought are all ____________.drought are all ____________.
a.a. Density dependentDensity dependent
b.b. Biotic factorsBiotic factors
c.c. ExponentialExponential
d.d. Density independentDensity independent

#4#4
Between A.D. 1 and A.D. 1650, the Between A.D. 1 and A.D. 1650, the world’s population had a major dip world’s population had a major dip because of ___________.because of ___________.
a.a. FertilityFertility
b.b. Decreased death rateDecreased death rate
c.c. Density-independent factorsDensity-independent factors
d.d. Bubonic plague Bubonic plague
#5#5
Which of the following environment Which of the following environment would be more likely to have would be more likely to have organisms that exhibit fast growth?organisms that exhibit fast growth?
a.a. Hot desertsHot deserts
b.b. Large, deep lakesLarge, deep lakes
c.c. Prairies that often floodPrairies that often flood
d.d. Tropical rain forestsTropical rain forests
#6#6
A female’s fertility rate is the A female’s fertility rate is the number of offspring she produces number of offspring she produces _________._________.
a.a. In a yearIn a year
b.b. In a decadeIn a decade
c.c. By age 50By age 50
d.d. Over her lifetimeOver her lifetime
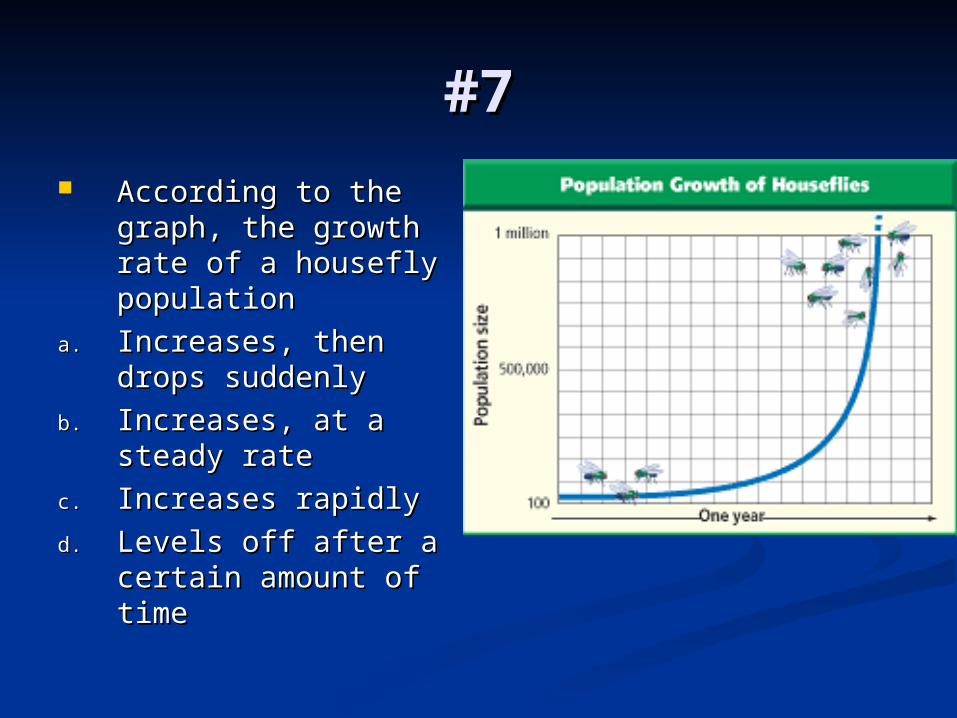
#7#7 According to the According to the
graph, the growth graph, the growth rate of a housefly rate of a housefly population population
a.a. Increases, then drops Increases, then drops suddenlysuddenly
b.b. Increases, at a Increases, at a steady ratesteady rate
c.c. Increases rapidlyIncreases rapidly
d.d. Levels off after a Levels off after a certain amount of certain amount of timetime
#8#8
A J-shaped growth curve indicates A J-shaped growth curve indicates a population is a population is experiencing____________.experiencing____________.
a.a. Exponential growthExponential growth
b.b. Exponential mortalityExponential mortality
c.c. Straight line growthStraight line growth
d.d. Slight growthSlight growth

#9#9
The highest level at which a The highest level at which a population can be sustained is its population can be sustained is its ____________.____________.
a.a. Exponential growthExponential growth
b.b. Carrying capacityCarrying capacity
c.c. Limiting factorLimiting factor
d.d. Death rateDeath rate

#10#10
http://www.glencoe.com/qe/qe136national.php?qi=4352&st
==


