+ All Categories
Home > Documents > Population Ecology of Black Bears in the Starkey … Report...for timber harvest, although...

Population Ecology of Black Bears in the Starkey … Report...for timber harvest, although...

Date post: 05-Jul-2018
Category:
Upload: trinhbao
View: 219 times
Download: 0 times
Share this document with a friend
19
Wildlife Technical Report 002-2013 1 Population Ecology of Black Bears in the Starkey Wildlife Management Unit of Northeastern Oregon, 1993-2000 James J. Akenson 1 , Oregon Department of Fish and Wildlife, La Grande, OR 97850, USA Tara L. Wertz 2 , Oregon Department of Fish and Wildlife, La Grande, OR 97850, USA Mark G. Henjum 3 , Oregon Department of Fish and Wildlife, La Grande, OR 97850, USA Bruce K. Johnson, Oregon Department of Fish and Wildlife, La Grande, OR 97850, USA Abstract: Black bear (Ursus americanus) is an iconic species throughout Oregon because of its relative scarcity, size, and stature. From 1993 to 2000 Oregon Department of Fish and Wildlife lead an interagency effort to gather baseline population and life history information of this species within the Starkey Wildlife Management Unit in the Blue Mountains of Northeastern Oregon to complement concurrent work occurring in the Cascades of southwest Oregon. This 889 km 2 study area was representative of much of the physiographic and climatic conditions east of the Cascade Mountains. Our intent is to highlight information obtained from published and unpublished work of survival, productivity, habitat selection, and home ranges of 65 radiocollared black bears from 1993 2000 and to describe its relevance to current bear management in Oregon. The study spanned when Ballot Measure 18 was implemented, so survival estimates for bears pre- and post-Measure 18 are discussed, as well as before spring bear hunts became popular. Because data collection started 2 decades ago, results summarized here provide a reference for managers to compare current and future information describing bear management in Oregon. Key words: harvest, habitat, home range, management, Oregon, population, reproduction, survival, Ursus americanus Understanding black bear ecology is critical for making sound decisions regarding the management and conservation of this species. This report provides a summary of findings made over an 8 year period when several studies were conducted on black bear in northeastern Oregon. It is our goal to provide a broad overview of these findings and, if additional information is needed, to provide references and access to those data and studies. We want district biologists and managers to be able to readily access specific findings and incorporate them into management actions. All electronic files are housed at the ODFW office at the USDA Forest Service, Pacific Northwest Research Station in La Grande, Oregon (see Appendix 1). STUDY AREA The Starkey black bear study occurred within the Grande Ronde River Watershed in the Starkey Wildlife Management Unit (WMU) in Blue Mountains ecoregion (Franklin and Dyrness 1973) of northeastern Oregon. The original capture area in 1993 encompassed 570 km 2 and ranged in elevation from 840 to 2,640 m. Approximately 75% of the area was mixed conifer stands of 1 Present address: P.O. Box 53, Enterprise, OR 97846, USA 2 Present address: U.S. Fish and Wildlife Service, Merced NWR, Los Banos, CA 93635, USA 3 Present address: U.S. Forest Service, Umatilla National Forest, Pendleton, OR 97801, USA
Transcript

Wildlife Technical Report 002-2013 1

Population Ecology of Black Bears in the Starkey Wildlife

Management Unit of Northeastern Oregon, 1993-2000

James J. Akenson1, Oregon Department of Fish and Wildlife, La Grande, OR 97850, USA

Tara L. Wertz2, Oregon Department of Fish and Wildlife, La Grande, OR 97850, USA

Mark G. Henjum3, Oregon Department of Fish and Wildlife, La Grande, OR 97850, USA

Bruce K. Johnson, Oregon Department of Fish and Wildlife, La Grande, OR 97850, USA

Abstract: Black bear (Ursus americanus) is an iconic species throughout Oregon

because of its relative scarcity, size, and stature. From 1993 to 2000 Oregon Department

of Fish and Wildlife lead an interagency effort to gather baseline population and life

history information of this species within the Starkey Wildlife Management Unit in the

Blue Mountains of Northeastern Oregon to complement concurrent work occurring in the

Cascades of southwest Oregon. This 889 km2 study area was representative of much of

the physiographic and climatic conditions east of the Cascade Mountains. Our intent is to

highlight information obtained from published and unpublished work of survival,

productivity, habitat selection, and home ranges of 65 radiocollared black bears from

1993 – 2000 and to describe its relevance to current bear management in Oregon. The

study spanned when Ballot Measure 18 was implemented, so survival estimates for bears

pre- and post-Measure 18 are discussed, as well as before spring bear hunts became

popular. Because data collection started 2 decades ago, results summarized here provide

a reference for managers to compare current and future information describing bear

management in Oregon.

Key words: harvest, habitat, home range, management, Oregon, population,

reproduction, survival, Ursus americanus

Understanding black bear ecology is critical for making sound decisions regarding the

management and conservation of this species. This report provides a summary of findings made

over an 8 year period when several studies were conducted on black bear in northeastern Oregon.

It is our goal to provide a broad overview of these findings and, if additional information is

needed, to provide references and access to those data and studies. We want district biologists

and managers to be able to readily access specific findings and incorporate them into

management actions. All electronic files are housed at the ODFW office at the USDA Forest

Service, Pacific Northwest Research Station in La Grande, Oregon (see Appendix 1).

STUDY AREA

The Starkey black bear study occurred within the Grande Ronde River Watershed in the Starkey

Wildlife Management Unit (WMU) in Blue Mountains ecoregion (Franklin and Dyrness 1973)

of northeastern Oregon. The original capture area in 1993 encompassed 570 km2

and ranged in

elevation from 840 to 2,640 m. Approximately 75% of the area was mixed conifer stands of

1 Present address: P.O. Box 53, Enterprise, OR 97846, USA

2 Present address: U.S. Fish and Wildlife Service, Merced NWR, Los Banos, CA 93635, USA

3 Present address: U.S. Forest Service, Umatilla National Forest, Pendleton, OR 97801, USA

Wildlife Technical Report 002-2013 2

Douglas-fir (Pseudotsuga menziesii), grand fir (Abies grandis), western larch (Larix

occidentalis), lodgepole pine (Pinus contorta), ponderosa pine (P. ponderosa), and Englemann

spruce (Picea englmannii). Douglas-fir predominated at mid-elevations, ponderosa pine at low

elevations, and lodgepole pine and Englemann spruce at high elevations. Approximately 25% of

the area was bunchgrass rangeland. Land ownership was 60% U.S. Forest Service and 40%

private timber company lands and cattle ranches. Most of the area has been intensively managed

for timber harvest, although approximately 10% of the total study area was in a roadless area

associated with the municipal watershed for La Grande. Within this area, population estimates

based on hound-scenting transects were conducted in a 234 km2

area.

Management of black bear in the study area was representative of WMUs in the Blue Mountains

with a controlled spring season and a general fall bear hunting season running September

through November. The first spring bear season started in 1998. Prior to passage of Ballot

Measure 18 that banned the use of dogs for hunting bears after 1994, most harvest was

accomplished using tracking hounds, or bait stations and tree-stands. After passage of Measure

18, most bear hunting occurred concurrently during other big game seasons. A spring bear

hunting season was initiated in 1998 with 50 tags available for the entire Starkey Unit. Tag

numbers doubled in 2000. As examples of hunting pressure, in the 1999 fall general season, 20

bears were harvested for a 2% success rate (1,032 hunters), and during the 2000 spring

controlled hunt, one bear was harvested for a 1% success rate (100 tags available with 84

hunters). Bear check-in after harvest was not mandatory but was strongly encouraged during the

study with notices put into the game regulations and signs posted at road access points.

METHODS

Black Bear Capture

We captured black bears during 1 April - 1 August, 1993-97 (Table 1). During 1993 and 1994,

we used trained pursuit dogs (Willey 1980, Akenson et al. 2000), Aldrich foot snares (Flowers

1977), culvert traps, and darting over bait stations to capture black bears. We found use of

pursuit dogs the most effective capture method during 1993-94 and became the primary method

of capture during 1995-99. Methods other than dog-supported capture accounted for < 5% of

total bear captures.

During 1993-94, we searched the entire study area for bears throughout each capture period to

minimize seasonal and annual variation in gender and age of captured bears. In contrast, we

directed capture efforts to capture unmarked bears in 1995 and to obtain population density

estimates in 1996-97 (Akenson et al. 2001). During capture efforts dogs were primarily

positioned on vehicles driven along secondary roads or occasionally dogs were walked through

potential bear feeding or bedding areas. When dogs detected bear scent, they were released to

pursue the bear until the bear treed. If it was safe to immobilize the bear, we erected a net about

10 feet off the ground around the tree. The bear was then immobilized using a Palmer dart gun

(Palmer Chemical & Equipment Co., Douglasville, Georgia, USA) with Telazol (Fort Dodge

Telazol, Fort Dodge, IA) as the immobilizing agent. If using a net was unsafe to the bear or

capture personnel, a blind was constructed and the bear was darted as it left the tree. Radio-

tracking equipment was used to find immobilized radiocollared and leashed dogs to find

uncollared bears. Radiocollars were fitted on all immobilized bears during 1993-95. During

1996 we did not radiocollar subadult males due to concerns regarding bear neck-growth and

Wildlife Technical Report 002-2013 3

dispersal. In 1997 through 1999, several bears were uncollared if not needed to document age at

first breeding or for completing diet, habitat use, and denning studies.

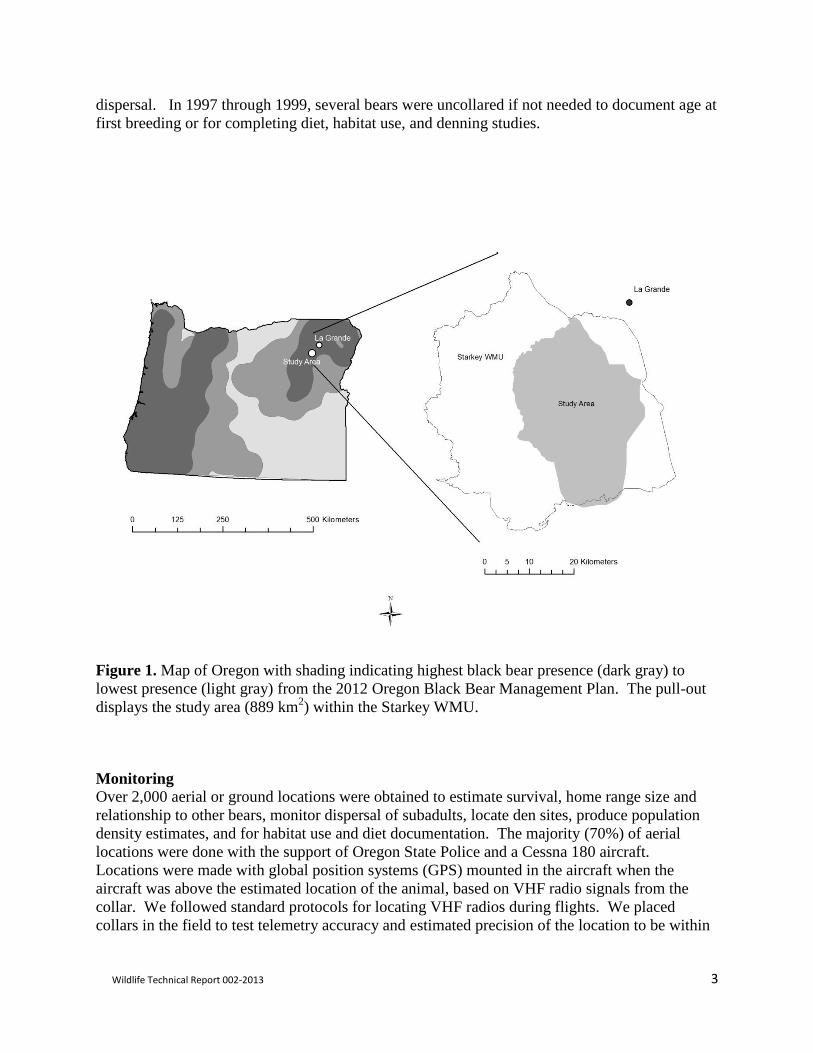
Figure 1. Map of Oregon with shading indicating highest black bear presence (dark gray) to

lowest presence (light gray) from the 2012 Oregon Black Bear Management Plan. The pull-out

displays the study area (889 km2) within the Starkey WMU.

Monitoring

Over 2,000 aerial or ground locations were obtained to estimate survival, home range size and

relationship to other bears, monitor dispersal of subadults, locate den sites, produce population

density estimates, and for habitat use and diet documentation. The majority (70%) of aerial

locations were done with the support of Oregon State Police and a Cessna 180 aircraft.

Locations were made with global position systems (GPS) mounted in the aircraft when the

aircraft was above the estimated location of the animal, based on VHF radio signals from the

collar. We followed standard protocols for locating VHF radios during flights. We placed

collars in the field to test telemetry accuracy and estimated precision of the location to be within

Wildlife Technical Report 002-2013 4

800 m of the true location and have no consistent directional bias. We determined ground

locations by triangulation or direct observation.

Population Estimation

In 1996 and 1997, we conducted surveys to locate bears along 4 transect routes (hound transects)

and used mark-recapture methods to estimate a black bear population. Transect routes averaged

21 km in length and bisected representative habitat types with a variety of forest management

practices, open road densities, and food resources found within our study area. We conducted

surveys from May 8 to July 31 each year to maximize efficiency of scent detection as influenced

by weather and to minimize bias caused by dispersing subadult bears (Akenson et al 2001).

We used trained pursuit dogs to locate bear scent during surveys (Akenson et al. 2001). Dogs

were leashed on a front hood platform of a pickup truck which was driven slowly ( 10 kph)

along transect routes. When dogs detected bear scent, they barked excitedly, which was

considered a “strike.” If recent presence of a bear was verified through bear tracks and/or other

sign, dogs were released to chase and tree the bear. Strike locations were documented with an

odometer reading, and the route of bear pursuit was drawn on the transect map to document any

re-crossing of transects ahead of the strike location. We determined mean chase distances and

duration, and treeing success. Distances traveled per strike (km/scent detection) were compared

between years using the Wilcoxon rank sum test. Bears treed by dogs during transects were

individually identified by radio frequency for radiocollared bears, eartag number for eartag-only

bears, or distinguishing features, such as color, markings, and size for unmarked bears.

Home Range

We attempted to locate radiocollared bears at least twice a month from April through October to

monitor bear movements and survival. Monitoring began with emergence from the den and

ended with den entry. We calculated and mapped in a GIS home ranges using four methods:

Minimum Convex Polygon (MCP), 95% contour adaptive kernel (Worton 1989), and 50% and

95% volume isopleth fixed kernel with least squares cross-validation smoothing parameter

(Beyer 2012), R Core Team (2012) for bears with > 30 locations. We mapped home ranges

using the fixed kernel method with 50% volume isopleth.

Dispersal

Monitoring the movement patterns of subadult bears has been avoided by other studies due to the

difficulty of adjusting collars to account for growth of bears. Because we used tracking dogs to

capture specific individuals to maintain radiocollars, we were able to document dispersal and

age-at-first-litter. We radiocollared subadult females in 1993-1998 and subadult males in 1993-

1995. We focused capture efforts on subadult females every year because they did not show a

tendency for long-distance dispersal, and we were completing age-at-first-litter documentation

whereas monitoring dispersing males was time consuming.

Reproduction

We estimated reproduction during 1993-95 from the number of cubs treed with radiocollared

females. In 1996, 12 hibernating females were immobilized so cubs could be marked, sexed,

weighed, and measured. Immobilizations in dens were performed with Telazol administered by

a syringe-mounted jabstick. We inserted AVID microchips (Norco, CA) under the skin behind

an ear of all newborn cubs to associate offspring with radiocollared females during subsequent

Wildlife Technical Report 002-2013 5

captures. All subadult bears captured after 1996 were scanned for microchips. We used a

goodness of fit test for bias in sex ratio and pelage color of cubs (SPSS Incorporated 1993). We

used a Student’s t-test to compare average weights between male and female cubs and between

cubs from litters of 2 and 3. During 1997, 9 radiocollared females were treed to determine

survival of cubs born in 1996. Six subadult female bears were monitored until studies ended in

2000 to document age for having first litter of cubs.

Age

We removed a premolar from all immobilized, adult bears with a tooth elevator. Bear teeth were

sectioned and aged using the cementum annuli method (Willey 1974) at Matson’s Laboratory at

Milltown, Montana. A three way comparison was made between study bears, bears harvested

within the Starkey WMU, and bears harvested in the Blue Mountains ecoregion.

Habitat Use and Diet

Habitat use and availability by forest type was estimated using GIS (Bull et al. 2001). Utilization

of these areas was determined from 12 radiocollared bears representing 3 sex/age classes: adult

male, adult female, and subadult female. Habitat use was documented in the field by locating

each bear weekly through ground-tracking with telemetry to either directly observe the bear’s

activities or identify evidence of use such as beds, tracks, and sign of foraging. At each

confirmed bear location, two levels of evaluation took place. A circular 0.05 ha plot evaluated

small-scale habitat features, and then a 200 m radius search for foraging in dead wood. Besides

identifying and describing the forest type, canopy cover, and forest management status, efforts

were focused on identifying what the bear was feeding on, whether animal carcass, ungulate

neonates, insects, or plant matter (Bull and Torgersen 2001).

Den Sites

From 1993 to 1999 165 black bear dens were located and described (Bull et al. 2000, 2001).

Dens were located using a combination of air and ground telemetry during fall and early winter

months. Den characteristics were quantified at the time of discovery or during the following

summer after the bear had left the den site. A GPS was used to pinpoint den sites for future

reference. Dens associated with hollow trees or logs were classified as top-entry tree, base-entry

tree, or inside a hollow log. Other den types were caves, excavations under logs, or ground

excavations. Dens were quantified only once although reuse was recorded.

Survival and Mortality

We used the Kaplan-Meier program to estimate survival rates for all radiocollared bears.

Survival estimates were modified for staggered entry (Pollack 1989). Both monthly and annual

survival estimates were calculated from 1993 to 1998, with the criteria of 10 or more individuals

with active radiocollars, confirmed through aerial telemetry. Mortality was also documented

through aerial telemetry and hunter harvest reporting.

Wildlife Technical Report 002-2013 6

RESULTS

Monitoring

During 1993-97, we observed 157 different subadult and adult bears. Eighty bear were captured,

of which 65 (21 adult males, 12 subadult males, 22 adult females, 10 subadult females) were

outfitted with radiocollars and 12 were given only eartags (1 adult male, 11 subadult males).

Only marked bears were used for sex ratio and age structure analysis. Unmarked bears were

incorporated into population density estimates derived from the hound transects. In addition, 75

cubs-of-the-year were observed during 1993-97, but these animals were not included in density

estimates.

Population Estimate

As of August 1995, 52 bears were marked in the 485 km2 capture area and determined a

minimum bear density of 10.8 subadult and adult bears/100 km2. The NOREMARK density

estimates derived from the hound transects were approximately 2 times higher because they

account for the unmarked segment of the population not identified in 1995. During summers of

1996 and 1997 we conducted 53 surveys along the 4 transect routes. Dogs detected 72 bear

scents as strikes. Strike frequency was used as a density index, and contact frequency of strikes

did not differ between years. On 55 occasions bears were treed after being pursued by dogs from

transect routes; 33 were marked and 22 were unmarked. During 1996 surveys, 57% of bears

contacted were marked compared to 63% marked in 1997. Applying the NOREMARK software,

we estimated 59 bears in 1996 and 48 bears for 1997 in the 234 km2 survey area. We calculated

a density of 25.2 bears/100 km2 in 1996 and 20.5 bears/100 km for 1997 (Akenson et al. 2001) or

an average of 0.23 bears per km2, which is representative of a high presence black bear

population in the Blue Mountains of northeastern Oregon (Figure 1). See Akenson et al. (2001)

for full summary of results.

Home Range

Both male and female home ranges were larger than the majority reported around the West

where most information available has been calculated using MCP method. Using MCP, the

Starkey study mean home ranges were 39.3 km2

for females, 39.1 km2

for sub-adult females, and

161 km2

for adult males (Wertz et al. 2000). Using the 50% volume isopleth fixed kernel

method, home ranges were 87 km2 for adult males and 19 km

2 for adult females. All but one of

21 adults (13 females, 8 males) had home ranges that overlapped with other radiocollared bears.

Eighty-five percent of the adult females had overlap with other females with a median home

range overlap of 18%. Male bears overlapped other males slightly less at 15% of their home

range area. The greatest amount of overlap among adult bears was males overlapping with

females. Three adult males had 100% overlap with 5 different females, and one male partially

overlapped 5 different female bear home ranges (Figure 2). In cases of known parentage 3

subadult females established home ranges within their mother’s home range.

Dispersal

Dispersal patterns varied greatly between subadult males and subadult females. None of the 11

subadult females left the study area. Seven subadult females did not disperse moving a mean

distance of 1.7 km (0.6 km – 3.6 km) from capture site to center of their home ranges. All three

subadult females with radiocollared mothers established home ranges within their mother’s home

Wildlife Technical Report 002-2013 7

range. Seven of 18 subadult males left the study area and moved an average of 63 km (range =

33 to 96 km) from their capture site to where they were recaptured and collars removed or killed

by a hunter. Four subadult males were killed by hunters before dispersing. Subadult males

dispersed between 1 and 3 years of age and none of the 5 radiocollared 4-year-old males

dispersed (Wertz et al. 2001).

Table 1. Age class and gender of bears captured and marked with eartags and/or radio-collars

within Starkey Wildlife Management Unit, northeast Oregon, 1993-97.

Males Females

Year Adult Subadult Adult Subadult Total M:F

1993 6 (4) a, b

6 (6) 8 (8) 3 (3) 23 (21) 1.09

1994 6 (5) b

6 (6) 11 (11) 5 (5) 28 (27) 0.75

1995 7 (7) 4 (0) 2 (2) 0 (0) 13 (9) 5.50

1996 5 (4) 5 (1) 1 (1) 2 (2) b

13 (8) 3.33

1997c 1 (0) 2 (0) 0 (0) 0 (0) 3 (0) n/a

Total 25 (20) 23 (13) 22 (22) 10 (10) 80 (65) 1.50 a Number of captured bears with radiocollars indicated in parentheses.

b Includes capture-related mortalities: 2 adult males in 1993 (not radiocollared), 1 adult male in

1994 (not radiocollared), and 1 subadult female in 1996 (collared). In addition, a female cub

died due to capture related causes in 1995, but is not included in this table. c No new bears were radiocollared during 1997.

Reproduction

Reproductive histories were developed for 35 radiocollared female black bears from 1993-2000

focusing on cub production, cub survival, and age at first birth. We documented 42 litters by 27

females. Female bears exhibited synchronous biennial breeding cycles in which 83% of females

produced cubs during even years and only 7% of radiocollared females gave birth in odd years.

We have no explanation for this observation. Mean litter size of cubs in dens was 2.2 (n = 36).

We did not document any females with birth intervals > 2 years. March weight of cubs did not

differ by gender (males: 2.8 kg; females; 2.5 kg; t = -1.75, P = 0.09). Cubs from litters of 2

weighed more ( x = 3.02 kg) than from litters of 3 ( x = 2.42 kg; t = 4.56; P < 0.01). Sex ratio of

cubs was 0.62 male: 1.0 female (13 males, 21 females) and was not different from parity (x2 =

0.95, P = 0.47). Cub survival to 18 months (n = 39) was 72%. Of the 12 subadult females

monitored during the study, 6 had their first litter at an average age of 4.7 yrs. One female (age

5) had not given birth by the end of the study and 5 others (ages 3, 4, 4, 5, 5) were killed or radio

contact was lost by the end of the study. No bears younger than age 4 gave birth and all bears

followed to age 6 had given birth.

Ages

Ages of 586 bears (62 radiocollared, 524 hunter-harvested) were determined from the Blue

Mountain ecoregion collected from 1993-97. Average age did not differ between bears

harvested within Starkey WMU and other WMU’s in the Blue Mountains (t = -0.78, P = 0.44),

Wildlife Technical Report 002-2013 8

so ages of harvested bears were pooled. Average age did not differ between radiocollared and

hunter harvested bears for males (t = 0.13, P = 0.90), females (t = 0.14, P = 0.89) or all bears (t =

0.58, P = 0.56). Average and median ages, of radiocollared bears were 4.7 and 4.0 for males, 6.1

and 4.0 for females, and 5.4 and 4.0 years for all bears (n = 62) (Table 2).

Table 2. Mean and median (Med.) ages of captured and hunter-killed bears, based on tooth

cementum annuli analysis, Starkey Wildlife Management Unit and throughout northeast Oregon,

1993-97.

Males Females All Bears

n Mean +

SD

Med. n Mean +

SD

Med. n Mean +

SD

Med. Male:

female

ratioa

Capturedb

31 4.7 + 3.9 4.0 31 6.1 + 4.6 4.0 62 5.4 + 4.3 4.0 1.0:1.0

Starkey

Harvest c

12 3.2 + 2.2 2.5 11 5.7 + 7.0 2.0 23 4.4 + 5.2 2.0 1.1:1.0

Blue

Mtns

Harvest d

335 4.7 + 4.0 3.0 166 6.0 + 4.7 4.0 501 5.1 + 4.3 4.0 2.0:1.0

Total 378 4.6 + 3.9 3.0 208 6.0 + 4.8 4.0 586 5.2 + 4.3 4.0 a Includes all captured bears (n = 80) because bears were selectively radiocollared.

b No new bears were captured in 1997, so data is from 1993-96. Ages were not obtained for

eartag-only bears. Ages were not obtained for 1 adult female and 2 adult male radiocollared

bears. c Does not include radiocollared bears harvested within Starkey WMU.

d Bears harvested from WMU’s in the Blue Mountains eco-region. Totals do not include

radiocollared bears or those harvested within Starkey WMU.

Habitat Use and Diet

Use of forest type, habitat structural composition, and management status varied among

reproductive classes of bears (Bull et al. 2001). Adult males used the most diversified habitats

while adult females consistently used grand fir stands that were old with closed canopy and

multiple canopy layers. These habitats were typically unlogged (Figure 3). Bull et al. (2001)

also found bedding sites and movement corridors had a high degree of security cover and dense

canopy closure. Sites used for foraging on logs were in more harvested stands and higher on the

slope. Sites used for foraging on fruit (wild berries) were in more open stands, lower on the

slope and closer to roads and water. Bears selected for downed logs large in diameter (>38 cm in

diameter) with either partial or advanced decay. The dead wood was comprised of 82% logs,

17% stumps, and 1% snags. Logs with partial or advanced decay comprised 99% of logs with

foraging activity. Of logs used for foraging, 50% contained ant galleries, 21% freely moving

ants, 4% yellow jackets, 2% wood boring larvae, and 23% undetermined type of insect.

Wildlife Technical Report 002-2013 9

Figure 2. Male and female home range overlap calculated at 50% kernel density estimate.

Outside boundary is a 9 km buffer around the study area in Figure 1.

Wildlife Technical Report 002-2013 10

Bull and Torgersen (2001) reported the mean volume of foods from 621 scat samples. They

found grasses comprised 35%, insects 24%, soil and wood 11%, animal remains 10%, and leaves

and stems 4% of the scats. These proportions varied seasonally, and during early summer mule

deer (Odocoileus hemionus) and elk (Cervus elaphus) remains occurred in 44% of the scats in

1998 and 25% in 1999.

Den Sites

Bull et al. (2000) summarized characteristics of winter dens of bears. Between 1993 and 1999

165 dens for 51 different radiocollared bears were identified for 23 adults, 19 subadults, and 9

bears monitored as both subadults and adults. Forty-one percent of all dens were in hollow trees

or logs followed by ground excavations (37%) and caves and rock structures (22%). The

distribution by specific den types included: 24.7% excavations under logs, 21.7% in caves,

19.3% in top-entry trees, 12.1% in ground excavations, 10.8% in hollow logs, 10.8% in base-

entry trees, and 0.6% on the snow surface in a tree well. Bears in the Starkey WMU reused dens

from year to year in structure types involving trees. Twenty-three percent of top-entry trees were

used by the same bear for 2 or 3 years. Thirteen percent of hollow logs, 12% of ground

excavations, and 9% of caves were used at least 2 years. Four bears used dens under logs for 3

successive years. Eighty-eight percent of dens were in grand fir forest types, 8% in Douglas-fir,

3% in lodgepole pine, and 1% in subalpine fir. Slope gradient averaged 30% and aspect was

highly variable with 30% west, 29% north, 21% east, and 21% south. Distance from a den to an

open road averaged 3.1 km (SD = 4.8). Eighty-nine percent of dens had 2 or more canopy layers

(Bull et al. 2000).

Survival Average annual survival rates were 0.82 for males, 0.88 for females, and 0.84 for all bears (Table

3). These survival rates were comparable to a study conducted in the Okanogan region of

Washington where survival from 1994-98 was 0.77 for males and 0.95 for females (Koehler and

Pierce 2005). Survival rates of bears on the west slope of the Cascades were similar for both

males (0.85) and females (0.83) (D. Immell, pers. comm. 2012). Hunting was the primary form

of mortality in our study accounting for 70% of all bear mortality, 1993-98 (Table 4).

Wildlife Technical Report 002-2013 11

Figure 3. Major habitat types and home ranges of adult female black bears within the Starkey

Wildlife Management Unit, northeast Oregon. Black lines represent 50% kernel density

estimates of individual bears and total mapped area represents 95% kernel density estimates of

adult female bears. Habitat types were derived from LANDFIRE (2001).

Wildlife Technical Report 002-2013 12

Table 3. Survival rates for radiocollared bears (pooled by age/sex class) in the Starkey Wildlife

Management Unit, northeast Oregon, 1993-98. We used a minimum of 10 bears per category for

estimating survival.

N

S(x)

SE

Lower 95%

CI

Upper 95%

CI

Deaths

Males

Jul 93-Mar 94 10 0.90 0.09 0.71 1.00 1

Apr 94-Mar 95 18 0.67 0.11 0.45 0.88 6

Apr 95-Mar 96 16 0.75 0.11 0.54 0.96 4

Apr 96-Mar 97 13 0.77 0.12 0.54 1.00 3

Apr 97-Mar 98 10 1.00 1.00 1.00 0

Average 0.82 Total 14

Females

Jul 93-Mar 94 10 0.80 0.13 0.55 1.00 2

Apr 94-Mar 95 24 0.88 0.07 0.74 1.00 3

Apr 95-Mar 96 23 0.91 0.06 0.80 1.00 2

Apr 96-Mar 97 22 0.91 0.06 0.79 1.00 2

Apr 97-Mar 98 19 0.89 0.07 0.76 1.00 2

Average 0.88 Total 11

All Bears

Jul 93-Mar 94 20 0.85 0.08 0.69 1.00 3

Apr 94-Mar 95 42 0.79 0.06 0.66 0.91 9

Apr 95-Mar 96 39 0.85 0.06 0.73 0.96 6

Apr 96-Mar 97 35 0.86 0.06 0.74 0.97 5

Apr 97-Mar 98 29 0.86 0.06 0.74 0.99 4

Average for All 0.84 Grand Total 25a

a Does not include 4 bears that died due to capture-related causes and 1 female bear harvested in

the 1998.

DISCUSSION

Developing a reliable method to estimate black bear populations is critical for species

management; however, methods currently used have some degree of detection bias and vary in

cost and efficiency. The initial work by Akenson et al. (2001) addressed one of the primary

biases in sampling bears; bears were detected within their normal range rather than attracted to a

bait or scent thus minimizing behavioral responses caused by the attractant. This capture work

was conducted from June – early July when the widest range of sex and age classes of bears were

encountered, because it was during the breeding season and before subadults dispersed (Akenson

et al. 2001). However, additional work needs to be done to validate this method as a reliable tool

to estimate bear populations. Perhaps the best application of dog scent surveys would be in

conjunction with using bio-darts (Russell et al. 2012). Determining an accurate and cost-

effective method of population surveys is still evolving and will only be enhanced by mandatory

hunter check-in, first implemented on a state-wide basis in 2008.

Wildlife Technical Report 002-2013 13

Table 4. Mortality causes for all radiocollared bears, Starkey Wildlife Management Unit,

northeast Oregon, 1993-98.

Hunting Illegal Unknown Vehicle Capture Total

Males

Adult 4 1 0 0 3 8

Subadult 5 2a 2 0 0 9

Female

Adult 5 2a 2 1 0 9

Subadult 2 0 0 0 1 3

Total 15 5 4 1 4 30 aIncludes 1 adult male, 1 subadult male and 1 adult female which were not checked-in, thus were

considered illegal harvests although other hunting regulations may have been observed.

In reviewing home range characteristics from many studies across the U.S., it is apparent sizes

vary greatly on a regional basis. Vander Heyden (1997) compiled home range sizes from 26

studies, and in studies west-central Colorado, northeastern Washington, Idaho, and Oregon

Cascades, average MCP home range for female bears was 30.4 km2. Home ranges in this study

for females averaged 39 km2, well within the range of all studies reported.

Diet and habitat research in this study identify certain habitat types and structural components as

being most important for reproductively-active female black bears. Female bears with cubs

tended to stay in more remote areas with dense cover and large-diameter trees that could serve as

security trees which cubs could climb to escape a threat. Beecham and Rohlman (1994) reported

females with cubs favored dense tree stands, while those without cubs used more open timber

during spring months in Idaho. Vander Heyden and Meslow (1999) reported in the central

Cascades of Oregon, 10 of 12 female home ranges occurred in closed canopy mature timber and

this structure was the most prevalent forest type for those bears. The high occurrence of top-

entry tree dens reported in our study has not been documented elsewhere in the western United

States, although in British Columbia all dens were in or beneath large diameter trees, root boles,

and logs (n = 67, Davis 1996). Based on diet and habitat use from our study, large diameter and

decaying logs, both standing and downed in a dense canopy cover are ecologically important for

black bears in northeast Oregon.

The health of a black bear population is ultimately reflected through survival rates, age and sex

structure, and reproductive parameters. Hebblewhite et al. (2003) determined growth rates of

black bear populations were most influenced by adult female survival and reproductive rates.

Survival rates we documented were very similar or slightly higher than those reported in several

other western states (Koehler and Pierce 2005). Results from our study revealed human-caused

mortality was the biggest source of mortality for bears. We estimated adult male: female ratios

to be 0.79:1.00. Sex ratios of adults would be expected to favor males in unhunted populations

Wildlife Technical Report 002-2013 14

and favor females in heavily exploited populations (Beecham 1983, Beck 1991). Therefore, with

the high survival rates and sex ratios we found in the Starkey study area suggested a moderately

hunted population in good health. Subadult males had the highest rate of morality of any sex-age

classes we evaluated.

Harvest records can be used to assess population health and evaluate harvest methods. We

gained insight from this study on effect of changes in methods of hunting after the 1994 hunting

season when Ballot Measure 18 was implemented. There was no discernible change in harvest

structure (age, sex, and number) in the years before and 2 years after the change in regulation

(Tables 3, 4). Akenson et al. (1997) speculated that age and sex ratios and total harvest would be

reduced from less discriminating methods of spot and stalk or opportunistic hunting. The biggest

changes in harvest and hunter behavior were with social factors such as hunter effort when

measured at the statewide level and with larger sample sizes. In 1994, the last season that dogs

and bait were legal, the statewide harvest totaled 1,250 with 13,672 hunters participating (general

bear season and harvest summary, ODFW 2011). For the 2010 season, 3 times as many hunters

(32,777) harvested a near identical number of bears (1,235). In 1994, the male: female ratio was

3:1 (905:280) compared with a ratio closer to 2:1 (836:380) for the 2010 hunting season. The

advent of the sport-pack and reduced price bear tag has encouraged bear hunting around the

state.

The reproductive potential of female bears in this study area was higher than other populations in

the western United States in terms of litter size, litter frequency and cub survival (Wertz et al.

2001). Based on the importance of insect and animal remains in bear diet, Wertz et al. (2001)

speculated 3 large-scale and long-term changes in the habitat of the Blue Mountains may have

contributed to more optimal conditions for reproductive success. These 3 variables were

increased salvage logging during the 1980’s which resulted in more woody ground debris during

the 1990’s, an increasing elk population which led to more hunter harvest (more elk carcass

remains in the fall and spring time neonates), and the return to a normal precipitation regime

during the years of the study. As ecological conditions change over time, these data may provide

a benchmark for future monitoring of bear populations in northeast Oregon.

MANAGEMENT IMPLICATIONS

From a state perspective, these findings tie directly to objectives 3 and 4 in Oregon’s Black Bear

Management Plan (Oregon Department of Fish and Wildlife 2012). Objective 3 reads: “To

develop, refine, and evaluate population abundance estimation through modeling techniques.”

Objective 4 states: “to continue to improve basic understanding of black bear management and

ecology through applied research.” Regionally, this has been the only large-scale black bear

study conducted in eastern Oregon. From a district and field-level perspective, these findings

give managers baseline information on many aspects of black bear population ecology and

identify critical habitat components to manage for protection or retention to help ensure a healthy

black bear population in eastern Oregon.

Wildlife Technical Report 002-2013 15

Population Modeling

In order to have effective population modeling, there needs to be effective methods for

estimating population size of a specific area or management unit. As Garshelis (1993) has

pointed out, biases exist inherent to bear population estimation regardless of method. To help

alleviate this, Garshelis suggests using a combination of trend indicators, including harvest data,

nuisance activity, and visitation at bait, scent, or camera stations. Akenson et al. (2001) suggest

an economical alternative through using bear dogs and strikes per kilometer to an index for

referencing population trends. Immell et al. (2008) suggested using tetracycline markers in bait,

as an ingestible biomarker, to deploy over large areas at relatively low cost. Immell and

Anthony (2008) used increased sample sizes and systematic, bait spacing to reduce bias when

collecting DNA samples. Since mandatory check-in was implemented in 2008 (Oregon Bear

Plan, 2012), DNA sampling methods gain practicality with the increased samples that may be

available. Kohlmann et al. (1999) warned that the collection method (stalking, bait, dogs) was a

large factor influencing the age and sex structure of a bear population as determined from tooth

samples collected by hunters. Kohlmann et al. (1999) suggested hunter samples need to be

validated with other survey techniques. Whatever population sampling method is used, priority

should be given in future surveys to WMU’s which have solid baseline information on the

population, such as in the Starkey WMU, or similar environmental situations and matching

hunting season regulations.

Critical Habitat

Trees having both large diameter and appropriate decay type to form large hollow chambers are

extremely scarce in the managed forests of the Blue Mountains and habitat evaluation from this

study area support the importance of this type of woody structure. Retention of live and dead

standing, large diameter grand fir, western larch, and ponderosa pine, with evidence of decay –

in grand firs, usually Indian paint fungus (Echinodontium tinctorium), will maintain both

denning and security opportunities for black bears. Maximizing the occurrence of structure

suitable for den sites in hollow trees and logs will require special consideration of grand fir

stands in climax stages for several hundred years to come.

ACKNOWLEDGEMENTS

The authors are grateful for the contributions made to this technical report about findings on the

ecology of black bears in the Starkey WMU:

Priscilla Coe – for assistance with home range and overlap analysis and figures.

Evelyn Bull – making available the diet and habitat papers described in this report.

Dave Immell – collaborating on survival findings from the Cascades black bear study

Leonard Erickson, Jim Cadwell, and Pat Matthews – a review for management application.

Ron Anglin, Bruce Eddy, and Nick Myatt – for providing the administrative support necessary

to accomplish this synthesis of black bear research findings.

This project was supported by the Oregon Department of Fish and Wildlife through the Federal

Aid in Wildlife Restoration Grant W-89-R-2.

Original Project contributors:

Wildlife Technical Report 002-2013 16

This project is greatly indebted to several individuals, and particularly a group of volunteer and

dedicated houndsmen led by Ted Craddock with assistance from Jon Wagoner, Brent German,

Loren Brown, Wes Craddock, Emery Ferguson, Trent Hafer, and Monty Roe. These houndsmen

were the backbone of our capture operations and made the project possible through their

contributions. We would also like to thank the project technician Dave Carroll for his dedicated

field effort. We are very grateful to the Oregon State Police, particularly our pilot Sr. Trooper

Ken West and Sr. Trooper Larry Tucker. Several ODFW employees contributed to this project’s

success, including Leonard Erickson, Jim Cadwell, Chuck Stelling, Russ Powell, Jon Paustian,

Ray Guse, DeWaine Jackson, and Peg Boulay. We are grateful to Craig Ely for facilitating the

administrative needs of this project.

LITERATURE CITED

AKENSON, J.J., T. L. WERTZ, AND M.G. HENJUM. 2000. Black bear population characteristics,

movements and denning habitat in the Starkey Wildlife Management Unit of the Blue

Mountains of Oregon. Final Report. Federal Aid in Wildlife Restoration Grant W-89-R-

2. Study 118000-01.

AKENSON, J.J., R.L. GREEN, S.G. KOHLMANN, AND M.G. HENJUM, 1997. Are hunter harvested

tooth ages an accurate indicator of the age structure of a black bear population in

Oregon? Sixth Western Black Bear Workshop, May, Ocean Shores, Washington.

AKENSON, J. J., M. G. HENJUM, AND T. J. CRADDOCK. 2001. Use of dogs and mark-recapture

techniques to estimate black bear densities in northeast Oregon. Ursus 12:203-210.

BECK, T.D.I. 1991. Black bears of the west-central Colorado. Technical Publication Number

39. Colorado Division of Wildlife. Fort Collins, Colorado, USA.

BEECHAM, J.J. 1983. Population characteristics of black bears in west central Idaho. Journal of

Wildlife Management 47:402-412.

BEECHAM, J.J., AND J. ROHLMAN. 1994. A shadow in the forest: Idaho’s black bear. University

of Idaho Press, Moscow, Idaho, USA.

Beyer, H.L. 2012. Geospatial Modelling Environment (Version 0.7.2.0)

http://www.spatialecology.com/gme [Accessed 2013, February 27]

BULL, E. L., T.W. HEATER, AND T. L. WERTZ. 2001. Bear habitat use in northeastern Oregon.

Proceedings of the Western Black Bear Workshop, Coos Bay, Oregon 7:82-91.

BULL, E. L., AND T.R. TORGERSEN. 2001. The importance of vegetation, insects, and neonate

ungulates in black bear diet. Northwest Science 75:244-253.

BULL, E.L., J.J. AKENSON, AND M.G. HENJUM. 2000. Characteristics of black bear dens in trees

and logs in northeastern Oregon. Northwestern Naturalist 81:148-153.

Wildlife Technical Report 002-2013 17

DAVIS, H. 1996. Characteristics and selection of winter dens by black bears in coastal British

Columbia. M.S. Thesis. Burnaby BC: Simon Fraser University. Canada. 147p.

FLOWERS, R. 1977. The art and technique of snaring bears. Washington Forest Protection

Association, Seattle, Washington, USA.

FRANKLIN, J. F., AND C. T. DYRNESS. 1973. Natural vegetation of Oregon and Washington.

Oregon State University Press. Corvallis, Oregon, USA.

GARSHELIS, D.L. 1993. Monitoring black bear populations: pitfalls and recommendations.

Proceedings of the Fourth Western Black Bear Workshop. Yosemite National Park,

California, USA. 4:123-144.

HIBBLEWHITE, M., M. PERCY, AND R. SERROUYA. 2003. Black bear (Ursus americanus)

survival and demography in the Bow Valley of Banff National Park, Alberta, Canada.

Biological Conservation 112:415-425.

IMMELL, D., D.W., JACKSON, AND R.L. GREEN. 2008. The effectiveness of tetracycline as a

marker to estimate black bear numbers in Oregon. ODFW Wildlife Technical Report,

001-2008.

IMMELL, D., AND R.G. ANTHONY. 2008. Estimation of black bear abundance using a discrete

DNA sampling device. Journal of Wildlife Management 72:324-330.

KOHLMANN, S.G., R.L. GREEN, AND C.E. TRAINER. 1999. Effects of collection method on sex

and age composition of black bears (Ursus americanus) harvest in Oregon. Northwest

Science 73:34-38.

KOEHLER, G.M., AND D.J. PIERCE. 2005. Survival, cause specific mortality, sex, and ages of

American black bears in Washington State, USA. Ursus 16:157-166.

LANDFIRE 2001. LANDFIRE 1.0.5 Existing Vegetation Type layer. U.S. Department of the

Interior, Geological Survey. [Online]. Available: http://landfire.cr.usgs.gov/viewer/

[Accessed 2013, February 27].

OREGON DEPARTMENT OF FISH AND WILDLIFE. 2012. Oregon black bear management plan.

Salem, Oregon, USA. 60p.

POLLOCK, K., S. WINTERSTEIN, C. BUNCK, AND P. CURTIS. 1989. Survival analysis in telemetry

studies: the staggered entry design. Journal of Wildlife Management 53:7-15.

R Core Team. 2012. R: A language and environment for statistical computing. R Foundation for

Statistical Computing, Vienna, Austria. ISBN 3-900051-07-0, URL http://www.R-

project.org

Wildlife Technical Report 002-2013 18

ROGERS, L. L. 1987. Effects of food supply and kinship on social behavior, movements, and

population growth of black bears in northeastern Minnesota. Wildlife Monographs 97.

RUSSELL, R. E., J. A. ROYLE, R. DESIMONE, M. K. SCHWARTZ, V. L. EDWARDS, K. P. PILGRIM,

AND K. S. MCKELVEY. 2012. Estimating abundance of mountain lions from unstructured

spatial sampling. Journal of Wildlife Management 76:1551-1561.

SPSS INCORPORATED. 1993. SPSS for Windows base system user’s guide. Release 6.0. SPSS

Inc., Chicago, Illinois, USA.

VANDER HEYDEN, M. 1997. Female black bear habitat selection and home range ecology in the

central Oregon Cascades. M.S. Thesis. Corvallis, Oregon State University. USA. 135p.

VANDER HEYDEN, M., AND E.C. MESLOW. 1999. Habitat selection by female black bears in the

Central Cascades of Oregon. Northwest Science 73:283-294.

WERTZ, T.L., J.J. AKENSON, M.G. HENJUM AND E. L. BULL. 2000. Home range and dispersal

patterns of subadult black bears in northeastern Oregon, Proceedings of the Seventh

Western Black Bear Workshop, Coos Bay, Oregon, USA 7:93:100.

WERTZ, T.L., J.J. AKENSON, AND M.G. HENJUM. 2001. Reproductive parameters of female black

bears in northeastern Oregon. Unpublished paper, ODFW files. La Grande, Oregon.

WILLEY, C. H. 1974. Aging black bear from first premolar tooth sections. Journal of Wildlife

Management 38: 97-100.

WILLEY, C. H. 1980. Black bear location and capture with the aid of trained dogs. Eastern

Workshop Black Bear Management and Research 5:107-119.

WORTON, B.J. 1989. Kernel methods for estimating the utilization distribution in home range

studies. Ecology 70:164-168.

Wildlife Technical Report 002-2013 19

APPENDIX 1

Topic Author

Black bear population characteristics, movements and denning

habitat in the Starkey Wildlife Management Unit of the Blue

Mountains of Oregon

Akenson et al. 2000

Use of dogs and mark-recapture techniques to estimate black bear

densities in northeast Oregon

Akenson et al. 2001

Bear habitat use in northeastern Oregon Bull et al. 2001

The importance of vegetation, insects, and neonate ungulates in

black bear diet

Bull et al. 2001

Characteristics of black bear dens in trees and logs in northeastern

Oregon

Bull et al. 2001

Reproductive parameters of female black bears in northeastern

Oregon

Wertz et al. 2001

Home range and dispersal patterns of subadult black bears in

northeastern Oregon

Wertz et al. 2000

Are hunter harvested tooth ages an accurate indicator of the age

structure of a black bear population in Oregon

Akenson et al. 1997

Bear trees: And eastern Oregon landscape legacy Parks et al. 1996

Project documents stored on: Starkey Data Drive (U):\PredNutr Study\Documents\Bear

Study\Supporting Documents - Starkey Bear Study


Recommended