20
Population Epidemiologic Transition- within the demographic stages Chapter 2
| Date post: | 31-Dec-2015 |
| Category: |
Documents |
| Upload: | gwendoline-ray |
| View: | 219 times |
| Download: | 2 times |
PopulationEpidemiologic Transition-
within the demographic stages
Chapter 2

The Classic Demographic Transition
Stage 1 Stage 2 Stage 3 Stage 4
Time
Naturalincrease
Birth rate
Death rate
Note: Natural increase is produced from the excess of births over deaths.

• In 1798 he published An Essay on the Principle of Population
• Malthus was the first to sound the alarm that the world’s population was expanding more rapidly than food production.
• He was the first to recognize exponential or geometric population growth.
• Today those who share his concerns are Neo-Malthusians
Rev. Thomas Malthus 1766-1834

OVERPOPULATION MYTH
• http://www.youtube.com/watch?v=vZVOU5bfHrM

Neo-Malthusians(supporters)

Critics of Malthus
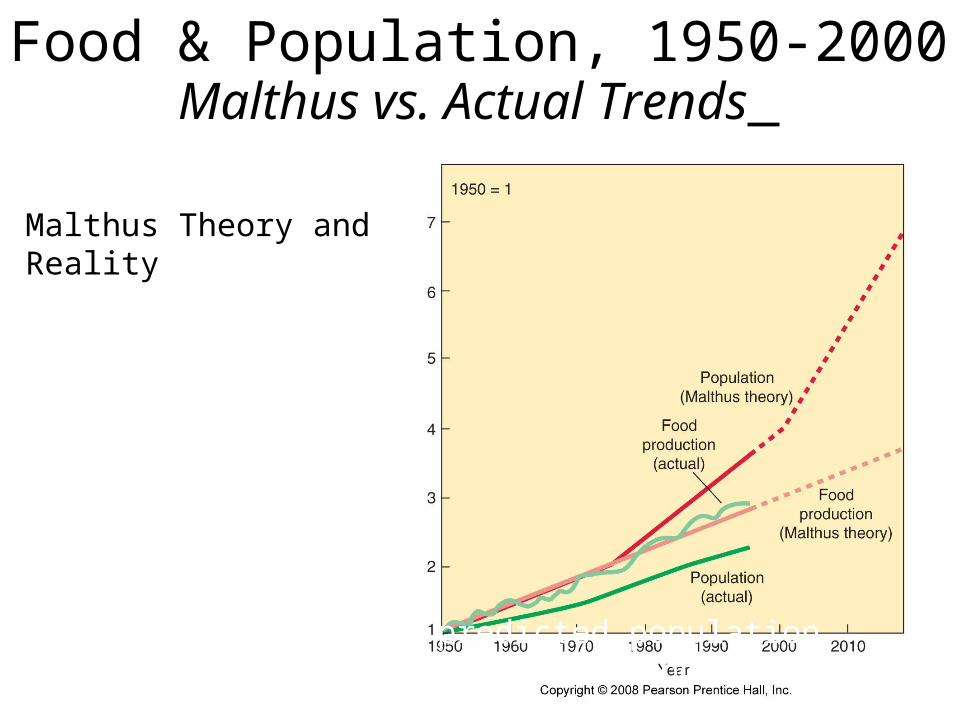
Food & Population, 1950-2000Malthus vs. Actual Trends
Fig. 2-20: Malthus predicted population would grow faster than food production, but food production actually expanded faster than population in the 2nd half of the 20th century.
Malthus Theory and Reality

World Health Threats• This transition occurs as a country undergoes the process
of modernization or economic development. Less economically developed countries have higher rates of infectious diseases as standards of medical care are lower than that found in more economically developed countries.
• In more economically developed countries, more people die from degenerative diseases as infectious diseases such as cholera and typhoid are easily treated, causing more people to die from cancers as they live longer.

Epidemiologic Transition- stage 1
• The first transition was from hunting-gathering to primary food production.
• http://www.youtube.com/watch?v=pRZYb2Jl22g

Epidemiologic Transition –stage 2
• The second epidemiological transition
• http://www.youtube.com/watch?v=jG1VNSCsP5Q Cholera
• http://www.youtube.com/watch?v=QgVchBERVng Tubeculosis

Epidemiologic Transition- stage 3

Epidemiologic Transition- stage 4

Epidemiologic Transition-stage 5POSSIBLE ?? Decline of NIR

Cholera in London, 1854
Fig. 2-23: By mapping the distribution of cholera cases and water pumps in Soho, London, Dr. John Snow identified the source of the water-borne epidemic.

Tuberculosis Death Rates
Fig. 2-24: The tuberculosis death rate is good indicator of a country’s ability to invest in health care. TB is still one of the world’s largest infectious disease killers.

HIV/AIDS Prevalence Rates, 2005
Fig. 2-26: The highest HIV infection rates are in sub-Saharan Africa. India and China have large numbers of cases, but lower infection rates at present.


Low Growth in DenmarkLow Growth in Denmark
Since the 1970s, with little population growth since then. Its 1970s, with little population growth since then. Its population pyramid shows increasing numbers of elderly population pyramid shows increasing numbers of elderly
and few children.and few children.


THE END


