18
Population Estimates October 2007 Orleans Parish and Metro Area
| Date post: | 14-Dec-2015 |
| Category: |
Documents |
| Upload: | fidel-rasor |
| View: | 229 times |
| Download: | 0 times |

Population Estimates October 2007
Orleans Parish and Metro Area
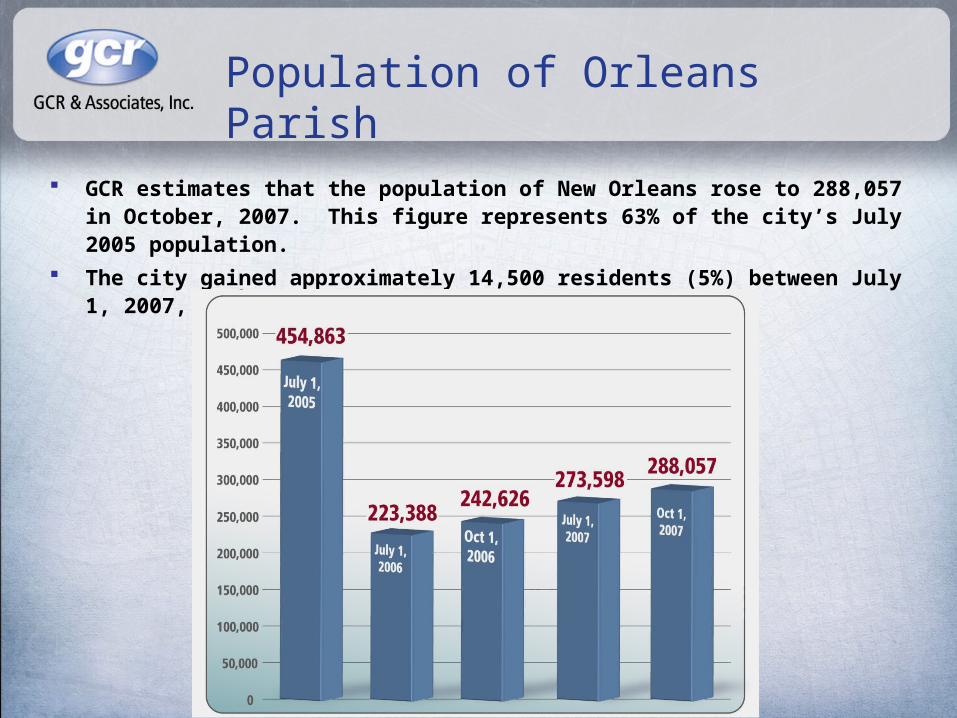
Population of Orleans Parish
GCR estimates that the population of New Orleans rose to 288,057 in October, 2007. This figure represents 63% of the city’s July 2005 population.
The city gained approximately 14,500 residents (5%) between July 1, 2007, and October, 2007.

Recovery of Population
The repopulation of the city has progressed steadily since Hurricane Katrina.
The rate at which residents are returning has yet to slow significantly; in fact, the last few months have seen an increase in that rate.

Population by ZIP Code
ZIP Code July 1, 2005 July 1, 2006 October 1, 2006 October 1, 2007 % of July 2005 Population Returned
Eastbank
70112 5,970 994 1,042 1,145 19%
70113 9,780 5,795 6,040 6,414 66%
70115 37,888 30,710 31,251 31,269 83%
70116 15,838 11,665 12,135 12,878 81%
70117 48,105 11,916 13,786 18,496 38%
70118 34,884 26,896 27,895 27,608 79%
70119 46,731 17,780 20,088 26,237 56%
70122 43,601 11,660 14,174 20,186 46%
70124 21,655 5,635 6,797 10,026 46%
70125 22,061 6,864 8,187 10,563 48%
70126 38,322 6,289 8,886 14,875 39%
70127 28,741 5,703 7,494 14,730 51%
70128 20,084 5,658 7,342 11,508 57%
70129 14,051 5,552 6,736 7,833 56%
70130 13,862 12,461 12,514 12,991 94%
Westbank
70114 26,769 29,330 29,535 30,591 114%
70131 26,521 28,480 28,723 30,707 116%
Total 454,863 223,388 242,626 288,057 63%
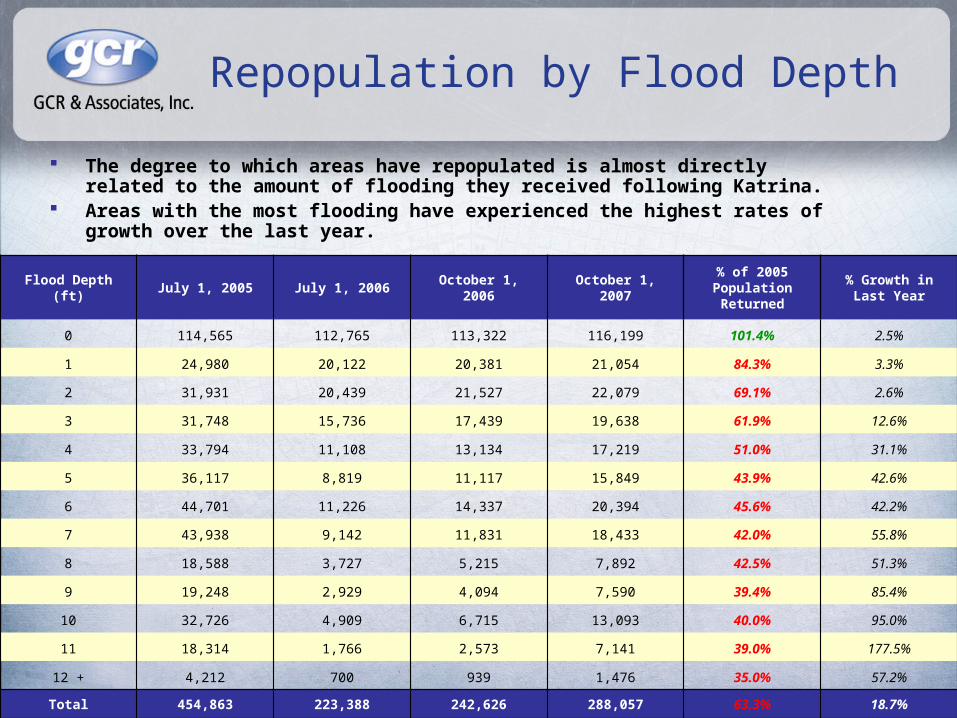
Repopulation by Flood Depth
The degree to which areas have repopulated is almost directly related to the amount of flooding they received following Katrina.
Areas with the most flooding have experienced the highest rates of growth over the last year.
Flood Depth (ft) July 1, 2005 July 1, 2006 October 1, 2006 October 1, 2007 % of 2005 Population Returned
% Growth in Last Year
0 114,565 112,765 113,322 116,199 101.4% 2.5%
1 24,980 20,122 20,381 21,054 84.3% 3.3%
2 31,931 20,439 21,527 22,079 69.1% 2.6%
3 31,748 15,736 17,439 19,638 61.9% 12.6%
4 33,794 11,108 13,134 17,219 51.0% 31.1%
5 36,117 8,819 11,117 15,849 43.9% 42.6%
6 44,701 11,226 14,337 20,394 45.6% 42.2%
7 43,938 9,142 11,831 18,433 42.0% 55.8%
8 18,588 3,727 5,215 7,892 42.5% 51.3%
9 19,248 2,929 4,094 7,590 39.4% 85.4%
10 32,726 4,909 6,715 13,093 40.0% 95.0%
11 18,314 1,766 2,573 7,141 39.0% 177.5%
12 + 4,212 700 939 1,476 35.0% 57.2%
Total 454,863 223,388 242,626 288,057 63.3% 18.7%
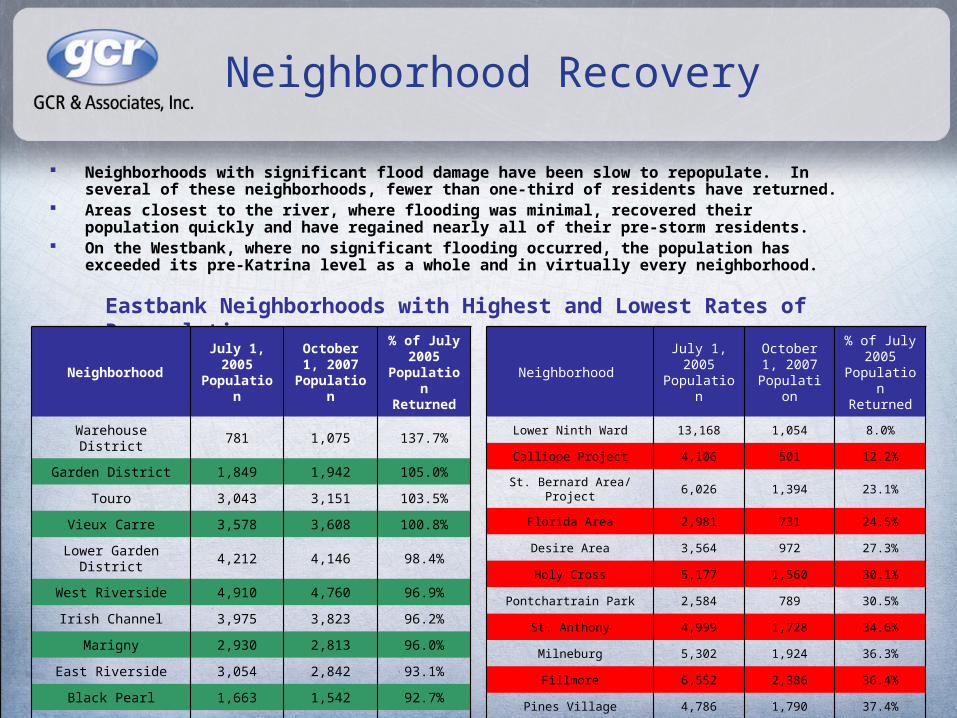
Neighborhood Recovery
Neighborhoods with significant flood damage have been slow to repopulate. In several of these neighborhoods, fewer than one-third of residents have returned.
Areas closest to the river, where flooding was minimal, recovered their population quickly and have regained nearly all of their pre-storm residents.
On the Westbank, where no significant flooding occurred, the population has exceeded its pre-Katrina level as a whole and in virtually every neighborhood.
Eastbank Neighborhoods with Highest and Lowest Rates of Repopulation
Neighborhood July 1, 2005 Population
October 1, 2007
Population
% of July 2005
Population Returned
Lower Ninth Ward 13,168 1,054 8.0%
Calliope Project 4,106 501 12.2%
St. Bernard Area/ Project 6,026 1,394 23.1%
Florida Area 2,981 731 24.5%
Desire Area 3,564 972 27.3%
Holy Cross 5,177 1,560 30.1%
Pontchartrain Park 2,584 789 30.5%
St. Anthony 4,999 1,728 34.6%
Milneburg 5,302 1,924 36.3%
Fillmore 6,552 2,386 36.4%
Pines Village 4,786 1,790 37.4%
Lakeview 16,603 6,311 38.0%
Neighborhood July 1, 2005 Population
October 1, 2007
Population
% of July 2005
Population Returned
Warehouse District 781 1,075 137.7%
Garden District 1,849 1,942 105.0%
Touro 3,043 3,151 103.5%
Vieux Carre 3,578 3,608 100.8%
Lower Garden District 4,212 4,146 98.4%
West Riverside 4,910 4,760 96.9%
Irish Channel 3,975 3,823 96.2%
Marigny 2,930 2,813 96.0%
East Riverside 3,054 2,842 93.1%
Black Pearl 1,663 1,542 92.7%
Uptown 6,270 5,792 92.4%
East Carrollton 4,165 3,824 91.8%
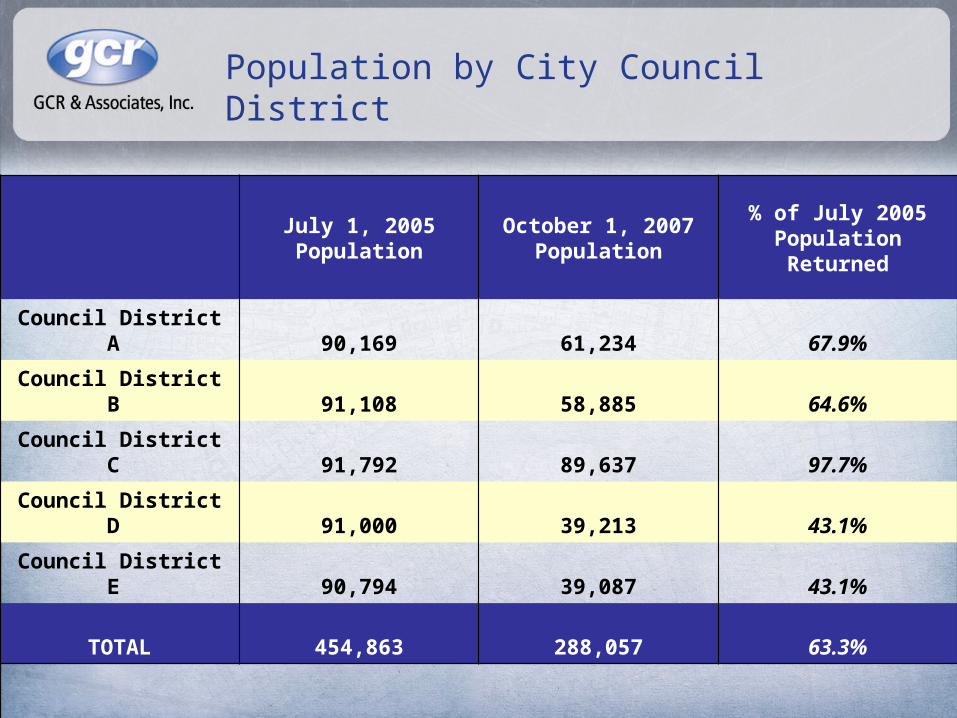
Population by City Council District
July 1, 2005 Population October 1, 2007 Population
% of July 2005 Population Returned
Council District A 90,169 61,234 67.9%
Council District B 91,108 58,885 64.6%
Council District C 91,792 89,637 97.7%
Council District D 91,000 39,213 43.1%
Council District E 90,794 39,087 43.1%
TOTAL 454,863 288,057 63.3%
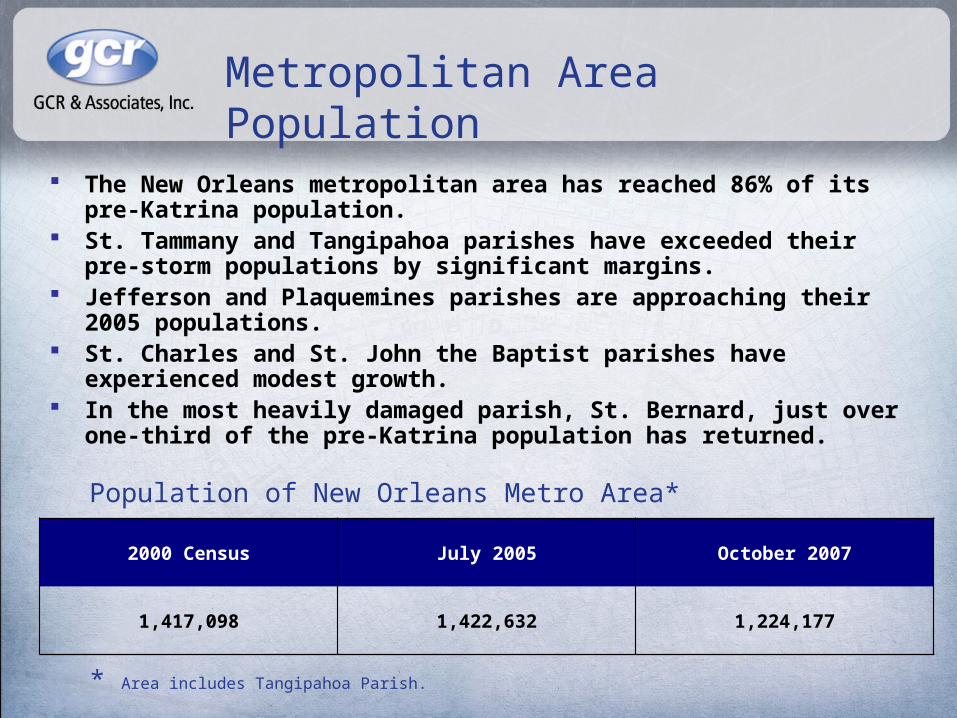
Metropolitan Area Population
The New Orleans metropolitan area has reached 86% of its pre-Katrina population.
St. Tammany and Tangipahoa parishes have exceeded their pre-storm populations by significant margins.
Jefferson and Plaquemines parishes are approaching their 2005 populations.
St. Charles and St. John the Baptist parishes have experienced modest growth.
In the most heavily damaged parish, St. Bernard, just over one-third of the pre-Katrina population has returned.
2000 Census July 2005 October 2007
1,417,098 1,422,632 1,224,177
Population of New Orleans Metro Area*
* Area includes Tangipahoa Parish.

Voting Patterns Confirm Population Trends
On October 20, 2007, approximately 76,000 New Orleanians voted in the gubernatorial primary election. This number represents about 56% of the number that voted in the same primary in fall 2003.
The discrepancy between this percentage and that of pre-storm residents that have returned (63%) can potentially be attributed to lower turnout statewide. Turnout in most other metro area parishes was lower in this past election than in 2003.
Fall 2003 Fall 2007 2007 as a Percentage of 2003
Orleans Parish 135,751 75,880 55.9%
Louisiana 1,407,962 1,297,943 92.2%
Votes Cast in Gubernatorial Primary Elections
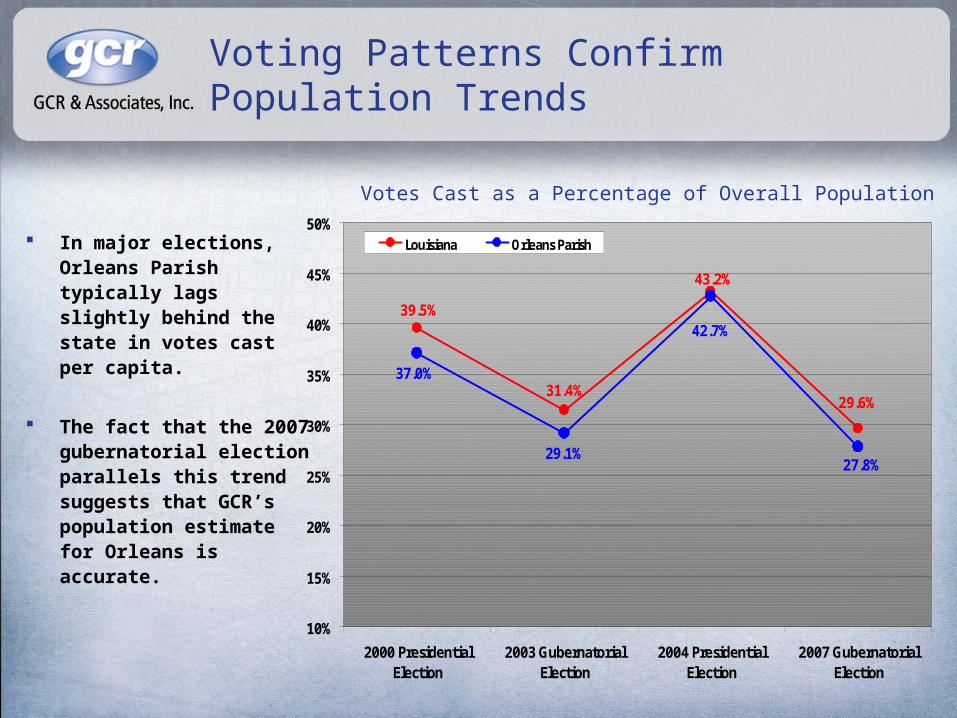
Voting Patterns Confirm Population Trends
In major elections, Orleans Parish typically lags slightly behind the state in votes cast per capita.
The fact that the 2007 gubernatorial election parallels this trend suggests that GCR’s population estimate for Orleans is accurate.
29.6%
43.2%
31.4%
39.5%
27.8%
42.7%
29.1%
37.0%
10%
15%
20%
25%
30%
35%
40%
45%
50%
2000 PresidentialElection
2003 GubernatorialElection
2004 PresidentialElection
2007 GubernatorialElection
Louisiana Orleans Parish
Votes Cast as a Percentage of Overall Population
Resettlement Patterns
GCR tracks activity in the city on a block-by-block basis; therefore, we have been able to monitor the pace at which each area of New Orleans has repopulated.
Soon after the storm, the population in areas with little or minimal flood damage returned rapidly.
Throughout the recovery period, proximity to repopulated areas has been a critical component to the recovery of damaged areas. The repopulation has radiated from largely unaffected areas into blocks and neighborhoods connected to these areas.
Accordingly, areas disconnected from largely recovered areas have been slow to regain their population. This condition is most acute in the Lower Ninth Ward and parts of Gentilly.
Snapshots of Recovery
The following five slides contain maps of the city at five dates: July 1, 2006; October 1, 2006; March 1, 2007; July 1, 2007; October 1, 2007. These maps demonstrate the trends described in the previous slides; namely, the fact that repopulation has radiated outward from areas which recovered quickly after the storm.
In each of these maps, red represents areas in which activity is less than 20% of its pre-Katrina level. Green represents areas in which activity is greater than 80% of its pre-Katrina level. Yellow and orange display areas in between.
Boundaries of New Orleans City Council Districts are also displayed.
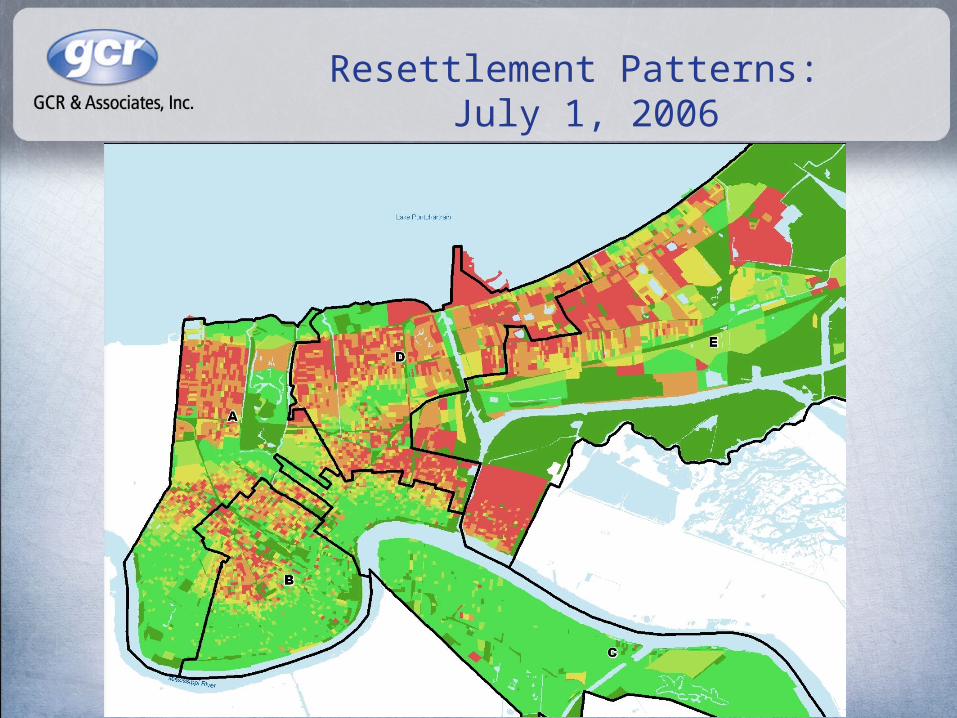
Resettlement Patterns: July 1, 2006
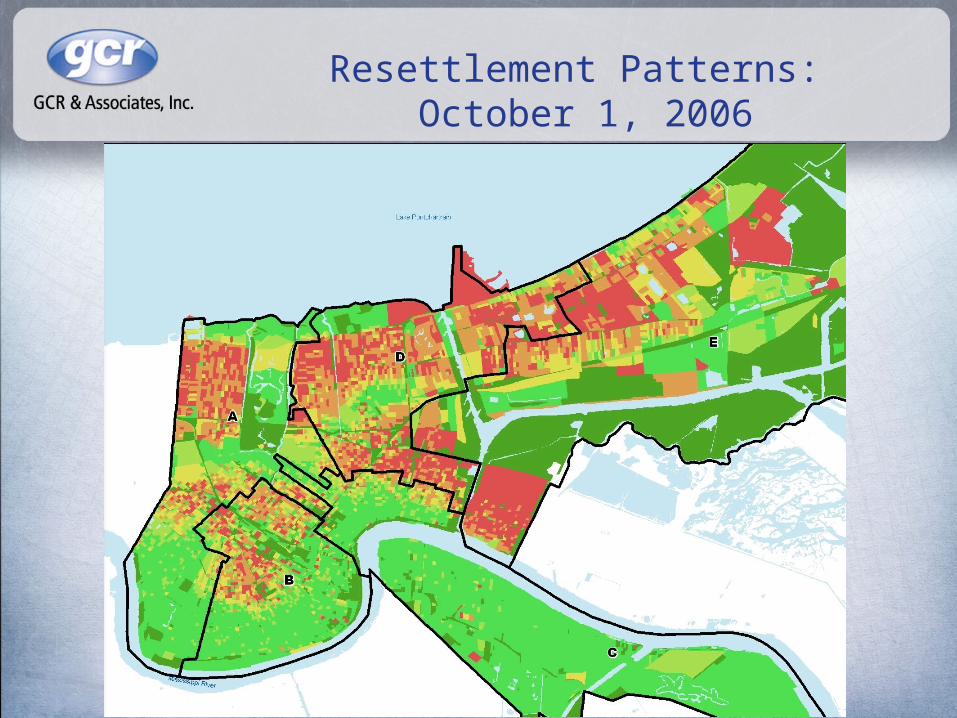
Resettlement Patterns: October 1, 2006
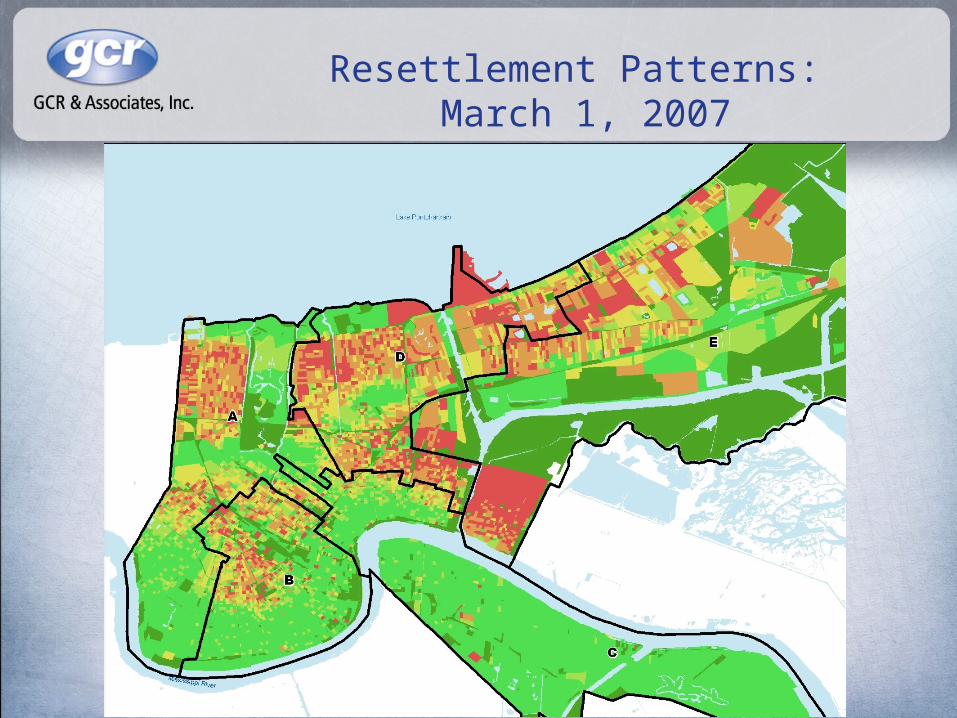
Resettlement Patterns: March 1, 2007
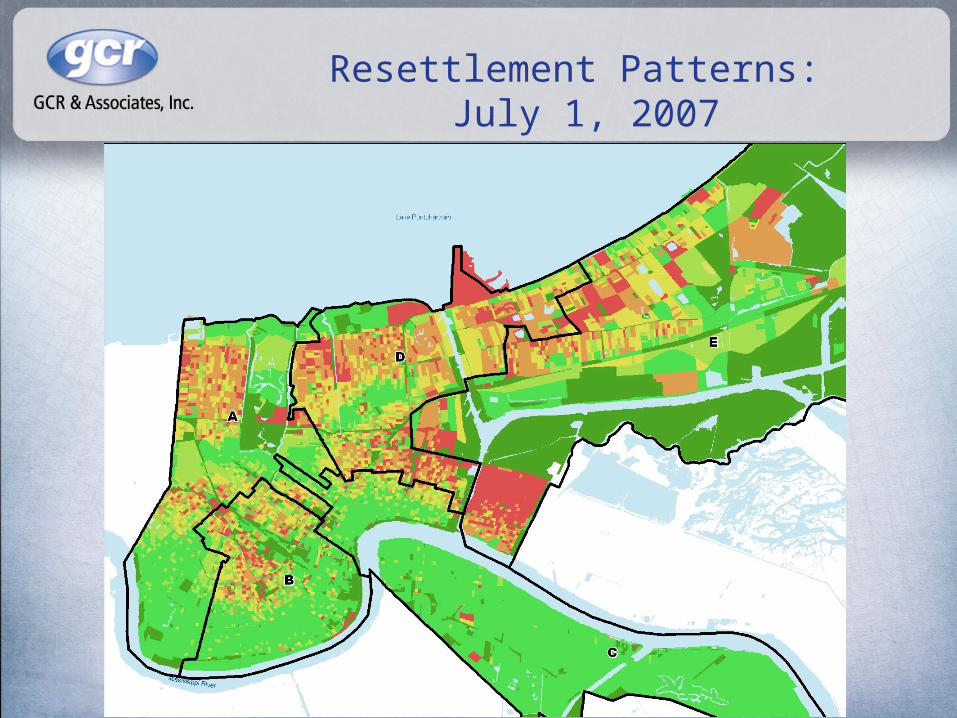
Resettlement Patterns: July 1, 2007
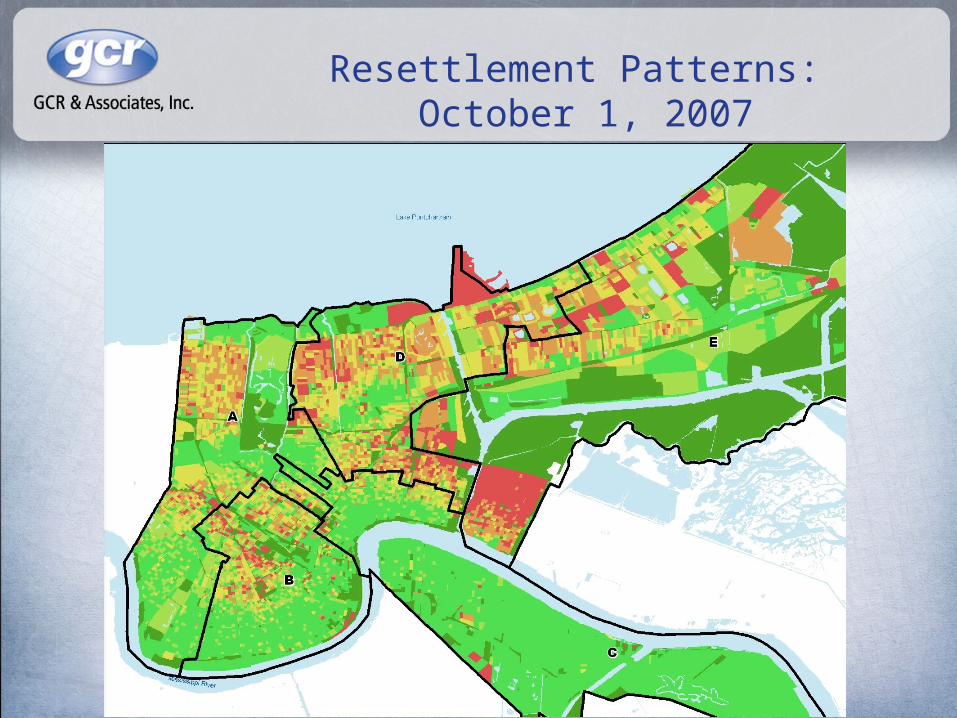
Resettlement Patterns: October 1, 2007

GCR & Associates, Inc.Gregory C. Rigamer
504.304.2500 800.259.6192 fax 504.304.2525
2021 Lakeshore Drive New Orleans, LA 70122UNO Research & Technology ParkAdvanced Technology Center


