Although the potential for genetic processesto directly contribute to the decline of rarespecies has been debated (Lande 1988, Gitzen-danner and Soltis 2000), thorough literaturereviews have shown that species that are rareor that occupy fragmented habitats tend todisplay lower genetic variation or heterozy-gosity than their common relatives (Cole 2003,Spielman et al. 2004). Whether low geneticvariation is a cause or a consequence of raritylikely varies between species. The most effec-tive conservation plans should account for the
level of genetic variation and differentiation,though the weight given to genetic criteria inthe plan should be determined on a case-by-case basis (Taylor and Dizon 1999). Examiningthe pattern of genetic diversity among popula-tions can provide insight into the demographicor ecological processes characteristic of thespecies (DeWoody et al. 2004).
The reproductive strategy and the dispersalmechanism of a plant species are 2 factors thatcan have a significant effect on the level of ge -netic differences observed among populations
POPULATION GENETICS OF NEVIUSIA CLIFTONII (SHASTA SNOW-WREATH):PATTERNS OF DIVERSITY IN A RARE ENDEMIC
Jennifer DeWoody1,4, Len Lindstrand III2, Valerie D. Hipkins1, and Julie Kierstead Nelson3
ABSTRACT.—Neviusia cliftonii (Rosaceae), the Shasta snow-wreath, is an endemic shrub found in the vicinity ofShasta Lake, Shasta County, California. First described 20 years ago, the species is of conservation concern due to itsrestricted range, a low number of known populations, and the potential impacts on or threats to many of these popula-tions. To assess the genetic structure of N. cliftonii, 21 of the 23 known populations were sampled for isozyme analysis.Genetic and multivariate analyses were used to assess levels of genet (genotypic) diversity, allelic variation, and popula-tion differentiation. When assessed at 17 loci, a total of 48 multilocus genotypes were identified in the collection of 410samples, indicating N. cliftonii is capable of significant vegetative reproduction. Five populations were composed of asingle genet each, with an average of 3.14 genets per population and a maximum of 15 genets in a single population.Allelic diversity was low, with a maximum of 3 alleles observed at one locus. Populations were differentiated, with 85%of the allele frequency variance distributed among populations. Multivariate analysis identified 3 clusters of geneticallysimilar populations: one cluster composed of 15 populations, a second cluster composed of 5 populations, and one popu-lation being distinct. Individuals from the distinct population displayed unique alleles at 2 loci (AAT-1 and AAT-2). Thedistribution of populations among clusters did not correspond to geographic (watershed) or substrate classifications,indicating that additional, unmeasured factors may influence the genetic structure of this species.
RESUMEN.—Neviusia cliftonii (Rosaceae), “Shasta snow-wreath,” es un arbusto endémico que se encuentra en lasinmediaciones del Lago Shasta, en el condado de Shasta en California. Se describió por primera vez hace veinte años yse considera una especie de preocupación por su conservación debido a su distribución restringida, la escasa cantidadde poblaciones conocidas y los posibles impactos o amenazas a muchas de estas poblaciones. Para evaluar la estructuragenética de N. cliftonii, se muestrearon 21 de las 23 poblaciones conocidas para un análisis de isoenzimas. Los análisisgenéticos y multivariados se utilizaron para evaluar los niveles de diversidad de genets (genotípica), la variación alélica yla diferenciación poblacional. Al evaluarse en 17 loci, se identificaron un total de 48 genotipos multilocus en la colecciónde 410 muestras, lo que indica que N. cliftonii es capaz de una reproducción vegetativa significativa. Cinco poblacionesestuvieron compuestas de un solo genet cada una, con un promedio de 3.14 genets por población y un máximo de 15genets en una sola población. La diversidad alélica fue baja, con un máximo de tres alelos observados en un locus. Laspoblaciones estuvieron diferenciadas, con 85% de la varianza en la frecuencia de alelos distribuida entre las poblaciones.Los análisis multivariados identificaron tres grupos de poblaciones genéticamente similares: un grupo compuesto de 15poblaciones, un segundo grupo compuesto de cinco poblaciones y una población marcadamente diferente. Los individ-uos de la población diferente mostraron alelos únicos en dos loci (AAT-1 y AAT-2). La distribución de las poblacionesentre los grupos no correspondió a las clasificaciones geográficas (cuencas) o de sustrato, lo que indica que factores adi-cionales y que no fueron medidos pueden influir en la estructura genética de esta especie.
1USDA Forest Service, National Forest Genetics Lab, 2480 Carson Road, Placerville, CA 95667.2North State Resources, Inc., 5000 Bechelli Lane, Redding, CA 96002.3USDA Forest Service, Shasta–Trinity National Forest, 3644 Avtech Parkway, Redding, CA 96002.4E-mail: [email protected]
457
(Hamrick and Godt 1996). Molecular markersmay provide confirmation of clonal reproduc-tion in populations, with individual plants (ra -mets) arising from a single genetic individual(genet) having the same molecular genotype.Previous studies of plant species capable ofboth sexual and clonal reproduction indicatethat vegetative spread is more likely in rareand endangered species, as well as in olderpopulations within species (Silvertown 2008).One possible consequence of vegetative repro -duction is a greater potential for populationsto be genetically distinct, as vegetatively repro -ducing species tend to have poor dispersalcapability (Ellstrand and Roose 1987, Silver-town 2008). Plants that have mechanisms forlong-distance dispersal via either pollen or seedtypically display lower levels of genetic differ-entiation between populations than those withlimited dispersal (Hamrick and Godt 1996).
In addition to elucidating demographic pro-cesses, the level and distribution of geneticvariation in a species may reflect the extent ofthat species’ range. Lower levels of geneticvariation are typically observed in rare andendemic species than in closely related taxahaving broader distributions (Cole 2003). Thisloss of genetic variation may result from higherlevels of genetic drift in narrowly distributedspecies, but levels of gene flow and geneticdifferentiation (e.g., FST) do not differ betweenrare and common congeners, indicating habi-tat limitation alone is not sufficient to explainthese trends (Cole 2003). In this sense, rarityshould not be confused with small populationsize, as species with limited ranges may existin large populations locally (Rabinowitz 1981,Kaye et al. 1997). Genetic variation is also af -fected by habitat fragmentation, which is asso-ciated with reduced population size and in -creased isolation, which in turn results indecreased gene flow. Genetic diversity is typi-cally lower in smaller or fragmented populationsand continues to decrease with time elapsedsince fragmentation occurred (Honnay andJacquemyn 2007, Aguilar et al. 2008).
Neviusia cliftonii Shevock, Ertter & D.W.Taylor (Rosaceae), the Shasta snow-wreath, wasdescribed as the second member of the genusfrom a collection made near Redding, Califor-nia (Shevock et al. 1992). Before the descriptionof N. cliftonii, the only species in the genuswas Neviusia alabamensis A. Gray, which occursin the southern Appalachian Mountains and
west into the Ozark Plateau (Freiley 1994).While both species are deciduous shrubs havingflowers distinguished by showy stamens, N.cliftonii occasionally has one or more re duced,deciduous petals at the base of the flower, whileN. alabamensis always lacks petals (Shevock etal. 1992). A genetic report of N. alabamensispopulations from Arkansas, the western edge ofthe species range, described a single geneticindividual per population, indicating that repro-duction in this genus may be primarily vegeta-tive (Freiley 1994). Neviusia cliftonii is restrictedto watersheds near Shasta Lake, the largestreservoir in California, created by constructionof Shasta Dam, which flooded portions of theSacramento, McCloud, and Pit rivers in 1945.Populations are most often found in riparianzones within montane hardwood-conifer forests(Lindstrand and Nelson 2005). Local populationsrange in size from <20 to >1000 indi vi dualshrubs, indicating that though this species isglobally restricted, it can be locally common.Both species of Neviu sia are considered relictspecies descended from a formerly widespreadgenus, with fossil evidence from southern Bri t-ish Columbia supporting the ancient origin ofthe genus (DeVore et al. 2004). The descriptionof this relict spe cies in the Shasta Lake regionfurther supports the view that the unique bio-diversity of the area results from the ancientgeology and lack of glacial or volcanic activityin the area (Lindstrand and Nelson 2006).
Initial species accounts and taxonomic keysdescribed N. cliftonii as a limestone endemic,since the initial populations found were asso-ciated with limestone outcrops (Lindstrand andNelson 2006). Subsequent searches have locatedpopulations on a variety of substrates derivedfrom metamorphic and igneous formations, suchthat currently 57% of populations are not asso-ciated with limestone formations (L. LindstrandIII, personal observation). However, given theinitial description of the species as a limestoneendemic (Shevock et al. 1992), testing for gene-tic differences between populations occurring onlimestone and nonlimestone soils is warrantedin order to best inform conservation efforts.
Most of the 23 known populations of Shastasnow-wreath are located on National Forestlands managed by the Shasta–Trinity NationalForest. Conservation of the species is a priorityfor the agency, which manages snow-wreathunder its sensitive species program. Many of theknown populations face current or potential
458 WESTERN NORTH AMERICAN NATURALIST [Volume 72
anthropogenic impacts. Over one-half of theknown populations reach their lower limit atthe edge of Shasta Lake, leading to the logicalconclusion that some populations were inun-dated by the rising waters of Shasta Lake in1945 (Lindstrand and Nelson 2006). Perhapsbefore that event, Shasta snow-wreath popula-tions were connected by the riparian zones ofthe Sacramento, McCloud, and Pit rivers andtheir tributaries. The addition of genetic datafrom this and other studies may improve effortsto design germplasm collection and reestab-lishment plans.
This study of 21 populations assayed 17 iso -zyme loci to address 3 questions. First, howmany genetic individuals compose each popu-lation? Second, how is genetic diversity dis-tributed within and among populations? Third,do patterns of genetic diversity or genetic simi -larity among populations correspond to geo-graphic or ecological factors?
METHODS
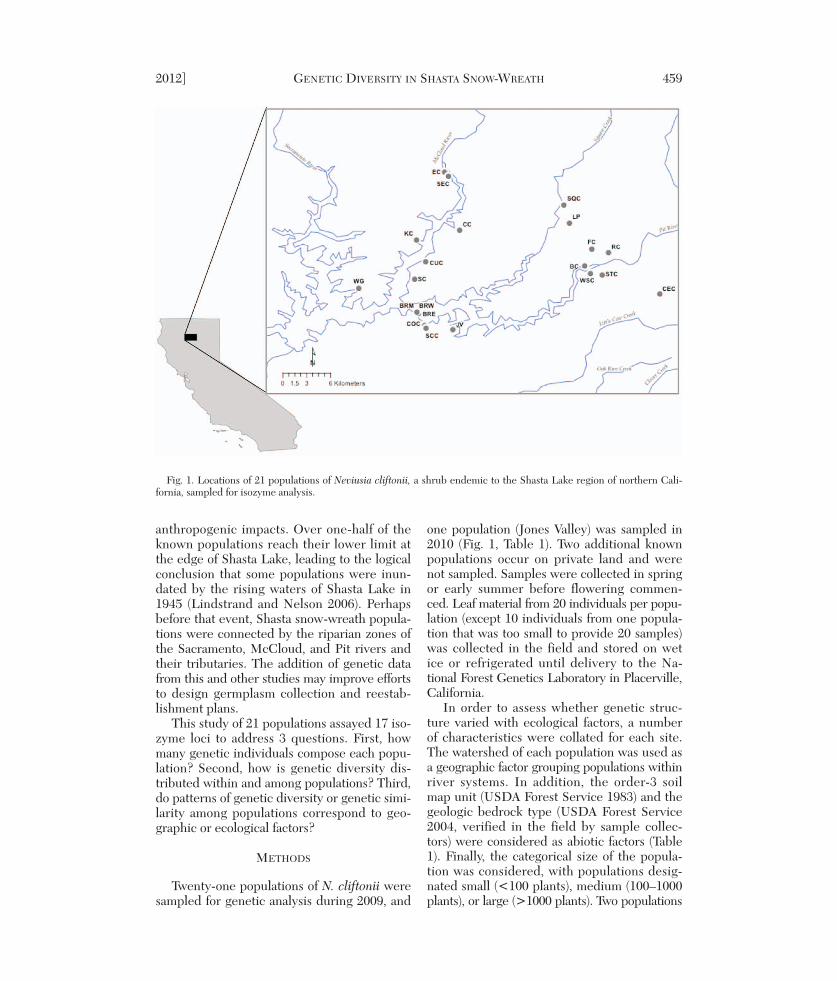
Twenty-one populations of N. cliftonii weresampled for genetic analysis during 2009, and
one population (Jones Valley) was sampled in2010 (Fig. 1, Table 1). Two additional knownpopulations occur on private land and werenot sampled. Samples were collected in springor early summer before flowering commen -ced. Leaf material from 20 individuals per popu -lation (except 10 individuals from one popula-tion that was too small to provide 20 samples)was collected in the field and stored on wetice or refrigerated until delivery to the Na -tional Forest Genetics Laboratory in Placerville,California.
In order to assess whether genetic struc-ture varied with ecological factors, a numberof characteristics were collated for each site.The watershed of each population was used asa geographic factor grouping populations withinriver systems. In addition, the order-3 soilmap unit (USDA Forest Service 1983) and thegeologic bedrock type (USDA Forest Service2004, verified in the field by sample collec-tors) were considered as abiotic factors (Table1). Finally, the categorical size of the popula-tion was considered, with populations desig-nated small (<100 plants), medium (100–1000plants), or large (>1000 plants). Two populations
2012] GENETIC DIVERSITY IN SHASTA SNOW-WREATH 459
Fig. 1. Locations of 21 populations of Neviusia cliftonii, a shrub endemic to the Shasta Lake region of northern Cali-fornia, sampled for isozyme analysis.
460 WESTERN NORTH AMERICAN NATURALIST [Volume 72
TAB
LE
1. L
ocat
ion
and
subs
trat
e de
tails
of 2
1 po
pula
tions
of N
eviu
sia
clift
onii
sam
pled
for
isoz
yme
anal
ysis
.
Popu
latio
nA
bbre
v.W
ater
shed
Ord
er 3
soi
l typ
eG
eolo
gic
soil
type
Lat
itude
aL
ongi
tude
aN
Blu
e R
idge
Eas
tB
RE
Pit R
iver
105,
Hol
land
fam
ily–H
olla
ndSh
ale;
silt
ston
e; m
etav
olca
nic;
40.7
5747
°12
2.27
665°
20fa
mily
, dee
p co
mpl
ex,
w/ l
imes
tone
; & u
ndiff
.40
%–6
0% s
lope
sB
lue
Rid
ge M
idB
RM
Pit R
iver
105,
Hol
land
fam
ily–H
olla
ndSh
ale;
silt
ston
e; m
etav
olca
nic;
40.7
6011
°12
2.27
835°
10fa
mily
, dee
p co
mpl
ex,
w/ l
imes
tone
; & u
ndiff
.40
%–6
0% s
lope
sB
lue
Rid
ge W
est
BR
WPi
t Riv
er10
5, H
olla
nd fa
mily
–Hol
land
Shal
e; s
iltst
one;
met
avol
cani
c;40
.759
4°12
2.27
837°
20fa
mily
, dee
p co
mpl
ex,
w/ l
imes
tone
; & u
ndiff
.40
%–6
0% s
lope
sB
rock
Cre
ekB
CPi
t Riv
er17
9, M
arpa
–Gou
ldin
g fa
mili
esL
imes
tone
; thi
n-be
dded
to m
assi
ve;
40.8
1136
°12
2.08
837°
20as
soci
atio
n, 2
0%–4
0% s
lope
sgr
ay; f
ossi
lifer
ous
Cam
pbel
l Cre
ekC
CM
cClo
ud R
iver
102,
Hol
land
–Gou
ldin
g fa
mili
esTu
fface
ous
mud
ston
e w
/ les
ser
40.8
522°
122.
2298
7°20
asso
ciat
ion,
40%
–60%
slo
pes
maf
ic fl
ows;
san
dsto
ne; c
hert
yqu
artz
ite; o
ther
ms;
& u
ndiff
.C
edar
Cre
ekC
EC
Cow
Cre
ek25
0, R
ock
outc
rop,
lim
esto
neL
imes
tone
; thi
n-be
dded
to m
assi
ve;
40.7
799°
122.
0032
3°20
gray
; fos
silif
erou
sC
ove
Cre
ek, S
ite 1
CO
CPi
t Riv
er17
8, M
arpa
–Gou
ldin
g fa
mili
esM
eta-
ande
site
(qua
rtz
kera
toph
yre)
; 40
.744
39°
122.
2694
6°20
asso
ciat
ion,
20%
–40%
slo
pes
met
a-da
cite
; por
phyr
itic
& n
on-
maf
ic fl
ows;
& u
ndiff
.C
url C
reek
CU
CM
cClo
ud R
iver
105,
Hol
land
fam
ily–H
olla
ndG
reen
ston
e &
gre
enst
one
brec
cia
40.8
159°
122.
2683
9°20
fam
ily, d
eep
com
plex
,40
%–6
0% s
lope
sE
llery
Cre
ekE
CM
cClo
ud R
iver
250,
Roc
k ou
tcro
p, li
mes
tone
.L
imes
tone
40.9
1775
°12
2.24
689°
20F
lat C
reek
FC
Pit R
iver
180,
Mar
pa–G
ould
ing
fam
ilies
And
esiti
c vo
lcan
icla
stic
& p
yroc
last
ic40
.830
46°
122.
0800
8°20
asso
ciat
ion,
60%
–80%
slo
pes
rock
s; c
ongl
omer
ate;
& u
ndiff
.Jo
nes
Valle
yJV
Pit R
iver
182,
Mar
pa–H
olla
nd, d
eep
Shal
e; s
iltst
one;
met
avol
cani
c;
40.7
397°
122.
2376
5°20
fam
ilies
com
plex
,w
/ lim
esto
ne; &
und
iff.
20%
–40%
slo
pes
Kel
uche
Cre
ekK
CM
cClo
ud R
iver
105,
Hol
land
fam
ily–H
olla
nd
Met
a-py
rocl
astic
&40
.840
88°
122.
2786
4°20
fam
ily, d
eep
com
plex
,ke
rato
phyr
e; &
und
iff.
40%
–60%
slo
pes
Low
Pas
sL
PSq
uaw
Cre
ek25
0, R
ock
outc
rop,
lim
esto
neL
imes
tone
; thi
n-be
dded
to m
assi
ve;
40.8
6021
°12
2.10
569°
20gr
ay; f
ossi
lifer
ous
Rip
gut C
reek
RC
Pit R
iver
180,
Mar
pa–G
ould
ing
fam
ilies
And
esiti
c vo
lcan
icla
stic
& p
yroc
last
ic40
.826
19°
122.
0613
7°20
asso
ciat
ion,
60%
–80%
slo
pes
rock
s; c
ongl
omer
ate;
& u
ndiff
.Sh
asta
Cav
erns
SCM
cClo
ud R
iver
82, G
ould
ing–
Hol
land
fam
ilies
Gre
enst
one
& g
reen
ston
e br
ecci
a40
.796
63°
122.
2809
7°20
asso
ciat
ion,
40%
–60%
slo
pes
Sout
h of
Cov
e C
reek
SCC
Pit R
iver
178,
Mar
pa–G
ould
ing
fam
ilies
Shal
e; s
iltst
one;
met
avol
cani
c;40
.740
97°
122.
2680
7°20
asso
ciat
ion,
20%
–40%
slo
pes
w/ l
imes
tone
; & u
ndiff
.
were designated small (BRM and SC), 6 popu-lations medium (BRE, BC, JV, KC, RC, andSCC), and the remaining populations large.
Isozyme Analysis
Leaf tissue (about 40 mg per sample) wassubmerged in extraction buffer (Cheliak andPitel 1984) and frozen at –80 °C until elec-trophoresis. On the morning of the electropho -retic run, samples were thawed, macerated,and absorbed onto paper wicks 3 mm wide.
Starch gel (11% w/v) electrophoresis usingstain recipes adapted from Wendel and Wee-den (1989) revealed 17 loci in 3 buffer systems(Conkle et al. 1982). Four loci were resolved ina lithium borate electrode buffer–tris citrategel buffer combination (system LB): aconitatehydratase (ACO; EC 4.2.1.3), leucine amino -peptidase (LAP; EC 3.4.11.1), phosphogluco-mutase (PGM; EC 5.4.22), and malic enzyme(ME; EC 1.1.1.40). Seven loci were resolvedin a sodium borate electrode buffer–tris citrategel buffer combination (system SB): phospho-glucose isomerase (PGI1 and PGI2; EC 5.3.1.9),aspartate aminotransferase (AAT1 and AAT2;EC 2.6.1.1), uridine diphosphoglucose pyro -phosphorylase (UGPP; EC 2.7.7.9), and triose-phosphate isomerase (TPI1 and TPI2; EC5.3.1.1). Six loci were resolved in a morpho-line citrate electrode and gel buffer, pH 6.1(system MC6): phosphogluconate dehydroge-nase (6PGD1 and 6PGD2; EC 1.1.1.44), isocit-rate dehydrogenase (IDH; EC 1.1.1.42), shiki -mic acid dehydrogenase (SKD; EC 1.1.1.25),and malate dehydrogenase (MDH1 and MDH3;EC 1.1.1.37).
Data Analysis
Genetic individuals (genets) represented bymore than one sample (ramet) were identifiedusing the Multilocus Matches function of Gen -AlEx v6.0 (Peakall and Smouse 2006). In orderto minimize misclassification of samples as thesame genet, missing data were considered suf-ficient to reject identity (see Results). The per-cent polymorphic loci (P), mean alleles perlocus (A), observed heterozygosity (Ho), and,when multiple genets were identified in apopulation, the fixation index (F) were esti-mated for each locus using GenAlEx v6.0 (Pea-kall and Smouse 2006).
To describe the relative genetic differencebetween pairs of populations, Nei’s (1972) gene -tic distance and genetic identity were estimated
2012] GENETIC DIVERSITY IN SHASTA SNOW-WREATH 461
TAB
LE
1. C
ontin
ued.
Popu
latio
nA
bbre
v.W
ater
shed
Ord
er 3
soi
l typ
eG
eolo
gic
soil
type
Lat
itude
aL
ongi
tude
aN
Sout
h of
Elle
ry C
reek
SEC
McC
loud
Riv
er10
5, H
olla
nd fa
mily
–Hol
land
Qua
rtz
dior
ite; a
lbite
- tw
o py
roxe
ne40
.913
23°
122.
2426
8°20
fam
ily, d
eep
com
plex
,qd
; maf
ic q
d; d
iori
te40
%–6
0% s
lope
sSq
uaw
Cre
ekSQ
CSq
uaw
Cre
ek22
2, N
euns
fam
ily–N
euns
Lim
esto
ne; t
hin-
bedd
ed to
mas
sive
;40
.880
52°
122.
1118
6°20
fam
ily, d
eep
com
plex
,gr
ay; f
ossi
lifer
ous
60%
–80%
slo
pes
Stei
n C
reek
STC
Pit R
iver
204,
Neu
ns fa
mily
,A
ndes
itic
volc
anic
last
ic &
pyr
ocla
stic
40.8
0109
°12
2.06
846°
2060
%–8
0% s
lope
sro
cks;
con
glom
erat
e; &
und
iff.
Wat
ers
Gul
chW
GSa
cram
ento
Riv
er11
7, H
olla
nd fa
mily
,G
reen
ston
e; &
und
iff.
40.7
8586
°12
2.34
406°
20de
ep, 4
0%–6
0% s
lope
sW
est o
f Ste
in C
reek
WSC
Pit R
iver
120,
Hol
land
fam
ily, d
eep–
Shal
e; s
iltst
one;
met
avol
cani
c;40
.802
94°
122.
0818
°20
Hol
land
fam
ily c
ompl
ex,
w/ l
imes
tone
; & u
ndiff
.40
%–6
0% s
lope
sa L
atitu
de a
nd lo
ngitu
de p
rovi
ded
in d
d.dd
ddd
follo
win
g N
AD
27.
using GenAlEx v6.0 (Peakall and Smouse 2006).In order to describe the overall differences orsimilarities between populations, a multivari-ate analysis was conducted. A principle coor-dinates analysis (PCoA) was conducted inGenAlEx v6.0 (Peakall and Smouse 2006)based on the standardized covariance matrixderived from Nei’s genetic distance, which isbuilt over 999 permutations. The PCoA plotsrepresent the maximized but uncorrelated(orthogonal) differences between all individu-als, providing a visual depiction of geneticsimilarity in 2 dimensions.
Isolation by distance was assessed usingMantel tests over the matrices of Nei’s (1972)genetic distance and the geographic distancebe tween populations. Significance was as -sessed from 999 permutations of the data inorder to identify the distribution of the randomassocia tion between genetic and geographicdistance.
The putative phylogenetic relationship be -tween populations was assessed with a popula-tion phenogram built from the matrix of Nei’s(1972) genetic distance. The unrooted pheno -gram was built using neighbor-joining meth-ods and significant topologies (branches) de -termined from 1000 bootstrap replications. Theconsensus tree was built using the extendedmajority rule methods as employed by Phylip(Felsenstein 1989). Due to null data at 2 loci(ACO and SKD) in some populations, theseloci were dropped from the consensus pheno -gram. In order to compare the impact of re -moving these data, the topology of both theconsensus tree (the statistically more robustversion) and the raw population phenogramwere inspected.
To assess differences in genet diversityamong populations of N. cliftonii, an analysisof variance (ANOVA) was performed to assessvariation in the number of genets observed ineach population among watersheds, soil types,and population size. Due to the fine scale ofthe order-3 soil classification, several classeshad limited replication. In order to minimizethe effects of the low replication, the order-3soil types were grouped into 3 family classes:the Holland–Goulding–Marpa class, the Neunsfamily class, and the limestone class. Boxplotswere used to visualize any patterns among thenumber of genets and ecological grouping.ANOVA and boxplot analyses were conductedin the statistical program R v 2.10.0 (R Project
for Statistical Computing). To describe thegenetic differentiation among populationsgrouped by ecological variables, analysis ofmolecular variance (AMOVA) was conductedon allele frequencies. First, all populationswere analyzed without higher-order grouping.Second, populations were grouped accordingto watershed and soil type (Table 1) in 2 sepa-rate analyses. Third, populations were classi-fied according to the clusters identified by thePCoA. The variance associated with popula-tions within each group and among groupswas estimated using the AMOVA function inGenAlEx v6.0 (Peakall and Smouse 2006).
RESULTS
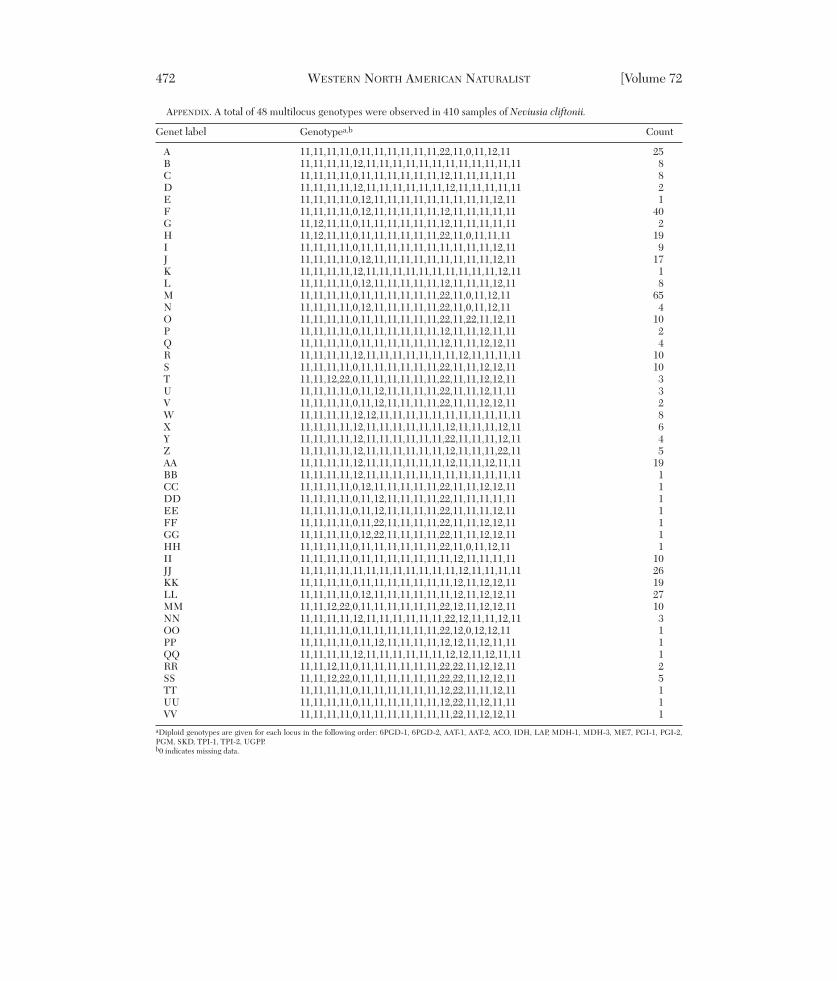
Low levels of genotypic diversity were re -solved at the 17 isozyme loci assessed in N.cliftonii. A total of 48 unique multilocus geno-types were observed in the collection of 410samples (Table 2, Appendix). A single geneticindividual was observed in 5 populations (Table2), with a maximum of 15 genets observed atone site (STC). An average of 3.14 (SE = 0.66)genets were observed per population, with themedian and mode values of the distributionequal to 2 genets per population.
Similarly low levels of allelic diversity wereobserved in N. cliftonii. Eleven loci (64.7%)were polymorphic, while 6 loci had only a sin-gle isoform. Due to the low level of diversityobserved within populations, allelic diver-sity was assessed over loci for the entire col-lection (Table 3). A maximum of 3 alleles wereobserved at a single locus (6PGD-2). Whenmultiple genets were observed in a population,the fixation indices tended to be negative, in -dicating low levels of homozygosity relative tothe Hardy–Weinberg equilibrium (Table 3). Theoverall negative fixation index (F = –0.300)indicates the allelic variants tend to occur in aheterozygous state.
Consistent with the low level of allelic varia -tion observed in the collection of N. cliftonii,measures of genetic identity were relativelyhigh and genetic distance low between popu-lations (Table 4). Multivariate analysis of thegenetic distances using PCoA revealed struc-ture among populations. The first 2 principalcoordinate axes accounted for a total of 70% ofthe variance among populations and groupedthe collections into 3 distinct clusters (Fig. 2).In particular, the majority of populations
462 WESTERN NORTH AMERICAN NATURALIST [Volume 72
2012] GENETIC DIVERSITY IN SHASTA SNOW-WREATH 463
TABLE 2. Genotypic diversity observed in populationsof Neviusia cliftonii as estimated by isozyme analysis.
No. Genet No.Populationa genets G/N label samples
BC 3 0.15 M 15N 4OO 1
BRE 1 0.05 M 20BRM 1 0.1 II 10BRW 1 0.05 A 20CC 2 0.1 KK 16
formed one cluster, 5 populations formed asecond cluster (BC, BRE, KC, SC, and WSC),and one population was distinct along the sec-ond axis (CUC). Examination of watershed,order-3 soil type, and geologic type (followingTable 1) did not reveal any patterning to thesegroups, indicating that either the genetic diver-sity does not vary according to these factors orisozyme variation is insufficient to resolve cor-related differences between populations.
Tests of isolation by distance revealed anatypical pattern of geographic differentiationamong populations of N. cliftonii. Mantel testsrevealed a small but significant negative corre-lation between geographic and genetic dis-tance between pairs of populations (R =–0.134, P = 0.014). This pattern indicates thatgene flow does not decrease as a function ofgeographic distance. While significant, this cor -relation explained only a small portion of theoverall variance (R2 = 0.018).
The unrooted population phenogram builtfrom the raw data varied slightly in topologyfrom the consensus tree, indicating the locidropped from the consensus phenogram (ACOand SKD) may provide distinguishing infor-mation. The consensus topology lacked statis-tical support, as only 2 branches were ob -served in more than 50% of the bootstrap rep -licates (Fig. 3). The consensus phenogram(Fig. 3A) grouped 4 of the 5 populations fromthe PCoA cluster 2, indicating the relationship
among these populations is likely robust. Theraw data phenogram (Fig. 3B) resolved similarstructure to the PCoA, as the populations form-ing cluster 2 were monophyletic.
The number of genets per population did notvary as a function of watershed or geologic soilclassification, but did vary by order-3 soil type(Table 5). Visual inspection of the variation ingenet number by soil type reveals that thegreatest number of genets per population wereobserved on the Neuns family soil (category204), the limestone containing soil (category 250),and soils classified in the Marpa–Goulding fami-lies (categories 178, 179, 180) (Fig. 4). Althoughthese differences were significant (F11, 9 =6.99, P = 0.003), the analysis was driven bythe outlier category 204 (population STC). Whencategory 204 was omitted from the ANOVA,the association was nonsignificant (F10, 9 =0.82, P = 0.621). When the order-3 soil typeswere grouped into family classes, no signifi-cant relationship was found between soil familyand genet diversity (F1, 19 = 2.70, P = 0.117).In addition, the genet diversity did not varywith population size class (small, medium orlarge) (F2, 18 = 1.27, P = 0.305), althoughsmaller populations tended to contain fewergenets than larger ones (Fig. 4).
Assessment of hierarchical AMOVA revealedhigh levels of allele frequency variance amongpopulations of N. cliftonii, but low levelsamong individuals and ecological groupings
464 WESTERN NORTH AMERICAN NATURALIST [Volume 72
TABLE 4. Genetic difference and similarity was quantified for all pairs of populations using Nei’s (1972) genetic distance
Fig. 2. Principle coordinate analysis revealed genetic differences between populations of Neviusia cliftonii that do notcorrespond to differences in order-3 soil type (symbol color) or watershed (symbol shape). Points represent populationmeans, labeled by abbreviations given in Table 1. The percentage of genetic variance among individuals explained byeach coordinate is provided on each axis.
(Fig. 5). Analysis of ungrouped populationsrevealed that 85% of the variance occurredamong populations. When populations were
grouped into watersheds, 82% of the variancewas observed among populations within wa -ter sheds, while only 3% of the variance waspartitioned among watersheds. When popula-tions were grouped according to order-3 soiltype, 75% of the variance was partitionedamong populations within soil type, while 10%of the variance was attributed among soiltypes. When populations were grouped bygeologic type, 85% of the variance was parti-tioned among populations within geologictype, and no variance was observed amonggeologic soil types. These results indicate thegreatest ge netic difference occurred betweenpopulations, with moderate levels of differen-tiation corresponding to order-3 soil type.Given the low level of allelic variationobserved in this collection, these results indi-cate that the rare alternate alleles are notevenly distributed across populations. Whenthe AMOVA was re peated with populationsgrouped into the PCoA clusters, 11% of thevariance was partitioned among individuals,
466 WESTERN NORTH AMERICAN NATURALIST [Volume 72
Fig. 3. Population phenograms of Neviusia cliftonii were poorly resolved. (A) The unrooted consensus phenogrambuilt from 15 loci using the extended majority rule. Numbers indicate bootstrap support for that node out of 1000 repli-cates. (B) The unrooted phenogram built from the distance matrix based on 17 loci, with multiple populations lackingdata at 2 loci. Due to missing data, bootstrap analysis was not conducted on the full data set. Populations that groupedinto PCoA clusters 2 and 3 are indicated.
TABLE 5. The number of genets per population variedas a function of soil type but not with watershed or geo-graphic soil type classifications.
Population sizeFactor 2 11.41 1.27 0.305Residuals 18 8.99
aThe limestone class is dropped from this analysis, as only one order 3 soil classcontributed to the higher-order family class (no. 250).
29% among populations within clusters, and60% among clusters, indicating the greatest ge -netic differentiation oc curred between these 3groups.
DISCUSSION
Low Overall Genetic Diversityin this Endemic Species
This survey of isozyme variation in the rareendemic Neviusia cliftonii revealed low levelsof allelic and genotypic diversity. The lack ofvariation within many populations (only one or2 genets identified in 57% of populations sam-pled) is consistent with regular vegetative re -
production of this woody species. The genetdiversity is greater than that reported for thesole congener, N. alabamensis, which con-tained only one genotype per population at itsmarginal range (Freiley 1994). The low levelsof allelic variation may be a consequence ofthe narrow range occupied by N. cliftonii, or itmay be due to historic population bottlenecks.For instance, the Shasta Lake area is known asan ancient landscape, a glacial and volcanicrefuge, with high numbers of endemic species(Lindstrand and Nelson 2006). The low allelicvariation may be a consequence of the narrow-ing of the N. cliftonii range during the mostrecent glacial maximum and subsequent cli-mate variations (Lindstrand and Nelson 2006).Alternatively, the low variation may reflect amore recent bottleneck resulting from ShastaDam and Shasta Lake. The construction of thedam likely increased fragmentation and de -creased the size of some populations, whichtogether can change the genetic structure ofpopulations (Honnay and Jacquemyn 2007,Aguilar et al. 2008). The low levels of geno-typic variation within populations preventedstatistical analysis for genetic signatures of
2012] GENETIC DIVERSITY IN SHASTA SNOW-WREATH 467
Fig. 4. Variation in the number of genets per populationas a function of (A) the order-3 soil type and (B) popula-tion size. Each box represents the range of values ob -served at each category, with the black bar indicating themedian value. Categories represented by a single popula-tion or number of genets are depicted by a single black bar.
Fig. 5. Analysis of molecular variance revealed geneticvariation to be greatest among populations when theywere classified by (A) watershed, (B) order-3 soil type, and(C) geologic soil type. (D) When populations weregrouped according to the PCoA results, differentiationwas greatest among clusters.
popu lation bottlenecks (sensu Cornuet andLuikart 1996).
Much effort has been spent comparing thelevels of genetic variation and differentiationin rare species compared to common taxa. In amajor review of isozyme variation in plantspecies, Hamrick and Godt (1996) comparedlevels of genetic diversity and differentiationamong species grouped by life history traits.For example, the size of a species’ range wasassociated with differences in genetic varia-tion and differentiation, with endemic speciesdisplaying lower variation and slightly greaterdifferentiation than species with more wide-spread occurrences.
Other authors have suggested that a morerobust approach comes from comparing levelsof genetic variation in a rare species to thosein congeners rather than unrelated taxa (Kar-ron 1987, Gitzendanner and Soltis 2000). Inthese cases, levels of variation were correlatedwithin genera, indicating that phylogenetichistory contributed to levels of diversity inplant species (Gitzendanner and Soltis 2000).However, even when such phylogenetic com-parisons are conducted, rare species tend todisplay lower levels of genetic variation thanwidespread congeners (Gitzendanner and Sol -tis 2000), particularly when the species are as -sessed in the same lab, thus controlling fortechnical variance (Karron 1987).
These metrics provide a context for inter-pretation of the N. cliftonii data. While themating system and lifespan of N. cliftonii indi-viduals have not been determined, the highfrequency of putative multiramet clones indi-cates individuals are likely longer-lived peren-nials. The level of polymorphism (64.7%) anddifferentiation (85% among populations, analo-gous to FST = 0.8) observed in N. cliftonii isremarkably high compared with other long-lived endemic species (Hamrick and Godt1996). The mean heterozygosity observed inN. cliftonii (He = 0.064) was lower than thatreported in a meta-analysis (Hes = 0.105) (Ham -rick and Godt 1996), likely a consequence ofthe low levels of allelic variation. In this case,the relatively low genetic variation and signifi-cantly high levels of population differentiationindicate gene flow is limited among popula-tions. In addition, a negative fixation indexwas observed over all populations of N. clif -tonii. This deviation from Hardy–Weinbergequilibrium may result from processes such as
inbreeding depression or balancing selectionand will require demographic analyses to fullyexplain.
Greater genetic variation was observed inN. cliftonii than in its single congener species,N. alabamensis (Freiley 1994). In the geneticstudy of N. alabamensis, only a single genetwas identified per population, revealing highlevels of vegetative reproduction (Freiley 1994).By any comparison, these species appear ge -netically depauperate when assessed by iso -zyme loci and may represent relict speciesmarginally adapted to their current refugia ornarrowly distributed species highly adapted toa particular habitat.
Complex Pattern of Genetic Differentiation
As revealed by the AMOVA, genetic variationis not evenly distributed among populations ofN. cliftonii. Overall genetic differentiation washigh, with 85% of the variance distributedamong populations. This level is re markablewhen compared to other species, though a fewvalues of FST or GST greater than 0.8 havebeen reported in individual studies (Gitzen-danner and Soltis 2000, Cole 2003). The dif-ferentiation observed in N. cliftonii was evengreater than the level described in the congenerN. alabamensis (FST = 0.569—Freiley 1994).
While the differentiation among populationswas high, the pattern did not correspond to apriori categories of geographic location (water-shed) or ecological factors (order-3 soil andgeologic types or population size). The lack ofconcordance is apparent in the principle coor-dinate analyses, which identified 3 clusters ofgenetically similar populations, but revealedno pattern to the membership within clusters.Several factors may contribute to the observedpattern. First, the population structure mayreflect historic processes related to the mostrecent glacial maximum, such as a decline ingene flow and sexual reproduction in popula-tions as the climate changed. The lack of sta-tistical support for the population phenogramdoes not allow conclusions based on the phy-logenetic relationship among populations, how-ever. Second, if natural selection is sufficientto create reproductive barriers be tween popu-lations, even neutral markers such as isozymesmay display significant differentiation (Storz2005, Nosil et al. 2008, Lee and Mitchell-Olds2011). If this “isolation by adaptation” is occur -ring in N. cliftonii, the associated adaptive trait
468 WESTERN NORTH AMERICAN NATURALIST [Volume 72
or ecological factor has not been identified.Third, stochastic differences in reproductivestrategy (vegetative growth) or allele frequen-cies may have been a consequence of theShasta Dam project, but the low level of allelicvariation prohibits quantitative tests for popu-lation bottlenecks. Ultimately, examination ofmarkers with higher levels of variation andadditional demographic and ecological factorswill be required to identify the evolutionaryrelationship among populations.
The number of genets observed in a popu-lation varied by order-3 soil type, with the sin-gle population (STC) occurring on soil cate-gory 204 (Neuns family, 60%–80% slopes) anddriving the significant variation. The STCpopulation is one of the largest of N. cliftonii,so the genet diversity may reflect the largerpopulation size. Additionally, ecological factorsmay favor sexual rather than clonal reproduc-tion at this location, thus maintaining higherlevels of genotypic diversity. These estimatesof genet diversity are likely conservative. Varia-tion in the isozyme markers used in the studymay be insufficient to fully resolve geneticindividuals. Isozyme markers display variationat the protein level, not the DNA level, andhave a low mutation rate compared with othermarker systems (Ellstrand and Roose 1987).Thus, a DNA-based marker system could pro-vide additional resolution of genetic differ-ences within and among populations.
Identification of Populations of Potential Management Interest
Both the AMOVA and PCoA analyses iden-tified 3 clusters of genetically similar popula-tions (Figs. 2, 5). The significant differentiationobserved among clusters should be consideredin management and restoration activities. Incombination with ecological, demographic, orphenotypic data, such genetic struc ture mayidentify management units (MUs) or ecotypesfor conservation (Moritz 1994, Hedrick 2001).
More specifically, the genetic structure maybe used as guidelines for germplasm collec-tion, conservation, and restoration efforts. Inorder to represent the total genetic diversityin this species, samples should be taken bymultiple populations in each of the 3 clusters(or the only population in the case of cluster3). Indeed, given the low number of genetsidentified in this analysis (48 genotypes), it mayby feasible to sample each genetic individual
for conservation efforts. Restoration or popula-tion augmentation plans should maintain thegenetic distinction between the 3 clusters ofpopulations and restrict movement of plantsor seed between clusters.
The lack of correlation between genetic dif-ferentiation and soil type indicates that man-agement protocols based on differences ofsubstrate may not accurately reflect the gene -tic structure of N. cliftonii. Investigations ofdemographic factors in this species should bea priority to identify processes maintaining thespecies’ genetic structure and global rarity(Lande 1988). The putative neutral nature ofthe isozyme markers means that functional ormorphological differences cannot be interpretedfrom these data.
One N. cliftonii population, CUC, appearedgenetically distinct and formed a unique clus-ter (no. 3) in the PCoA analysis. This popula-tion did not contain high levels of genotypicdiversity (G = 4 unique genets), but did con-tain a unique allele at each of 2 isozyme loci,AAT-1 and AAT-2, indicating that this popula-tion is genetically distinct. The pattern of dif-ferentiation between the large cluster 1 andsmaller cluster 2 in the PCoA analysis did notreveal unique alleles, though unique alleleswere observed in 3 additional populations.Population COC contained a unique allele atmoderate frequency at locus 6PGD-2, popula-tion STC displayed an alternate allele at lowfrequency at locus LAP, and population KCwas fixed for an alternate allele at locus SKD.Unfortunately, several populations did not re -solve locus SKD, and several individuals fromthe KC samples were null at this locus, so it ispossible that this alternate allele may be pres -ent at other sites. Due to these missing data,SKD was one of the loci dropped in the analy-sis of the consensus population phenogram,and this rare allele may contribute to the dif-ferences in topology between the raw data andconsensus trees (Fig. 3).
The occurrence of genets in multiple popu-lations (e.g., genet M in cluster 2) may be ofparticular conservation interest. Such a pat-tern may be due to insufficient variation in theisozyme markers to identify unique genets, orit may provide insight into the biology of thisspecies. Hydrochory is an efficient dispersalmechanism of seeds, detached stems, andsprouts (DeWoody et al. 2004). Species associ-ated with riparian areas may disperse large
2012] GENETIC DIVERSITY IN SHASTA SNOW-WREATH 469
distances during flooding events (Kudoh andWhigham 1997, Akimoto et al. 1998) or viaother mechanisms (Honnay et al. 2010). Incontrast to the typical unidirectional flow ofrivers, large flooding events may result in tem-porary backwaters moving propagules in anupstream direction (Kofoid 1903, DeWoody etal. 2004). Given the clonal nature of N. clif -tonii, the genetic structure may be betterexplained by the historic flow patterns of theShasta Lake watershed system than by theextant distribution of populations. The remark-ably high differentiation among populations isnot consistent with the river providing fre-quent gene flow between populations, indicat-ing that these populations do not likely form a“classical” metapopulation. Infrequent popula-tion establishment may increase the differentia-tion among populations, even if gene flow iswidespread during disturbance events.
ACKNOWLEDGMENTS
J. Mello, R. Hernandez, and R. Hanson con -ducted laboratory analyses. M. Goolsby pro-vided assistance with ArcGIS. We thank theU.S. Bureau of Reclamation Mid-Pacific Re -gion office for their support.
LITERATURE CITED
AGUILAR, R., M. QUESADA, L. ASHWORTH, Y. HERRERIAS-DIEGO, AND J. LOBO. 2008. Genetic consequences ofhabitat fragmentation in plant populations: suscepti-ble signals in plant traits and methodological ap -proaches. Molecular Ecology 17:5177–5188.
AKIMOTO, M., Y. SHIMAMOTO, AND H. MORISHIMA. 1998.Population genetic structure of wild rice Oryzaglumaepatula distributed in the Amazon flood areainfluenced by its life history traits. Molecular Ecol-ogy 7:1371–1381.
CHELIAK, W.M., AND J.A. PITEL. 1984. Techniques forstarch gel electrophoresis of enzymes from foresttree species. Information Rep.PI-X-42. Petawawa Na -tional Forestry Institute, Canadian Forestry Service,Ottawa, Canada.
COLE, C.T. 2003. Genetic variation in rare and commonplants. Annual Review of Ecology, Evolution, andSystematics 34:213–237.
CONKLE, M.T., P.D. HODGSKISS, L.B. NUNNALLY, AND S.C.HUNTER. 1982. Starch gel electrophoresis of coni ferseeds: a laboratory manual. General Technical Re portPSW-64, Pacific Southwest Forest and Range Experi -ment Station, USDA Forest Service, Ber keley, CA.
CORNUET, J.-M., AND G. LUIKART. 1996. Description andpower analysis of two tests for detecting recentpopu lation bottlenecks from allele frequency data.Ge netics 144:2001–2014.
DEVORE, M.L., S.M. MOORE, K.B. PIGG, AND W.C. WEHR.2004. Fossil Neviusia leaves (Rosaceae: Kerriae) from
the lower-middle Eocene of southern British Colum-bia. Rhodora 106:197–209.
DEWOODY, J., J.D. NASON, AND M. SMITH. 2004. Inferringdemographic processes from the genetic structure ofa metapopulation of Boltonia decurrens (Asteraceae).Conservation Genetics 5:603–617.
ELLSTRAND, N.C., AND M.L. ROOSE. 1987. Patterns ofgenotypic diversity in clonal plant species. AmericanJournal of Botany 74:123–131.
FELSENSTEIN, J. 1989. PHYLIP—phylogeny inferencepackage (version 3.2). Cladistics 5:164–166.
FREILEY, K.J. 1994. Clonal diversity patterns in marginalpopulations of the geographically restricted Neviusiaalabamensis (Rosaceae). Southwestern Naturalist 39:34–39.
GITZENDANNER, M.A., AND P.S. SOLTIS. 2000. Patterns ofgenetic variation in rare and widespread plant con-geners. American Journal of Botany 87:783–792.
HAMRICK, J.L., AND M.J.W. GODT. 1996. Effects of life his-tory traits on genetic diversity in plant species.Philosophical Transactions of the Royal Society B–Biological Sciences 351:1291–1298.
HEDRICK, P.W. 2001. Conservation genetics: where are wenow? Trends in Ecology and Evolution 16: 629–636.
HONNAY, O., AND H. JACQUEMYN. 2007. Susceptibility ofcommon and rare plant species to the genetic conse-quences of habitat fragmentation. Conservation Biol-ogy 21:823–831.
HONNAY, O., H. JACQUEMYN, K. NACKAERTS, P. BREYNE,AND K. VAN LOOY. 2010. Patterns of population gene -tic diversity in riparian and aquatic plant speciesalong rivers. Journal of Biogeography 37:1730–1739.
KARRON, J.D. 1987. A comparison of levels of genetic poly-morphism and self-compatibility in geographicallyrestricted and widespread plant congeners. Evolu-tionary Ecology 1:47–58.
KAYE, T.N., R.J. MEINKE, J. KAGAN, S. VRILAKAS, K.L. CHAM -BERS, P.F. ZIKA, AND J.K. NELSON. 1997. Patterns of rar-ity in the Oregon flora: implications for conservationand management. In: T.N. Kaye, A. Liston, R.M. Love,D.L. Luoma, R.J. Meinke, and M.V. Wilson, editors,Conservation and management of native plants andfungi. Native Plant Society of Oregon, Corvallis, OR.
KOFOID, C.A. 1903. Plankton studies IV. The plankton ofthe Illinois River. 1894–1899, with introductorynotes upon the hydrography of the Illinois River andits basin. Part I. Quantitative investigations and gen-eral results. Illinois State Laboratory Natural His-tory Bulletin 6:95–635.
KUDOH, H., AND D.F. WHIGHAM. 1997. Microgeographicgenetic structure and gene flow in Hibiscusmoscheutos (Malvaceae) populations. American Jour-nal of Botany 84:1285–1293.
LANDE, R. 1988. Genetics and demography in biologicalconservation. Science 241:1455–1460.
LEE, C.-R., AND T. MITCHELL-OLDS. 2011. Quantifyingeffects of environmental and geographical factors onpatterns of genetic differentiation. Molecular Ecol-ogy 20:4631–4642.
LINDSTRAND, L., III, AND J.K. NELSON. 2005. Noteworthycollections. Madroño 52:126–127.
MORITZ, C. 1994. Defining ‘evolutionary significant units’for conservation. Trends in Ecology and Evolution9:373–376.
470 WESTERN NORTH AMERICAN NATURALIST [Volume 72
NEI, M. 1972. Genetic distance between populations.American Naturalist 106:283–292.
NOSIL, P., S.P. EGAN, AND D.J. FUNK. 2008. Heterogeneousgenomic differentiation between walking-stick eco-types: “isolation by adaptation” and multiple rolesfor divergent selection. Evolution 62:316–336.
PEAKALL, R., AND P.E. SMOUSE. 2006. GENALEX 6:genetic analysis in Excel. Population genetic soft-ware for teaching and research. Molecular EcologyNotes 6:288–295.
RABINOWITZ, D. 1981. Seven forms of rarity. In: H. Synge,editor, The biological aspects of rare plant conserva-tion. John Wiley & Sons, New York, NY.
SHEVOCK, J.R., B. ERTTER, AND D.W. TAYLOR. 1992.Neviusia cliftonii (Rosaceae: Kerriaea), and intrigu-ing new relict species from California. Novon 2:285–289.
SILVERTOWN, J. 2008. The evolutionary maintenance ofsexual reproduction: evidence from the ecological di s -tribution of asexual reproduction in clonal plants. In -ternational Journal of Plant Sciences 169:157–168.
SPIELMAN, D., B.W. BROOK, AND R. FRANKHAM. 2004.Most species are not driven to extinction before gene-tic factors impact them. Proceedings of the National
Academy of Sciences of the United States of America101:15261–15264.
STORZ, J.F. 2005. Using genome scans of DNA polymor-phism to infer adaptive population divergence. Mo -lecular Ecology 14:671–688.
TAYLOR, B.L., AND A.E. DIZON. 1999. First policy then sci-ence: why a management unit based solely on gene -tic criteria cannot work. Molecular Ecology 8:S11–S16.
USDA FOREST SERVICE. 1983. Shasta–Trinity NationalForest Order 3 Soil Survey. United States Depart-ment of Agriculture, Forest Service, Pacific SouthwestRegion, in cooperation with the University of Cali-fornia Agricultural Experiment Station, Vallejo, CA.
______. 2004. Northern Province bedrock geology layer(ArcInfo coverage prov6bedrk). United States De -part ment of Agriculture, Forest Service, KlamathNational Forest, Yreka, CA.
WENDEL, J.F., AND N.F. WEEDEN. 1989. Visualization andinterpretation of plant isozymes. In: D.E. Soltis andP.S. Soltis, editors, Isozymes in plant biology.Dioscorides Press, Portland, OR.
Received 17 January 2012Accepted 26 September 2012
2012] GENETIC DIVERSITY IN SHASTA SNOW-WREATH 471
Appendix on page 472
472 WESTERN NORTH AMERICAN NATURALIST [Volume 72
APPENDIX. A total of 48 multilocus genotypes were observed in 410 samples of Neviusia cliftonii.
aDiploid genotypes are given for each locus in the following order: 6PGD-1, 6PGD-2, AAT-1, AAT-2, ACO, IDH, LAP, MDH-1, MDH-3, ME7, PGI-1, PGI-2,PGM, SKD, TPI-1, TPI-2, UGPP.b0 indicates missing data.