28
Population Health, Value Based Benefits and Biologic Technologies F. Randy Vogenberg, RPh, PhD Executive Director, BFAC
| Date post: | 21-Dec-2015 |
| Category: |
Documents |
| View: | 217 times |
| Download: | 4 times |

Population Health, Value Based Benefits and Biologic Technologies
F. Randy Vogenberg, RPh, PhD
Executive Director, BFAC

Setting the Stage—from the Employer View

3
Who Controls the
Product?DistributorDistributor
McKessonMcKesson
Cardinal BergenCardinal Bergen
The Market View
Payer
Medicaid Medicare
Third Part Admin
MCO
PBM w/Specialty Pharm (SPC): APCS(Fed)/Caremark,
Express Scripts/CurascriptMedco/Accredo
Retail w/SPC & PBM (Walgreens, CVS)
“Independent” SPC: Accredo, Chronimed, etc.
MCO with internal PBM/SPC
Dispenser
PatientPatient
Administered byAdministered by
MD Office / Infusion CenterMD Office / Infusion Center
HHC PatientHHC Patient
ManufacturerManufacturer

Copyright 2007, F R Vogenberg.
Sample Snapshot from “BY 2004” U.S. Pharmaceutical Market
Traditional Specialty
Total Market = $215 B($ in Billions)
Specialty Pharmaceutical MarketMultiple Sclerosis 2.5Hemophilia 1.6Hepatitis C 1.6Rheumatoid Arthritis 1.5Pulmonary Hypertension
1.2RSV prophylaxis 0.8Growth Hormone 0.4Infertility 0.7Oncology 12.6HIV/AIDS 3.4Renal 3.2Transplant 1.5Other 1.3Total 32.3
Sources: Extrapolated from IMS Health, JP Morgan Industry Update, “Specialty Pharmacy: Conduit of Growth for Biotechnology,” March 14, 2003, Bear Stearns Health Care Distribution, “Specialty Pharmacy Services: Among the Fastest-Growing Areas of Health Care,” November 2003, Caremark Estimates.

Copyright 2007, F R Vogenberg.
A Sample Snapshot from 2006 U.S. Pharmaceutical Market
Traditional Specialty (+20%)
Total Market = $275 B($ in Billions; +8%)
Specialty Pharmaceutical MarketMultiple SclerosisHemophiliaHepatitis CRheumatoid ArthritisPulmonary Hypertension
RSV prophylaxisGrowth HormoneInfertilityOncologyHIV/AIDSRenalTransplantOtherTotal 40.0
Sources: Extrapolated from IMS Health, JP Morgan Industry Update, “Specialty Pharmacy: Conduit of Growth for Biotechnology,” March 14, 2003, Bear Stearns Health Care Distribution, “Specialty Pharmacy Services: Pharma Voice, 2007.

Copyright 2007, F R Vogenberg.
Trend Impacts in 2006
Acute or Life Saving 0.6 %
Life Style or Cosmetic 0.1%
Chronic preventative, maintenance or symptomatic 3.4 %
“Over Utilization” 1.1 %
Generics: Top 5 = 0.8% savings of gross
Generics: Top 14 overall = ~4 % savings of gross
Top Brands spend result in ~even cost overall.
Source: adapted from Caremark 2006, 2-07 Industry Analytics.

Copyright 2007, F R Vogenberg.
Generics
+13 % in prescription volume
+22 % in pharmacy sales

Copyright 2007, F R Vogenberg.
Health Care Hyper Disruption—Just Like “IT”
Information explosion 100 fold increase in bytes of data by 2010 Consumerism and genome project applications
Device explosion Mobile devices double by 2010 Biotechnology utilization grows 4 fold
Transaction explosion Platform stability for connection to interaction Claims adjudication to value based behavioral
management Mayhem explosion
Security breaches HIPAA compliance

Copyright 2007, F R Vogenberg.
Source: Banc of America Securities LLC
New “Specialty” Drugs Are Escalating Rapidly & Impacting Medication Spend
• U.S. biotech companies had sales of $32.3 billion in 2003.• U.S. biotech companies are predicted to have sales of $91 billion in 2008.
Sources: Ernst & Young LLC, Resurgence: The Americas Perspective Global Biotechnology Report 2004, cited in T. Agres, "US Biotech May Leap into the Black," Drug Discovery and Development, July 1, 2004, p. 16.
Specialty Drug Industry Growth, 1990-2005E
100
240
369
29
92
197
600
100
100
200
300
400
500
600
700
1990 1995 2000 2005E$0
$10
$20
$30
$40
$50
Drugs in Development Drugs on Market Product Revenue ($Billions)
$17B
$46B
Num
ber
of
Spe
cia
lty D
rugs
Pro
duc
t R
even
ues
($ B
illio
ns)

Copyright 2007, F R Vogenberg.
Follow the Dollar: Cross Impacts of Rising Cost Share on the Severely IllTotal Health Care: $1
Hospital, Diagnosis Medical Laboratory, Out Patient
Prescriptions
Total Rx : $.12-.15Typical Rx
Injectables & Biotech ($.02)
Total Spc Rx: $.02Injectables ($.01)
Biotech ($.01)
Source: Aon project data on file, 2004
80% Covered20% Out-of-Pocket
Co-pay: $.002 or 2/10 of $.01Example: Minimal impact of a20% Co-pay on the total health care premium
Total Health Care: $1Hospital, Diagnosis Medical Laboratory, Out Patient
Prescriptions
Total Health Care: $1Hospital, Diagnosis Medical Laboratory, Out Patient
Prescriptions
Hospital, Diagnosis Medical Laboratory, Out Patient
Prescriptions
Total Rx : $.12-.15Typical Rx
Injectables & Biotech ($.02)
Total Rx : $.12-.15Typical Rx
Injectables & Biotech ($.02)
Typical Rx
Injectables & Biotech ($.02)
Total Spc Rx: $.02Injectables ($.01)
Biotech ($.01)
Total Spc Rx: $.02Injectables ($.01)
Biotech ($.01)
Source: Aon project data on file, 2004
80% Covered20% Out-of-Pocket
Co-pay: $.002 or 2/10 of $.01Example: Minimal impact of a20% Co-pay on the total health care premium
80% Covered20% Out-of-Pocket
80% Covered20% Out-of-Pocket
Co-pay: $.002 or 2/10 of $.01Example: Minimal impact of a20% Co-pay on the total health care premium

Copyright 2007, F R Vogenberg.
Tidal Wave Effect—Use & Cost
1%
4%
15%
55%
0%
1%
2%
3%
4%
5%
2004 2010
0%
15%
30%
45%
60%Population %
Spc Drug Spend %
Sources: Managed Care Magazine, August 2004; Specialty Pharmacy News, 2006.
Benefits: Trends are about market challenges and change
Short Term 1-3 years

Today we have Co-pay set on price,
not value
Generic drugs – lowest co-pay
Preferred brand – middle
Nonpreferred brand – highest
Benefit-Design Trends: Increased Cost Sharing at Point of Service
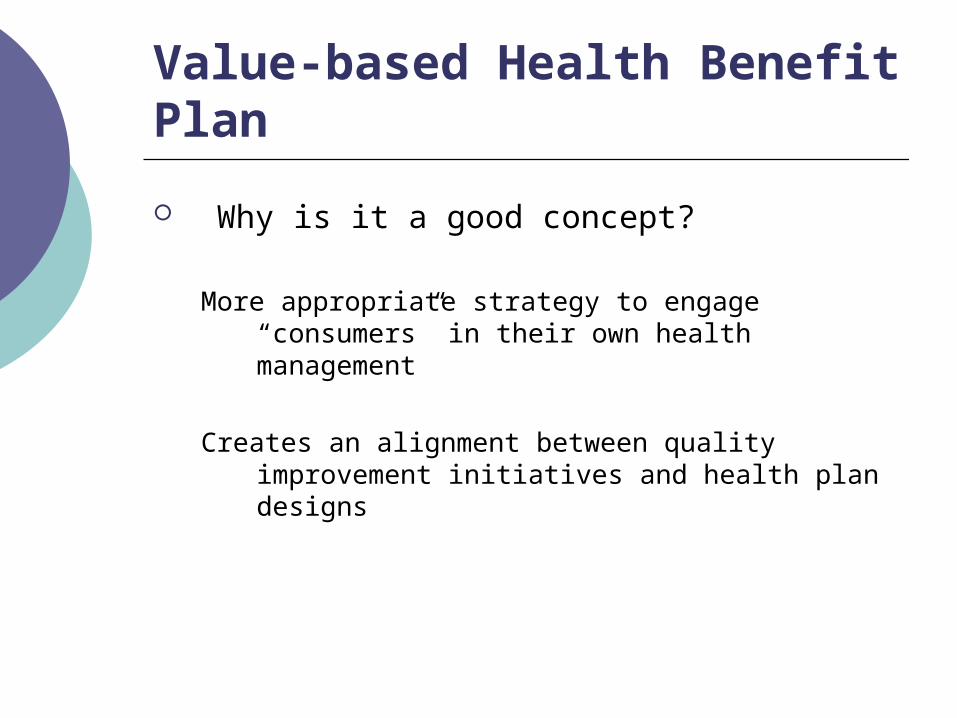
Value-based Health Benefit Plan
Why is it a good concept?
More appropriate strategy to engage “consumers” in their own health management
Creates an alignment between quality improvement initiatives and health plan designs

Misinterpretation of VbBD
Value-based
Benefit Design
Value Based
Insurance Design &
Hybrids
Pay For Performance (P4P)
&
HPN
Value Based
Formularies
Medical Home
&
Gatekeeper
Others

VbBD: A Corporate Strategy
Value-based
Health Plan
Health PlanBenefit Coverage
VbBDs
Value Based
Insurance Design &
Hybrids
Pay For Performance (P4P)
&
HPN
Value Based
Formularies
Medical Home
&
Gatekeeper
Others
Goals, Objectives/Outcomes
& Desired Behaviors resulting from
Health Care Plan(s).
Implementation of Health Plan.
Following ERISA, HIPAA, etc.
Business Goals and Objectives.ER Corporate Business Model

Employers Primary Focus of Health Care
RiskReduction
Prevent the Preventable
Change Incidence Rates
CONFIDENTIAL INFORMATION© 2007 Copyright EPS LLC, All Rights Reserved

Employer’s Health Care Objective
CONFIDENTIAL INFORMATION© 2007 Copyright EPS LLC, All Rights Reserved
Health &
Wellness(Prevention
curtails costs)
No Risk EEs
DiseaseManagement
(After the fact Management)
EEs sufferedCVD Event
Economic Benefit of Healthy Employees…
Find Patients @ RiskPrevent the Preventable (Heart Attack)
RiskReduction
Prevent the Preventable
Change Incidence Rates
Continuum of Service

VbBD How can “Pharmacy” help enhance each stakeholders own “Value Proposition”?
IMPROVEDOUTCOME
Patient:QoL
Care PerceptionLower Co-pays
Payor:Market Share
Member Turnover Utilization & Costs
Employer:Productivity
Employee StabilityPremium Rates
Physician:Reputation
Office EfficiencyImproved Care

Biologic Finance and Access
Council
(BFAC)About the Program at Thomas Jefferson University
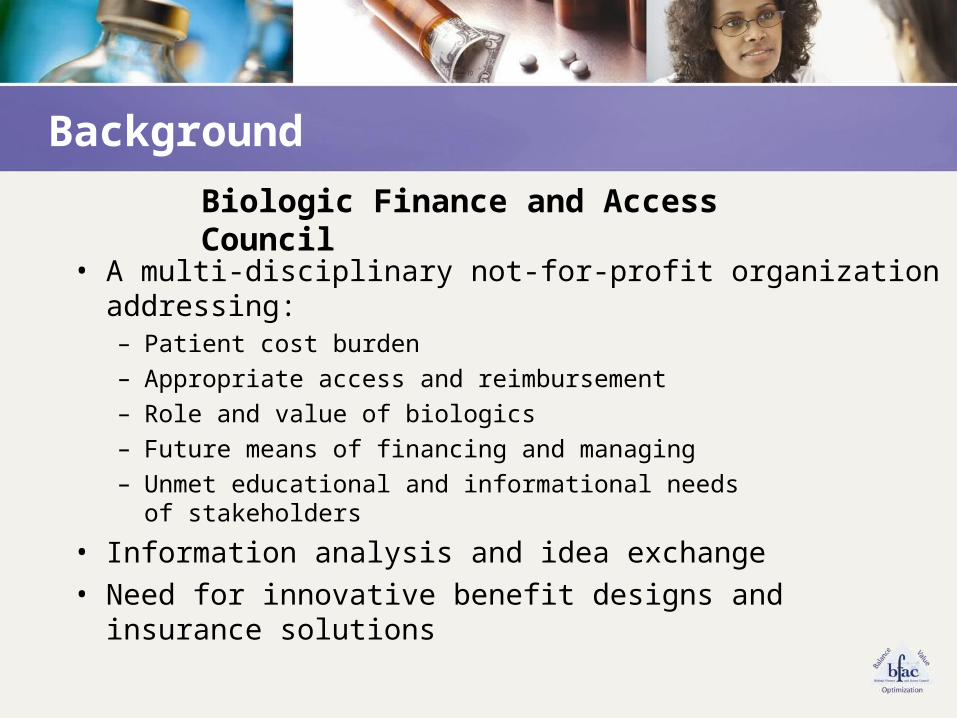
Background
• A multi-disciplinary not-for-profit organization addressing:– Patient cost burden– Appropriate access and reimbursement– Role and value of biologics– Future means of financing and managing– Unmet educational and informational needs
of stakeholders
• Information analysis and idea exchange• Need for innovative benefit designs and insurance
solutions
Biologic Finance and Access Council

Membership: An Opportunity to “LEARN”• Leadership
– Members steer the direction by identifying key issues, such as:• Patient cost burden; role and value of biologics; access to,
reimbursement for, and ways to finance and manage biologic products and technologies; and other relevant issues
• Education– Provides, through existing or new collaborations:
• Courses, webinars, and conferences offering in-depth professional development opportunities, designed by and for BFAC members and related professionals
• CME opportunities for licensed professionals
• Action– Develops and disseminates practical solutions:
• Collaborate with stakeholders on the creation of innovative benefit designs
• Publish definitive viewpoints and interpretations of market trends, addressing the unmet educational and informational needs of stakeholders

Membership: An Opportunity to “LEARN”
• Research, Representation, and Resources– Creates opportunities for:
• Original or shared research on innovative benefit designs• Data and information analysis• Exchange of ideas on future financing of biologic technologies• Provision of member mailing lists, conferences, and educational courses
• Networking– Offers a dynamic forum for the exchange of new ideas, bringing
together members to share their experiences, expertise, and friendship
• Through BFAC, there are numerous opportunities for leadership, education, discussion of national or local issues, personal and professional networking, professional development, referrals, and accredited education offerings

Foundation In Place for the Future

Biotechnology Healthcare - Official Journal
• Reports on:– Management and use of biopharmaceuticals and molecular
diagnostics– Value to third-party payers and employer purchasers– Scientific advances affecting healthcare – Financing, utilization, and public policy
• Bimonthly, peer-reviewed journal, introduced 2004, link with BFAC 2006
• Reaches 35,000 healthcare decision makers
• Website – www.biotechnologyhealthcare.com– Weekly e-newsletter (13,000 requestors)
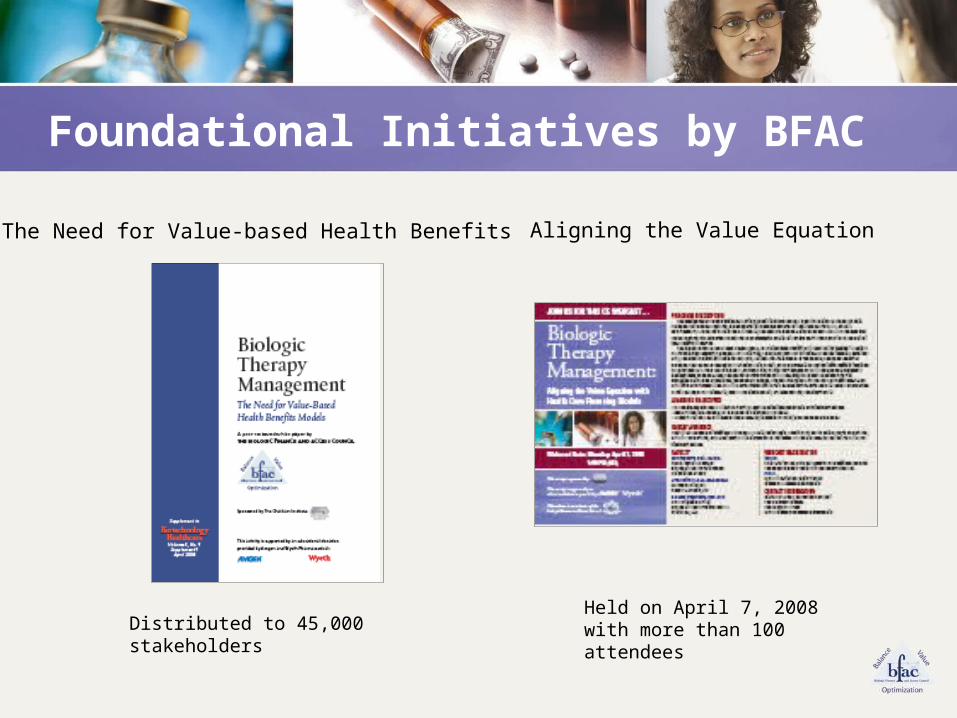
Foundational Initiatives by BFAC
The Need for Value-based Health Benefits Aligning the Value Equation
Distributed to 45,000 stakeholdersHeld on April 7, 2008 with more than 100 attendees

Future Focus for BFAC
• Benefit design innovation• Employer issue exchange on health care coverage• Biologic technologies, biomarkers, and molecular
medicine• Spotlight on disease states• Health data analysis and research• Multidisciplinary opportunities for collaboration• Market focused and action oriented
Summary
• Unique biologic/new technology focus with emphasis on member driven solutions led by an experienced leadership team
• Action oriented around innovation in benefit design for real world biotechnology access and finance solutions
• Established work product and direction, now with the Jefferson School of Population Health and its resources or affinity groups


