+ All Categories
Home > Documents > Population - Home - CSO - Central Statistics Office · 2 Statistical Yearbook of ... lowed by...

Population - Home - CSO - Central Statistics Office · 2 Statistical Yearbook of ... lowed by...

Date post: 21-Jun-2018
Category:
Upload: doanthuy
View: 214 times
Download: 0 times
Share this document with a friend
22
The total for the population enumerated on Census night 10 April 2011 was 4,588,252 persons, compared with 4,239,848 persons in April 2006, representing an increase of 8.2% in five years. Since the last census in 2006 the number of non-Irish nationals has increased by 124,624 persons, or 29.7%, from 419,733 to 544,357. Polish nationals increased by 93.7% from 63,276 to 122,585, accounting for almost half of the total increase among this group. The number of divorced persons increased from 59,534 to 87,770 between 2006 and 2011, a rise of 47.4%. The total number of cohabiting couples was 143,561 in 2011 compared with 121,759 in 2006 - this was an increase of just over 21,800 on the 2006 figure, but shows a slower rate of growth than in previous years. Population 1
Transcript

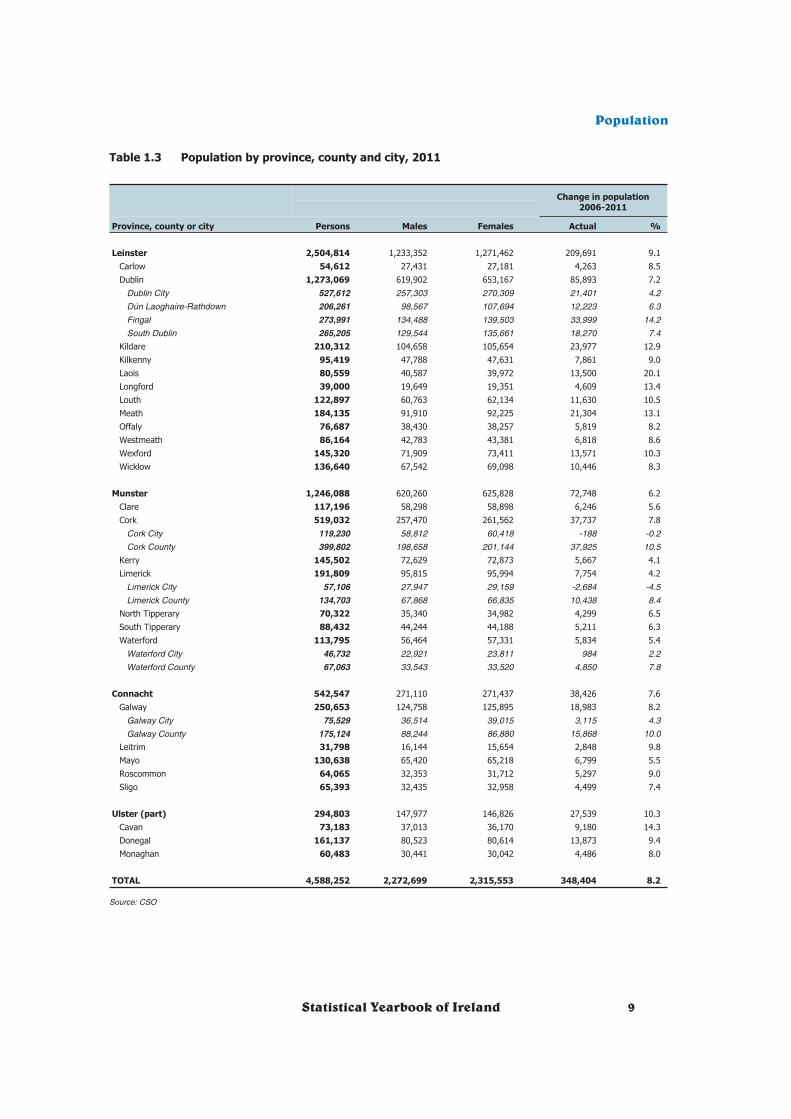
• The total for the population enumerated on Census night 10 April 2011 was4,588,252 persons, compared with 4,239,848 persons in April 2006, representingan increase of 8.2% in five years.

• Since the last census in 2006 the number of non-Irish nationals has increased by124,624 persons, or 29.7%, from 419,733 to 544,357. Polish nationals increased by93.7% from 63,276 to 122,585, accounting for almost half of the total increaseamong this group.

• The number of divorced persons increased from 59,534 to 87,770 between 2006and 2011, a rise of 47.4%.

• The total number of cohabiting couples was 143,561 in 2011 compared with121,759 in 2006 - this was an increase of just over 21,800 on the 2006 figure, butshows a slower rate of growth than in previous years.

Population

1

Contents

Introductory text 3

Table 1.1 Population by province 7

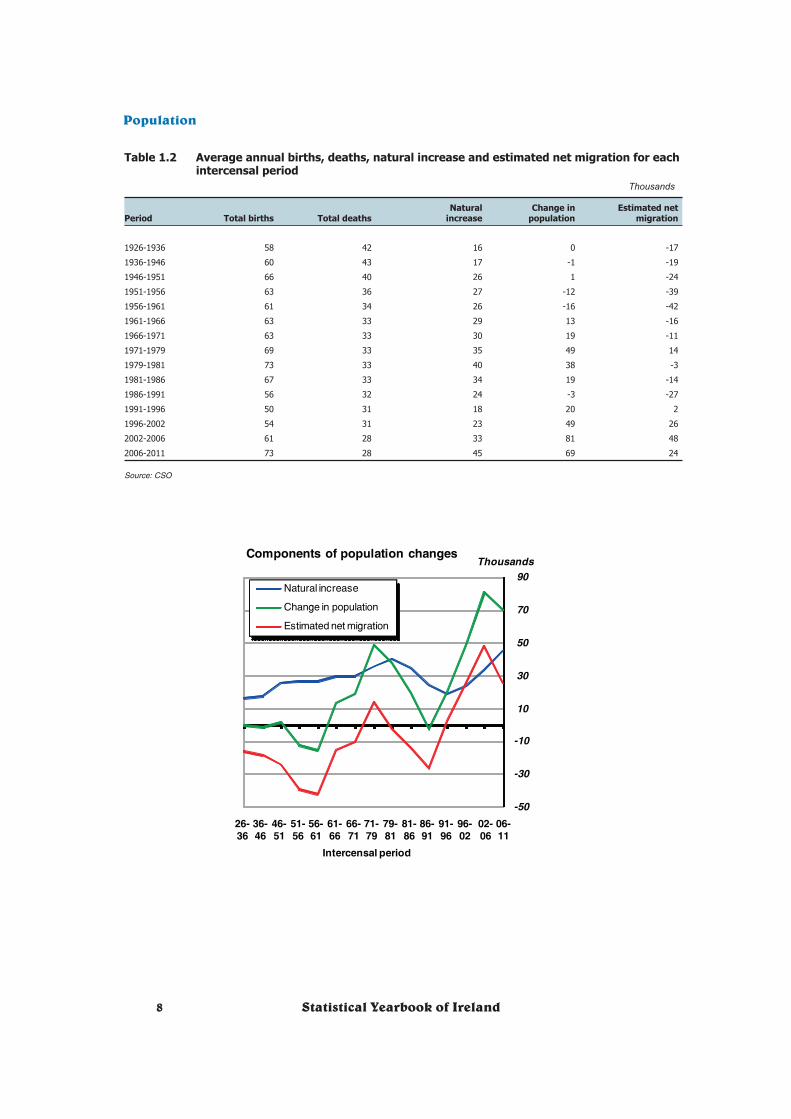
Table 1.2 Average annual births, deaths, natural increase and estimatednet migration for each intercensal period 8

Table 1.3 Population by province, county and city, 2011 9

Table 1.4 Population by sex and age group for census years 11

Table 1.5 Estimated annual population by sex and age group 13

Table 1.6 Usual residents by ethnic or cultural background, 2011 14

Table 1.7 Travellers by age group, sex and marital status, 2011 14

Table 1.8 Population aged 15 years and over by marital status 15

Table 1.9 Persons usually resident in the State on Census Night, by place ofbirth and age group, 2011 16

Table 1.10 Persons usually resident and present in the State on CensusNight, by nationality and age group, 2011 17-18

Table 1.11 Persons usually resident and present in the State on Census Night,by religion and nationality, 2011 18

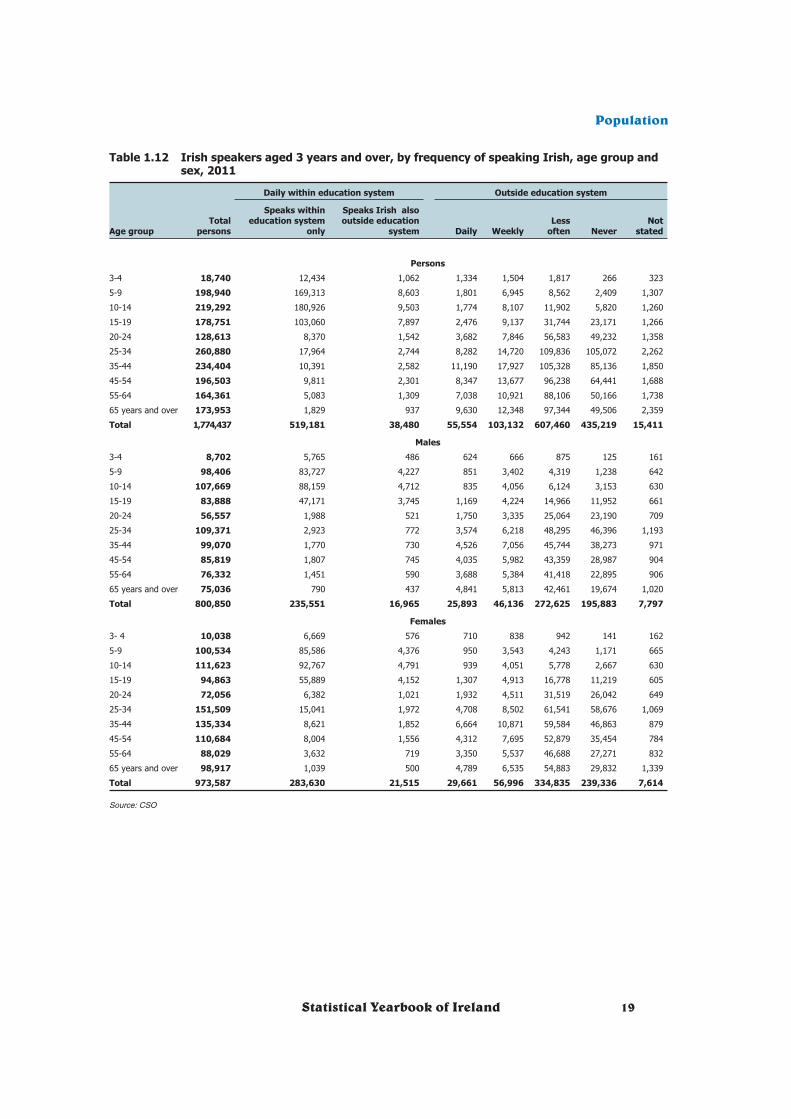
Table 1.12 Irish speakers aged 3 years and over, by frequency of speakingIrish, age group and sex, 2011 19

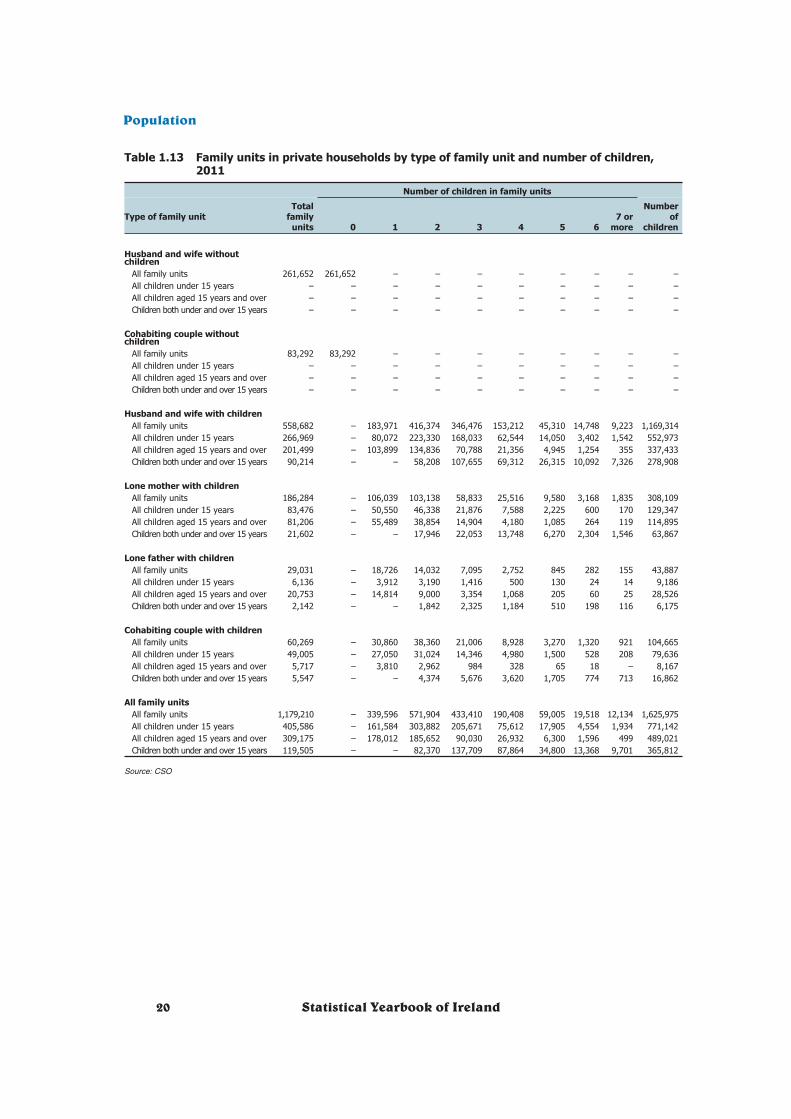
Table 1.13 Family units in private households by type of family unit andnumber of children, 2011 20

2 Statistical Yearbook of Ireland

Introduction

This chapter contains a representative selection of tables on the population of theState. The figures are taken from Censuses of Population carried out since 1841. Thetables selected give an insight into the historical evolution of the population, the fac-tors affecting population change, the distribution of the population by geographic areaand by the main demographic characteristics, ie age, sex and marital status. The im-portance of migration in Irish population dynamics is underscored by the selection oftables dealing with place of birth, nationality and place of usual residence one year be-fore the census. Religion and the Irish language are also covered. Detailed figures forintercensal years are taken from the annual series of population and migrationestimates.

The first major census, using a household form, was the so-called Great Census of1841. Censuses were subsequently taken at ten-year intervals up to 1911. The firstcensus following the formation of the State was undertaken in 1926. This was fol-lowed by censuses in 1936 and 1946. Commencing with 1951, censuses have beentaken every five years. The census planned for 1976 was cancelled at a late stage as aGovernment economy measure. However, the need for up-to-date population figuresresulted in a census being specially undertaken in 1979 with a restricted number ofquestions. This was followed by a full census in 1981, and a resumption of the five-yearinterval for census taking. This five-year periodicity was broken in 2001 when the cen-sus planned for that year was postponed until April 2002 due to the outbreak of footand mouth disease. The most recent census was taken on 10 April 2011.

Historical population trends

The population of the area comprising the Republic of Ireland was over 6.5 million asmeasured by the 1841 Census of Population. The deaths which resulted from the fam-ine of 1846/47 and the large scale emigration which followed in its wake and whichcontinued throughout the second half of the 19th century culminated in a halving ofthe population by 1901. Further population declines followed between 1901 and 1926,albeit at a lower level than previously. The population stabilised at around 2.9 millionfor over a quarter of a century before reaching its low point of 2.8 million as deter-mined by the 1961 Census. Apart from the decline experienced in the late 1980s, thedirection of population change has since been positive.

With 36.7%, Munster had the largest population share in 1841, followed by Leinsterwith 30.2%. Leinster’s share gradually began to increase and surpassed that of Mun-ster by 1891. Its share continued to increase further and by 1971 it accounted for overhalf of the total population of the State, currently at 54.6%. Munster’s share of the to-tal population has declined from 36.7% in 1841 to 27.1% in 2011. The decline in theshare of Connacht and Ulster (part of) has been even more acute, the 2011 levels be-ing 11.8% and 6.4% respectively according to the 2011 Census results.

Factors affecting population change

The census figures relate to the number of persons present in the State on CensusNight. The change in population between successive censuses reflects the effect of

Statistical Yearbook of Ireland 3

births and deaths and the movements of persons into and out of the State during therelevant period. As the number of births and deaths is known from the vital statisticsregistration system, it is possible to determine net migration (the difference betweeninward and outward migration) as a residual figure. Because of differing lengths, it isbest to express the figures for intercensal periods as annual averages.

In the period from 1926 to 1951, gains due to natural increase were counterbalancedby losses due to net emigration, resulting in little change to the overall population to-tals. The heavy losses due to high net emigration during the 1950s resulted in an aver-age annual fall in population of around 14,000 during that decade and culminated inthe population low point of 2.8 million in 1961. The population has increased in everyintercensal year since then, apart from 1986-1991 when a fairly modest decline wasexperienced. Population growth peaked at 81,000 per annum during the 2002-2006period. The most recent intercensal period (2006-2011) shows the highest natural in-crease at 45,000 persons per annum, with 73,000 births and 28,000 deaths.

Population by age and sex

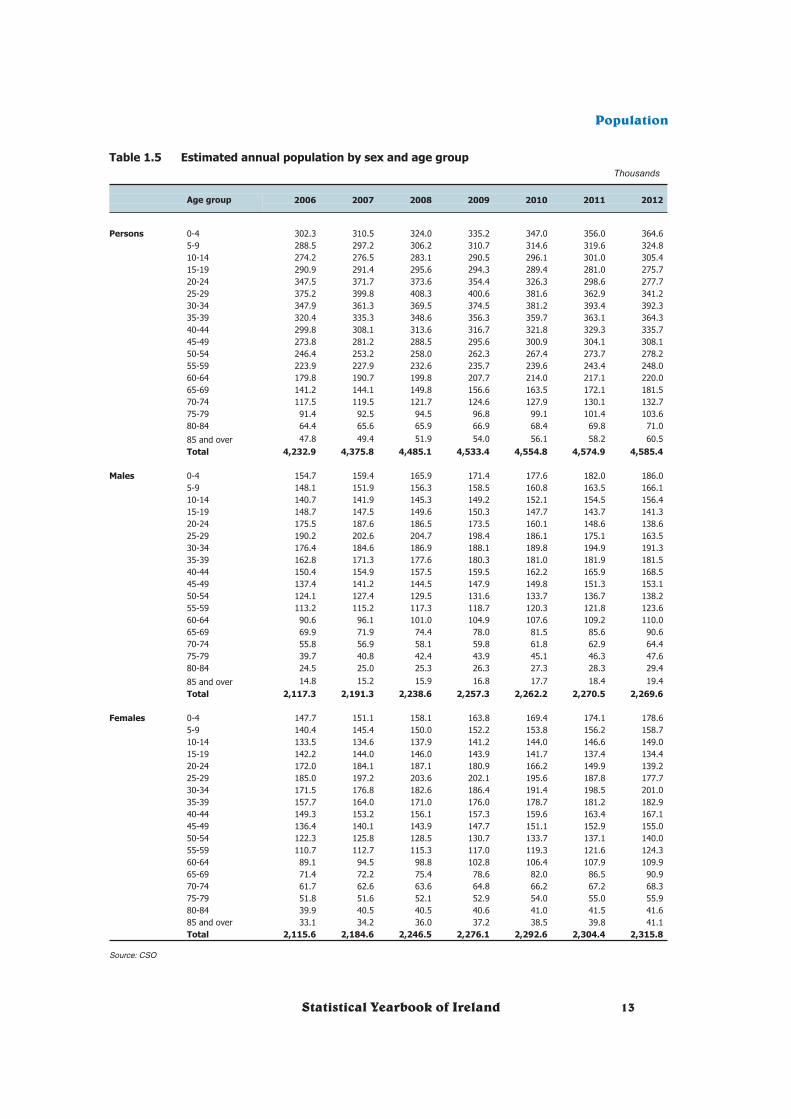
The State’s average age of the population was 36.1 years in 2011 compared with 35.6five years earlier.

Even though the fertility rate of women aged 20-39 declined in the 1970s the highnumbers of births in recent years were due to an increase in the number of child-bear-ing age, rather than any change in the underlying fertility rate. In the child-bearing agegroups of 15-49 years, every 100 women had given birth to 116 children, the samenumber as in 2006. However, there were 1.16 million women in this age group livinghere in 2011, an increase of 62,427 on the 2006 figure, resulting in higher overallnumber of births.

People are living longer as can be seen in the changes in the population aged over 65which increased by 14.4% since 2006.

Population figures for the period since 2006 show annual growth of around 1.6%. Thetotal for the population from the 2011 Census is 4.59 million.

The number of males in the population exceeded the number of females by 13,300 in1971. The 1986 Census witnessed a small female surplus which strengthened in theperiod to 2002. In 2006, males outnumbered females but according to the 2011 Cen-sus results this has reversed to show the number of females exceed the number ofmales by 42,854.

Marital status and living arrangements

The percentage of people aged 15 and over who were single has fallen from 43.1% in2006 to 41.7% in 2011. The numbers differed for men and women with 44.3% of mensingle but only 39.2% of women.

There were 143,588 more married people in Ireland than there were five years ago.The majority of this increase (132,379) was among those married for the first time. An

4 Statistical Yearbook of Ireland

additional 11,165 more were re-married after the breakup of a previous marriage, andthe increase in those re-married following widowhood remained largely unchanged.Despite this growth, the percentage of the population who were married remainedstable at around 37%.

The number of divorced people in Ireland has increased by 150.3% since 2002 (thefirst census following the introduction of divorce in Ireland), up from 35,059 to 87,770in this census. In contrast the number of people identified as separated has levelledoff and stood at 116,194, up marginally from 107,263 five years earlier. As divorce inIreland generally requires a period of separation in the first instance (up to five years)the data no doubt reflects both a progression for people from separation to divorce,combined with new numbers joining the category of separation.

Of the 1.18 million families in Ireland, 143,600 were comprised of cohabiting couples.This was an increase of 21,800 on the 2006 figure, but shows a slower rate of growththan in previous years. From 2002 to 2006 the numbers grew by an average of 11,000per year. While the majority (57.8%) of those couples had no children the averagenumber of children in this family type is rising. There were 0.7 children per cohabitingcouple in 2011, up from 0.6 in 2006. As cohabitation is often a precursor to marriage inIreland, these couples tend to be younger on average than married couples (35.1years as opposed to 50.4 for married).

Migration, birthplace and nationality

According to the 2011 Census, 83% of persons usually resident in the State were bornthere. Of these just over three out of four live in the county in which they were born.Just 58,470 Northern Ireland-born persons were usual residents of the State in 2011.The groups that showed the largest increase were those already well established inIreland. The fastest growing groups were Romanians (+110%), Indians (+91%), Pol-ish (+83%), Latvians (+43%) and Lithuanians (+40%).

Between 2006 and 2011 the number of non-Irish nationals increased by 124,624 per-sons, or 29.7%, from 419,733 to 544,357.

In the twelve months leading up to census day in 2011, 53,267 persons immigratedinto the State. Of these, 36.8% were Irish born. In terms of non-nationals, 4,549 UKand 3,825 Polish were the leading immigrant groups.

Statistical Yearbook of Ireland 5

Technical Notes

Table 1.5

Preliminary figures used for the year 2012.

The population estimates are based on the usual residence concept.

6 Statistical Yearbook of Ireland

0

500

1,000

1,500

2,000

2,500

1841 1858 1875 1892 1909 1926 1943 1960 1977 1994 2011

ThousandsPopulation by province

Leinster

Munster

Connacht

Ulster (part of)

Table 1.1 Population by province

Census year Total Leinster Munster Connacht Ulster (part)

1841 6,528,799 1,973,731 2,396,161 1,418,859 740,048

1851 5,111,557 1,672,738 1,857,736 1,010,031 571,052

1861 4,402,111 1,457,635 1,513,558 913,135 517,783

1871 4,053,187 1,339,451 1,393,485 846,213 474,038

1881 3,870,020 1,278,989 1,331,115 821,657 438,259

1891 3,468,694 1,187,760 1,172,402 724,774 383,758

1901 3,221,823 1,152,829 1,076,188 646,932 345,874

1911 3,139,688 1,162,044 1,035,495 610,984 331,165

1926 2,971,992 1,149,092 969,902 552,907 300,091

1936 2,968,420 1,220,411 942,272 525,468 280,269

1946 2,955,107 1,281,117 917,306 492,797 263,887

1951 2,960,593 1,336,576 898,870 471,895 253,252

1956 2,898,264 1,338,942 877,238 446,221 235,863

1961 2,818,341 1,332,149 849,203 419,465 217,524

1966 2,884,002 1,414,415 859,334 401,950 208,303

1971 2,978,248 1,498,140 882,002 390,902 207,204

1979 3,368,217 1,743,861 979,819 418,500 226,037

1981 3,443,405 1,790,521 998,315 424,410 230,159

1986 3,540,643 1,852,649 1,020,577 431,409 236,008

1991 3,525,719 1,860,949 1,009,533 423,031 232,206

1996 3,626,087 1,924,702 1,033,903 433,231 234,251

2002 3,917,203 2,105,579 1,100,614 464,296 246,714

2006 4,239,848 2,295,123 1,173,340 504,121 267,264

2011 4,588,252 2,504,814 1,246,088 542,547 294,803

Source: CSO

Statistical Yearbook of Ireland 7

-50

-30

-10

10

30

50

70

90

26-36

36-46

46-51

51-56

56-61

61-66

66-71

71-79

79-81

81-86

86-91

91-96

96-02

02-06

06-11

Thousands

Intercensal period

Components of population changes

Natural increase

Change in population

Estimated net migration

Table 1.2 Average annual births, deaths, natural increase and estimated net migration for eachintercensal period

Thousands

Period Total births Total deathsNatural

increaseChange in

populationEstimated net

migration

1926-1936 58 42 16 0 -17

1936-1946 60 43 17 -1 -19

1946-1951 66 40 26 1 -24

1951-1956 63 36 27 -12 -39

1956-1961 61 34 26 -16 -42

1961-1966 63 33 29 13 -16

1966-1971 63 33 30 19 -11

1971-1979 69 33 35 49 14

1979-1981 73 33 40 38 -3

1981-1986 67 33 34 19 -14

1986-1991 56 32 24 -3 -27

1991-1996 50 31 18 20 2

1996-2002 54 31 23 49 26

2002-2006 61 28 33 81 48

2006-2011 73 28 45 69 24

Source: CSO

8 Statistical Yearbook of Ireland

Table 1.3 Population by province, county and city, 2011

Change in population

2006-2011

Province, county or city Persons Males Females Actual %

Leinster 2,504,814 1,233,352 1,271,462 209,691 9.1

Carlow 54,612 27,431 27,181 4,263 8.5

Dublin 1,273,069 619,902 653,167 85,893 7.2

Dublin City 527,612 257,303 270,309 21,401 4.2

Dún Laoghaire-Rathdown 206,261 98,567 107,694 12,223 6.3

Fingal 273,991 134,488 139,503 33,999 14.2

South Dublin 265,205 129,544 135,661 18,270 7.4

Kildare 210,312 104,658 105,654 23,977 12.9

Kilkenny 95,419 47,788 47,631 7,861 9.0

Laois 80,559 40,587 39,972 13,500 20.1

Longford 39,000 19,649 19,351 4,609 13.4

Louth 122,897 60,763 62,134 11,630 10.5

Meath 184,135 91,910 92,225 21,304 13.1

Offaly 76,687 38,430 38,257 5,819 8.2

Westmeath 86,164 42,783 43,381 6,818 8.6

Wexford 145,320 71,909 73,411 13,571 10.3

Wicklow 136,640 67,542 69,098 10,446 8.3

Munster 1,246,088 620,260 625,828 72,748 6.2

Clare 117,196 58,298 58,898 6,246 5.6

Cork 519,032 257,470 261,562 37,737 7.8

Cork City 119,230 58,812 60,418 -188 -0.2

Cork County 399,802 198,658 201,144 37,925 10.5

Kerry 145,502 72,629 72,873 5,667 4.1

Limerick 191,809 95,815 95,994 7,754 4.2

Limerick City 57,106 27,947 29,159 -2,684 -4.5

Limerick County 134,703 67,868 66,835 10,438 8.4

North Tipperary 70,322 35,340 34,982 4,299 6.5

South Tipperary 88,432 44,244 44,188 5,211 6.3

Waterford 113,795 56,464 57,331 5,834 5.4

Waterford City 46,732 22,921 23,811 984 2.2

Waterford County 67,063 33,543 33,520 4,850 7.8

Connacht 542,547 271,110 271,437 38,426 7.6

Galway 250,653 124,758 125,895 18,983 8.2

Galway City 75,529 36,514 39,015 3,115 4.3

Galway County 175,124 88,244 86,880 15,868 10.0

Leitrim 31,798 16,144 15,654 2,848 9.8

Mayo 130,638 65,420 65,218 6,799 5.5

Roscommon 64,065 32,353 31,712 5,297 9.0

Sligo 65,393 32,435 32,958 4,499 7.4

Ulster (part) 294,803 147,977 146,826 27,539 10.3

Cavan 73,183 37,013 36,170 9,180 14.3

Donegal 161,137 80,523 80,614 13,873 9.4

Monaghan 60,483 30,441 30,042 4,486 8.0

TOTAL 4,588,252 2,272,699 2,315,553 348,404 8.2

Source: CSO

Statistical Yearbook of Ireland 9

10 Statistical Yearbook of Ireland

Table 1.4 Population by sex and age group for census years

Thousands

Age group 1979 1981 1986 1991 1996 2002 2006 2011

Persons 0-4 343.5 353.0 324.1 273.7 250.4 277.6 302.3 356.3

5-9 350.1 349.5 350.7 318.5 282.9 264.1 288.3 320.8

10-14 336.3 341.2 350.0 348.3 326.1 285.7 273.9 302.5

15-19 317.4 326.4 331.1 335.0 339.5 313.2 290.3 283.0

20-24 266.3 276.1 286.4 266.6 293.4 328.3 342.5 297.2

25-29 239.4 246.1 258.4 246.3 259.0 312.7 373.1 361.1

30-34 220.1 232.0 242.7 249.1 260.9 304.7 349.4 393.9

35-39 178.5 193.8 229.7 237.9 255.7 290.9 322.1 364.3

40-44 159.4 165.9 191.8 225.7 240.4 272.0 301.3 330.8

45-49 152.4 151.9 161.7 187.8 225.4 249.6 274.7 305.2

50-54 151.7 149.7 147.5 156.8 186.6 230.8 247.1 274.4

55-59 154.1 149.6 142.2 142.5 153.8 197.3 225.3 244.5

60-64 137.7 139.3 140.0 134.6 137.9 154.3 181.7 218.8

65-69 133.8 133.9 129.5 130.8 126.8 133.5 143.4 173.6

70-74 98.3 103.1 111.0 109.3 112.5 112.1 119.2 131.2

75-79 68.9 68.5 75.5 84.1 84.1 89.8 92.5 102.0

80-84 38.0 40.5 42.9 49.3 55.8 58.9 64.9 70.1

85 and over 22.5 23.0 25.5 29.4 34.7 41.7 48.1 58.4

Total 3,368.2 3,443.4 3,540.6 3,525.7 3,626.1 3,917.2 4,239.8 4,588.3

Males 0-4 175.6 181.0 166.4 140.6 128.7 142.0 154.6 182.1

5-9 179.1 179.1 179.8 163.3 145.3 135.9 148.0 164.0

10-14 172.3 175.3 179.4 178.9 167.4 146.1 140.5 155.1

15-19 162.3 166.7 169.9 171.4 174.0 160.4 148.2 144.3

20-24 135.8 140.4 144.1 136.5 149.1 165.3 172.8 146.6

25-29 121.6 124.4 129.1 120.7 129.4 156.1 189.3 173.7

30-34 112.7 118.3 122.2 123.2 127.7 152.4 177.5 194.8

35-39 91.8 99.3 116.4 118.7 126.1 144.5 163.8 182.2

40-44 81.8 85.3 98.0 113.9 120.1 135.3 151.4 166.3

45-49 77.8 77.8 82.8 95.4 113.8 125.0 138.0 151.5

50-54 75.6 75.3 75.2 79.9 94.8 116.6 124.6 136.7

55-59 76.1 73.3 70.5 71.7 77.8 99.8 113.9 122.1

60-64 67.8 68.0 67.2 65.6 68.7 77.6 91.6 109.9

65-69 65.0 64.3 61.1 61.0 60.3 65.3 70.9 86.3

70-74 45.8 48.4 50.9 49.2 50.1 51.7 56.5 63.5

75-79 29.1 29.2 32.6 35.7 35.2 37.4 40.1 46.6

80-84 14.9 15.4 16.1 19.0 21.1 22.3 24.7 28.4

85 and over 8.1 7.9 8.0 8.9 10.6 12.5 14.8 18.5

Total 1,693.3 1,729.4 1,769.7 1,753.4 1,800.2 1,946.2 2,121.2 2,272.7

Females 0-4 167.8 172.0 157.7 133.2 121.7 135.6 147.7 174.3

5-9 171.1 170.4 170.8 155.2 137.6 128.2 140.3 156.7

10-14 164.0 166.0 170.6 169.4 158.7 139.6 133.4 147.4

15-19 155.1 159.8 161.2 163.6 165.6 152.8 142.0 138.8

20-24 130.5 135.7 142.3 130.1 144.2 163.0 169.7 150.6

25-29 117.8 121.7 129.4 125.7 129.7 156.6 183.8 187.4

30-34 107.4 113.7 120.5 125.9 133.2 152.3 171.9 199.2

35-39 86.7 94.5 113.3 119.2 129.5 146.4 158.3 182.0

40-44 77.6 80.6 93.8 111.8 120.4 136.7 149.9 164.5

45-49 74.7 74.1 79.0 92.3 111.6 124.6 136.8 153.7

50-54 76.1 74.4 72.4 76.9 91.8 114.3 122.5 137.6

55-59 77.9 76.3 71.7 70.9 76.0 94.5 111.4 122.4

60-64 69.9 71.3 72.8 69.0 69.3 76.7 90.2 108.9

65-69 68.8 69.6 68.4 69.8 66.6 68.2 72.5 87.3

70-74 52.5 54.8 60.1 60.1 62.4 60.4 62.6 67.7

75-79 39.7 39.3 42.9 48.4 48.9 52.4 52.3 55.4

80-84 23.1 25.0 26.8 30.3 34.7 36.6 40.2 41.7

85 and over 14.3 15.1 17.4 20.5 24.1 29.2 33.2 39.9

Total 1,674.9 1,714.1 1,771.0 1,772.3 1,825.9 1,971.0 2,118.7 2,315.6

Source: CSO

Statistical Yearbook of Ireland 11

50 40 30 20 10 0 10 20 30 40 50

0

10

20

30

40

50

60

70

80

90

100

110

Thousands

Population by sex and age 2011

Males Females

12 Statistical Yearbook of Ireland

Table 1.5 Estimated annual population by sex and age group

Thousands

Age group 2006 2007 2008 2009 2010 2011 2012

Persons 0-4 302.3 310.5 324.0 335.2 347.0 356.0 364.6

5-9 288.5 297.2 306.2 310.7 314.6 319.6 324.8

10-14 274.2 276.5 283.1 290.5 296.1 301.0 305.4

15-19 290.9 291.4 295.6 294.3 289.4 281.0 275.7

20-24 347.5 371.7 373.6 354.4 326.3 298.6 277.7

25-29 375.2 399.8 408.3 400.6 381.6 362.9 341.2

30-34 347.9 361.3 369.5 374.5 381.2 393.4 392.3

35-39 320.4 335.3 348.6 356.3 359.7 363.1 364.3

40-44 299.8 308.1 313.6 316.7 321.8 329.3 335.7

45-49 273.8 281.2 288.5 295.6 300.9 304.1 308.1

50-54 246.4 253.2 258.0 262.3 267.4 273.7 278.2

55-59 223.9 227.9 232.6 235.7 239.6 243.4 248.0

60-64 179.8 190.7 199.8 207.7 214.0 217.1 220.0

65-69 141.2 144.1 149.8 156.6 163.5 172.1 181.5

70-74 117.5 119.5 121.7 124.6 127.9 130.1 132.7

75-79 91.4 92.5 94.5 96.8 99.1 101.4 103.6

80-84 64.4 65.6 65.9 66.9 68.4 69.8 71.0

85 and over 47.8 49.4 51.9 54.0 56.1 58.2 60.5

Total 4,232.9 4,375.8 4,485.1 4,533.4 4,554.8 4,574.9 4,585.4

Males 0-4 154.7 159.4 165.9 171.4 177.6 182.0 186.0

5-9 148.1 151.9 156.3 158.5 160.8 163.5 166.1

10-14 140.7 141.9 145.3 149.2 152.1 154.5 156.4

15-19 148.7 147.5 149.6 150.3 147.7 143.7 141.3

20-24 175.5 187.6 186.5 173.5 160.1 148.6 138.6

25-29 190.2 202.6 204.7 198.4 186.1 175.1 163.5

30-34 176.4 184.6 186.9 188.1 189.8 194.9 191.3

35-39 162.8 171.3 177.6 180.3 181.0 181.9 181.5

40-44 150.4 154.9 157.5 159.5 162.2 165.9 168.5

45-49 137.4 141.2 144.5 147.9 149.8 151.3 153.1

50-54 124.1 127.4 129.5 131.6 133.7 136.7 138.2

55-59 113.2 115.2 117.3 118.7 120.3 121.8 123.6

60-64 90.6 96.1 101.0 104.9 107.6 109.2 110.0

65-69 69.9 71.9 74.4 78.0 81.5 85.6 90.6

70-74 55.8 56.9 58.1 59.8 61.8 62.9 64.4

75-79 39.7 40.8 42.4 43.9 45.1 46.3 47.6

80-84 24.5 25.0 25.3 26.3 27.3 28.3 29.4

85 and over 14.8 15.2 15.9 16.8 17.7 18.4 19.4

Total 2,117.3 2,191.3 2,238.6 2,257.3 2,262.2 2,270.5 2,269.6

Females 0-4 147.7 151.1 158.1 163.8 169.4 174.1 178.6

5-9 140.4 145.4 150.0 152.2 153.8 156.2 158.7

10-14 133.5 134.6 137.9 141.2 144.0 146.6 149.0

15-19 142.2 144.0 146.0 143.9 141.7 137.4 134.4

20-24 172.0 184.1 187.1 180.9 166.2 149.9 139.2

25-29 185.0 197.2 203.6 202.1 195.6 187.8 177.7

30-34 171.5 176.8 182.6 186.4 191.4 198.5 201.0

35-39 157.7 164.0 171.0 176.0 178.7 181.2 182.9

40-44 149.3 153.2 156.1 157.3 159.6 163.4 167.1

45-49 136.4 140.1 143.9 147.7 151.1 152.9 155.0

50-54 122.3 125.8 128.5 130.7 133.7 137.1 140.0

55-59 110.7 112.7 115.3 117.0 119.3 121.6 124.3

60-64 89.1 94.5 98.8 102.8 106.4 107.9 109.9

65-69 71.4 72.2 75.4 78.6 82.0 86.5 90.9

70-74 61.7 62.6 63.6 64.8 66.2 67.2 68.3

75-79 51.8 51.6 52.1 52.9 54.0 55.0 55.9

80-84 39.9 40.5 40.5 40.6 41.0 41.5 41.6

85 and over 33.1 34.2 36.0 37.2 38.5 39.8 41.1

Total 2,115.6 2,184.6 2,246.5 2,276.1 2,292.6 2,304.4 2,315.8

Source: CSO

Statistical Yearbook of Ireland 13

Table 1.6 Usual residents by ethnic or cultural background, 2011

Category Thousands %

White

Irish 3,822.0 84.5

Irish Traveller 29.5 0.7

Any other white background 413.0 9.1

Black or black Irish

African 58.7 1.3

Any other black background 6.4 0.1

Asian or Asian Irish

Chinese 17.8 0.4

Any other Asian background 66.9 1.5

Other including mixed background 40.7 0.9

Not stated 70.3 1.6

Total 4,525.3 100.0

Source: CSO

Table 1.7 Travellers by age group, sex and marital status, 2011

Marital status

Age group Total SingleAll

Married

Separated(includingdeserted) Divorced Widowed

Persons 0-4 years 4,683 4,683 – – – –

5-14 years 7,481 7,481 – – – –

15-24 years 6,066 4,475 1,462 119 4 6

25-34 years 4,374 1,386 2,590 320 57 21

35-44 years 3,195 626 2,078 340 71 80

45-54 years 1,968 238 1,301 277 36 116

55-64 years 1,072 110 749 100 13 100

65 years and over 734 60 366 47 7 254

Total 29,573 19,059 8,546 1,203 188 577

Males 0-4 years 2,410 2,410 – – – –

5-14 years 3,814 3,814 – – – –

15-24 years 3,030 2,331 661 37 1 –

25-34 years 2,057 689 1,253 96 18 1

35-44 years 1,484 306 1,044 90 29 15

45-54 years 955 128 676 104 13 34

55-64 years 538 60 399 49 4 26

65 years and over 337 38 206 25 5 63

Total 14,625 9,776 4,239 401 70 139

Females 0-4 years 2,273 2,273 – – – –

5-14 years 3,667 3,667 – – – –

15-24 years 3,036 2,144 801 82 3 6

25-34 years 2,317 697 1,337 224 39 20

35-44 years 1,711 320 1,034 250 42 65

45-54 years 1,013 110 625 173 23 82

55-64 years 534 50 350 51 9 74

65 years and over 397 22 160 22 2 191

Total 14,948 9,283 4,307 802 118 438

Source: CSO

14 Statistical Yearbook of Ireland

Table 1.8 Population aged 15 years and over by marital status

Population Single Married Separated Divorced Widowed

Thousands

1996 2,766.7 1,137.9 1,356.6 78.0 9.8 184.4

2002 3,089.8 1,314.7 1,454.4 98.8 35.1 186.9

2006 3,375.4 1,453.2 1,565.0 107.3 59.5 190.4

2011 3,608.6 1,505.0 1,708.6 116.2 87.8 191.1

Percentage change

1996/2002 11.7 15.5 7.2 26.6 258.2 1.3

2002/2006 9.2 10.5 7.6 8.6 69.8 1.9

2006/2011 6.9 3.6 9.2 8.3 47.6 0.4

Source: CSO

Statistical Yearbook of Ireland 15

0

10

20

30

40

50

60

70

80

90

100

110

120

Males Females Males Females Males Females Males Females

1996 2002 2006 2011

Population(Thousands)

Separated and divorced by sex

Separated

Divorced

Table 1.9 Persons usually resident in the State on Census Night, by place of birth and age group, 2011

Place of Birth Total 0-14 years 15-24 years 25-44 years 45-64 years 65 years and over

Ireland (Republic) 3,758,511 880,170 461,096 1,048,018 876,839 492,388

County of usual residence 2,825,408 731,189 367,727 736,424 632,325 357,743

Other county 933,103 148,981 93,369 311,594 244,514 134,645

Outside Ireland (Republic) 766,770 93,822 104,375 381,957 150,293 36,323

EU 555,594 61,775 71,901 270,629 119,875 31,414

Northern Ireland 58,470 7,808 4,840 19,972 17,235 8,615

England and Wales 212,286 22,045 30,250 74,531 68,116 17,344

Scotland 17,871 1,250 1,383 6,667 6,230 2,341

Austria 708 91 96 343 126 52

Belgium 1,479 257 237 621 274 90

Bulgaria 1,783 131 211 1,136 291 14

Cyprus 260 37 30 94 82 17

Czech Republic 5,494 470 724 3,711 532 57

Denmark 885 81 148 442 158 56

Estonia 2,479 224 377 1,563 303 12

Finland 873 60 113 553 126 21

France 10,070 871 1,886 6,009 1,131 173

Germany 12,980 1,247 1,765 6,070 2,881 1,017

Greece 575 49 82 353 76 15

Hungary 7,413 705 741 5,338 577 52

Italy 7,146 499 594 4,849 920 284

Latvia 19,989 2,643 3,450 11,130 2,669 97

Lithuania 34,847 4,611 5,658 20,381 4,075 122

Luxembourg 141 46 49 35 8 3

Malta 336 34 23 122 123 34

Netherlands 4,499 565 606 1,667 1,255 406

Poland 115,193 14,172 12,416 79,125 9,218 262

Portugal 2,246 307 227 1,416 264 32

Romania 17,995 1,755 3,379 11,191 1,580 90

Slovakia 10,695 869 1,457 7,450 884 35

Slovenia 190 13 22 123 28 4

Spain 7,003 800 801 4,794 492 116

Sweden 1,688 135 336 943 221 53

Other European Countries 22,427 3,295 2,680 12,568 3,511 373

Russian Federation 5,936 1,640 580 2,608 1,042 66

Ukraine 4,123 401 399 2,664 634 25

Moldova, Republic of 3,421 320 486 2,221 387 7

Other 8,947 934 1,215 5,075 1,448 275

Africa 54,419 7,202 8,250 30,409 7,801 757

South Africa 8,116 970 1,327 3,974 1,518 327

Nigeria 19,780 3,248 2,712 11,295 2,468 57

Mauritius 2,919 172 598 1,908 218 23

Zimbabwe 2,790 350 435 1,412 525 68

Congo 2,276 304 494 1,177 283 18

Other 18,538 2,158 2,684 10,643 2,789 264

Asia 79,021 11,172 10,843 46,144 9,721 1,141

China 11,458 604 2,304 7,763 694 93

India 17,856 2,969 1,096 11,918 1,500 373

Philippines 13,833 2,219 1,251 7,790 2,517 56

Pakistan 8,329 1,026 1,135 5,003 1,094 71

Malaysia 3,782 242 837 2,094 539 70

Bangladesh 2,920 254 351 2,109 198 8

Hong Kong 1,705 81 251 565 741 67

Other 19,138 3,777 3,618 8,902 2,438 403

America 47,116 8,848 9,235 18,449 8,186 2,398

USA 27,726 6,969 5,397 7,518 5,827 2,015

Brazil 9,298 690 2,232 5,781 559 36

Canada 4,809 417 888 2,311 1,010 183

Other 5,283 772 718 2,839 790 164

Australia 5,964 1,215 1,265 2,544 777 163

New Zealand 2,052 299 176 1,105 398 74

Other Oceanic countries 177 16 25 109 24 3

TOTAL 4,525,281 973,992 565,471 1,429,975 1,027,132 528,711

Source: CSO

16 Statistical Yearbook of Ireland

Table 1.10 Persons usually resident and present in the State on Census Night, by nationality andage group, 2011

Nationality Total 0-14 years 15-24 years 25-44 years 45-64 years65 years and

over

Total Irish 3,927,143 877,898 491,177 1,119,980 936,439 501,649

Irish 3,871,238 858,005 483,607 1,106,107 925,679 497,840

Irish-English 13,543 2,560 1,897 3,662 3,751 1,673

Irish-American 14,699 4,491 2,523 3,201 3,012 1,472

Irish-European 9,937 5,927 1,097 2,087 653 173

Irish-Other 17,726 6,915 2,053 4,923 3,344 491

Non-Irish 544,357 78,569 68,187 296,404 82,052 19,145

EU 386,764 53,469 45,189 206,417 64,824 16,865

Austria 720 84 98 396 121 21

Belgium 1,071 114 103 542 250 62

Bulgaria 1,759 184 201 1,092 267 15

Cyprus 83 10 12 42 14 5

Czech Republic 5,451 587 702 3,629 510 23

Denmark 801 73 113 414 159 42

Estonia 2,560 369 355 1,490 329 17

Finland 868 70 109 563 112 14

France 9,749 778 1,660 6,047 1,128 136

Germany 11,305 1,074 1,243 5,576 2,580 832

Greece 516 33 35 357 76 15

Hungary 8,034 979 786 5,608 639 22

Italy 7,656 569 615 5,277 966 229

Latvia 20,593 3,660 3,330 10,804 2,703 96

Lithuania 36,683 6,424 5,565 20,338 4,227 129

Luxembourg 35 2 5 19 7 2

Malta 180 22 16 86 43 13

Netherlands 4,313 496 372 1,718 1,335 392

Poland 122,585 22,204 12,357 78,742 9,063 219

Portugal 2,739 331 274 1,769 334 31

Romania 17,304 2,450 2,849 10,539 1,390 76

Slovakia 10,801 1,136 1,434 7,361 843 27

Slovenia 192 23 20 124 22 3

Spain 6,794 532 756 4,924 492 90

Sweden 1,713 127 313 992 231 50

UK 112,259 11,138 11,866 37,968 36,983 14,304

Rest of Europe 16,307 2,110 2,005 9,783 2,189 220

Russia 3,896 617 508 2,099 638 34

Ukraine 3,343 385 312 2,190 449 7

Other 9,068 1,108 1,185 5,494 1,102 179

Africa 41,642 7,542 6,313 23,407 4,138 242

Nigeria 17,642 3,752 2,415 9,701 1,734 40

South Africa 4,872 664 705 2,608 799 96

Mauritius 2,844 232 583 1,851 173 5

Other 16,284 2,894 2,610 9,247 1,432 101

Asia 65,579 10,406 8,961 39,992 5,833 387

India 16,986 3,922 1,018 11,087 917 42

Philippines 12,791 2,421 1,180 6,993 2,158 39

China 10,896 580 2,258 7,401 593 64

Pakistan 6,847 1,087 907 4,259 547 47

Malaysia 3,295 338 812 1,867 256 22

Other 14,764 2,058 2,786 8,385 1,362 173

America 24,884 3,638 4,655 12,002 3,549 1,040

USA 11,015 2,416 1,675 3,715 2,369 840

Brazil 8,704 709 2,113 5,371 476 35

Canada 2,384 200 458 1,168 429 129

Other 2,781 313 409 1,748 275 36

Statistical Yearbook of Ireland 17

Table 1.10 Persons usually resident and present in the State on Census Night, by nationality andage group, 2011 (continued)

Nationality Total 0-14 years 15-24 years 25-44 years 45-64 years65 years and

over

Australia 2,849 373 311 1,576 499 90

New Zealand 1,394 163 94 882 220 35

Other nationalities 4,098 630 571 1,974 691 232

Multi-nationality 840 238 88 371 109 34

No nationality 1,487 809 110 363 154 51

Not stated 52,294 16,716 5,997 13,228 8,487 7,866

TOTAL 4,525,281 973,992 565,471 1,429,975 1,027,132 528,711

Source: CSO

Table 1.11 Persons usually resident and present in the State on Census Night, by religion andnationality, 2011

Religious denomination

Nationality

Total

persons Catholic

Church of

Ireland

(including

Protest-

ant)

Other

Christian

religions

nes

Presby-

terian

Muslim

(Islamic)

Ortho-

dox

Apostolic

or

Pente-

costal

Other

stated

religions

No

religion

Not

stated

Irish 3,927,143 3,525,573 93,056 24,023 14,348 18,223 8,465 5,520 34,867 173,180 29,888

Non-Irish 544,357 282,799 30,464 15,258 8,311 29,143 34,854 8,182 40,227 82,194 12,925

UK 112,259 49,761 21,477 2,112 3,619 823 271 183 6,598 25,620 1,795

Rest of EU 274,505 184,066 4,228 3,165 1,494 1,445 22,108 2,320 11,845 37,463 6,371

Rest of Europe 16,307 2,222 174 300 67 2,049 8,901 37 621 1,478 458

Africa 41,642 9,770 2,571 5,506 1,758 8,777 815 5,013 4,967 1,154 1,311

Asia 65,579 19,420 783 2,556 349 15,376 2,299 364 12,620 10,179 1,633

America 24,884 13,706 628 1,325 743 170 154 166 2,891 4,188 913

Othernationalities 8,341 3,549 563 267 255 427 268 84 588 1,907 433

Not stated,incl. nonationality 53,781 22,815 925 371 176 764 684 174 561 1,456 25,855

TOTAL 4,525,281 3,831,187 124,445 39,652 22,835 48,130 44,003 13,876 75,655 256,830 68,668

Source: CSO

18 Statistical Yearbook of Ireland

Table 1.12 Irish speakers aged 3 years and over, by frequency of speaking Irish, age group andsex, 2011

Daily within education system Outside education system

Age groupTotal

persons

Speaks withineducation system

only

Speaks Irish alsooutside education

system Daily WeeklyLess

often NeverNot

stated

Persons

3-4 18,740 12,434 1,062 1,334 1,504 1,817 266 323

5-9 198,940 169,313 8,603 1,801 6,945 8,562 2,409 1,307

10-14 219,292 180,926 9,503 1,774 8,107 11,902 5,820 1,260

15-19 178,751 103,060 7,897 2,476 9,137 31,744 23,171 1,266

20-24 128,613 8,370 1,542 3,682 7,846 56,583 49,232 1,358

25-34 260,880 17,964 2,744 8,282 14,720 109,836 105,072 2,262

35-44 234,404 10,391 2,582 11,190 17,927 105,328 85,136 1,850

45-54 196,503 9,811 2,301 8,347 13,677 96,238 64,441 1,688

55-64 164,361 5,083 1,309 7,038 10,921 88,106 50,166 1,738

65 years and over 173,953 1,829 937 9,630 12,348 97,344 49,506 2,359

Total 1,774,437 519,181 38,480 55,554 103,132 607,460 435,219 15,411

Males

3-4 8,702 5,765 486 624 666 875 125 161

5-9 98,406 83,727 4,227 851 3,402 4,319 1,238 642

10-14 107,669 88,159 4,712 835 4,056 6,124 3,153 630

15-19 83,888 47,171 3,745 1,169 4,224 14,966 11,952 661

20-24 56,557 1,988 521 1,750 3,335 25,064 23,190 709

25-34 109,371 2,923 772 3,574 6,218 48,295 46,396 1,193

35-44 99,070 1,770 730 4,526 7,056 45,744 38,273 971

45-54 85,819 1,807 745 4,035 5,982 43,359 28,987 904

55-64 76,332 1,451 590 3,688 5,384 41,418 22,895 906

65 years and over 75,036 790 437 4,841 5,813 42,461 19,674 1,020

Total 800,850 235,551 16,965 25,893 46,136 272,625 195,883 7,797

Females

3- 4 10,038 6,669 576 710 838 942 141 162

5-9 100,534 85,586 4,376 950 3,543 4,243 1,171 665

10-14 111,623 92,767 4,791 939 4,051 5,778 2,667 630

15-19 94,863 55,889 4,152 1,307 4,913 16,778 11,219 605

20-24 72,056 6,382 1,021 1,932 4,511 31,519 26,042 649

25-34 151,509 15,041 1,972 4,708 8,502 61,541 58,676 1,069

35-44 135,334 8,621 1,852 6,664 10,871 59,584 46,863 879

45-54 110,684 8,004 1,556 4,312 7,695 52,879 35,454 784

55-64 88,029 3,632 719 3,350 5,537 46,688 27,271 832

65 years and over 98,917 1,039 500 4,789 6,535 54,883 29,832 1,339

Total 973,587 283,630 21,515 29,661 56,996 334,835 239,336 7,614

Source: CSO

Statistical Yearbook of Ireland 19

Table 1.13 Family units in private households by type of family unit and number of children,2011

Number of children in family units

Type of family unitTotal

familyunits 0 1 2 3 4 5 6

7 ormore

Numberof

children

Husband and wife withoutchildren

All family units 261,652 261,652 – – – – – – – –

All children under 15 years – – – – – – – – – –

All children aged 15 years and over – – – – – – – – – –

Children both under and over 15 years – – – – – – – – – –

Cohabiting couple withoutchildren

All family units 83,292 83,292 – – – – – – – –

All children under 15 years – – – – – – – – – –

All children aged 15 years and over – – – – – – – – – –

Children both under and over 15 years – – – – – – – – – –

Husband and wife with children

All family units 558,682 – 183,971 416,374 346,476 153,212 45,310 14,748 9,223 1,169,314

All children under 15 years 266,969 – 80,072 223,330 168,033 62,544 14,050 3,402 1,542 552,973

All children aged 15 years and over 201,499 – 103,899 134,836 70,788 21,356 4,945 1,254 355 337,433

Children both under and over 15 years 90,214 – – 58,208 107,655 69,312 26,315 10,092 7,326 278,908

Lone mother with children

All family units 186,284 – 106,039 103,138 58,833 25,516 9,580 3,168 1,835 308,109

All children under 15 years 83,476 – 50,550 46,338 21,876 7,588 2,225 600 170 129,347

All children aged 15 years and over 81,206 – 55,489 38,854 14,904 4,180 1,085 264 119 114,895

Children both under and over 15 years 21,602 – – 17,946 22,053 13,748 6,270 2,304 1,546 63,867

Lone father with children

All family units 29,031 – 18,726 14,032 7,095 2,752 845 282 155 43,887

All children under 15 years 6,136 – 3,912 3,190 1,416 500 130 24 14 9,186

All children aged 15 years and over 20,753 – 14,814 9,000 3,354 1,068 205 60 25 28,526

Children both under and over 15 years 2,142 – – 1,842 2,325 1,184 510 198 116 6,175

Cohabiting couple with children

All family units 60,269 – 30,860 38,360 21,006 8,928 3,270 1,320 921 104,665

All children under 15 years 49,005 – 27,050 31,024 14,346 4,980 1,500 528 208 79,636

All children aged 15 years and over 5,717 – 3,810 2,962 984 328 65 18 – 8,167

Children both under and over 15 years 5,547 – – 4,374 5,676 3,620 1,705 774 713 16,862

All family units

All family units 1,179,210 – 339,596 571,904 433,410 190,408 59,005 19,518 12,134 1,625,975

All children under 15 years 405,586 – 161,584 303,882 205,671 75,612 17,905 4,554 1,934 771,142

All children aged 15 years and over 309,175 – 178,012 185,652 90,030 26,932 6,300 1,596 499 489,021

Children both under and over 15 years 119,505 – – 82,370 137,709 87,864 34,800 13,368 9,701 365,812

Source: CSO

20 Statistical Yearbook of Ireland


Recommended