Population, Income, Population, Income, and Expenditures and Expenditures George Haynes George Haynes Doug Young Doug Young Myles Watts Myles Watts Department of Agricultural Economics and Economics Montana State University Support from the Montana Extension Service and the Montana Agricultural Experiment Stations, and the Montana Council for Economic Education February 2008
Transcript
Population, Income, and Population, Income, and ExpendituresExpenditures
George HaynesGeorge HaynesDoug YoungDoug YoungMyles WattsMyles Watts
Department of Agricultural Economics and EconomicsMontana State University
Support from the Montana Extension Service and the Montana Agricultural Experiment Stations, and the Montana Council for
Economic Education
February 2008
Montana Aging
Montana 1930 – 2030
Economic Implications
1-1
Age Distribution
Source: U.S. Census Bureau 1-2
%
Age Distribution 1940-2000
Source: U.S. Census Bureau 1-3
Age Distribution 2000-2030
Source: U.S. Census Bureau 1-4
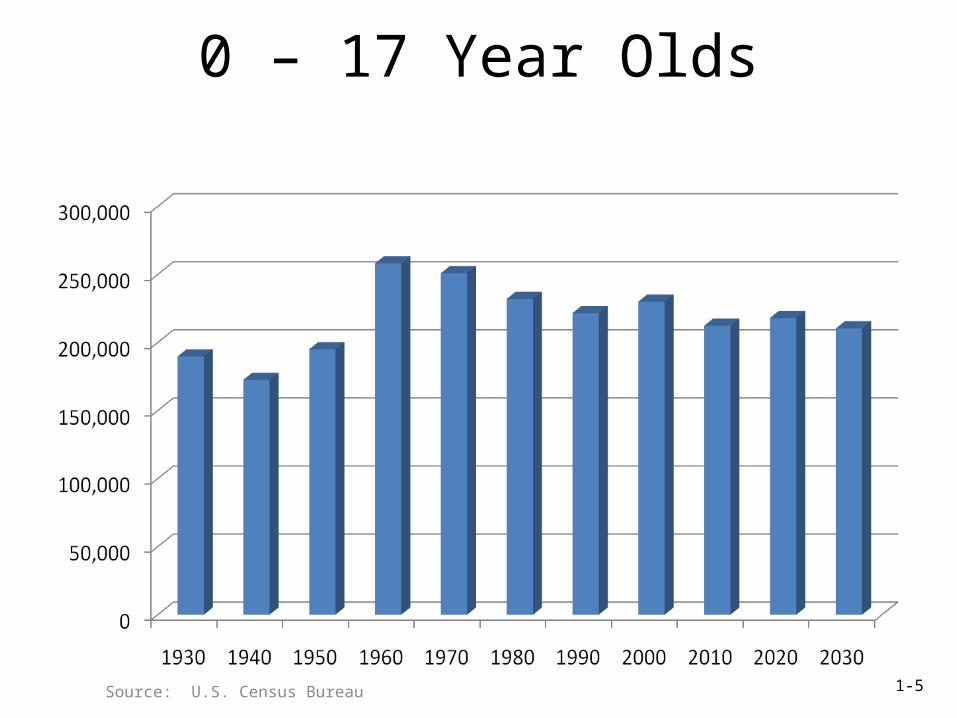
0 – 17 Year Olds
Source: U.S. Census Bureau 1-5
Concern – 65 and older
Source: U.S. Census Bureau 1-6
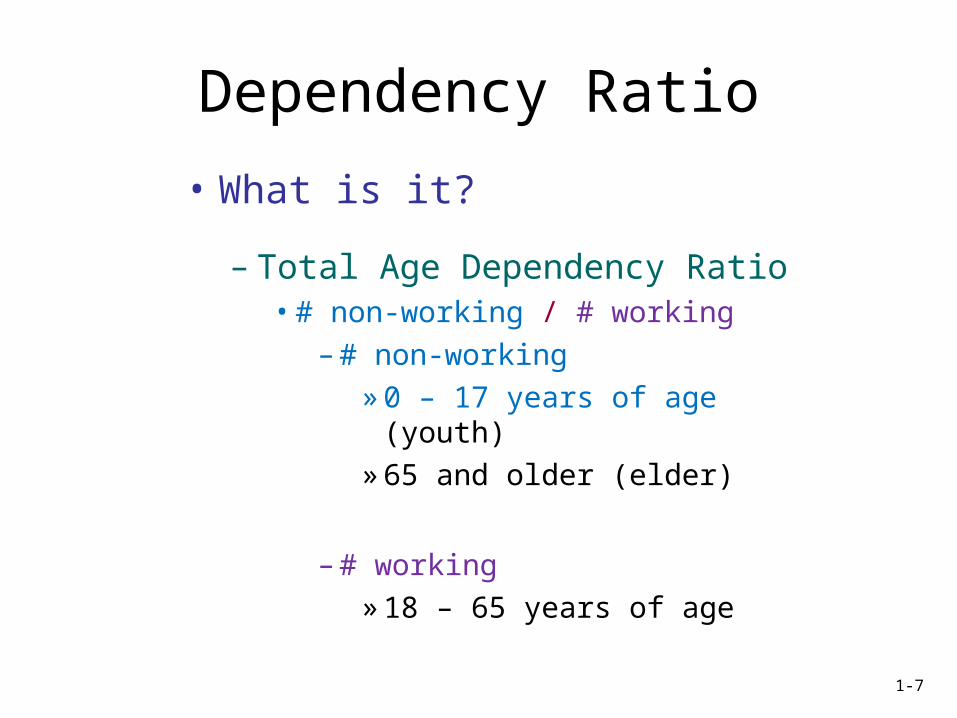
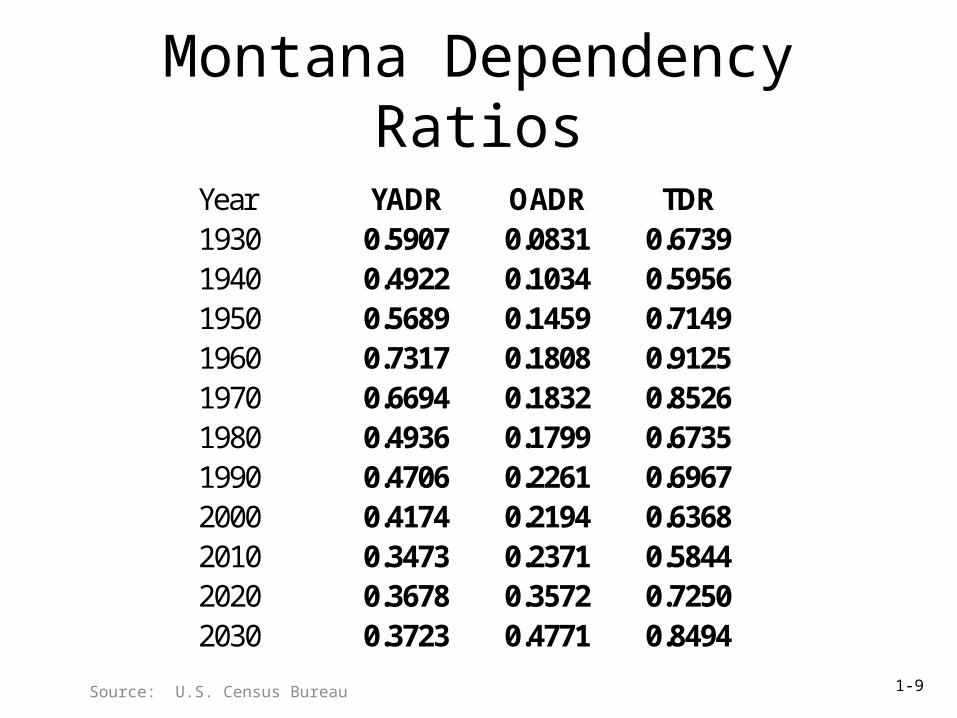
Dependency Ratio
• What is it?
– Total Age Dependency Ratio• # non-working / # working
– # non-working» 0 – 17 years of age (youth)» 65 and older (elder)
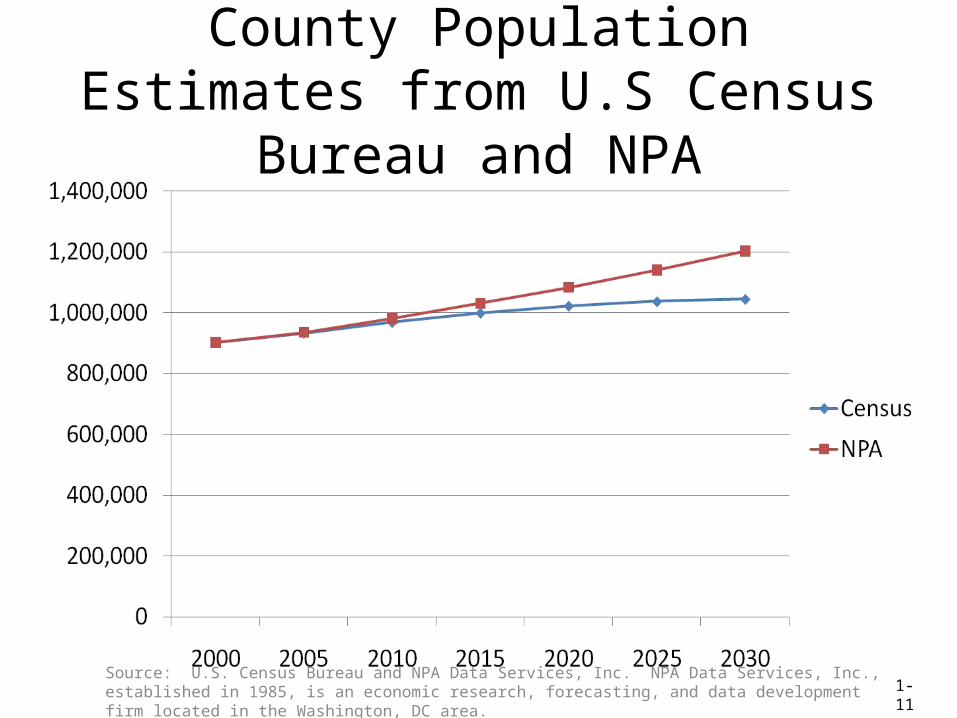
County Population Estimates from U.S Census Bureau and NPA
Source: U.S. Census Bureau and NPA Data Services, Inc. NPA Data Services, Inc., established in 1985, is an economic research, forecasting, and data development firm located in the Washington, DC area.
1-11
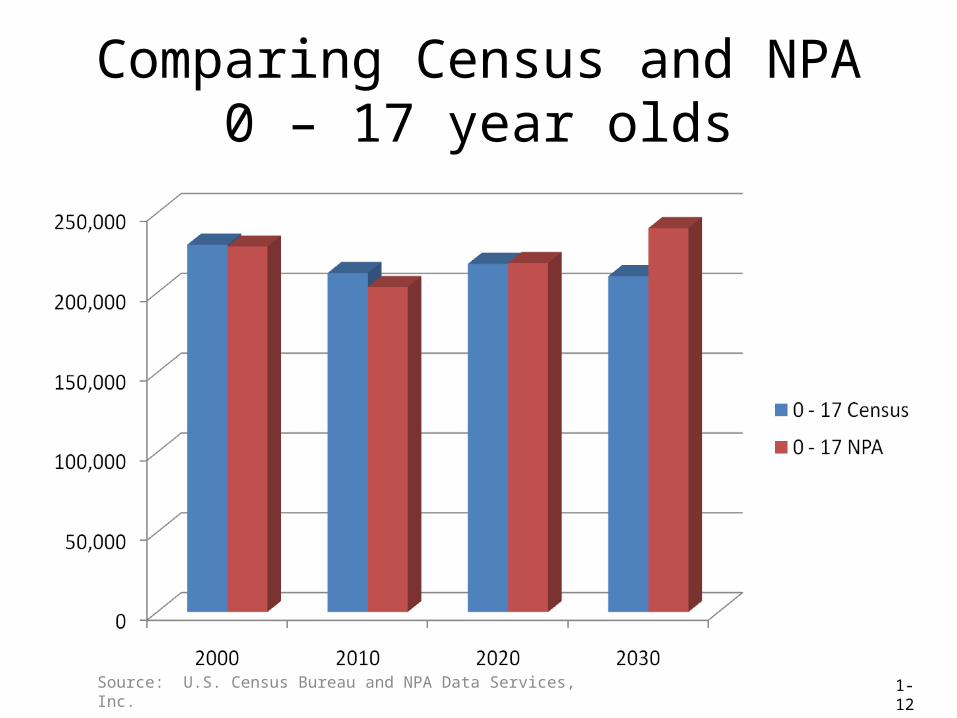
Comparing Census and NPA0 – 17 year olds
Source: U.S. Census Bureau and NPA Data Services, Inc. 1-12
Comparing Census and NPA18 – 64 year olds
Source: U.S. Census Bureau and NPA Data Services, Inc. 1-13
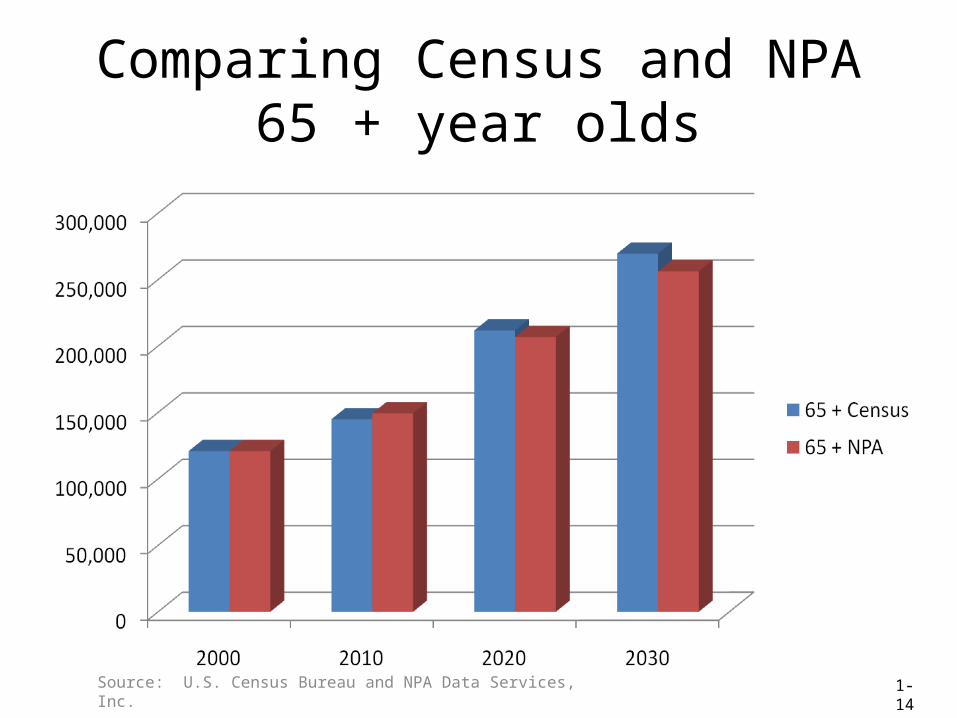
Comparing Census and NPA65 + year olds
Source: U.S. Census Bureau and NPA Data Services, Inc. 1-14
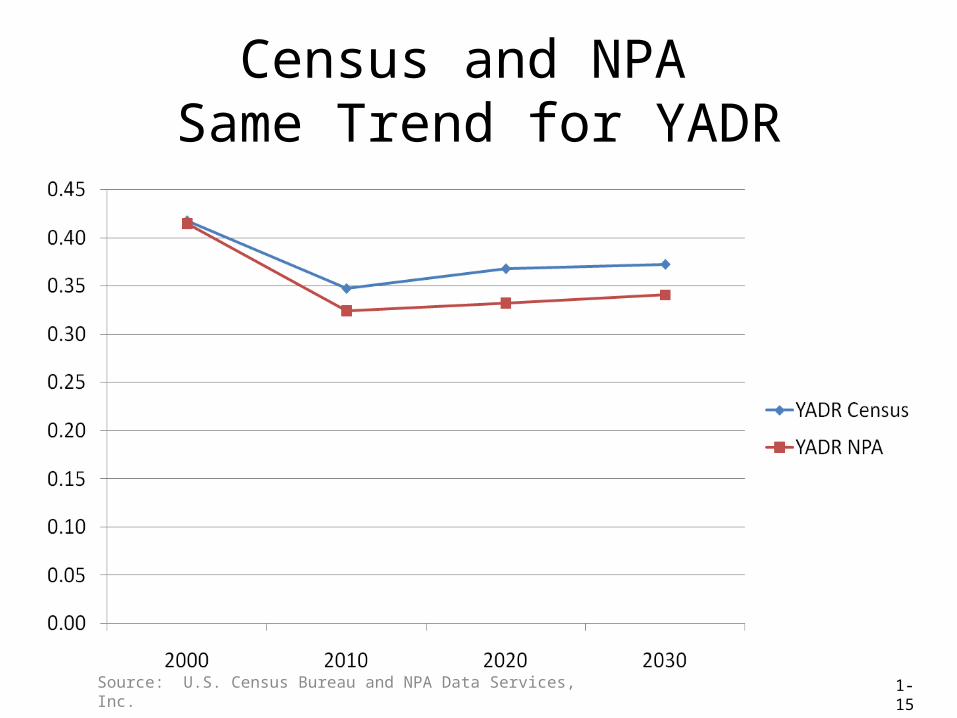
Census and NPA Same Trend for YADR
Source: U.S. Census Bureau and NPA Data Services, Inc. 1-15
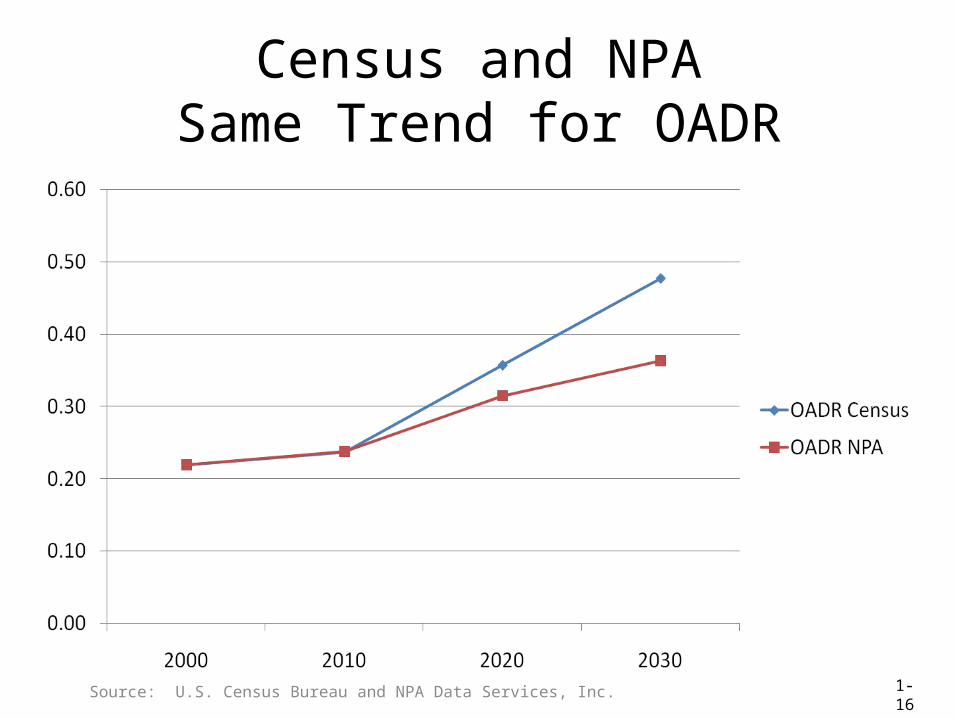
Census and NPASame Trend for OADR
Source: U.S. Census Bureau and NPA Data Services, Inc. 1-16
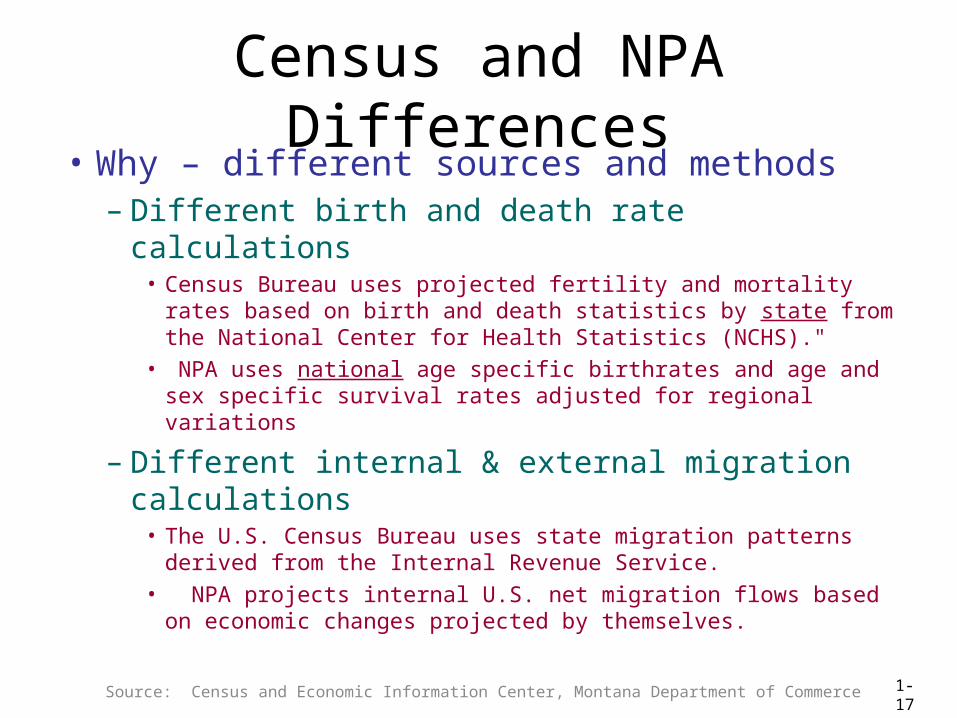
Census and NPA Differences• Why – different sources and methods
– Different birth and death rate calculations• Census Bureau uses projected fertility and mortality rates
based on birth and death statistics by state from the National Center for Health Statistics (NCHS)."
• NPA uses national age specific birthrates and age and sex specific survival rates adjusted for regional variations
– Different internal & external migration calculations
• The U.S. Census Bureau uses state migration patterns derived from the Internal Revenue Service.
• NPA projects internal U.S. net migration flows based on economic changes projected by themselves.
Source: Census and Economic Information Center, Montana Department of Commerce 1-17
Source: NPA Data Services, Inc. 1-18
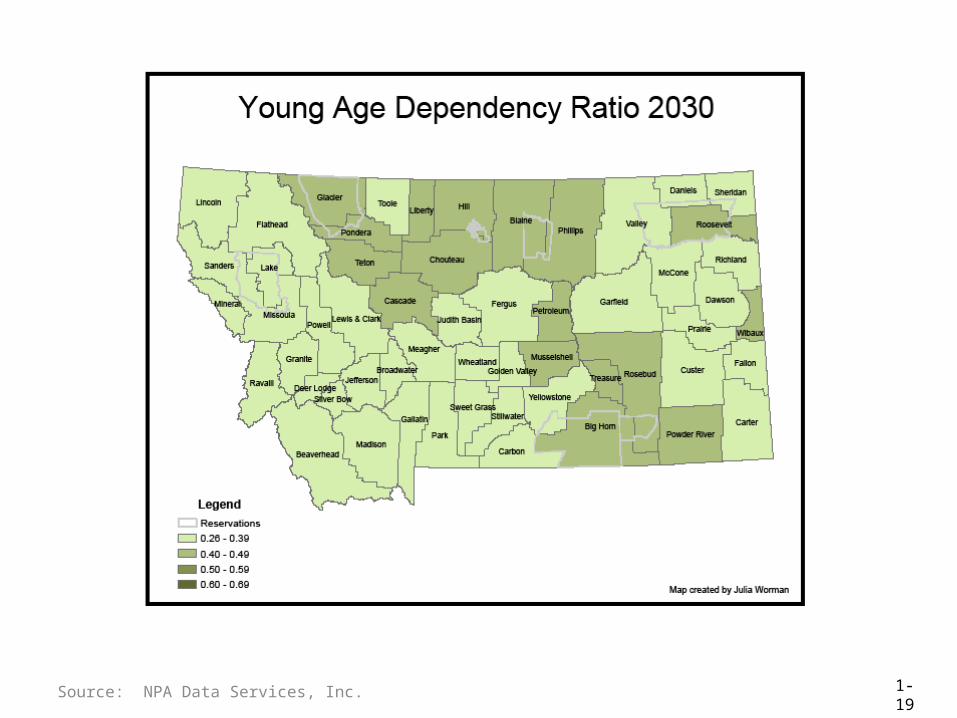
Source: NPA Data Services, Inc. 1-19
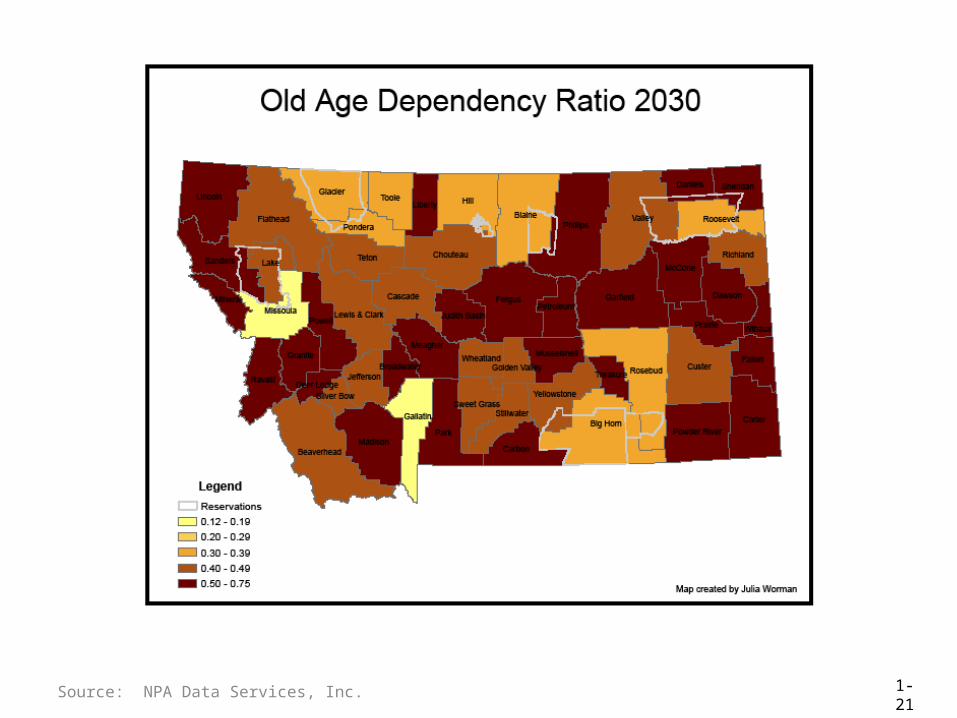
Source: NPA Data Services, Inc. 1-20
Source: NPA Data Services, Inc. 1-21
Implications
• Social Contract– Medicare / Social Security
• Fewer workers supporting more retirees– Reduction in standard living of workers
– Medicaid – taking care of medical expenses for elderly
• Most importantly, Assisted Living and Nursing Homes
1-22
Montana Medicaid Expenditures
• Percentage of State and Federal Medicaid Expenditures
2005 2030– Elderly 24.0% 41.9%
• Amount $161.9 m. $363.1 m.
– Total Medicaid Budget $674.7 m. $866.1 m.• State Share 28.0% ?• Federal Share 72.0% ?
Source: Montana Department of Health and Human Services and U.S. Census Bureau population estimates 1-23
Medicaid Projections
Source: U.S. Census Bureau and Montana Department of Health and Human Services (The Montana Medicaid Program, State Fiscal Years 2005/2006 Report for the 2007 Legislature)
1-24
Base Year - 2005
Medicaid Total MedicaidCategories Expenditures Population per capita
Source: U.S. Census Bureau and Montana Department of Health and Human Services (The Montana Medicaid Program, State Fiscal Years 2005/2006 Report for the 2007 Legislature)
1-25
Projected Year - 2030
Medicaid Total MedicaidCategories Expenditures Population per capita
($ million) % (#) ($)
Aged (65+) 363.1 41.9 269,558 1,347.1
Other 503.0 58.1 775,340 648.8
Total 866.1 100.0 1,044,898 740.9
Assisted Living/Nursing Homes• Assisted Living Facilities – Montana
– 3,597 beds in 2000 (120,949 people 65 +)• Approximately 3 percent of adults over 65 using
Assisted Living Facilities (although, not all adults in Assisted Living Facilities are 65+)
• Nursing Home Facilities – Montana– 7,374 beds in 2000
• Approximately 6 percent of adults over 65 using Nursing Home Facilities (although, not all adults in Nursing Home Facilities are 65+)
Source: Montana Department of Health and Human Services (Nursing Home Bed Need Projections) 1-26
Assisted Living/Nursing Homes
• In 2030 . . . – Assisted Living Facilities
• Need to more than double the number of beds– Over 8,000
– Nursing Home Facilities• Need to more than double the number of beds
– Over 16,000
Source: Based on U.S. Census Bureau population estimates 1-27
Older Working Population
• Wages and Benefits– Willingness to work for less
• Productivity
– Health insurance• Medicare coverage – lowers costs to
business
– Retirement /pensions
1-28
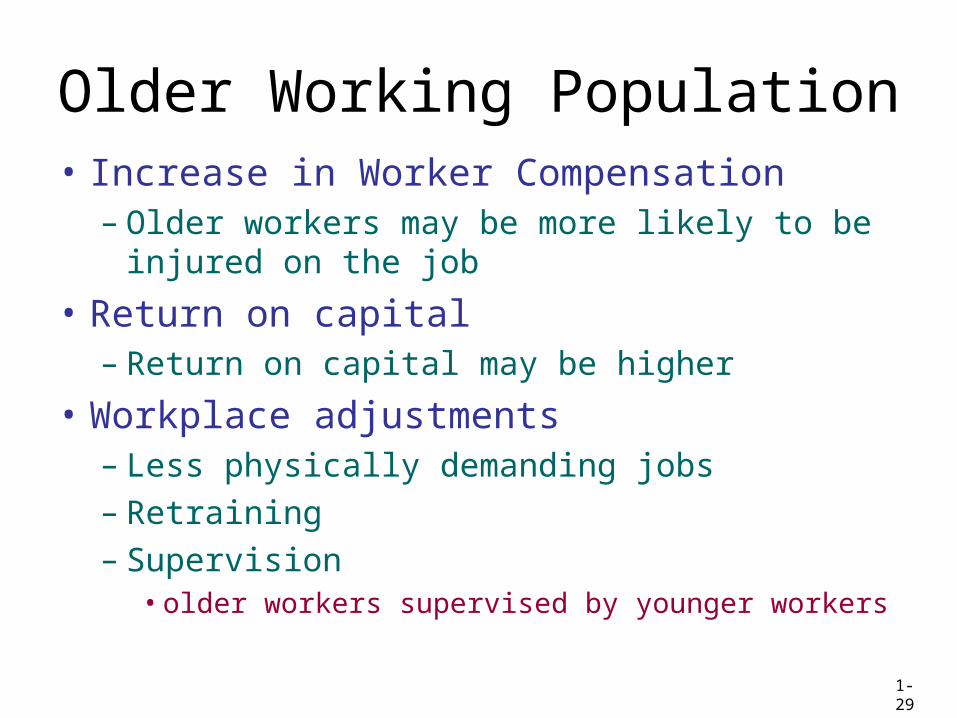
Older Working Population• Increase in Worker Compensation
– Older workers may be more likely to be injured on the job
• Return on capital– Return on capital may be higher
• Workplace adjustments– Less physically demanding jobs– Retraining– Supervision
• older workers supervised by younger workers1-29
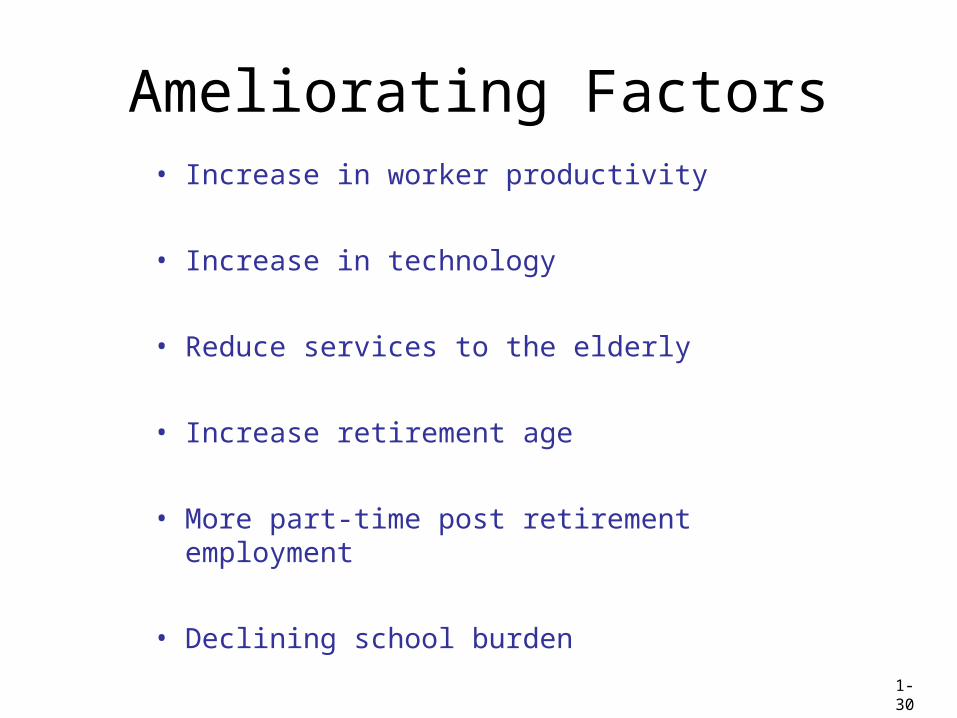
Ameliorating Factors• Increase in worker productivity
• Increase in technology
• Reduce services to the elderly
• Increase retirement age
• More part-time post retirement employment
• Declining school burden1-30
Montana Aging
• Summary– Percentage of people 65+ nearly doubles
between now and 2030 (14% - 26%)– Dependency ratios are increasing
– Issues• Medicaid (nursing home and assisted living care)• Older workers in the workforce• Ameliorating factors
1-31
Questions
???Source: U.S. Census Bureau
Income Before Taxes
Nationally Representative SampleSurvey of Consumer Finances, 2004
Board of Governors of Federal Reserve System
Age is for the head of household
All mean income figures are on a per capita basis
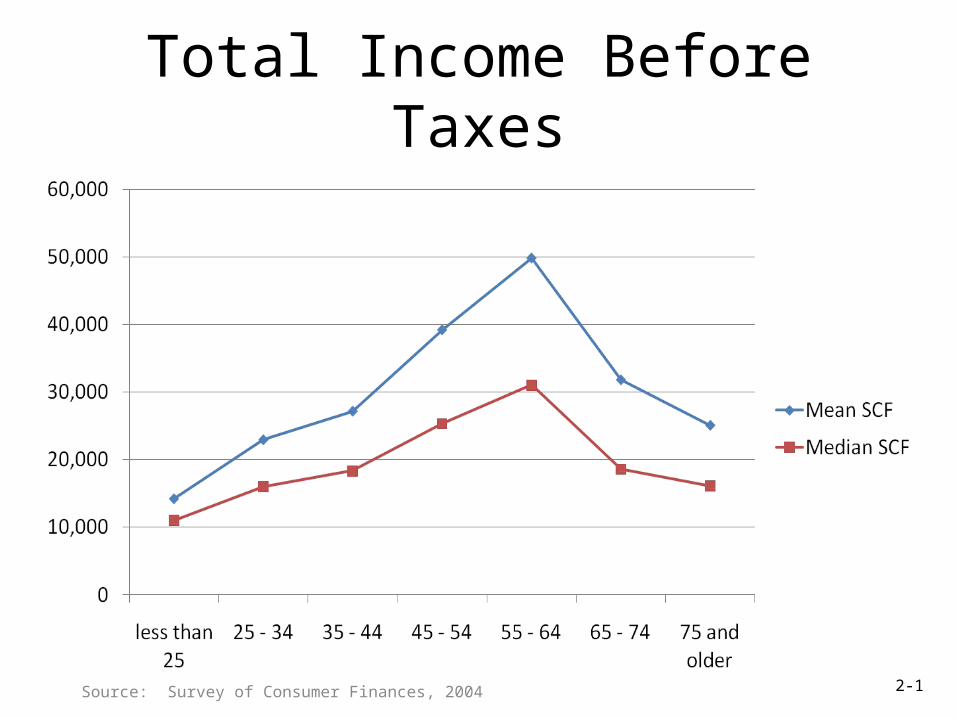
Total Income Before Taxes
Source: Survey of Consumer Finances, 2004 2-1
Wage and SalariesIn total, what was your (family's) annual income from wages and salaries in 2003, before deductions for taxes and
anything else?
Source: Survey of Consumer Finances, 2004 2-2
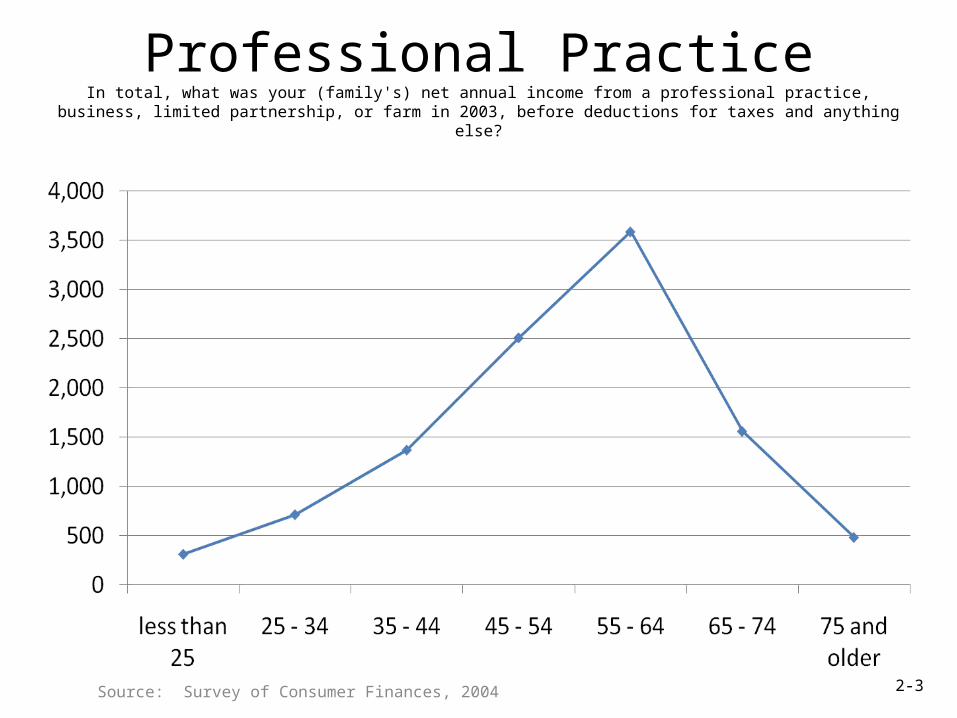
Professional PracticeIn total, what was your (family's) net annual income from a professional practice, business, limited partnership, or farm
in 2003, before deductions for taxes and anything else?
Source: Survey of Consumer Finances, 2004 2-3
Non-Taxable InvestmentsIn total, what was your (family's) annual income from non-taxable investments such as municipal bonds in 2003, before
deductions for taxes and anything else?
Source: Survey of Consumer Finances, 2004 2-4
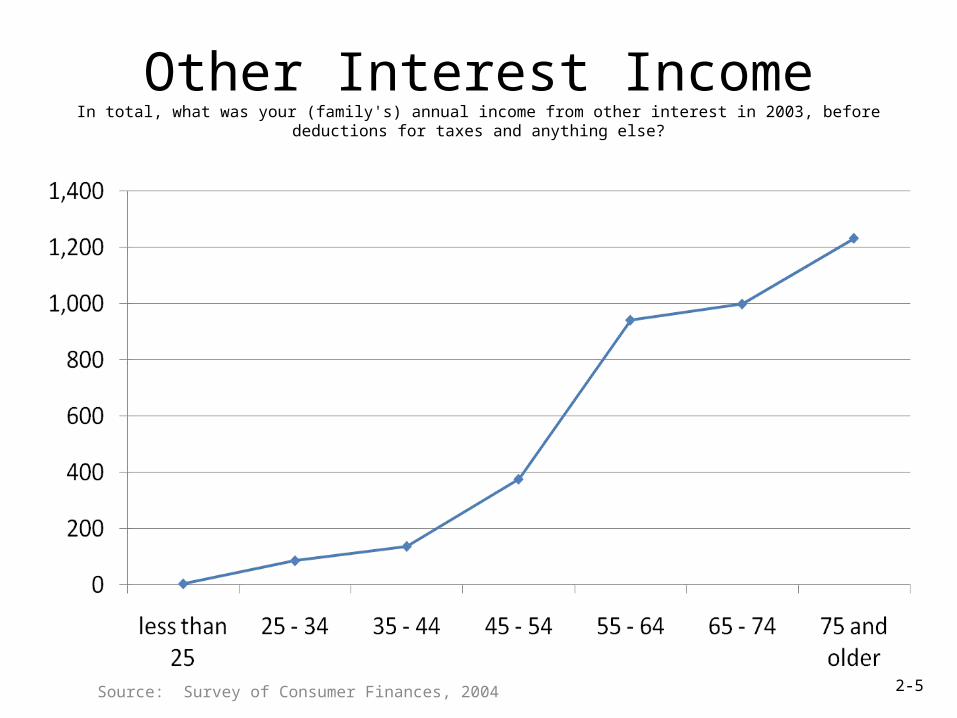
Other Interest IncomeIn total, what was your (family's) annual income from other interest in 2003, before deductions for taxes and anything
else?
Source: Survey of Consumer Finances, 2004 2-5
DividendsIn total, what was your (family's) annual income from dividends in 2003, before deductions for taxes and anything
else?
Source: Survey of Consumer Finances, 2004 2-6
Sales of Stocks, Bonds, Real EstateIn total, what was your (family's) annual income from net gains or losses from mutual funds or from the sale of stocks,
bonds, or real estate in 2003, before deductions for taxes and anything else?
Source: Survey of Consumer Finances, 2004 2-7
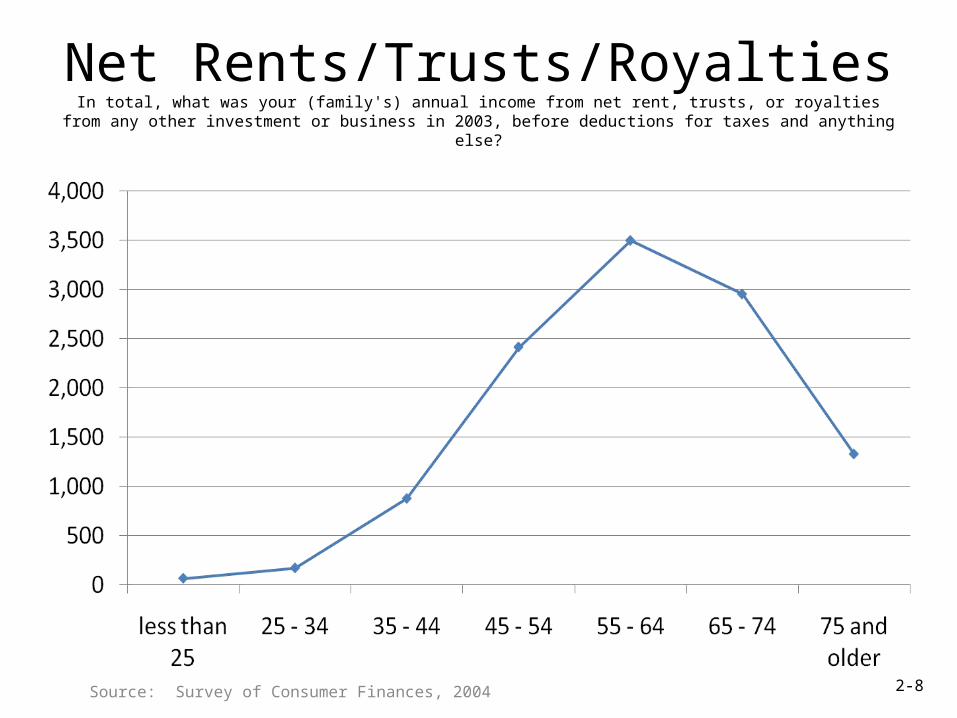
Net Rents/Trusts/RoyaltiesIn total, what was your (family's) annual income from net rent, trusts, or royalties from any other investment or business
in 2003, before deductions for taxes and anything else?
Source: Survey of Consumer Finances, 2004 2-8
Unemployment/Workers CompIn total, what was your (family's) annual income from unemployment or worker's compensation in 2003, before
deductions for taxes and anything else?
Source: Survey of Consumer Finances, 2004 2-9
Child Support/AlimonyIn total, what was your (family's) annual income from child support or alimony which you or your family here received in
2003, before deductions for taxes and anything else?
Source: Survey of Consumer Finances, 2004 2-10
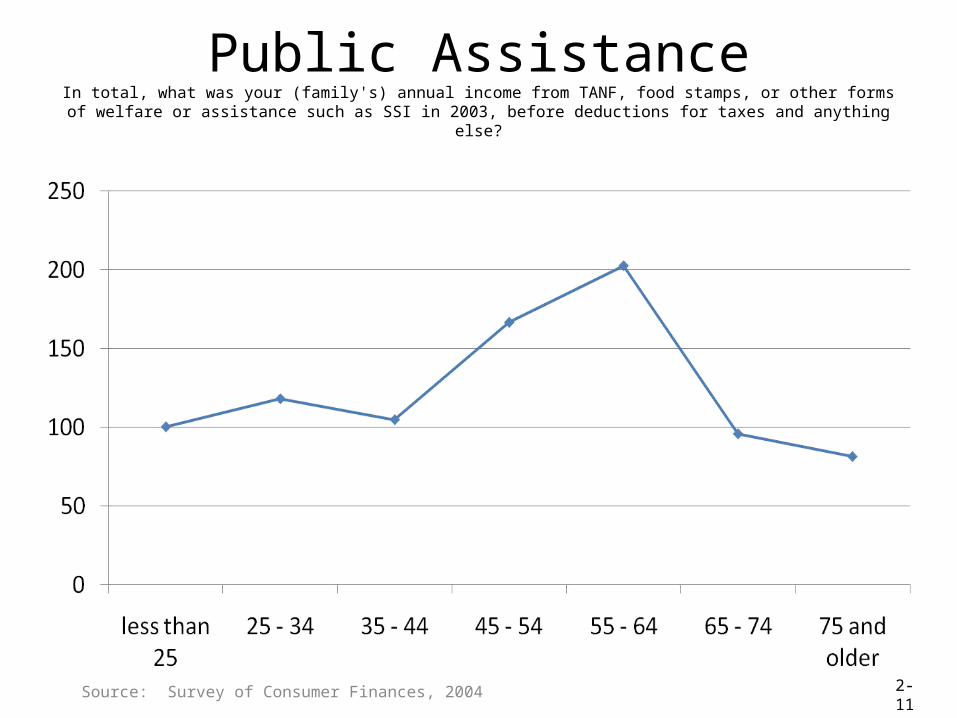
Public AssistanceIn total, what was your (family's) annual income from TANF, food stamps, or other forms of welfare or assistance such
as SSI in 2003, before deductions for taxes and anything else?
Source: Survey of Consumer Finances, 2004 2-11
Social Security/Pensions(Including the retirement income you told me about, in/In) total, what was your (family's) net income from Social
Security or other pensions, annuities, or other disability or retirement programs in 2003, before deductions for taxes and anything else? (Please do not include withdrawals from IRAS, 401(k)s and other such retirement accounts.)
Source: Survey of Consumer Finances, 2004 2-12
Other Income(Other than the pension account or IRA withdrawals you told me about earlier in the interview, in/In) total, what was
your (family's) annual income from any other sources in 2003, before deductions for taxes and anything else?
Source: Survey of Consumer Finances, 2004 2-13
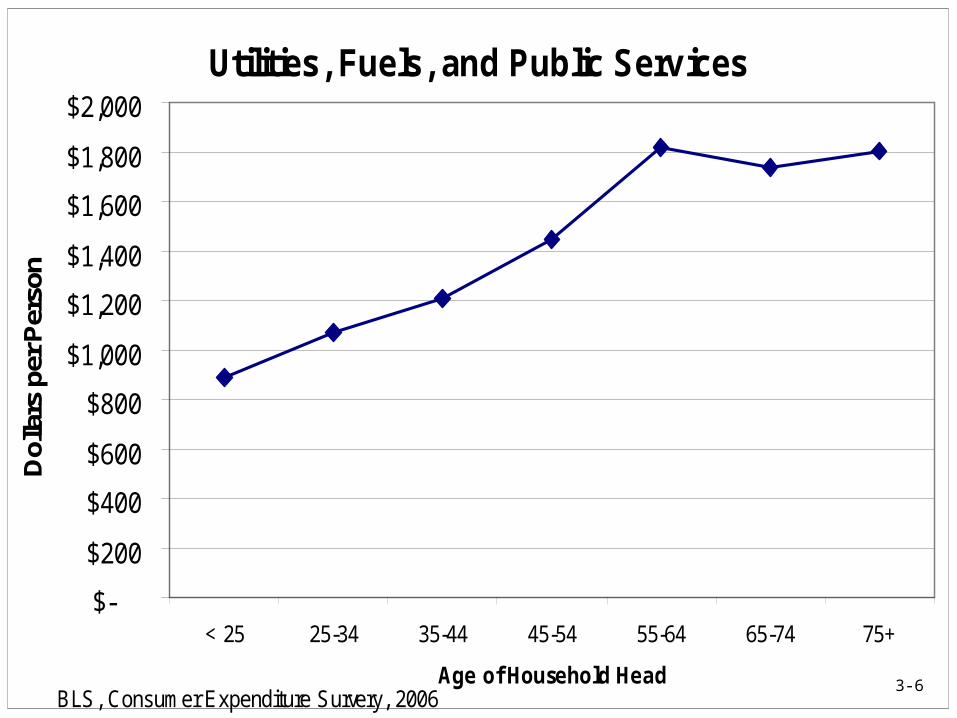
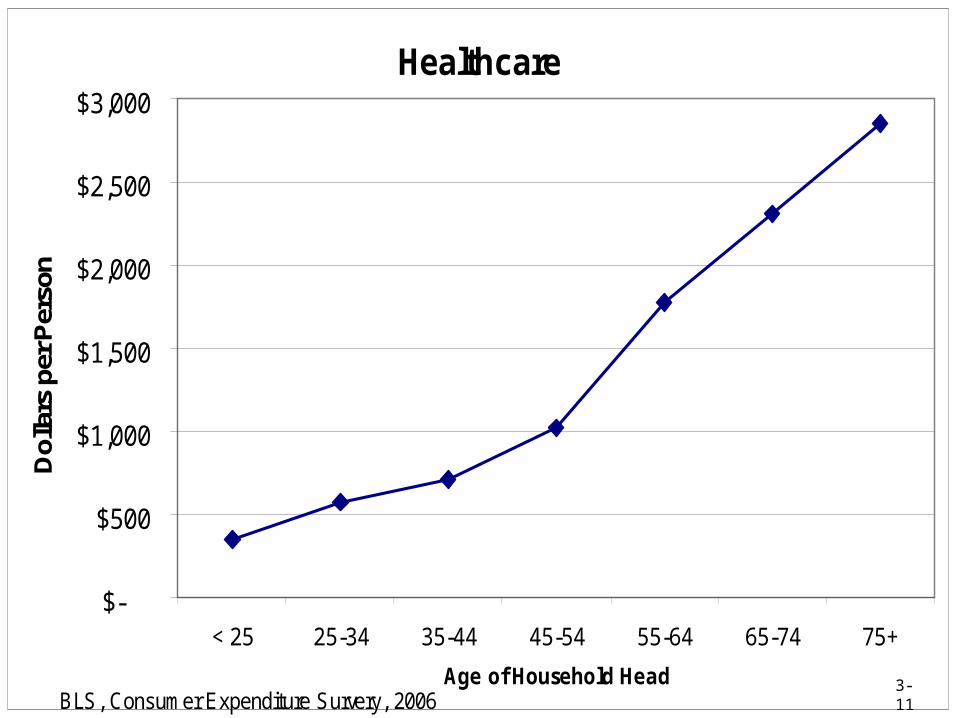
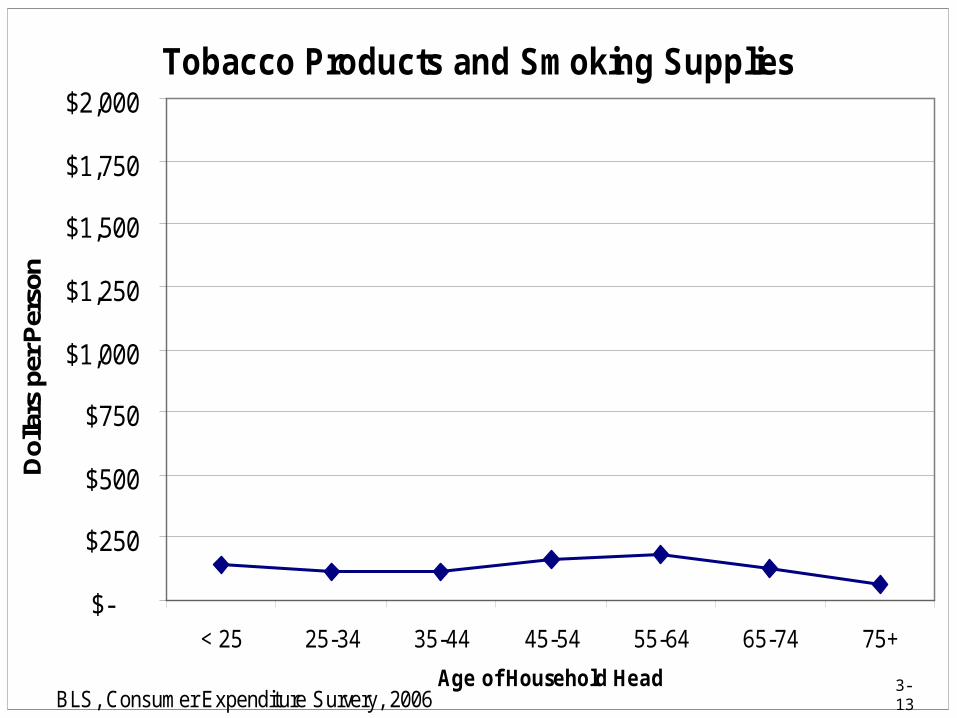
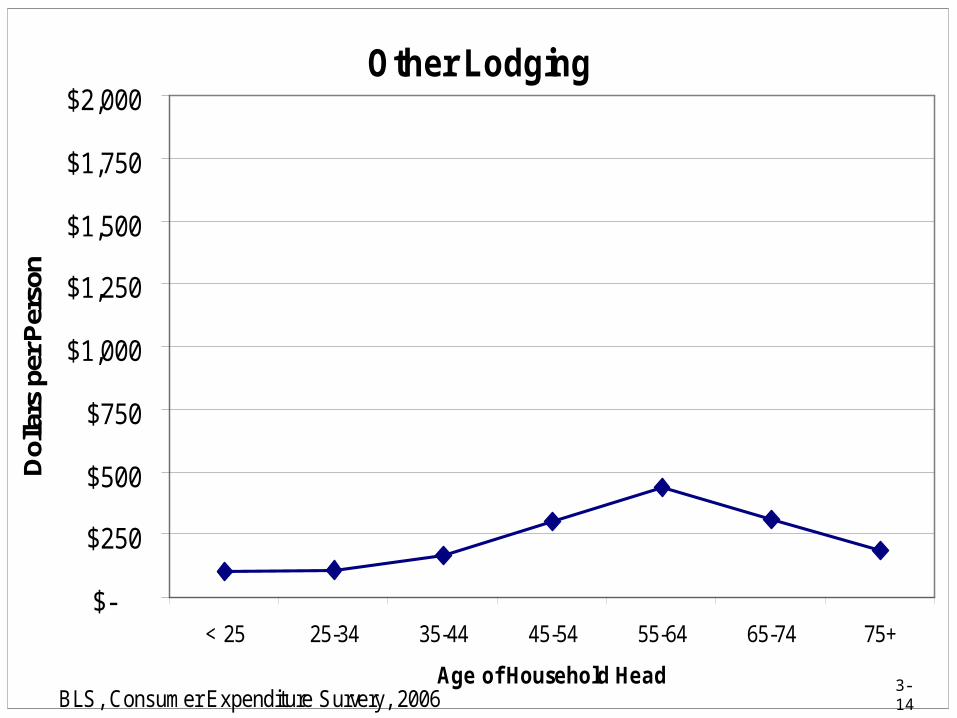
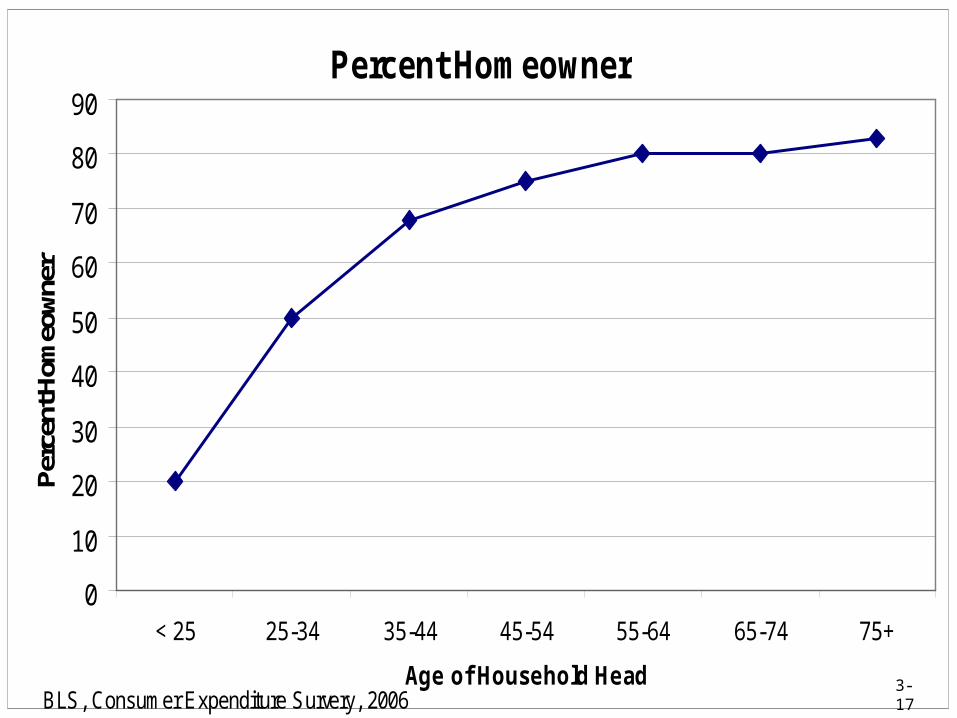
Consumer ExpendituresUS Bureau of Labor Statistics