21/11/2017 1 Population Issues Unit 2 Social Studies 3211 October 2017 14.0 POPULATION ISSUES In this outcome we will… • 14.1 explain the relationship between population, carrying capacity, and technology • 14.2 explain the theory of demographic transition • 14.3 explain the challenges and possible responses associated with high population growth rates • 14.4 explain the challenges and possible responses associated with high population growth rates
Transcript
21/11/2017
1
Population IssuesUnit 2 Social Studies 3211
October 2017
14.0 POPULATION ISSUESIn this outcome we will…
• 14.1 explain the relationship between population, carrying
capacity, and technology
• 14.2 explain the theory of demographic transition
• 14.3 explain the challenges and possible responses associated with high
population growth rates
• 14.4 explain the challenges and possible responses associated with high
population growth rates
21/11/2017
2
14.1 WORLD POPULATION TRENDS
Complete the activity
“World Population
Trends”
What are two major
trends that you identified
in the activity?
14.1 WORLD POPULATION TRENDS
First Trend
There was a population explosion beginning in the last half of
the 1600’s to the 1980s. From 1960 to 1999 the Earth’s
population doubled from 3 to 6 billion.
What are possible causes and challenges of this trend?
Causes of Population Increase Challenges of Population Increase
• Increase in food supply
• Better health care
• More demand for workers
• Less contraception
• Large families
• Overcrowding of cities
• Eventual trouble providing
enough food
• Overuse of resources
• Increased spending on children
and seniors
21/11/2017
3
14.1 WORLD POPULATION TRENDS
Second Trend
The world’s growth rate has declined since 1980. From 2.31 % in 1980 to
1.25 % in 2007. This represents the largest decline in history.
• Population growth rate refers to the rate at which a country’s
population is changing and is often shown as a percentage. A high rate is
anything over 2%, while a low rate would be 1% or less.
What are possible causes and challenges of this trend?
Causes of Population Decrease Challenges of Population Decrease
• Decrease in food supply
• Increase in disease
• Less demand for workers
• Access to contraception
• Smaller families
• Abandoned cities
• Decrease tax base
• Cost of providing services to smaller areas
• Attracting workers for new developments
14.1 WORLD POPULATION TRENDS
Which parts of the world
do you think have high
or low population
growth rates today?
• Core countries tend to
have lowest growth
• Periphery countries
tend to have the
highest growth
21/11/2017
4
14.1 POPULATION AND TECHNOLOGY
How can available technology be linked to population size?
• Remember carrying capacity – the number of people that can be sustained by the
Earth’s resources.
• You can apply the cornucopian thesis or the limits-to-growth thesis to answer this
question:
• New technology and scientific advancement can make us more efficient at
using resources, therefore supporting a larger population (Cornucopian).
• The Earth’s resources are finite and if we overuse them and they run out
we won’t be able to support larger populations (Limits-to-growth).
14.1 POPULATION AND TECHNOLOGY
Historically, there are three periods that represent major changes in the
influence of technology on population:
Stage 1: Hunting and Gathering (Paleolithic Era)
• Early human societies (2.5 million to 10,000 years ago) moved from
place to place collecting food and hunting animals.
• Stone (lithic) tools were effective, but limited amounts of food.
• Food supply was unreliable, preventing steady population growth.
• Carrying capacity was low due to large areas of land needed to
support small populations.
21/11/2017
5
14.1 POPULATION AND TECHNOLOGY
Stage 2: The Agricultural Revolution (Neolithic Era)
• Development of farming more than 10,000 years ago made
cultural and other technological advances possible.
• Humans went from finding food (when and where available) to
producing food, which gave them more control over the
environment. People could not only grow food, but could now
produce more food than needed, creating a surplus.
• More available food from each square kilometre of land meant
an increase in Earth’s carrying capacity.
14.1 POPULATION AND TECHNOLOGY
In low latitude regions (warmer
areas near the equator) across
the earth, people began to farm
and produce their own food at
around the same time in history
(approx. 10,000-12,000 years
ago).
The crops they grew depended
on the climate and local
environment.
21/11/2017
6
Agriculture leads
to civilization
(complex society)
• For the first
time in history,
food surpluses
meant people
could focus on
more than just
survival.
• Population
would grow and
life would
become more
diverse.
14.1 POPULATION AND TECHNOLOGY
Stage 3: The Industrial Revolution (c. 1750)
• The Industrial Revolution was the process by which
production of food and goods shifted from simple hand
tools to complex machinery.
• This improved upon previous sources of energy for
production (muscle power of people and animals). Coal
(late 1700s) and oil (1800s) would be developed later.
• In farming, tractors and machines were replacing farm
help, leading to increased urbanization (migration to
cities) as people sought to find work.
21/11/2017
7
14.1 POPULATION AND TECHNOLOGY
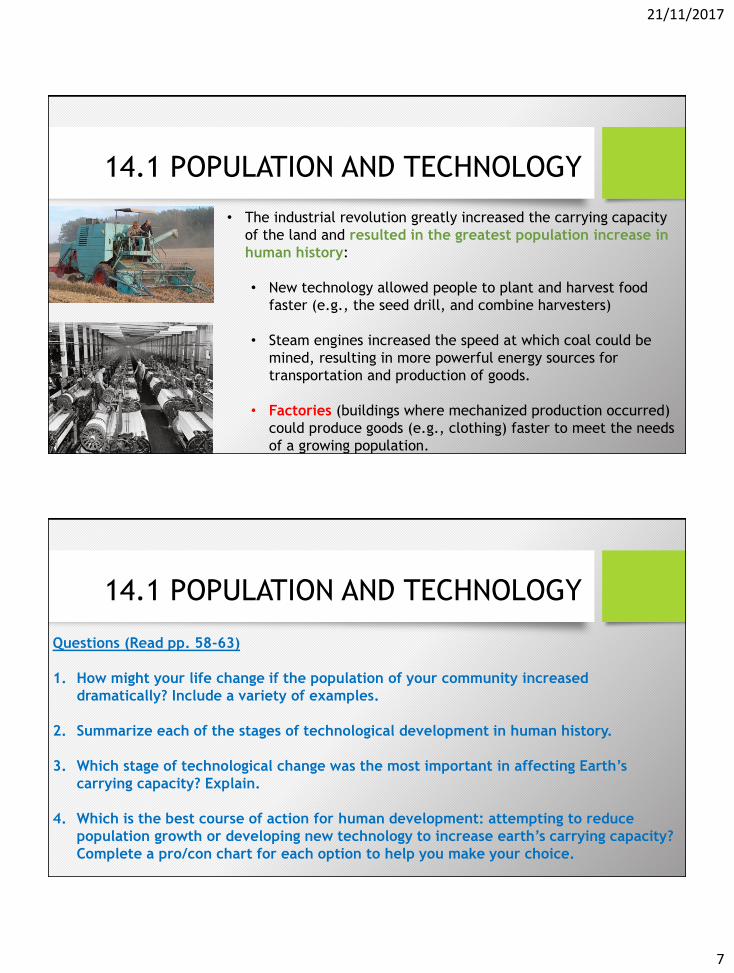
• The industrial revolution greatly increased the carrying capacity
of the land and resulted in the greatest population increase in
human history:
• New technology allowed people to plant and harvest food
faster (e.g., the seed drill, and combine harvesters)
• Steam engines increased the speed at which coal could be
mined, resulting in more powerful energy sources for
transportation and production of goods.
• Factories (buildings where mechanized production occurred)
could produce goods (e.g., clothing) faster to meet the needs
of a growing population.
14.1 POPULATION AND TECHNOLOGY
Questions (Read pp. 58-63)
1. How might your life change if the population of your community increased
dramatically? Include a variety of examples.
2. Summarize each of the stages of technological development in human history.
3. Which stage of technological change was the most important in affecting Earth’s
carrying capacity? Explain.
4. Which is the best course of action for human development: attempting to reduce
population growth or developing new technology to increase earth’s carrying capacity?
Complete a pro/con chart for each option to help you make your choice.
21/11/2017
8
POPULATION ISSUESIn this outcome we will…
• 14.1 explain the relationship between population, carrying capacity, and
technology
• 14.2 explain the theory of demographic transition
• 14.3 explain the challenges and possible responses associated with high
population growth rates
• 14.4 explain the challenges and possible responses associated with low
population growth rates
14.2 DEMOGRAPHIC TRANSITION
In the previous section we learned that the population growth rate can be greatly
influenced by new technologies that affect Earth’s carrying capacity.
Demographers – scientists who study population – believe that these changes in
growth rate are not random, but predictable. One way this is shown is through
analysis of birth rates, death rates, and factors that influence them.
The birth rate is the number of births in a country for every 1,000 people in the
population.
The death rate is the number of deaths in a country for every 1,000 people in the
population.
21/11/2017
9
14.2 DEMOGRAPHIC TRANSITION
When to find out how quickly a population is
changing due to natural factors, we take the birth
rate (BR) and subtract the death rate (DR). This
gives of the rate of natural increase (RNI)
RNI = BR - DR
For example, a country has a BR of 9.3 and
a DR of 7.4
RNI = BR – DR This means the population
RNI = 9.3 – 7.4 is increasing at a rate of
RNI = 1.9 1.9 for every 1,000.
A positive RNI means there is a natural
increase showing an increase in
population due to natural causes.
A negative RNI means there is a natural
decrease, showing a decrease in
population due to natural causes.
14.2 DEMOGRAPHIC TRANSITION
Countries with an RNI of over 2 are usually less globalized, while RNIs of less than 1
indicate a more globalized country.
This is the case because as a country becomes more globalized with greater access to a variety
of technologies, its birth rates and death rates both decline.
How can changes in technological development affect birth and death rates?
21/11/2017
10
14.2 DEMOGRAPHIC TRANSITION
The Demographic Transition Model (DTM) is the
theory that describes how countries experience a
decrease in birth and death rates as they gain access
to greater technology (i.e., become more globalized).
There are four stages in DTM.
• Stage 1: Pre-transition
• Stage 2: Early transition
• Stage 3: Late transition
• Stage 4: Post-transition
“Transition” here refers to the change from high
birth and death rates to low birth and death rates.
Complete “Demographic Transition”
activity and include it in your folder
as part of your portfolio mark.
14.2 DEMOGRAPHIC TRANSITION
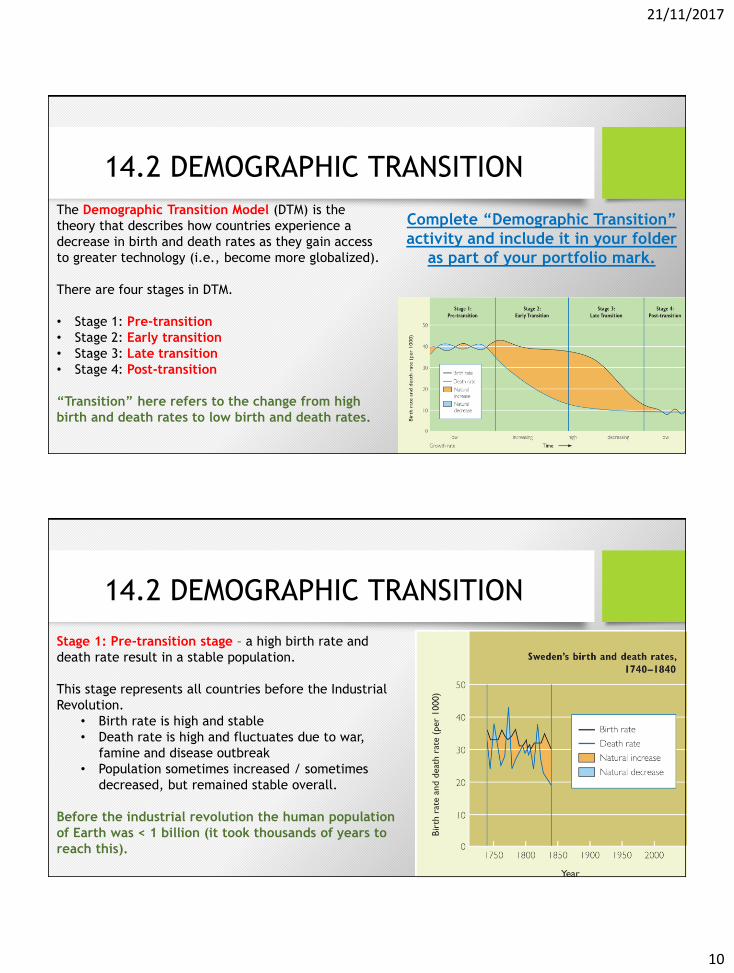
Stage 1: Pre-transition stage – a high birth rate and
death rate result in a stable population.
This stage represents all countries before the Industrial
Revolution.
• Birth rate is high and stable
• Death rate is high and fluctuates due to war,
famine and disease outbreak
• Population sometimes increased / sometimes
decreased, but remained stable overall.
Before the industrial revolution the human population
of Earth was < 1 billion (it took thousands of years to
reach this).
21/11/2017
11
14.2 DEMOGRAPHIC TRANSITION
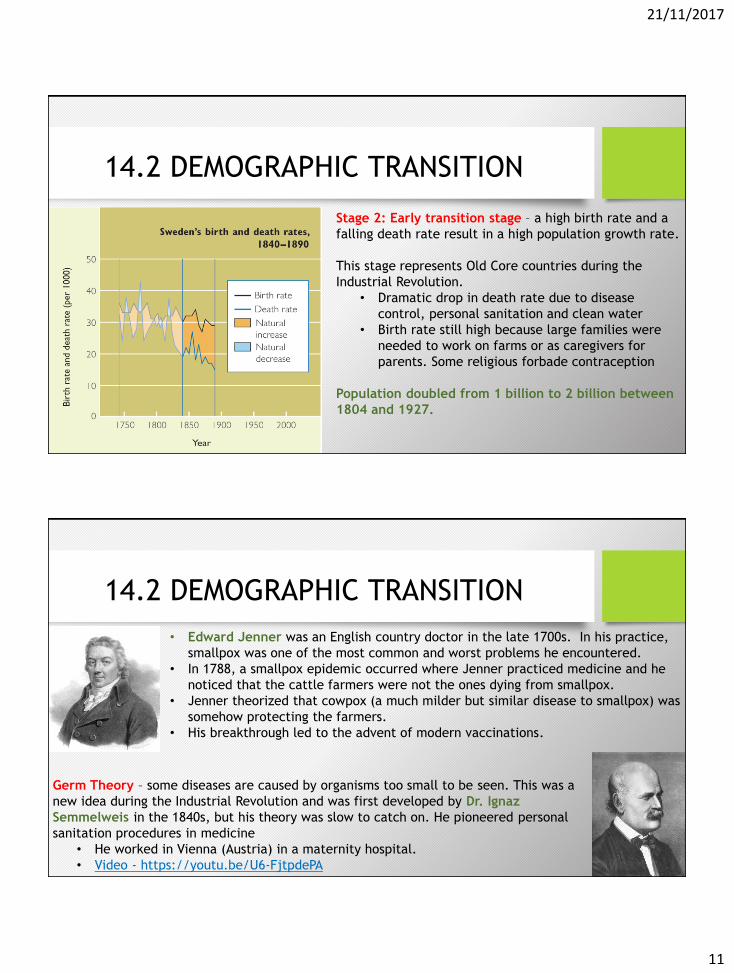
Stage 2: Early transition stage – a high birth rate and a
falling death rate result in a high population growth rate.
This stage represents Old Core countries during the
Industrial Revolution.
• Dramatic drop in death rate due to disease
control, personal sanitation and clean water
• Birth rate still high because large families were
needed to work on farms or as caregivers for
parents. Some religious forbade contraception
Population doubled from 1 billion to 2 billion between
1804 and 1927.
14.2 DEMOGRAPHIC TRANSITION
Germ Theory – some diseases are caused by organisms too small to be seen. This was a
new idea during the Industrial Revolution and was first developed by Dr. Ignaz
Semmelweis in the 1840s, but his theory was slow to catch on. He pioneered personal
sanitation procedures in medicine
• He worked in Vienna (Austria) in a maternity hospital.
• Video - https://youtu.be/U6-FjtpdePA
• Edward Jenner was an English country doctor in the late 1700s. In his practice,
smallpox was one of the most common and worst problems he encountered.
• In 1788, a smallpox epidemic occurred where Jenner practiced medicine and he
noticed that the cattle farmers were not the ones dying from smallpox.
• Jenner theorized that cowpox (a much milder but similar disease to smallpox) was
somehow protecting the farmers.
• His breakthrough led to the advent of modern vaccinations.
Stage 3: Late transition stage – a declining birth rate and
a relatively low death rate lead to a slowing population
growth rate.
This stage represents Old Core countries during most of
the 20th century.
• Better medicine and healthcare mean low infant
mortality
• Fewer children needed to support family farms
(better production during Industrial Revolution).
• More people moved to cities for work in factories.
• More women begin working, double incomes mean
many families were better off.
Population growth slows, but reaches 4 billion by 1974.
14.2 DEMOGRAPHIC TRANSITION
Stage 4: Post-transition stage – a low birth rate and a low
death rate lead to a more or less stable population.
This stage represents Old Core countries at the end of the
20th century.
• Birth and death rates low and about equal
• Highly urbanized lifestyle (most people work in
service and industries, rather than agriculture)
• Small families due to lower infant mortality and
women delaying families in favour of careers
• Rate of Natural Increase nearly zero
Human population reached 7 billion by 2013, but
globally the growth rate has declined.
21/11/2017
13
14.2 DEMOGRAPHIC TRANSITION
Many Old Core countries have gone through demographic transition and are currently in Post-transition.
Less globalized countries are currently going through Early and Late transition.
1. Why is it important that less globalized countries reach post-transition as quickly as possible?
2. Do you think Old Core countries will remain in post-transition? Explain.
14.2 POPULATION PYRAMIDS
• Population Pyramid – a graph that shows the structure of a population by age and gender at one point in time.
• It breaks down the makeup of a population by male-female balance and the number of people at different age groups.
Male Female
Measure of the
population (by % or
total numbers)
21/11/2017
14
14.2 POPULATION PYRAMIDS
• These graphs can be used by demographers to identify problems that a country may face in the future and to determine which stage in the demographic transition model a country may be in.
14.2 POPULATION PYRAMIDS
Expanding population
• population is increasing because of a high birth rate
• high death rate is seen by the rapid decrease between age groups and few people that live beyond age 65
• usually indicates far periphery or near core
21/11/2017
15
14.2 POPULATION PYRAMIDS
Stationary population
• population is basically staying the same
• declining birth rate / low death rate• child-bearing age groups are
replacing themselves• middle is roughly the width of the
bottom• usually indicates core or new core
countries
14.2 POPULATION PYRAMIDS
Contracting population
• population is decreasing
• low birth rate / low death rate
• child-bearing age are not replacing themselves
• bottom more narrow than middle
• usually indicates core or new core countries
21/11/2017
16
14.2 POPULATION PYRAMIDS
Pre-transition Early Transition Late Transition Post Transition
14.2 POPULATION PYRAMIDS
Complete “Population Pyramids” activity and place in in your folder as part of your portfolio mark.
21/11/2017
17
POPULATION ISSUESIn this outcome we will…
• 14.1 explain the relationship between population, carrying capacity, and
technology
• 14.2 explain the theory of demographic transition
• 14.3 explain the challenges and possible responses associated
with high population growth rates
• 14.4 explain the challenges and possible responses associated with low
population growth rates
Why is it important that less globalized countries reach post-transition as quickly as possible?
• It is important because if the transition is not made quickly a country can stay in Stage 2 of the DTM and continue to have high birth rates and low death rates. This causes a very rapid increase in population.
• The term for a country remaining in Early Transition Stage with a high birth rate and a low death rate is called the demographic trap.
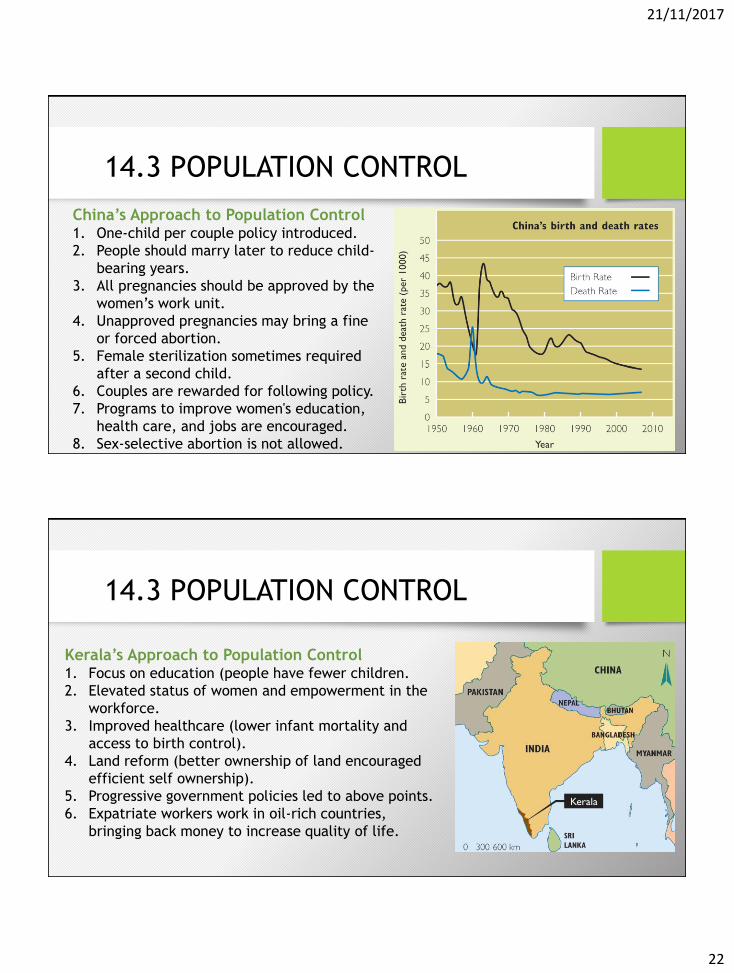
14.3 OVERPOPULATION
21/11/2017
18
“Trapped” in Stage 2
• Before 1970, Periphery countries were poised to make the transition to the next stage thanks to economic growth.
• Since 1970, economic growth has not keep up with the increases in population in these regions.
• High birth and low death rates have resulted in explosive population growth.
• This causes a downward spiral in standard of living (lower quality of life).
14.3 OVERPOPULATION
• Country cannot reach post-transition.
• The increase in population leads to a growing strain on food supply and services (including medical and educational).
• With the need for more money to provide people with food and services, there is less money to support development that lowers the birth rate.
• When the demands of a growing population exceeds the country’s carrying capacity it is experiencing overpopulation.
14.3 OVERPOPULATION
21/11/2017
19
Insufficient employment
What are some of the challenges that can affect a country that that experiences overpopulation?