POP2009-01 Black petrel population parameters - DRAFT 1 Population parameters of the black petrels (Procellaria parkinsoni) on Great Barrier Island (Aotea Island), 2009/10. Elizabeth A. Bell 1 , Joanna L. Sim 2 , Paul Scofield 3 and Chris Francis 4 1 Wildlife Management International Limited, 35 Selmes Road, Rapaura, RD3, Blenheim 7273, New Zealand, Email:[email protected]2 Department of Conservation, Great Barrier Area Office, Port Fitzroy, Great Barrier Island, New Zealand 3 Canterbury Museum, Christchurch, New Zealand 4 NIWA, Greta Point, Wellington, New Zealand Abstract This report is part of an ongoing long‐term study of the black petrel, Procellaria parkinsoni, on Great Barrier Island (Aotea Island) that was begun in the 1995/96 breeding season. During the 2009/10 breeding season, 393 study burrows within the 35‐ha study area near Mount Hobson were checked and intensively monitored. Of these, 244 were used by breeding pairs, 99 by non‐ breeding adults and the remaining 50 burrows were non‐occupied. By 9 May 2010, 158 chicks were still present in the study burrows and 22 had already fledged, corresponding to a breeding success of 74%. Nine census grids were monitored within the study area and accounted for 155 of the inspected burrows and 152 study burrows, with 88 burrows being used for breeding. Forty‐ one chicks from earlier breeding seasons were recaptured within the Mount Hobson colony area this season (a total of 94 ‘returned chicks’ have been caught since the 1999/2000 season). Twenty‐ six random transects were surveyed in the study area and when compared with transects conducted in the 2004/05 season showed an apparent 22% decline over that period. Modelling of the black petrel population on Great Barrier Island (Aotea Island) was updated and indicated the population trend may lie anywhere between ‐2.4% and +1.6% per annum, the certainty driven primarily by uncertainty over juvenile survival. Analysis of the census grid and transect data estimated the black petrel population from the 35‐ha area around Mount Hobson to be in the range of 2781 to 3287 birds. Keywords: black petrel, Procellaria parkinsoni, monitoring, population estimate, breeding success, predation, bycatch, Great Barrier Island (Aotea Island), New Zealand
Transcript
POP2009-01 Black petrel population parameters - DRAFT
1
Population parameters of the black petrels (Procellaria parkinsoni) on Great Barrier Island
(Aotea Island), 2009/10.
Elizabeth A. Bell1, Joanna L. Sim2, Paul Scofield3 and Chris Francis4 1 Wildlife Management International Limited, 35 Selmes Road, Rapaura, RD3, Blenheim 7273, New
Zealand, Email:[email protected] 2 Department of Conservation, Great Barrier Area Office, Port Fitzroy, Great Barrier Island, New
Zealand 3 Canterbury Museum, Christchurch, New Zealand 4 NIWA, Greta Point, Wellington, New Zealand
Abstract
This report is part of an ongoing long‐term study of the black petrel, Procellaria parkinsoni, on
Great Barrier Island (Aotea Island) that was begun in the 1995/96 breeding season. During the
2009/10 breeding season, 393 study burrows within the 35‐ha study area near Mount Hobson
were checked and intensively monitored. Of these, 244 were used by breeding pairs, 99 by non‐
breeding adults and the remaining 50 burrows were non‐occupied. By 9 May 2010, 158 chicks
were still present in the study burrows and 22 had already fledged, corresponding to a breeding
success of 74%. Nine census grids were monitored within the study area and accounted for 155 of
the inspected burrows and 152 study burrows, with 88 burrows being used for breeding. Forty‐
one chicks from earlier breeding seasons were recaptured within the Mount Hobson colony area
this season (a total of 94 ‘returned chicks’ have been caught since the 1999/2000 season). Twenty‐
six random transects were surveyed in the study area and when compared with transects
conducted in the 2004/05 season showed an apparent 22% decline over that period. Modelling of
the black petrel population on Great Barrier Island (Aotea Island) was updated and indicated the
population trend may lie anywhere between ‐2.4% and +1.6% per annum, the certainty driven
primarily by uncertainty over juvenile survival. Analysis of the census grid and transect data
estimated the black petrel population from the 35‐ha area around Mount Hobson to be in the
range of 2781 to 3287 birds.
Keywords: black petrel, Procellaria parkinsoni, monitoring, population estimate, breeding success,
predation, bycatch, Great Barrier Island (Aotea Island), New Zealand
POP2009-01 Black petrel population parameters - DRAFT
2
1. Introduction
The black petrel, Procellaria parkinsoni, is a medium‐sized endemic seabird which is only known to
breed on Hauturu/Little Barrier Island (36°199'S 175°082'E) and Great Barrier Island (Aotea Island)
(36°187'S 175°4125'E), New Zealand (Heather and Robertson 1996). The main breeding area on
Great Barrier Island (Aotea Island) is around the summit of Mount Hobson (Hirakimata) (hereafter
Mount Hobson). Monitoring work carried out during the 2009/10 breeding season was a
continuation of the survey and monitoring study begun in 1995/96 (Bell & Sim 1998a, b, 2000a, b,
c, 2002, 2003a, b, 2005; Bell et al. 2007, 2009; Bell et al. in press), adding to the baseline data on
the Great Barrier Island black petrel population. Field work carried out in 2006/07 season was
privately funded and has not been reported in the DOC publication format. The annual report for
that season can be obtained from the lead author (EAB). Mark‐recapture, breeding and population
data from the 2006/07 season has been included in this (2009/10) report. This study will assist in
identifying effects that long‐line and other fishing types, rat and cat predation and habitat
disturbance may have on the population and build on the earlier data (Bell et al 2009). The
population estimate and population trend data has been updated, ensuring that any population
changes will be detected in time to implement the appropriate management strategies.
2. Objectives
The main objectives of this study were to undertake an annual census of the black petrel
population on Great Barrier Island via burrow monitoring and the banding of adults and fledglings
to establish adult mortality, breeding success and recruitment. Since this study was a continuation
of research from previous breeding seasons, we also aimed to provide more data to establish
population trends and to determine causes and timing of mortality.
In summary, the study objectives were to:
• Monitor a sample of black petrel burrows within the main breeding area on Great
Barrier Island and band all adults present in the burrows during December 2009,
January/February 2010 and all remaining fledglings during May 2010.
• Collect data that will allow estimation of population size and trends.
• Determine breeding success in the sample of long‐term study burrows and record
causes of breeding failure, such as predation or disappearance of parents.
• Monitor and re‐survey the census grids and study area for new burrows and band and
recapture as many breeding and non‐breeding birds present as possible.
POP2009-01 Black petrel population parameters - DRAFT
3
• Determine a population estimate by extrapolating from random transect lines and
census grids to the main Mount Hobson breeding area.
• Compare random transect data collected in 2004/05 season with those surveyed in the
2009/10 season results to determine population trend.
• Continue the mark/recapture programme and band as many birds as possible during
the breeding season to determine juvenile (pre‐breeder) survival, age of first return to
the natal colony, age of first breeding attempt, age of first successful breeding attempt
and adult (breeder) survival.
• Update and build on Seabird Modelling results (using data between 1996 to 2009) using
the population and mark/recapture data collected this 2009/10 breeding season to
determine population trends
• Confirm the breeding status of adults during each visit to the colony (i.e. to monitor the
study burrows at the beginning, middle and end of the breeding season), and where
possible, identify the sex of the resident adult.
3. Methods
3.1 Study burrows
The study area (35 ha at and around the summit of Mount Hobson; Fig. 1) was visited three times
during the breeding season; 3‐14 December 2009. During this visit the study burrows (n = 393,
Figs. 1‐4) were either randomly selected from those along the track system (i.e. within 10 m of
either side), burrows that have ‘returned chicks’ (pre‐breeders) resident, or all burrows within the
nine census grids. The study burrows have been selected regularly since 1995/96 season (Bell &
Sim 1998a, b, 2000a, b, c, 2002, 2003a, b, 2005; Bell et al. 2007; Bell et al. 2009; Bell et al. in
press). To ensure accurate monitoring, the study burrows were accessible either through the main
entrance or via an opening that had been excavated through the burrow roof or wall into the
chamber. This opening was covered by a piece of plywood, which was camouflaged with soil and
debris. Any occupying adult was removed from the burrow, banded (or the band number recorded
if a recapture), sexed by viewing the cloaca (if swollen, the bird is a female — the cloaca is
particularly obvious immediately after egg laying) and returned to the burrow. The presence of
any egg was noted.
On a second visit to the colony (22 January‐15 February 2010) the study burrows were intensively
monitored again. As in the December visit, any adults present were identified or banded, and
POP2009-01 Black petrel population parameters - DRAFT
4
returned to the burrow. The presence of eggs, eggshell fragments or chicks was noted and the
absence of this sign was used to identify non‐breeding birds.
The study burrows were monitored again (6‐10 May 2010). All remaining fledgling chicks were
banded. This information was used to determine breeding success.
The locations of study burrows were mapped by entering GPS co‐ordinates into GIS‐mapping
software (Manifold™).
3.2 Census grids
The three original grids (KDG1, PTG1 and SFG1) were established in 1996 (Bell & Sim 1998a). These
grids were located in areas that had a known historical presence of black petrels, different strata,
vegetation types and topography and were near known petrel launch sites (Bell and Sim 1998a).
These original grids were replicated in 1998 (KDG2, PTG2 and SFG2) and in 1999 (KDG3, PTG3 and
SFG3) to compare burrow densities between areas and to increase the accuracy of the population
estimate (Bell and Sim 2000a, b).
These nine census grids (each 40 x 40 m) set up around Mount Hobson were systematically
searched (at 1 m intervals) during the December 2009 visit and again in February 2010 by authors
(EAB and JS) using Maddi (a Department of Conservation qualified bird dog owned by JS) to locate
any new burrows and to determine occupancy rates (Figs. 1‐4). The same procedure as for study
burrows (see section 3.1) was followed for all birds in the burrows in the grids.
3.3 Transects
The transect survey of 2004/05 breeding season (Bell et al. 2007) was repeated in 2009/10
breeding season. Twenty‐six random transects were completed during the 2009/10 breeding
season to determine burrow density throughout the study site (Fig. 5). Sixteen of these transects
LT115) were randomly selected as new this season and the other ten (LT6, LT8, LT10, LT11, LT17,
LT18a, LT19, LT25, LT38a and LT41) were randomly selected from the 2004/05 breeding season
transects. All transects were surveyed using the same methods as given in the 2004/05 breeding
season report (Bell et al. 2007). Any burrows located within the search area were treated in the
POP2009-01 Black petrel population parameters - DRAFT
5
same manner as given in the 2004/05 season report (Bell et al. 2007) and the same procedure as
outlined in Section 3.1 was followed for any bird caught in the transect burrows.
Four grades of petrel habitat were identified throughout the study site based on the density of
petrel burrows and incorporating habitat characteristics such as terrain (slope and aspect),
vegetation (emergent tree species, dense or moderate canopy species and undergrowth species)
and coverage (scrub, secondary growth, or primary forest) (Bell et al. 2009; Bell et al. in press).
Each transect was then stratified using these four grades of habitat. The coverage area (two‐
dimensional only) of the four different grades of petrel habitat (non‐petrel habitat, low‐, medium‐
and high‐grade petrel habitat) within the study site was determined using Manifold™ (Bell et al.
2009; Bell et al. in press).
This season’s transect data was compared to the previous transect results from the 2004/05
breeding season (Bell et al. 2007, Francis and Bell 2010) to determine population trends.
3.4 Night banding
Night work was undertaken during the December 2009 and January/February 2010 visits to the
study area. This involved searching the study area by walking the track system and capturing any
adult petrel on the surface. Several nights were also spent at known petrel launch sites, where
birds were captured at take‐off or landing. All birds were banded or had their band numbers
recorded. During the December 2009 visit, sex was determined (if possible) by cloacal inspection.
3.5 Population estimate
Bell et al. (2007) noted that previous population estimates determined by direct extrapolation
from the nine census grids have overestimated the black petrel population size (Bell & Sim 1998a,
b, 2000a, b, c, 2002, 2003a, b, 2005). This is because the original census grids were established in
areas of known high petrel density, whereas the distribution of burrows over the whole 35‐ha
study area is not uniform.
The population estimate for the 35‐ha study area was determined by extrapolating from the
transects and census grids after stratification of the 35‐ha study area (stratifying the area into the
four habitat grades based on burrow density, ranking and splitting the length of the transects and
POP2009-01 Black petrel population parameters - DRAFT
6
areas of the census grids into those habitat types, and then extrapolating to the habitat areas
which make up the 35 ha).
For all estimates, any breeding burrow was treated as having two resident birds present and any
non‐breeding burrows was treated as having 1.25 birds present (as in any non‐breeding burrow
there is a 25% chance of capturing more than one bird in the burrow when the resident male
attracts a female to that burrow).
3.6 Population parameters using program MARK
Adult survival and the corresponding dispersion coefficient (Chat) value were calculated using the
Cormack Jolly Seber model for adult survival over time (Phi(t) P(t), where Phi=apparent survival,
t=time, P= probability of recapture). Adult sex‐linked survival was calculated using the Cormack
Jolly Seber model (Phi(sex) P(t) and Phi(t) P(sex*t) where Phi = apparent survival, t = time, sex =
sex of bird, P= probability of recapture). Juvenile survival and corresponding Chat values were also
calculated, using the Burnham Jolly Seber model.
Population trends were measured using multi‐state models to determine probability of changing
states from successful or non‐successful breeder to non‐breeder: S(.) P(.) psi(breeder to non‐
breeder*t), where S = survival rate, P = probability of recapture, Psi = transition probability and t =
time using five states (unknown status, successful breeder, unsuccessful breeder, chick, non‐
breeder). Adult survival was assumed to be constant and the probability of survival of chicks was
set at 0.5 for the first 3 years and then 0.9 thereafter. These parameters were calculated by the
Burnham Jolly Seber model. All parameters were determined using Program MARK
(http://welcome.warnercnr.colostate.edu/~gwhite/mark/mark.htm). The goodness of fit of the
models (i.e. likelihood value) was measured using Aikekes Modified Information Criterion (AICc).
Models with lower AIC are better that those with higher AIC, i.e. it is more likely that the model
fits the population and is likely to be an accurate explanation of, or value for, the parameter (such
as survival)
POP2009-01 Black petrel population parameters - DRAFT
7
3.7 SEABIRD model update
The long‐term black petrel data was thoroughly analysed (Ministry of Fisheries project PRO2006‐
02) to model the effects of fishing on the population viability of selected seabirds using Program
SEABIRD and methods for this can be found in Francis & Bell (2010). These results have been
updated and reanalysed incorporating this season’s study burrow population and transect data.
These updated results are compared with Program MARK estimates.
4 Results
4.1 Study burrows
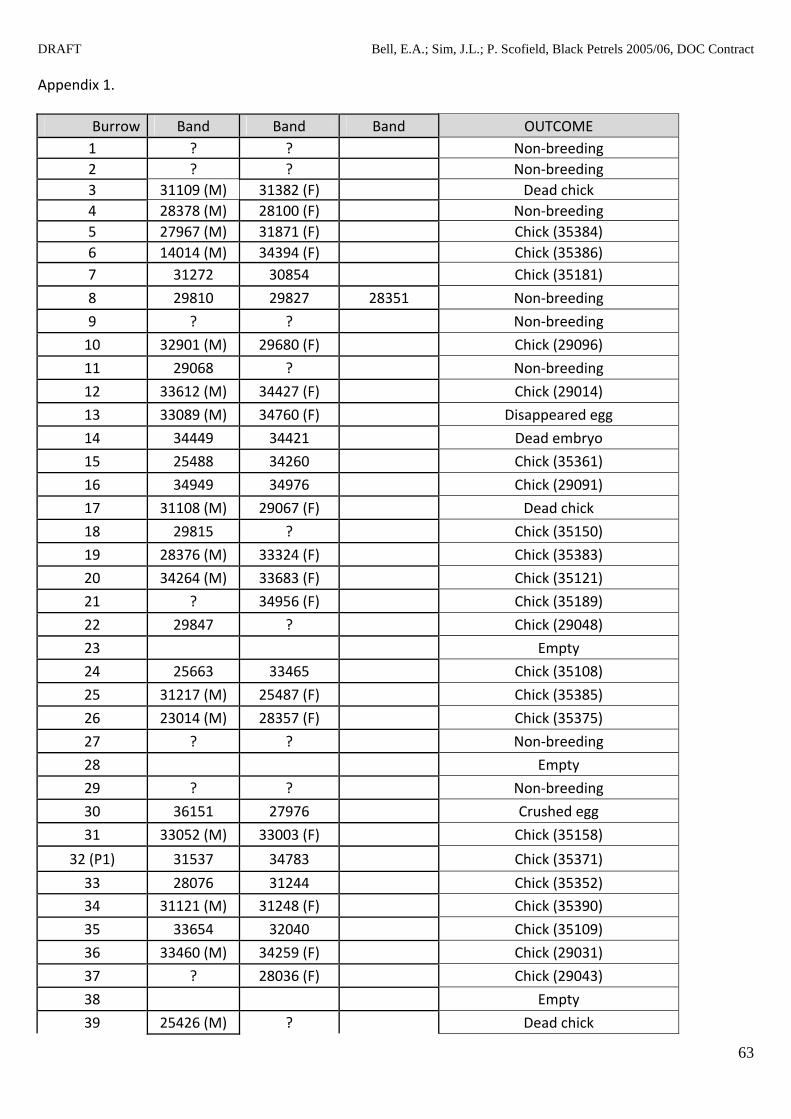
Within the 393 study burrows (those burrows that could be accessed to determine occupancy out
of the 400 numbered burrows in the 2009/10 season), 244 contained breeding birds, 99 contained
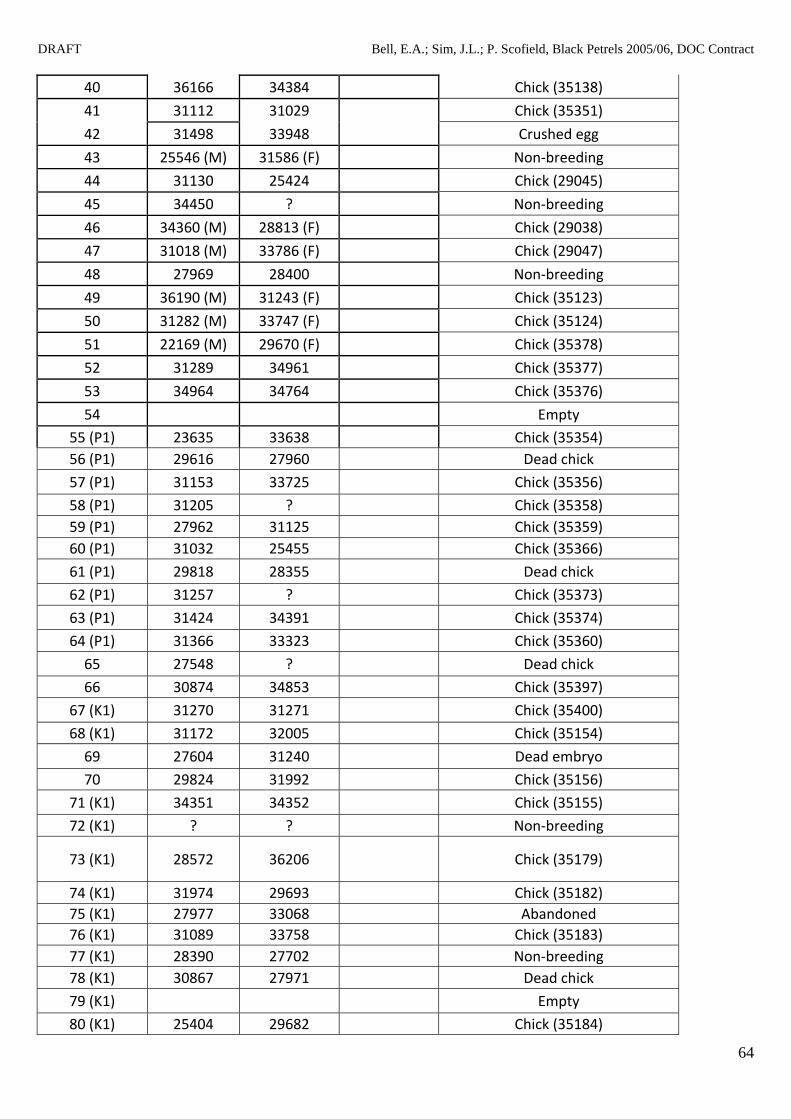
non‐breeding birds and 50 were non‐occupied (Appendix 1, Tables 1 and 2). There were 64
failures (e.g. loss of eggs, infertility, predation, etc., Table 2). This corresponds to a breeding
success of 74% (Table 2, Fig. 6).
Table 1 shows the percentage of occupied and non‐occupied burrows within the study burrows
and the percentages of non‐occupied, breeding and non‐breeding burrows. Data from the past
twelve breeding seasons shows the ratio of breeding to non‐breeding burrows has averaged 3:1,
but the number of occupied to non‐occupied has varied greatly (Bell & Sim 2000a, b, c, 2002,
2003a, b, 2005; Bell et al 2007, 2009; Bell et al. in press; Bell et al. in prep). However, the last three
seasons have all had similar numbers of occupied and non‐occupied burrows (Table 1) and this
season had the lowest proportion of burrows used for breeding since the study began (62%, Table
1). Table 2 shows the failures and overall breeding success rate within the study burrows since
1995/96.
Figure 6 shows the trend in the numbers of non‐occupied, breeding and non‐breeding burrows
since the 1998/99 breeding season. It appears that breeding success has been slowly increasing
despite the number of burrows being used for breeding reducing slightly over the same time (Fig.
6). The mean annual breeding success (1998/99 to 2009/10) within the study burrows is 75% (± 1,
Table 1).
POP2009-01 Black petrel population parameters - DRAFT
8
4.2 Number of burrows in the census grids
A total of 155 burrows were found in the nine census grids (Appendix 1, Table 3, Figs 2‐4) in the
2009/10 breeding season. Of these, 88 burrows were used by breeding pairs, 41 were used by
non‐breeding adults and 26 burrows were non‐occupied (Table 3). Figure 7 shows the trend in the
number of non‐occupied, breeding and non‐breeding burrows in the census grids since the
1995/96.
The number of burrows in the census grids has increased over the length of the study (Fig. 8).
Francis and Bell (2010) inferred that this increase in the number of burrows found in the grids
between 1999/2000 and 2008/2009 corresponded to an increase in the breeding population of
between 2.2 and 3.1% per annum. This calculation was reassessed using the entire data set of
breeding burrows (1999/2000 to 2009/10) and resulted in a lower estimate of between 1 and 1.5%
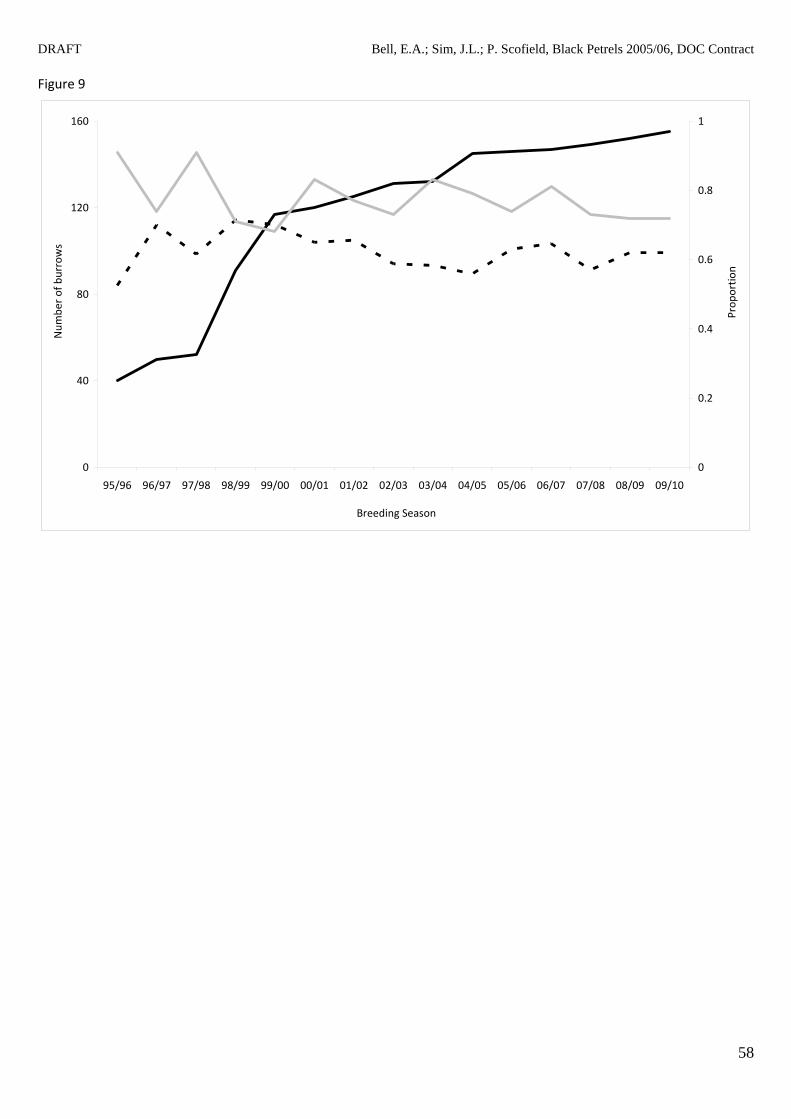
increase per annum (further details available in Appendix 2). Figure 9 shows the trend in the total
number of burrows, total number of burrows used for breeding and annual breeding success in
the census grids.
There were also several ‘potential’ burrows within the grids, which were not included in any
burrow estimate. ‘Potential’ burrows are those which had been investigated and/or preliminarily
dug out, but were not yet being used by breeding or non‐breeding petrels.
4.3 Banding data
During the 2009/10 season, 636 adults were identified. Of these, 529 were already banded and
107 were banded this season (Appendix 1, Table 4). There were 158 chicks still present in the
study burrows during the May visit and these were banded (Appendix 1, Table 4). Twenty‐two
chicks had already fledged. Thirteen additional chicks in non‐study burrows were also banded
(Table 4).
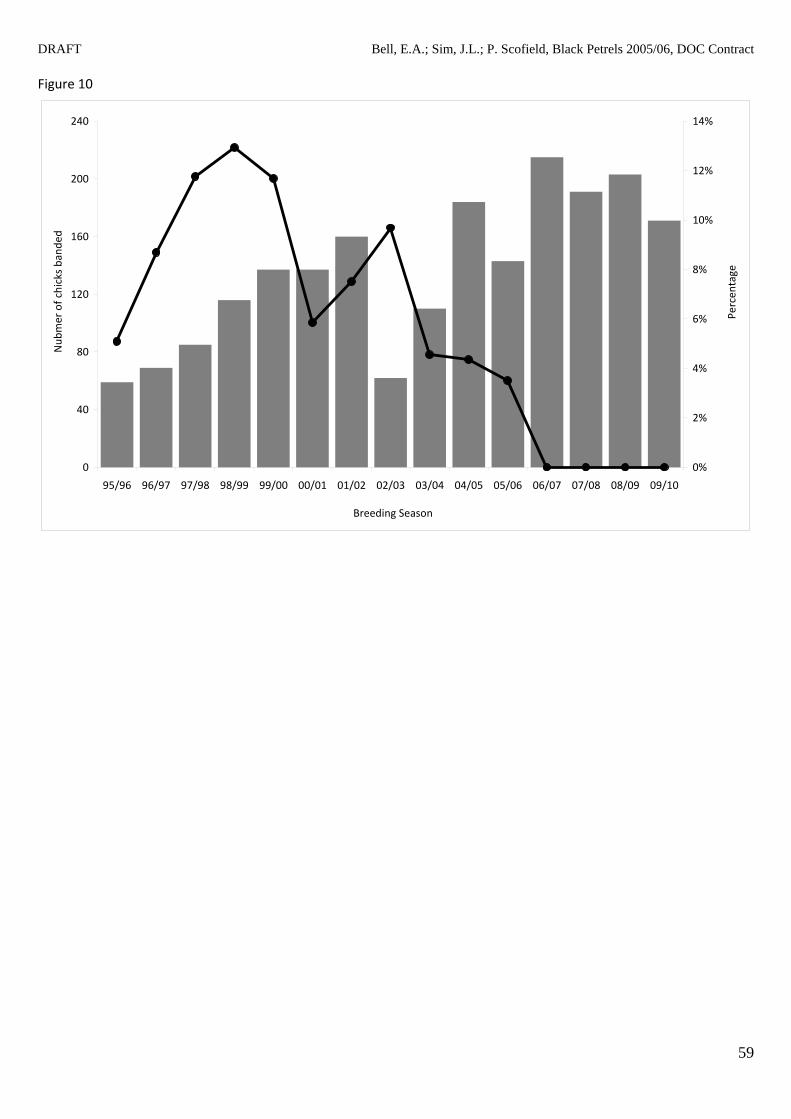
There have been 2042 chicks banded within the study area between 1995 and 2010 (Table 4 and
5) and these birds have begun to return to the colony as pre‐breeders, non‐breeders and breeders
(n=94, Table 5, Appendix 3). The proportion of ‘returned chicks’ from each season varies from 0 to
13% (mean ± SEM = 6 ± 1); the highest proportion of chicks recaptured were banded in the
1998/99 season (Table 5). Figure 10 shows the number of chicks banded each season and the
proportion of those chicks that have been recaptured in the 35‐ha study area. Table 6 shows the
POP2009-01 Black petrel population parameters - DRAFT
9
number of returned chicks that have been recaptured each season; since the first chicks were
banded in 1995/96, the number of recaptures of returned chicks has increased to 41 (between
1999/00 and 2009/10, Table 6).
There were 41 ‘returned chicks’ recaptured at the colony this season (Table 6); of these, 25
attempted to breed, with 12 successfully raising chicks of their own. The remaining 16 did not
breed, although several males were recaptured while calling to attract a mate. Figure 11 shows
the total number of ‘returned chicks’ and number that were caught breeding and non‐breeding
each season.
Since the first returned chick (banded on Great Barrier Island in the 1995/96 season) was
recaptured as a pre‐breeder in the 1999/00 season, 95 ‘chicks’ have been recaptured as pre‐
breeders, non‐breeders or breeding adults (Table 5); 94 from chicks banded on Great Barrier
Island and one from Little Barrier Island (Appendix 3). The number of times ‘chicks’ have been
recaptured ranges from 1 to 10 (mean ± SEM = 2.3 ± 0.2, Appendix 3). The frequency of first
recapture of each age class is given in Figure 12. Although the youngest age at first return is 3
years, the mean age ± SEM at first return is 5.5 ± 0.2 (Appendix 3, range 3 to 10 years). Forty‐
seven of these ‘returned chicks’ have attempted to breed over eleven seasons (1999/2000 to
2009/10, Bell & Sim 2002, 2003a, b, 2005; Bell et al 2007, 2009, in press), with 38 breeding
successfully over this period (Appendix 3). This means the age at first breeding attempt ranges
from 5 to 10 years (mean ± SEM = 6.6 ± 0.2) and the age at first successful breeding also ranges
from 5 to 10 years (mean ± SEM = 6.9 ± 0.2, Appendix 3).
4.4 Survival estimates and recapture probabilities
Bell et al. (in press) noted that there was a confounding influence in estimating adult survival using
a sex‐based model as there was a recapture probability difference between male and females.
These tests were repeated this season using updated sex information (n=609 black petrels of
known sex) and the results were very similar; Cormack Jolly Seber (CJS) survival models comparing
two sexes; Phi(sex*t) P(t) (adult survival and recapture probability vary with sex and time) and
Phi(t) P(sex*t) (recapture probability vary with time) where Phi=apparent survival, sex=sex of the
bird, t=time, P= probability of recapture) only had AICc values that differed by less than 0.16.
POP2009-01 Black petrel population parameters - DRAFT
10
Using data from 1995/96 to 2009/10 and the Cormack Jolly Seber adult survival model that takes
into account the difference in recapture rates for sexed birds, Phi(t) P(sex*t), the mean adult
survival was 0.9033 ± 0.03 (Table 8). Figure 13 shows a slight decline in adult survival over this
study, but as noted in previous reports this may be due to poor survival over 2003/04, 2005/06
and 2006/07 seasons or low recapture rates during these seasons (Bell et al 2009; Bell et al. in
press).
4.5 Transect data
Twenty‐six random transects were surveyed within the study area (Fig. 5, Table 9). They ranged in
length from 130 m to 400 m, and between 3 and 25 burrows were located in each (Table 9).
Using the transect data, four burrow density grades with corresponding habitat types were
identified within the 35‐ha study area:
• High‐grade petrel habitat on ridges or spurs, usually in established canopy, with high
density burrows (≥ 100 burrows/ha), 4.669 ha;
• Medium‐grade petrel habitat on steep slopes, usually in established canopy or tall
secondary growth, with medium density burrows (50‐99 burrows/ha), 15.3013 ha;
• Low‐grade petrel habitat, on low slopes or flat ground, often boggy, with low burrow
density (1‐49 burrows/ha), 13.5607 ha;
• Non‐petrel habitat, on stream beds, cliffs, slips and swampy areas with scrub or Garnia,
with no burrows, 1.7509 ha.
Using Manifold™, vegetation and terrain survey data and ranking transects, the two‐dimensional
area for each of the habitat types in the 35‐ha study area was found to be 4.669 ha of high grade
petrel habitat, 15.3013 ha of medium petrel habitat, 13.5607 ha of poor petrel habitat and 1.7509
ha of non‐petrel habitat (Fig. 5).
The transects were stratified into habitat grades along the length of the transect and the burrows
along the length were assigned to the relevant habitat grade (Table 9).
POP2009-01 Black petrel population parameters - DRAFT
11
4.6 Population estimate from census grids and 2009/10 transect data
As stated in previous reports (Bell et al 2007, 2009; Bell et al. in press), the original population
estimates determined in earlier reports by extrapolating from the nine census grids only are
suspected to overestimate the population size (Bell & Sim 1998a, b, 2000a, b, c, 2002, 2003a, b,
2005). This is due to the fact that these grids were originally established in known areas of high
petrel density and that the study site does not have a uniform distribution of burrows.
As such, the population estimate for the 35‐ha study area was determined by extrapolating from
transects and census grid data after stratification of the 35‐ha study area into four habitat grades.
The population estimate for the 2009/10 burrow‐occupying black petrel population was between
2781 and 3287 adults (3034 ± 253 birds, Tables 9 and 10), consisting of 916 ± 60 non‐breeding
adults and 2118 ± 193 breeding adults (i.e. approximately 1059 breeding pairs).
4.7 Analysis of population estimate and trend using comparison of random transect surveys
(2004/05 and 2009/10 breeding seasons)
A random transect survey was completed in 2004/05 and repeated again in 2009/10 to determine
population size and trends of the black petrel breeding population around the 35‐ha Mt Hobson
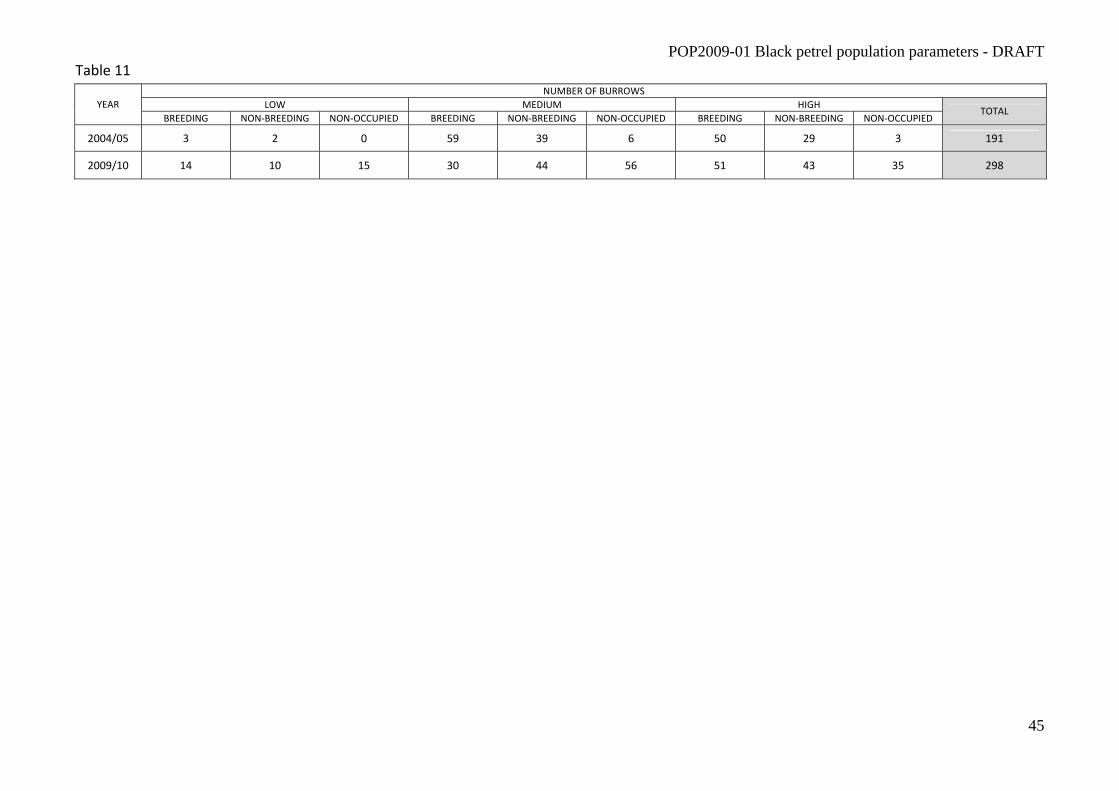
study area. There were a total of 298 burrows found in transects from 2009/10 compared to 191
from 2004/05 (Table 11, Bell et al 2009). There was nearly an 800% increase in the total number of
burrows located in the low habitat between 2004/05 (n = 5) and 2009/10 (n = 39, Table 11) and
over 1000% increase in the total number of empty burrows located (n = 9 in 2004/05 and n = 106
in 2009/10, Table 11).
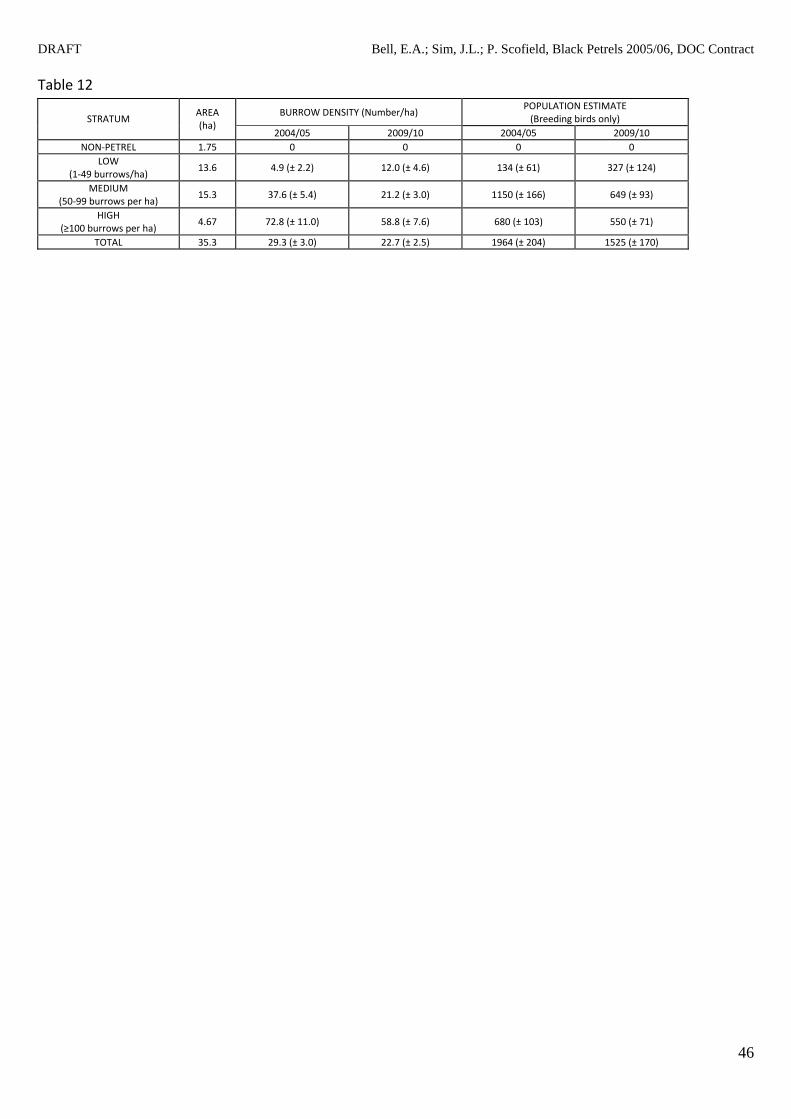
The 2009/10 breeding population estimate calculated from the random transects was 22% lower
than the 2004/05 estimate in Francis and Bell (2010, Table 12) which is a marginally significant
change (Z = (1964‐1525)/(2042+1702)0.5 = 1.65, P = 0.098, two‐sided test). It was also 5% less that
the 1988 estimate of 1598 based on data collected by Scofield (1989). However the number of
breeding burrows per hectare located within the low‐grade habitat increased by 244% (from n=4.9
to n = 12, Table 12). Breeding burrows in medium and high density areas decreased by 56% and
81% respectively (Table 12). Further details can be found in Appendix 2.
4.8 Population trends and modelling using Program SEABIRD
POP2009-01 Black petrel population parameters - DRAFT
12
The population model in Francis & Bell (2010) was updated to include the 2009/10 mark/recapture
data and the 2009/10 population estimate from random transects surveys. The additional data
made little difference to the estimated probabilities of survival, re‐sighting or transition
parameters. The estimated mean age at first breeding dropped from 6.7 to 6.6 years. Complete
details of these analyses are given in Appendix 2.
Using the outcome of active nests within the 35‐ha study area, the probability of transition
between one breeding state to another was calculated. Four states were identified: successful
breeder, failed breeder, non‐breeding bird and pre‐breeder. The probability of either a successful
breeder or an unsuccessful breeder changing to a non‐breeder was 0.37 (37%, Table 13). If a bird
does skip a year, it is more likely to be a successful breeder in the following year (36% compared
to 10%, Table 13). Interestingly pre‐breeders were more likely to attempt to breed (51%, with
most being successful breeders, 40%) as become non‐breeders (26%) or remain pre‐breeders
(23%, Table 13).
Updating the model made little difference to estimates of most parameters (such as adult survival
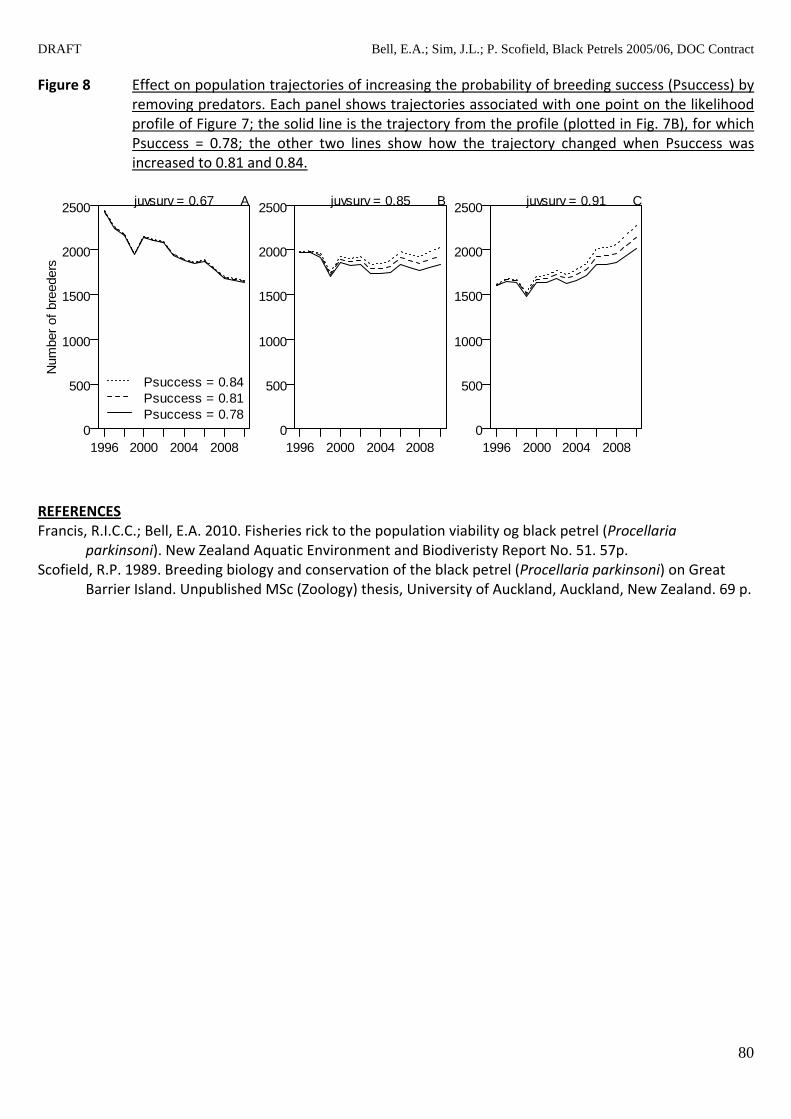
and age at first breeding). Juvenile survival estimates showed the greatest uncertainty and when
this was explored, gave a wide 95% confidence interval for this parameter of 0.67 to 0.91
(Appendix 2). This uncertainty lead to uncertainty in the estimation of population growth, with a
mean rate for population growth over the modelling period ranging from ‐2.5% per year (if
juvenile survival = 0.67) to +1.6% per year (if juvenile survival = 0.91, Appendix 2).
5 Discussion
The black petrel population on Great Barrier Island has been monitored since the 1995/96
breeding season (Bell & Sim 1998a, b, 2000a, b,c, 2002, 2003a, b, 2005; Bell et al 2007, 2009; Bell
et al. in press; Bell et al in prep.).
5.1 Breeding success
In the 2009/10 breeding season, there were 180 breeding successes and 64 breeding failures,
equating to an overall breeding success rate of 74% (Table 2). This breeding success is similar to
the previous two breeding seasons (76% and 77%, Table 2) and it is equal to the mean (75 ± 1%) of
the overall study. This rate of breeding success remains higher than reported in the earlier studies;
1977 (50%) and 1978 (60%, Imber 1987) and 1988/89 (62%, Scofield 1989). The level of dead
POP2009-01 Black petrel population parameters - DRAFT
13
embryos, crushed eggs and disappeared eggs was higher this season than previous years (Table 2).
Six of the eggs containing dead embryos had been abandoned once the eggs began to decompose.
Ten eggs also had chicks that were unable to complete hatching as these dead embryo incidences
were pipping eggs. The level of crushed eggs may relate to the competition over burrows as adults
continue to fight over very good burrows in some locations of the colony (EAB pers. obs.). There
were a high number of dead chicks; six of these were healthy chicks in the last check in February
2010, but were dead when the final check was completed in May 2010. It was not possible to
determine causes of mortality for most of these chicks; although one case were trauma from one
adult standing on the chick and another was starvation as one adult was found dead earlier in the
season and it is not possible for one parent alone to successfully raise a chick (Warham 1996).
There were no cases of disease (avian pox) this season (EAB, pers. obs.).
The level of egg abandonment was low (n = 3). This was lower than the previous two seasons
(Table 2) and is still thought that this may be related to handler disturbance or the age of the birds
as younger birds seem to be less experienced in successfully incubating eggs to hatching (EAB,
pers. obs.).
It should also be noted that 22 chicks were assumed to have fledged before the May banding visit
(Table 2). Chicks were assumed to have fledged successfully if traces of down, quill sheaths, pin
feathers and/or recent activity in the burrow could be identified. If any of these chicks had died or
been predated earlier in the season, this would reduce the breeding success to 65% (which would
then make it the lowest breeding success rate of the study, Table 2). This breeding success rate is
high compared to many other seabird species (such as Westland petrel (Procellaria westlandica)
39‐50%, Freeman & Wilson 2002, Warham 1996), but the apparent juvenile survival estimate (0.46
± 0.03 for the first three years) suggests that as many as 50% of these fledged chicks will not
survive their first three years.
Eight eggs were predated by rats (3% of all breeding attempts) within the study burrows and 20
eggs (8% of all breeding attempts) disappeared (but may have been predated by rats or crushed
by parents, Table 2). There were no feral cat predation events recorded within the study burrows
this season; however one juvenile petrel inside the study area, but not in study burrows and four
chicks outside the study area were predated by feral cats (including two much lower down below
the study area). All of these juvenile petrels appeared to have been predated when outside the
POP2009-01 Black petrel population parameters - DRAFT
14
burrow (stretching wings, attempting to fledge at a launch site, etc.) as their bodies were found in
the open and in some cases well away from burrows (EAB, pers. obs.). Juvenile petrels are
particularly vulnerable to feral cat predation at fledging time (Warham 1996). Fourteen chicks are
known to have been predated by cats between 1996/97 to 2007/08 seasons (Table 2). It is,
therefore, important to continue cat trapping in the area before, during and after the black petrel
breeding season.
Despite the drop this season, the number of burrows used for breeding has stabilised since the
1999/2000 season (Fig. 6), breeding success has remained high since 1998 – within a range of 67%
to 83% ‐ and appears to be increasing (Table 2, Fig. 6). Analysis of adult recaptures found a 15%
rate of skipping from successful breeding to non‐breeding status as well as a further 22% rate of
skipping from unsuccessful breeding to non‐breeding status; however if a bird does skip a year, it
is likely to breed successfully (36%) rather than unsuccessfully (10%) the following year (Table 13).
Interestingly, by adding the latest two years data to the dataset (1995/96 to 2009/10), over half
the non‐breeding birds of one year will remain non‐breeding birds in year two (Table 13)
compared to earlier analysis of the dataset (1995/96 to 2007/08) where only quarter of the birds
remained non‐breeders (Bell et al. in press). Skipping and subsequent improvement of breeding
chances may also relate to migration as it is not known if birds choose to remain in South America
if they do not obtain adequate body condition to return to New Zealand to breed.
The number of burrows used by non‐breeding birds or remaining non‐occupied increased this
season (Fig. 6), but this could be related to the condition of some study burrows. Three study
burrows deteriorated this season to become unsuitable for breeding (without additional
excavation by the birds). The resident birds from these burrows were either not recaptured or had
moved to another burrow nearby. Reasons whether a burrow is used for breeding may relate to
the characteristics of that burrow (exposure, depth, entrance, moisture) and any changes to those
characteristics (flooding, collapse etc., Warham 1996) may cause birds to move from or avoid
these burrows and as a result affect breeding success and burrow activity.
Despite the small drop this season, it appears that the percentage of burrows used for breeding
has remained relatively constant over the past twelve breeding seasons (mean 67%, Tables 1 and
2) whereas the percentage of non‐occupied and non‐breeding burrows has fluctuated from year
to year (Table 1). This may mean that once a pair begins to breed they are more likely to remain as
POP2009-01 Black petrel population parameters - DRAFT
15
a breeding pair and attempt to breed rather than skip breeding (i.e. become non‐breeders) and
that the number of non‐breeding or pre‐breeding birds in the study area varies each season. It is
also possible that as 46% of non‐breeding birds and 51% of pre‐breeders become breeding birds
the following year (Table 13), they replace previous breeders that may have died, divorced or
skipped a year. These changes in proportions of non‐breeding birds may relate to whether the
non‐breeding and pre‐breeding birds were successful in creating and maintaining a pair bond that
season (and then will attempt to breed the next season). It is also possible that as the number of
monitoring visits to the colony has been increased to three trips during the incubation and chick
rearing stages there has been more accurate determination of whether a burrow is being used by
breeding or non‐breeding birds (rather than remaining non‐occupied).
Using data from the past twelve breeding seasons (since 1997/98) the proportion of non‐occupied
study burrows has been slightly increasing, although it has fluctuated in more recent years (Table
1, Fig. 6). This may be directly related to handler disturbance, observation hatches being dug or
adult mortality (mean apparent adult survival rate of 0.9033 ± 0.03). Analysis of adult survival and
site fidelity suggested that black petrels have a relatively low apparent adult survival (90%
compared to other seabird species such as Antipodean albatross (Diomedea antipodensis) 96%,
Walker & Elliott 2004). However, nearly 10% of birds may be permanently emigrating (Bell et al
2007, Bell et al. in press). Although birds do not appear to abandon the burrow at any time during
the breeding season, they may choose to move to a new burrow the following year. Further
surveys within the study area could determine whether birds have moved to nearby, but non‐
study, burrows to avoid disturbance. As stated earlier the reduction in burrows used for breeding
may also relate to changes in the their characteristics, as several burrows have flooded in
particularly wet years and collapsed over time, making then unusable for a year or more. This may
account for the declining occupancy of burrows, but as there has been an immigration event from
Hauturu/Little Barrier Island, site fidelity and the possibility of emigration from Great Barrier Island
needs further investigation. Work needs to be done separating the components of apparent
survival to determine whether the low apparent survival is due to mortality or emigration. This
would require a thorough search for recovery data from banding records and continued (and
wider) recapture effort at the study. It should be noted that the fidelity model only used a small
number of recoveries and that more work needs to be done to determine whether this is true and
whether emigration or mortality have a larger effect (Bell et al. in press).
POP2009-01 Black petrel population parameters - DRAFT
16
It should also be noted that many of the study burrows have been monitored for ten seasons or
more and many of the resident birds have continued to use these burrows for the entire study
period. This suggests that handler disturbance does not have a large impact, although this may
have to be related to individual birds (as some birds are more vulnerable to disturbance).
5.2 Survival estimates
The apparent adult survival estimates for black petrels in the study area (90%, Table 8) were
unusually low for a seabird of this size, but comparable to adult black petrel survival estimates
made by Hunter et al (88%, 2001) and Fletcher et al (85%, 2008). Program SEABIRD also suggested
that total adult survival for breeders has increased between 1995/96 and 2008/09 (Appendix 2),
despite sex‐based survival estimates showing a decrease over the same period (Bell et al., in
press). However, these sex‐based trends are not significant and may be related to different
recapture probabilities for males and females. The increase in overall apparent adult survival may
relate to the regular increase in the number of study burrows monitored over the study period
and increased night capture effort (i.e. surveys carried out every night for ten nights during the
December trips).
Although the adult recapture data for the census grids between 1999/2000 to 2009/10 suggests
the black petrel population is increasing between 1 to 1.5%, comparing the overall data with just
that relating to the “foundation burrows” (i.e. those which have been monitored for ten years or
more), indicates that the population has slightly decrease (Bell et al. 2007). However, as survival in
this foundation group was lower than the entire dataset, the population trend may be related to
occupancy of the census grid burrows and the possibility of handler disturbance rather than
mortality. Again it is important to undertake thorough surveys within the 35‐ha study area to get
better recapture rates of banded adults, juveniles and immigrating adults (including recoveries of
dead adults) to increase the accuracy of the survival, immigration and fidelity estimates.
A total of 807 banded birds were identified this season; 636 were adults and 171 were fledglings
(Table 5). There were 529 recaptures of previously banded birds, including 41 that were ‘returned
chicks’ (Tables 5 and 6). One adult (banded as a chick on Little Barrier Island) and first caught on
Great Barrier Island in 2005/06 was recaptured again this season. This bird represents the first
recorded immigration event for black petrels. It is likely that birds from Little Barrier Island are
being attracted to Great Barrier Island due to the number of birds’ resident there (and resulting
POP2009-01 Black petrel population parameters - DRAFT
17
noise early in the breeding season). Immigration has implications for population modelling work
(as most models assume no immigration), and further surveys and mark‐recapture work is needed
to maximise the chances of recapturing known birds and returned fledglings.
Of the 41 returned chicks, 4 were recaptured in their natal burrows, 12 in their natal area (less
than 50 metres from their ‘hatching’ burrow) and the other 25 were caught more than 100 m
away from their natal areas. There is a probable capture bias towards the returning males due to
their behaviour, i.e. calling outside burrows. Despite being attracted to calling males, females are
likely to be more difficult to detect as they will attend males in all parts of the colony, both inside
and outside the study area. Much of the 35‐ha study area is difficult to reach and cannot be
searched. This will need to be taken into account for further survival and recruitment analysis.
Since the first chick was recaptured in the 1999/00 season, 94 ‘chicks’ have been recaptured
(Table 5). There have been 79 records of ‘returned chicks’ attempting to breed during this period,
and the age of first recorded breeding and that of first successful breeding are both between 4
and 10 years (Table 5, Fig. 11, Appendix 3). It is important to check for more ‘returned chicks’ and
maintain intensive burrow monitoring in areas where returned ‘chicks’ are present. Many of the
returned ‘chicks’ were recaptured at night during the December 2009 visit, so it is important to
maintain a high level of night searching at this time of year. Further, these data allow for
mark/recapture analyses, which could greatly assist in understanding black petrel demographics.
Bell et al (in press) analysed chick recapture data (for chicks banded on Great Barrier Island since
1996) using a CJS analysis (incorporating two chick‐survival parameters, 0–3 years and > 3 years)
and found that chick survival up to year 3 was 0.4600 (± 0.03) and after the first 3 years increased
to 0.8992 (± 0.04), which is only slightly lower (and not significantly different) than the mean
apparent adult survival (0.9033 ± 0.03). These survival figures are similar to other juveniles
seabirds of this size (Hunter et al 2001, Barbraud et al 2008, Fletcher et al 2008). When the mean
annual apparent juvenile survival of 0.7923 (± 0.05) is related to black petrel population growth
estimates from the SEABIRD model, they indicate a population decline over the length of the study
of 1.4% per year (Appendix 2). The model indicates that the population is stable or increasing only
if mean annual juvenile survival is over 0.85 (Appendix 2). Better estimates of juvenile survival may
be obtained over time if more returned ‘chicks’ are recaptured.
POP2009-01 Black petrel population parameters - DRAFT
18
5.3 Population Estimate
The population estimate for the 35‐ha study area was calculated using stratified transect and
census grid data since surveys and local knowledge of Great Barrier Island showed that petrel
burrow densities were not identical throughout the 35‐ha study area (EAB, pers. obs.). Earlier
black petrel population estimates (Bell & Sim 1998a, b, 2000a, b, c, 2002, 2003a, b, 2005) were
likely to be overestimates as they did not take into account the range of habitat types and range of
burrow density identified with the 35‐ha study area. From the transect data it was found that the
highest densities of black petrel burrows were located on ridges or spurs with established canopy.
The breeding population was estimated at approximately 1059 breeding pairs (2118 breeding
birds) using the census grids and 2009/10 random transects (Table 10). This estimate only covers
the 35‐ha study area around the summit of Mount Hobson, although this is the main population
location and contains the highest density of the population. We consider that delimiting the lower
boundaries of the entire black petrel colony within the Mount Hobson Scenic Reserve is the
highest priority for further work, so that a complete estimate of the black petrel population in this
area can be achieved. The population estimate extrapolated from the census grids and random
transects is higher than the estimate calculated by SEABIRD using only the transects; this may be
due to the fact that breeding burrows have been under‐estimated within the transect surveys.
This may be due to eggs not being laid or failed already at the time of survey (and incorrectly
assessed as empty or non‐breeding). There may be a bias (and likely underestimate) in breeding
burrows when undertaking random transects in December as the burrows are only assessed once.
For example, a mean of 26% further eggs were laid in study burrows in January/February than
were present in December (2006/07 to 2009/10 breeding seasons), so the random transect survey
could be underestimating breeding burrows by at least 25%.
Francis and Bell (2010) used the original stratified 2004/05 transect data to estimate the
population at 1964 breeding birds and compared it to the earlier estimates by Scofield (1989)
suggesting a population increase of 1.2% per annum. This was recognised as a very uncertain
estimate as the survey methods were different and covered different areas (Francis and Bell
2010). The random transect survey was repeated this season and these results were compared to
the 2004/05 results; the 2009/10 breeding population estimate (1525) was 22% less than the
2004/05 estimate (approximately ‐4% decrease per year) and 5% less than the estimate (1598) by
Scofield (1989). However, assessing the breeding population trend using the census grid data
POP2009-01 Black petrel population parameters - DRAFT
19
estimated an annual increase in the number of breeding birds between 1 and 1.5% per year and
mean apparent juvenile survival (0.79 from Program MARK calculations) equates to an 1.4%
annual population decline (Appendix 2). Two estimates cannot be introduced into the SEABIRD
model (the Scofield survey and census gird estimates of population growth) and it is difficult to
know how much these estimates will affect the population growth of the entire breeding
population. It is difficult to compare the Scofield estimate as the methods are different and the
trends in the census grids may not represent the whole population. However, it is likely that mean
rate of change of the black petrel population on Great Barrier Island has not exceeded 2% per
year, although the direction of change in uncertain (and may alter from year to year), but is most
likely to be in decline.
It was noted that the number of non‐occupied burrows along the transects had increased
markedly between the two survey periods and from those within the census grids (Appendix 2).
This may have been a result of the survey technique as only one team completed the 2009/10
random transects while two teams completed the 2004/05 random transects. Unlike 2004/05
where survey teams may have been less experienced and/or more cautious in identifying and
assessing burrows, in 2009/10 EAB could confirm whether every burrow was suitable for black
petrels and confirm the breeding status of each. It could be valuable to resurvey the original
transects using one team to confirm the number and status of burrows and reassess the
population estimates. Alternatively a further random transect survey could be repeated in five
years and compared to the first two surveys.
Further transects throughout the study area would improve this population estimate as well as
more accurately defining the range of the four burrow density habitat grades (or possibly identify
more). It is also important to examine the difference between two‐ and three‐dimensional
estimates of density and population size in this steep and difficult terrain. It is important to
undertake further transects within the 35‐ha study area to improve this population estimate.
To gain a better population estimate to the whole black petrel population on Great Barrier Island,
further surveys would need to be undertaken in other areas on the island. In addition to the
summit area of Mount Hobson, black petrels are known to nest on other high points around the
summit area, in northern areas of the island, in small pockets of private land and towards the
southern end of the island. Randomly selected census grids, transects or further intensive surveys
POP2009-01 Black petrel population parameters - DRAFT
20
in these areas would give a better idea of burrow density and range around the island. These
surveys could be undertaken on or near the Hog’s Back, Mount Heale and Mount Matawhero. It is
interesting to note that several pairs of black petrels have been found well below 300m a.s.l. (EAB
pers. obs.), which raises the possibility that other birds may also be breeding at lower elevations.
This possibility should be investigated further.
5.4 Population trends
Nine grids were intensively monitored over each visit during the 2009/10 breeding season. Three
new burrows were found; the number of burrows within the grids has risen from 118 in
1999/2000, 148 in 2005/06, 152 in 2008/09 and to 155 in 2009/10. There has been a 32% increase
in burrow numbers between 2000 and 2009 (Francis and Bell 2010). It is important to realise that
although Francis and Bell (2010) suggested that this increase in burrow numbers in the census
grids between 2000 and 2009 corresponded to an increase in the breeding population of between
2.2 and 3.1% per year, this was based on the assumption that there was no long‐term trend in the
percentage of burrows used for breeding. With the addition of another year’s data, there was a
marginally significant downward trend in the percentage of burrows used for breeding (P = 0.045,
Fig. 9, Appendix 2). As such population growth was calculated by fitting regression lines to counts
of breeding burrows using the additional years breeding burrow data and based on calculating all
years counts (rather than the first and last year’s only) and growth was reduced to between 1 and
1.5% (Appendix 2). However it is important to assess population growth in relation survival (adult,
pre‐breeder and juvenile) as this growth may be due to the increased search effort rather than an
actual increase in bird numbers, breeding population or creation of new burrows.
New burrows do not necessarily mean that more birds are present in the colony, as several birds
(n=263) have moved between numbered burrows within the 35‐ha study area between 1995/96
and 2009/10 breeding seasons and certain original burrows are no longer active (due to collapse
or flooding). Loss of a partner can result in a bird (particularly females) moving burrows (Warham
1996). Predation events and competition between adults and pre‐breeders can also cause
movement between burrows (EAB, pers. obs., Warham 1996). Pre‐breeding males appear to be
attracted back to their natal area and can excavate new burrows in those areas (Warham 1996).
This has occurred in the study area on Great Barrier Island when several pre‐breeding (or non‐
breeding) birds have returned to their natal area (and in eleven cases to their natal burrows) and
have been recorded either fighting with the resident pair (which can be their parents) for their
POP2009-01 Black petrel population parameters - DRAFT
21
natal burrow or have started to excavate new burrows nearby, hence increasing burrow numbers
in certain areas (and census grids, EAB, pers. obs.).
Transition data showed a 37% probability of either a successful breeder or an unsuccessful
breeder changing to a non‐breeder (i.e. skipping a year, Table 13). Also if that bird skips a year, it is
more likely to skip another year than attempt to breed the following year (54% compared to 46%,
Table 13). The option of skipping may relate to a number of factors including breeding outcome,
partner selection, burrow condition, handler disturbance and divorce. Further analysis suggested a
13% divorce rate; however, over 70% of pairs survive annually and 64% of any pair (new or
surviving) nest in any one year (Bell et al. in press). It is difficult to determine the reason for
divorce, and the reasons why birds chose to skip a year may relate to breeding outcome, burrow
condition, handler disturbance or a combination of these (or other) factors. The trend in behaviour
and outcome prior to the divorce event needs to be investigated. For example, if one bird skips a
year (i.e. remaining in South America), does the other bird attempt to breed with a new partner
when it returns to the colony? Does the original pair return to breed at a later date? The analysis
suggests that original pairings return in about 1% of cases of divorce, but increasing recapture
effort to determine whether birds have really divorced or skipped is vital. Further analysis of the
present breeding and recapture data may give a clearer pattern to the levels and causes of
skipping and divorce.
5.5 Conservation
A recent estimate indicates that about 7000 people visit Mount Hobson each year (Peter Cann,
DOC, pers. comm.), but this use appears to have little or no impact on the breeding success of the
black petrel in this area. Information about the black petrels at the track start/end points and on
the summit has increased awareness of the birds and the unique environment they inhabit.
However, littering and public fouling (defecation), continues to occur in the summit area is of
concern because it could introduce disease or lead to an increase in rat numbers.
The recent construction of raised walkways around the summit reduced damage to the overall
environment and to the burrows in that area. Serious erosion had been occurring along certain
sections of the South Fork and Palmers Tracks, and DOC (Great Barrier Area Office) extended the
boardwalk system into the South Forks and Palmers Track areas between 2007 and 2009. The
Kauri Dam section was completed in February 2011 (Ken Scott, DOC, pers. comm.). The contract
POP2009-01 Black petrel population parameters - DRAFT
22
construction team (Walkway Solutions) consulted with local DOC staff and the authors. A number
of burrows were identified within the construction zone and these were avoided by the new
boardwalk.
A total of 38 black petrels (including two banded by the authors) were recorded by government
observers as bycatch on commercial fishing vessels in the New Zealand fisheries between 1
October 1996 and 30 June 2009 (Robertson et al. 2004; Conservation Services Programme 2008;
Rowe 2009, 2010; Thompson 2010a, b, c). These birds have been caught on both trawl and long‐
line vessels between October and May, either east of North Cape, near the Kermadec Islands or
north of Great Barrier Island (Robertson et al. 2003, 2004; Conservation Services Programme 2008;
Rowe 2009, 2010, Thompson 2010a, b, c). The timing of their capture suggests that most may have
been breeding adults. This means that their deaths would have reduced overall productivity and
recruitment. The level of bycatch for black petrels outside New Zealand waters is unknown, and
may impact on the population dynamics of the species.
If breeding adults continue to be caught by commercial fishing operations in New Zealand and
overseas, this species could be adversely affected especially as black petrels have delayed
maturity, low reproduction rates and high adult survival (Murray et al 1993). Even a small change
in adult survival could affect the population greatly (Murray et al. 1993). Continued bycatch of
breeding adults in New Zealand and overseas fisheries has the potential to seriously affect the
species.
Black petrels are recognised as one seabird species that is at the greatest risk from commercial
fishing activity within New Zealand waters (Rowe 2009, Abraham et al 2010, Baird & Gilbert 2010).
There is a high level of uncertainty around estimates of total bycatch in New Zealand fisheries, but
recent estimation work suggests the number black petrel captures in New Zealand commercial
trawl and long‐line fisheries may be several hundred per annum (Yvan Richard pers. comm.). This
suggests that bycatch is potentially far exceeding a biological limit and could have serious impacts
on the black petrel population.
It is important to continue to monitor the Great Barrier Island black petrel population. Long‐term
population data combined with improved technology and further use of data‐loggers can be used
to develop an accurate population model to determine adult survivorship, recruitment, mortality
POP2009-01 Black petrel population parameters - DRAFT
23
and productivity as well as assess factors affecting the black petrel population, particularly likely
overlap or risk areas with fisheries and the overall effects of fisheries bycatch by the commercial
fishing industry.
6 Recommendations
The authors recommend that:
• Monitoring of the black petrel population (using the study burrows) is continued at
Great Barrier Island up to and including the 2024/25 breeding season. This will ensure
that 25 years of comparative data are collected to determine the population dynamics
of black petrels, allowing us to develop a multi‐generational population model to
determine survivorship, mortality and the effects of predation, commercial fishing and
other environmental factors.
• The November/December visit to the study area should be continued. Visiting at this
time allows a large number of birds to be banded or recaptured easily, as the birds are
often outside the burrows during this period. A high rate of banding and recapture will
enable the continuation of the mark‐recapture programme.
• The study burrows should be checked for breeding status during every visit to the study
area, to give a more accurate estimate of breeding success and determine sex of adults.
This would also provide an opportunity to recapture returning birds banded as chicks.
• The April/May visit should continue, as this allows time for chicks to be banded before
they fledge.
• Further random transects are undertaken every five years throughout the 35‐ha study
area around Mount Hobson to increase the likelihood of adult and juvenile recaptures
(to improve survival and immigration estimates) and to compare with earlier transect
surveys to determine population trends.
• The exact limits of the entire Mount Hobson (Hirakimata) colony should be established
and the area calculated by a ground truth survey. Random transects should be
established on other high points around the Mount Hobson area (e.g. Mount Heale,
Mount Matawhero and The Hogs Back). These sites should be monitored as long as the
study continues.
• Cat trapping should be implemented before and during the black petrel breeding
season, November to June, especially during pre‐laying (October/November) and the
fledging period (May to June).
POP2009-01 Black petrel population parameters - DRAFT
24
7 Acknowledgements
This project was funded by the Department of Conservation (Science Investigation No.
POP2009/01). Halema Jamieson and Joanna Sim (DOC, Great Barrier Island) assisted with transport
around Great Barrier Island, logistical support and in the field. Conori Bell, Heather Smithers, Paul
Garner‐Richards and Mark Fraser assisted in the field. Kelvin Floyd developed and designed
Figures 1, 2, 3 and 4 and also assisted in the field. Dr. Christopher Robertson (WildPress) and David
Thompson (NIWA) provided information on bycatch. Mike Imber and the DOC Banding Office
provided details on the black petrel banding records.
8 References
Abraham, E.; Berkenbusch, K.; Richard, Y. 2010. The capture of seabirds and marine mammals in
New Zealand non‐commercial fisheries. New Zealand Aquatic Environment and Biodiversity
Report No. 64. 52 p.
Abraham, E.R.; Thompson, F.N. 2010. Estimated capture of seabirds in New Zealand trawl and
longline fisheries, 2002–03 to 2006–07. Final Research Report for research project
PRO2007/01. Ministry of Fisheries, Wellington.
Baird, S.; Gilbert, D. 2010. Initial assessment of risk posed by trawl and longline fisheries to
seabirds breeding in New Zealand waters. New Zealand Aquatic Environment and
Biodiversity Report No.50. 98 p.
Bell, E.A.; Sim, J.L. 1998a. Survey and monitoring of black petrels on Great Barrier Island 1996.
Science for Conservation:77. Department of Conservation, Wellington.
Bell, E.A.; Sim, J.L. 1998b. Survey and monitoring of black petrels on Great Barrier Island 1997.
Science for Conservation:78. Department of Conservation, Wellington.
Bell, E.A.; Sim, J.L. 2000a. Survey and monitoring of black petrels on Great Barrier Island 1997/98.
Published client report on contract 3085, funded by Conservation Services Levy.
Department of Conservation, Wellington. 24 p.
Bell, E.A.; Sim, J.L. 2000b. Survey and monitoring of black petrels on Great Barrier Island 1998/99.
Published client report on contract 3089, funded by Conservation Services Levy.
Department of Conservation, Wellington. 23 p.
Bell, E.A.; Sim, J.L. 2000c. Survey and monitoring of black petrels on Great Barrier Island
1999/2000. Published client report on contract 3018, funded by Conservation Services
Levy. Department of Conservation, Wellington. 30 p.
POP2009-01 Black petrel population parameters - DRAFT
25
Bell, E.A.; Sim, J.L. 2002. Survey and monitoring of black petrels on Great Barrier Island 2000/01.
DOC Science Internal Series 48. Department of Conservation, Wellington. 24 p.
Bell, E.A.; Sim, J.L. 2003a. Survey and monitoring of black petrels on Great Barrier Island 2001/02.
DOC Science Internal Series 134. Department of Conservation, Wellington. 24p.
Bell, E.A.; Sim, J.L. 2003b. Survey and monitoring of black petrels on Great Barrier Island 2002/03.
DOC Science Internal Series 135. Department of Conservation, Wellington. 28p.
Bell, E.A.; Sim, J.L. 2005. Survey and monitoring of black petrels on Great Barrier Island 2003/04.
DOC Research and Development Series 213. Department of Conservation, Wellington. 27p.
Bell, E.A.; Sim, J.L.; Scofield, P. 2007. Demographic parameters of the black petrel (Procellaria
parkinsoni). DOC Research and Development Series 273. Department of Conservation,
Wellington. 32p.
Bell, E.A.; Sim, J.L.; Scofield, P. 2009. Population parameters and distribution of the black petrel
(Procellaria parkinsoni), 2005/06. DOC Research and Development Series 307. Department
of Conservation, Wellington. 47p.
Bell, E.A.; Sim, J.L.; Scofield, P. In press. Population parameters and distribution of the black petrel
(Procellaria parkinsoni) on Great Barrier Island (Aotea Island), 2007/08. DOC Marine
Conservation Services Series XX. Department of Conservation, Wellington. 37p.
Bell, E.A.; Sim, J.L.; Scofield, P. In prep. Population parameters and distribution of the black petrels
(Procellaria parkinsoni) on Great Barrier Island (Aotea Island), 2008/09.
Conservation Services Programme. 2008. Summary of autopsy reports for seabirds killed and
returned from observed New Zealand fisheries: 1 October 1996 to 30 September 2005,
with specific reference to 2002/03, 2003/04 and 2004/05. DOC Research and Development
Series 291. Department of Conservation, Wellington. 110 p.
Francis, R.I.C.C.; Bell, E.A. 2010. Fisheries risks to population viability of black petrel (Procellaria
parkinsoni). New Zealand Aquatic Environment and Biodiversity Report No. 51. Ministry of
Fisheries, Wellington.
Freeman, A.N.D.; Wilson, K‐J. 2002. Westland petrel and hoki fishery waste: opportunistic use of a
readily available resource? Notornis 49:139‐144.
Heather, B. and Robertson, H. 1996. Field guide to the birds of New Zealand. Penguin Book (NZ)
Ltd, Auckland, New Zealand. 432p.
Hunter, C.; Fletcher, D.; Scofield. P. 2001. Preliminary modelling of black petrels (Procellaria
parkinsoni) to assess population status. DOC Science Internal Series 2. Department of
Conservation, Wellington, New Zealand. 42p.
POP2009-01 Black petrel population parameters - DRAFT
26
Imber, M.J. 1987. Breeding ecology and conservation of the black petrel (Procellaria parkinsoni).
Notornis 34: 19‐39.
Murray, T.E.; Bartle, J.A.; Kalish, S.R.; Taylor, P.R. 1993. Incidental capture of seabirds by Japanese
southern bluefin tuna long‐line vessels in New Zealand waters, 1988‐1992. Bird
Conservation International 3 (3): 181‐210.
Ramm, K. In press. Conservation Services Programme Observer Report for the period 1 July 2009
to 30 June 2009. Department of Conservation Marine Conservation Services Series.
Department of Conservation, Wellington.
Richard, Y.; Abraham, E.R.; Filippi, D. 2011. Assessment of the risk to seabird populations from New
Zealand commercial fisheries. Final Research Report for Ministry of Fisheries projects
IPA2009/19 and IPA2009/20. Ministry of Fisheries, Wellington, New Zealand. 137 p.
Robertson, C.J.R.; Bell, E.A.; Scofield, P. 2003. Autopsy report for seabirds killed and returned from
New Zealand fisheries, 1 October 2000 to 30 September 2001: birds returned by Ministry of
Fisheries observers to the Department of Conservation. DOC Internal Series 96.
Department of Conservation, Wellington. 36 p.
Robertson, C.J.R.; Bell, E.A.; Scofield, P. 2004. Autopsy report for seabirds killed and returned from
New Zealand fisheries, 1 October 2001 to 30 September 2002: birds returned by Ministry of
Fisheries observers to the Department of Conservation. Department of Conservation
Internal Series 155. Department of Conservation, Wellington. 43p.
Rowe, S.J. 2009. Conservation Services Programme Observer Report: 1 July 2004 to 30 June 2007.
Department of Conservation Marine Conservation Services Series 1. Department of
Conservation, Wellington. 93 p.
Rowe, S. 2009. Level 1 Risk Assessment Methodology for incidental seabird mortality associated
with New Zealand fisheries in the NZ‐EEZ. Unpublished report to the Seabird Stakeholder
Advisory Group. Department of Conservation, Wellington.
Rowe, S.J. 2010. Conservation Services Programme Observer Report: 1 July 2007 to 30 June 2008.
Department of Conservation Marine Conservation Services Series 4. Department of
Conservation, Wellington. 97 p.
Scofield, R.P. 1989. Breeding biology and conservation of the black petrel (Procellaria parkinsoni)
on Great Barrier Island. Unpublished MSc (Zoology) thesis. Auckland University, Auckland,
New Zealand. 69p.
Thompson, D. 2010a. Autopsy report for seabirds killed and returned from New Zealand fisheries,
1 October 2006 to 30 September 2007: birds returned by Ministry of Fisheries observers to
POP2009-01 Black petrel population parameters - DRAFT
27
the Department of Conservation. Department of Conservation Marine Conservation
Services Series 3. Department of Conservation, Wellington. 37 p.
Thompson, D. 2010b. Autopsy report for seabirds killed and returned from New Zealand fisheries,
1 October 2007 to 30 September 2008: birds returned by Ministry of Fisheries observers to
the Department of Conservation. Department of Conservation Marine Conservation
Services Series 5. Department of Conservation, Wellington. 33 p.
Thompson, D. 2010c. Autopsy report for seabirds killed and returned from New Zealand fisheries,
1 October 2008 to 30 September 2009: birds returned by Ministry of Fisheries observers to
the Department of Conservation. Department of Conservation Marine Conservation
Services Series 6. Department of Conservation, Wellington. 37 p.
Walker, K.; Elliott, G. 2005. Population changes and biology of the Antipodean wandering albatross
(Diomedea antipodensis). Notornis 52:206‐214.
Warham, J. 1996. The behaviour, population biology and physiology of the petrels. Academic Press,
London. 613p.
POP2009-01 Black petrel population parameters - DRAFT
28
Tables
Table 1 Proportions of occupied, non‐occupied, breeding and non‐breeding burrows, ratio
of occupied to non‐occupied and breeding to non‐breeding burrows, and breeding success, within the black petrel (Procellaria Parkinsoni) study burrows on Great Barrier Island (Aotea Island) since the 1998/99 breeding season.
Table 2 Breeding success and causes of mortality in the black petrel (Procellaria Parkinsoni)
study burrows on Great Barrier Island (Aotea Island) between the 1995/96 and 2009/10 breeding seasons.
Table 3 Type and number of study burrows within the black petrel (Procellaria Parkinsoni)
census grids (Kauri Dam, Palmers Track and South Forks) in the study area on Great Barrier Island (Aotea Island) between the 1995/96 and 2009/10 breeding seasons.
Table 4 Banding, recapture and recovery data from all black petrels (Procellaria Parkinsoni)
caught within the study area on Great Barrier Island (Aotea Island) for the breeding seasons 1995/96 to 2009/10.
Table 5 Total number of black petrel (Procellaria parkinsoni) chicks banded each season and
the proportion of those chicks that have been recaptured within the study site on Great Barrier Island (Aotea Island) for breeding seasons 1995/96 to 2009/10.
Table 6 Number of black petrel (Procellaria parkinsoni) ‘returned chicks’ that have been
recaptured within the study site on Great Barrier Island (Aotea Island) for breeding seasons 1995/96 to 2009/10.
Table 7 Number of black petrel (Procellaria parkinsoni) ‘returned chicks’ that were
recaptured each season and whether the ‘returned chick’ attempted to breed within the study site on Great Barrier Island (Aotea Island) for breeding seasons 1995/96 to 2009/10.
Table 8 Adult survival estimates for black petrels (Procellaria Parkinsoni) on Great Barrier
Island (Aotea Island) between 1996/97 and 2008/09. Estimates obtained by Cormack Jolly Seber model [Phi(t) P(sex*t)] analysis (using Program MARK) with standard errors and 95% confidence intervals.
Table 9 Total length of each transect, section length of each transect in each habitat type
after stratification and number of black petrel (Procellaria parkinsoni) burrows in each section of transect in the 35‐ha study site around Mount Hobson, Great Barrier Island (Aotea Island).
Table 10 2009/10 population estimate of black petrels (Procellaria parkinsoni) in the 35‐ha
study area around Mount Hobson, Great Barrier Island (Aotea Island) after stratifying and grading the transects and census grids. Area of each burrow density grade is 4.669 ha of high grade petrel habitat, 15.3013 ha of medium petrel habitat, 13.5607 ha of poor petrel habitat and 1.7509 ha of non‐petrel habitat.
POP2009-01 Black petrel population parameters - DRAFT
29
Table 11 Comparison of the number of black petrel (Procellaria parkinsoni) burrows by habitat grade from random transects surveys in 2004/05 breeding season and 2009/10 breeding season on Great Barrier Island (Aotea Island).
Table 12 Comparison of estimated densities of black petrel (Procellaria parkinsoni) breeding
burrows and numbers of breeding birds (population estimate) by habitat grade from random transects surveys in 2004/05 breeding season and 2009/10 breeding season on Great Barrier Island (Aotea Island).
Table 13 Probability estimates for breeding state in one year changing to a different state in
the following year for adult black petrel (Procellaria parkinsoni) in the 35‐ha study area on Great Barrier Island (Aotea Island).
POP2009-01 Black petrel population parameters - DRAFT
30
Figures Figure 1 Location of the black petrel (Procellaria parkinsoni) study burrows and census grids
within the study area on Great Barrier Island (Aotea Island). Altitude (621 m a.s.l.) is shown. Approximate North is shown (N). KDG = Kauri Dam Grid; SFG = South Forks Grid; PTG = Palmers Track Grid.
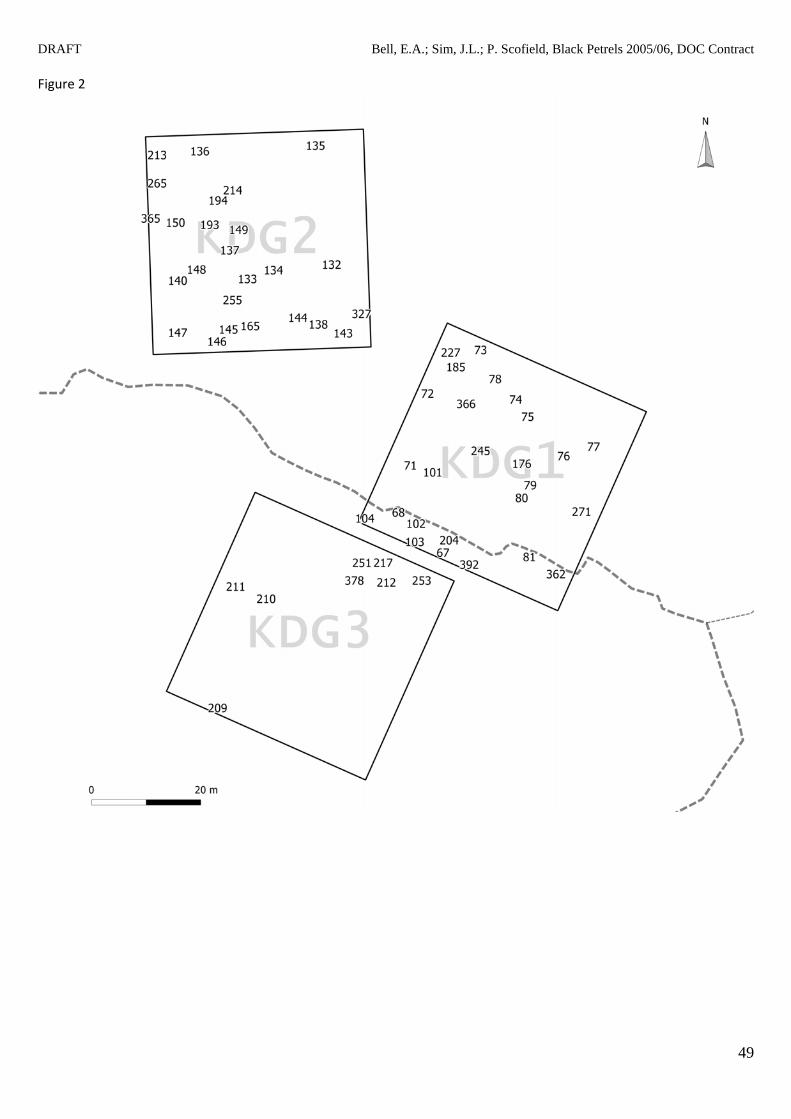
Figure 2 Location of black petrel (Procellaria parkinsoni) burrows found on the Kauri Dam
Grid (each grid is 40 x 40 m), Great Barrier Island (Aotea Island). Approximate North is shown (N).
Figure 3 Location of black petrel (Procellaria parkinsoni) burrows found on the Palmers Track
Grid (each grid is 40 x 40 m) on Great Barrier Island (Aotea Island). Approximate North is shown (N).
Figure 4 Location of black petrel (Procellaria parkinsoni) burrows found on the South Fork
Grid (each grid is 40 x 40 m) on Great Barrier Island (Aotea Island). Approximate North is shown (N).
Figure 5 Locations of random transects and habitat grades, based on black petrel (Procellaria
parkinsoni) burrow density (incorporating habitat characteristics) within the 35‐ha study site on Great Barrier Island (Aotea Island). There are 1.8 ha of non‐petrel habitat, 13.6 ha of low‐grade (< 50 burrows per ha) petrel habitat, 15.3 ha of medium grade (50‐99 burrows per ha) petrel habitat and 4.7 ha of high‐grade (≥ 100 burrows per ha) petrel habitat.
Figure 6 Occupancy and breeding success of study burrows (1998/99 to 2009/10 breeding
years) by black petrels (Procellaria parkinsoni) on Great Barrier island (Aotea Island). Solid black line = breeding success; dashed black line = burrows used by breeding birds; dotted line = burrows used by non‐breeding birds; solid grey line = unoccupied burrows.
Figure 7 Occupancy of census grid burrows (1995/96 to 2009/10 breeding years) by black
petrels (Procellaria parkinsoni) on Great Barrier Island (Aotea Island). Dashed black line = burrows used by breeding birds; dotted line = burrows used by non‐breeding birds; solid grey line = unoccupied burrows.
Figure 8 Number of burrows (1995/96 to 2009/10 breeding years) in each census grid on
Great Barrier Island (Aotea Island). A = Kauri Dam; B = Palmers Track; C = South Forks; solid black line = Grid One; dashed line = Grid Two; dotted line = Grid Three.
Figure 9 Total numbers of burrows, percentage used by breeding black petrels (Procellaria
parkinsoni) and breeding success (1995/96 to 2009/10) in the census grid on Great Barrier Island (Aotea Island). Solid black line = total number of burrows; dotted black line = burrows used by breeding birds; solid grey line = breeding success.
Figure 10 The number of black petrel (Procellaria parkinsoni) chicks banded each season
(1995/96 to 2009/10) and the percentage of those chicks that have been recaptured in the study site on Great Barrier Island (Aotea Island). Grey column =
POP2009-01 Black petrel population parameters - DRAFT
31
the number of chicks banded per season and solid black line = percentage of those chicks that have been recaptured.
Figure 11 The number of breeding and non‐breeding black petrel (Procellaria parkinsoni)
‘returned chicks’ recaptured each season between 1995/96 and 2009/10 in the study site on Great Barrier Island (Aotea Island). Dotted black line = total number of recaptured ‘returned chicks’, grey column = the number of non‐breeding ‘returned chicks’ and black column = the number of breeding ‘returned chicks’.
Figure 12 Observed frequency of age of first recapture of returned black petrel (Procellaria
parkinsoni) ‘chicks’ to the 35‐ha study area on Great Barrier Island (Aotea Island). Figure 13 Adult survival estimates for black petrels (Procellaria parkinsoni) on Great Barrier
Island (Aotea Island) between 1996/97 and 2008/09. Estimates obtained by Cormack Jolly Seber model analysis (Phi (t) P (sex*t)) using Program MARK.
POP2009-01 Black petrel population parameters - DRAFT
32
Appendices Appendix 1 Results from the study of black petrel burrows (n = 393) near Mount Hobson, Great
Barrier Island (Aotea Island) during the 2009/10 breeding year. Study burrows within census grids have their location noted (in brackets) in the
burrow column: Palmers Track grid one, two, three (= P1, 2, 3); South Fork Grid one, two, three (= S1, 2, 3); or Kauri Dam Grid one, two and three (= K1, 2, 3). Occupants of burrows are represented by band number or, if not caught, by a question mark (?). Where known, sex of bird is indicated in parentheses in the Band column: male (M); female (F). An asterix represents a dead adult. Grey‐shaded box represents a non‐study burrow.
Appendix 2 Updated results from the analyses of Francis & Bell (2010) using mark/recapture
and transect data collected during the black petrel (Procellaria parkinsoni) 2009/10 breeding season on Mount Hobson, Great Barrier Island (Aotea Island).
Appendix 3 Number of recaptures, age at first recapture, age at first breeding and age at first successful breeding for black petrels (Procellaria parkinsoni) banded as chicks and recaptured in the study site on Great Barrier Island (Aotea Island) between 1995/96 and 2009/10 (n = 94), with a note about an immigrant banded as a chick on Hauturu/Little Barrier Island.
POP2009-01 Black petrel population parameters - DRAFT
1 These eggs have been crushed and only shell fragments were recovered from the burrow. Some may have been predated by rats, infertile or contained an embryo which died. 2 These eggs were present in December, but were gone when first checked in January. Many of the burrows had been cleaned out and the adults were not caught again. 3 There were five burrows not located in May 2003 and as a result it is not known if the eggs hatched successfully. To determine overall breeding success we have been cautious and assumed that they failed. 4 These chicks were present in February, but were gone in April. The chicks were too young to have fledged. Some may have been predated by rats or cats, or died due to starvation or disease and removed from the burrow by their parents. 5 All chicks still present at the end of the April or May trip. It is assumed all will fledge safely. 6 Of these, some chicks had already fledged prior to the banding visit (78 in 2002/03; 50 in 2003/04; 6 in 2004/05; 8 in 2005/06 (plus 24 unbanded due to a lack of bands), 1 in 2006/07, 8 in 2007/08, 2 in 2008/09 and 22 in 2009/10). The remaining chicks were banded. 7 This breeding success rate is biased as most of these 80 study burrows were located in late February when chicks were already present (and these chicks were likely to survive to fledging).
POP2009-01 Black petrel population parameters - DRAFT
BAND RECOVERIES FROM DEAD BIRDS ‐ 1 1 ‐ 2 1 2 2 ‐ ‐ 2 1 1 2 3
8 This includes the returned “chick” from Little Barrier Island (a female H‐30807, banded as a chick in 1996/97 breeding season) and recaptured for the first time on Great Barrier Island in the 2005/06 breeding season; this was the first recorded immigration event. This bird has been caught each year since this first capture. 9 This does not include the 21 chicks that could not be banded due to a lack of bands (there was a total of 164 chicks still present in the study burrows). 10 This includes 211 chicks from the study burrows. 11 This includes 201 chicks from the study burrows. 12 This includes 158 chicks from the study burrows.
POP2009-01 Black petrel population parameters - DRAFT
37
POP2009-01 Black petrel population parameters - DRAFT
‘RETURNED CHICKS’ THAT ATTEMPTED TO BREED THAT SEASON
0 0 0 0 1 0 6 15 8 12 11 6 9 14 25
‘RETURNED CHICKS’ THAT DID NOT BREED THAT SEASON
0 0 0 0 0 1 3 3 6 8 14 14 19 27 16
13 This does not include the 21 chicks that could not be banded due to a lack of bands (there was a total of 164 chicks still present in the study burrows). 14 This includes 211 chicks from the study burrows. 15 This includes 199 chicks from the study burrows. 16 This includes 158 chicks from the study burrows.
POP2009-01 Black petrel population parameters - DRAFT
Bell, E.A.; Sim, J.L.; P. Scofield, Black Petrels 2005/06, DOC Contract
73
APPENDIX 2
UPDATE OF SEABIRD MODELLING REPORTED IN FRANCIS AND BELL (2010) CENSUS GRID COUNTS A check of the original census grid counts revealed several slight errors. The revised data, including the 2010 counts, show trends broadly similar to those found by Francis & Bell (2010, Table 1, Figure 1). Table 1 Original (as in Table 4 in Francis & Bell 2010) and revised estimates of total numbers of burrows
in all census grids from 2000 to 2010, and the percentage that were used for breeding. Year Version 2000 2001 2002 2003 2004 2005 2006 2007 2008 2009 2010 No. burrows Original 117 122 125 132 134 147 147 148 148 155 – Revised 117 120 125 131 132 145 146 147 149 152 155 % breeding Original 69.2 62.3 64.8 58.3 58.2 55.8 63.3 64.9 57.4 61.9 – Revised 70.1 65.0 65.6 58.8 58.3 55.9 63.0 64.6 57.0 62.5 54.2 Figure 1 Counts of burrows between 1996 and 2010 in nine census grids, with three grids (G1, G2, G3) in
each of three locations: Kauri Dam, Palmers Track and South Fork (as a revision and update of Figure 3 in Francis & Bell 2010).
0
5
10
15
20
25
30
96 99 02 05 08 100
5
10
15
20
25
30
96 99 02 05 08 100
5
10
15
20
25
30
96 99 02 05 08 10
G1G2G3
No.
of b
urro
ws
Kauri Dam Palmers Track South Fork
From the census grid data, Francis & Bell (2010) inferred an average annual increase in the number of breeders of 2.2%–3.1% per year. We present updates of these estimates using the original method of calculation and two alternative methods (Table 2). In all cases the lower limit of the range of estimates is 0.7 times the upper limit to allow for the fact that between 0 and 30% of burrows not previously detected could be overlooked in any year. Francis & Bell (2010) calculated their upper limit using just the 2000 and 2009 burrow counts [(155/117)1/9 = 1.032]. The same method, applied to the updated data produced slightly lower estimates (compare lines 1 and 2, Table 2). In retrospect, it seems that it would have been more robust to base the calculation on the counts for all years (by regressing log counts on years), and not just the first and last years. This was the second method, illustrated in Figure 2A; its estimates were slightly higher than those from the original method (compare lines 2 and 3, Table 2). Both these methods use the assumption that there has been no long‐term trend in the percentage of burrows that was used for breeding in each year. However, with an additional year’s data, there is now a statistically significant downward trend in this percentage (P =
DRAFT
Bell, E.A.; Sim, J.L.; P. Scofield, Black Petrels 2005/06, DOC Contract
74
0.045, see Figure 2A). Though the significance of this trend is marginal (it is not significant if we omit either the first (P = 0.19) or last year (P = 0.15)), it suggests that we should calculate the population growth rate by fitting similar regression lines to counts of breeding burrows (as illustrated in Figure 2B). This produced lower estimates of growth (last line, Table 2). Table 2 Estimates of the annual rate of increase in the number of breeders from census grid data using
three methods of calculation over the periods 2000–2009 and 2000–2010. Annual rate of increase (% per year) Method Data 2000–2009 2000–2010 Francis & Bell (2010) Original 2.2–3.1 Same method Updated 2.1–3.0 2.0–2.9 Regression on all burrow counts Updated 2.2–3.1 2.1–3.0 Regression on breeding burrows Updated 1.4–2.0 1.0–1.5 Figure 2 Trends in the number of burrows in census grids (‘x’) with regression lines (fitted to all years
(solid lines) or to 2000–2009 (broken lines)): A, for all burrows; and B, for breeding burrows. Also plotted in panel A is the annual percentage of burrows used for breeding (‘o’). (Regression lines are exponential curves calculated by regressing log(y) on x.)
x x xx x
x x x x x x
2000 2004 20080
50
100
150
oo o
o o oo o
oo
o
0
20
40
60
80
100
Num
ber o
f bur
row
s
% o
f bur
row
s us
ed fo
r bre
edin
g
A
xo
Number of burrows% used for breeding
x x xx x
x
x x
x
x
x
2000 2004 20080
20
40
60
80
Num
ber o
f bre
edin
g bu
rrow
s
B
DRAFT
Bell, E.A.; Sim, J.L.; P. Scofield, Black Petrels 2005/06, DOC Contract
75
TRANSECT COUNTS The transect survey of 2005 (Francis & Bell 2010) was repeated in 2010 with the same design, and same number of transects, except that 16 of the transects surveyed were new, and 10 were repeats of 2005 transects (these were 2005 transects 6, 8, 10, 11, 17, 18, 19, 25, 38, and 41, which were chosen at random). The 2010 estimate of population size was 22% less than that in 2005, which is a marginally significant change (Z = (1964‐1525)/(2042 +1702)0.5 = 1.65, P = 0.098, two‐sided test), and 5% less than the 1988 estimate of 1598 (which was based on the data of Scofield 1989, Table 3, Figure 3A). The drop since 2005 was largest in the stratum for medium grade petrel habitat, which contained more than half the estimated population in 2005, but was also seen in the high grade stratum (Figure 3B, Figure 3C). Table 3 Estimated densities of breeding burrows and numbers of breeding birds, by stratum (with s.e.s
in parentheses) from transect counts in 2005 and 2010. Area Burrow density (no./ha) Population number (breeders) Stratum (ha) 2005 2010 2005 2010 Non‐petrel habitat 1.75 0 0 0 0 Poor grade 13.6 4.9 (2.2) 12.0 (4.6) 134 (61) 327 (124) Medium grade 15.3 37.6 (5.4) 21.2 (3.0) 1150 (166) 649 (93) High grade 4.67 72.8(11.0) 58.8 (7.6) 680 (103) 550 (71) All 35.3 29.3 (3.0) 22.7 (2.5) 1964 (204) 1525 (170) Figure 3 Comparison of all transect‐based estimates of population size (numbers of breeders) for the
whole study area, and for each habitat stratum. Vertical lines are 95% confidence intervals estimated from s.e.s (solid lines) or bootstrap resampling (broken lines).
x
x
1990 1995 2000 2005 20100
500
1000
1500
2000
x
All
x
x
1990 1995 2000 2005 20100
200
400
600
800
High grade habitat
x
x
1990 1995 2000 2005 20100
200
400
600
800
1000
1200
1400
Medium grade habitat
x
x
1990 1995 2000 2005 20100
100
200
300
400
500
Poor grade habitat
Num
ber o
f bre
eder
s
There are two striking, but unexplained, patterns in the incidence of empty burrows. The first, in the 10 transects that were repeated, there was a huge increase in the numbers of empty burrows seen (Table 4). Also, densities of empty burrows from the two transect surveys are markedly different from those from the census grids (Figure 4). Note that the census grids are mostly in the high grade habitat stratum, with some overlap with the medium grade stratum (see Figure 4 in Francis & Bell 2010).
DRAFT
Bell, E.A.; Sim, J.L.; P. Scofield, Black Petrels 2005/06, DOC Contract
76
Table 4 Comparison of burrow counts in 2005 and 2010 for the 10 transects that were repeated. Counts
are broken down by burrow type (empty, non‐breeder, and breeder) and habitat type (poor, medium, and high grade).
Empty burrows Non‐breeder burrows Breeder burrows Year Poor Med. High All Poor Med. High All Poor Med. High All 2005 0 1 3 4 0 19 19 38 2 24 32 58 2010 0 17 14 31 1 21 24 46 0 15 27 42 Figure 4 Comparison of estimated burrow densities, by type (empty, non‐breeder, and breeder), from
the three groups of census grids (lines) and from the three habitat strata (‘L’ = low grade; ‘M’ = medium grade; ‘H’ = high grade) in the 2005 and 2010 transect surveys. Vertical lines through transect‐survey estimates are 95% confidence intervals.
2000 2004 20080
20
40
60
80
Empty
L
L
M
M
H
H
KDPTSF
2000 2004 20080
20
40
60
80
Non-breeder
LL
M M
HH
2000 2004 20080
20
40
60
80
Breeder
LL
M
M
H
H
Bur
row
den
sity
(no.
/ha)
DRAFT
Bell, E.A.; Sim, J.L.; P. Scofield, Black Petrels 2005/06, DOC Contract
77
POPULATION MODELLING The final population model of Francis & Bell (2010), BPET7, was updated to include the additional year’s mark‐recapture data and the 2010 population estimate from transect counts. The two population estimates were assumed to be normally distributed with c.v.s (calculated from the s.e.s of Table 3) of 0.10 and 0.11, respectively. The additional data made little difference to estimated probabilities of survival and resighting (Figure 5), age at first breeding (Figure 6, the estimated mean age at first breeding dropped from 6.7 y to 6.6 y), or adult transition parameters (Table 5). Table 5 Comparison of original and updated estimates of transition parameters for pre‐breeders and
adults (pbr = pre‐breeder; nbr, non‐breeder; sbr = successful breeder; fbr = failed breeder; oth = breeding outside study area). Values written as ‘–’ are zero by definition.
Figure 6 Comparison of original and updated estimates of the distribution of ages at first breeding.
DRAFT
Bell, E.A.; Sim, J.L.; P. Scofield, Black Petrels 2005/06, DOC Contract
78
4 6 8 100.00
0.05
0.10
0.15
0.20
0.25
P(1
st b
reed
at a
ge a
)
Age, a (y)
OriginalUpdated
The greatest uncertainty in the model estimates relates to the parameter juvsurv (the annual survival probability for juveniles). The mark‐recapture data contain very little information about this parameter, whose value is driven mostly by the two population estimates. This uncertainty was explored by means of a likelihood profile on juvsurv, which showed that the 95% confidence interval for this parameter is rather wide (0.67–0.91) (Figure 7A). This leads to a wide confidence interval for the mean rate of population growth over the modelling period: from –2.5% per year to +1.6% per year (Figure 7B; Table 6). This uncertainty does not affect estimates of the other important demographic parameters (adult survival and transition parameters, and age at first breeding) whose values are virtually unchanged across this profile. Table 6 Relationship between the annual probability of juvenile survival and the estimated rate of
population increase (as calculated from the trajectories in Figure 7B using a regression approach like that for Table 2).
Juvenile survival (proportion/yr) 0.67 0.7 0.75 0.77 0.8 0.85 0.9 0.91 Rate of population increase (%/yr) –2.5 –2.6 –2.1 –1.8 –1.4 –0.5 1.1 1.6 There are two pieces of information that are relevant to population growth rates, but which could not be provided to the population model: the 1988 population estimate of 1598 breeders (s.e. 304, see Table 2 in Francis & Bell 2010); and the estimates of population growth rate from the census grid data (Table 2). It is difficult to know how much weight to give to this additional information. There is clearly doubt as to the comparability of the 1988 population estimate with the more recent estimates (see Discussion in Francis & Bell 2010), and trends in the census grids may not be representative of those in the whole population. However, it seems most likely that the mean rate of change of this population over the study period has not exceeded 2% per year, though the direction of change is uncertain. Figure 7 Results of a likelihood profile on juvsurv (annual probability of juvenile survival), showing (as
functions of juvsurv) A, the loss of fit (the horizontal dotted line indicates a 95% confidence interval for juvsurv); and B, population trajectories [also shown in this panel are the three population estimates from transect counts (‘x’), and their 95% confidence intervals (vertical lines); note that the 1988 population estimate was not used in the model].
DRAFT
Bell, E.A.; Sim, J.L.; P. Scofield, Black Petrels 2005/06, DOC Contract
79
0.70 0.75 0.80 0.85 0.90
0.0
0.5
1.0
1.5
2.0
Loss
of f
it
A
1990 1995 2000 2005 20100
500
1000
1500
2000
2500
x
x
x
Num
ber o
f bre
eder
s
B
0.670.770.80.850.91
Juvenile survival (juvsurv) Year
THE EFFECT OF PREDATION: The estimated probability of breeding success was 0.78 (this is model parameter Psuccess, which is defined as the number of live fledglings in any year divided by the number of pairs that produced an egg). Nine causes of breeding failure were identified, two of which were associated with predation (by rats or cats). From the relative probabilities of these causes (Table 7) we can calculate that the removal of predators might be expected to increase the probability of breeding success to 0.81 [= 0.78 + (0.11+0.02)(1–0.78)]. This figure may be conservative, because it is possible that predation was involved in some cases where either the egg or chick disappeared. If all such cases involved predation then the removal of predators would increase Psuccess to 0.84. Table 7 Causes of breeding failure, and their relative probabilities (averaged over all years). The causes
fall in two groups, depended on whether they prevented the egg from hatching or the chick from fledging.
Egg didn’t hatch Chick didn’t fledge Cause Probability Cause Probability Dead embryo 0.22 Chick died 0.15 Egg crushed 0.17 Cat predation 0.02 Egg disappeared 0.15 Chick disappeared 0.01 Rat predation 0.11 0.18 Egg infertile 0.10 Egg abandoned 0.06 0.82 The potential effect of eliminating predation depends strongly on the level of juvenile survival (juvsurv). This was shown by rerunning the population model at three points on the above likelihood profile with Psuccess increased first to 0.81, and then to 0.84. When juvsurv was 0.67 (the lower bound of its 95% confidence interval), the increase in Psuccess made virtually no difference (Figure 8A), whereas for juvsurv = 0.91 (the upper bound) there was a clear change in population trend (Figure 8C), with the mean annual growth rate increasing from 1.6% to 2.1% and 2.5% per year as Psuccess increased. For juvsurv = 0.85, at which the trajectory was close to flat, the effect was slightly less (Figure 8B) (the corresponding growth rates were –0.5%, –0.1%, and 0.2%).
DRAFT
Bell, E.A.; Sim, J.L.; P. Scofield, Black Petrels 2005/06, DOC Contract
80
Figure 8 Effect on population trajectories of increasing the probability of breeding success (Psuccess) by removing predators. Each panel shows trajectories associated with one point on the likelihood profile of Figure 7; the solid line is the trajectory from the profile (plotted in Fig. 7B), for which Psuccess = 0.78; the other two lines show how the trajectory changed when Psuccess was increased to 0.81 and 0.84.
1996 2000 2004 20080
500
1000
1500
2000
2500 juvsurv = 0.67 A
Psuccess = 0.84Psuccess = 0.81Psuccess = 0.78
1996 2000 2004 20080
500
1000
1500
2000
2500 juvsurv = 0.85 B
1996 2000 2004 20080
500
1000
1500
2000
2500 juvsurv = 0.91 C
Num
ber o
f bre
eder
s
REFERENCES Francis, R.I.C.C.; Bell, E.A. 2010. Fisheries rick to the population viability og black petrel (Procellaria
parkinsoni). New Zealand Aquatic Environment and Biodiveristy Report No. 51. 57p. Scofield, R.P. 1989. Breeding biology and conservation of the black petrel (Procellaria parkinsoni) on Great
Barrier Island. Unpublished MSc (Zoology) thesis, University of Auckland, Auckland, New Zealand. 69 p.
DRAFT
Bell, E.A.; Sim, J.L.; P. Scofield, Black Petrels 2005/06, DOC Contract
18 The bird was caught at sea in Ecuador and released alive. It has not been recaptured at the colony to date. 19 Immigrant originally banded on Hauturu/Little Barrier Island, but now breeding successfully on Great Barrier Island (Aotea Island).