The Japanese Journal of Population, Vol.6, No.1 (March 2008) 76 Population Projections for Japan: 2006-2055 Outline of Results, Methods, and Assumptions Ryuichi Kaneko, Akira Ishikawa, Futoshi Ishii, Tsukasa Sasai, Miho Iwasawa, Fusami Mita, and Rie Moriizumi Introduction The National Institute of Population and Social Security Research in Japan announced a new pop- ulation projection for Japan in December 2006, based on the results of 2005 Census. This is the summary report on major results of the projections with outline of methods and assumptions. Population Projections for Japan project size and structure of the population into future, based on assumptions on future fertility, mortality, and international migration levels. Given that future changes in fertility and mortality are inherently uncertain, this document provides a range of popula- tion projections based on alternative assumptions. The projection covers the total population living in Japan, including non-Japanese residents. This is the same framework used by the Population Census of Japan. The period of projection begins with the 2005 Population Census and continues until 2055, projecting the population as of October 1 for each year. It also includes longer-term results up to 2105. The method of projection is as follows: assumptions are made by age for population pro- cess components such as birth, death, and inter- national migration, and population by sex and age in the future is projected through the cohort- component method. Assumptions are made based on actual statistics for each component through the demographic-projective method. (For further details, refer to section “III. Summary of the Method Used for Projecting Population”.) I Summary of the Results; Projected Population The Population Projection for Japan is based on three alternate assumptions about future fertility: low variant, medium variant and high variant. In this latest projection, the same high-, medium- , and low-variant assumptions are also set for changes in mortality. Hereafter, the outline of the results of the three projections, which combine the three assumptions on fertility and medium-variant assumptions for mortality, will be presented first, followed by an outline of the results of the three assumptions of fertility combined with low- and high-variant mortality assumptions. In the fol- lowing descriptions, each projection is referred to by the combination of its respective fertility and mortality assumptions (e.g. medium-fertility (medium-mortality) projection). The Results of Projections Using the Three Fertility Variant Assumptions with Medium-Variant Mortality 1. Total Population Trends According to the 2005 Population Census, the base year of this projection, the total population of Japan was 127.77 million. Based on the results of the medium-variant projection, the population is expected to enter a long period of depopulation. The population is expected to decrease to about 115.22 million in 2030, fall below 100 million to 99.38 million in 2046, and drop to 89.93 million by 2055 (see Table 1-1, Figure 1-1). Based on the results of the high-fertility-vari- ant projection, the total population is expected to fall below 100 million by 2046 to 99.44 million, and will decrease to 97.77 million in 2055 (see Table 1-2, Figure 1-1). On the other hand, based on the results of the low-fertility-variant projection, the total popula- tion is expected to fall below 100 million by 2042, and decline to 84.11 million by 2055. (see Table 1-3, Figure 1-1). 2. Population Trends and the Proportion of the Population in Three Major Age Groups (1) Trends in the Number of Children under 15 and Its Share of the Population The annual number of births in Japan has declined from 2.09 million in 1973 to 1.06 million in 2005. Consequently, the population of children under the age of 15 has decreased from 27 million in the early 1980s to 17.52 million in the population census of 2005 (excluding the age-unknown, same below for census populations). According to the medium-variant projection, the population size of this age group will fall to 16 million in 2009 (see Table 1-1 and Figure 1-3).
Transcript
The Japanese Journal of Population, Vol.6, No.1 (March 2008)
76 77
Population Projections for Japan: 2006-2055 Outline of Results, Methods, and Assumptions
The National Institute of Population and Social Security Research in Japan announced a new pop-ulation projection for Japan in December 2006, based on the results of 2005 Census. This is the summary report on major results of the projections with outline of methods and assumptions.
Population Projections for Japan project size and structure of the population into future, based on assumptions on future fertility, mortality, and international migration levels. Given that future changes in fertility and mortality are inherently uncertain, this document provides a range of popula-tion projections based on alternative assumptions.
The projection covers the total population living in Japan, including non-Japanese residents. This is the same framework used by the Population Census of Japan. The period of projection begins with the 2005 Population Census and continues until 2055, projecting the population as of October 1 for each year. It also includes longer-term results up to 2105.
The method of projection is as follows: assumptions are made by age for population pro-cess components such as birth, death, and inter-national migration, and population by sex and age in the future is projected through the cohort-component method. Assumptions are made based on actual statistics for each component through the demographic-projective method. (For further details, refer to section “III. Summary of the Method Used for Projecting Population”.)
I Summary of the Results; Projected Population
The Population Projection for Japan is based on three alternate assumptions about future fertility: low variant, medium variant and high variant. In this latest projection, the same high-, medium-, and low-variant assumptions are also set for changes in mortality. Hereafter, the outline of the results of the three projections, which combine the three assumptions on fertility and medium-variant assumptions for mortality, will be presented first,
followed by an outline of the results of the three assumptions of fertility combined with low- and high-variant mortality assumptions. In the fol-lowing descriptions, each projection is referred to by the combination of its respective fertility and mortality assumptions (e.g. medium-fertility (medium-mortality) projection).
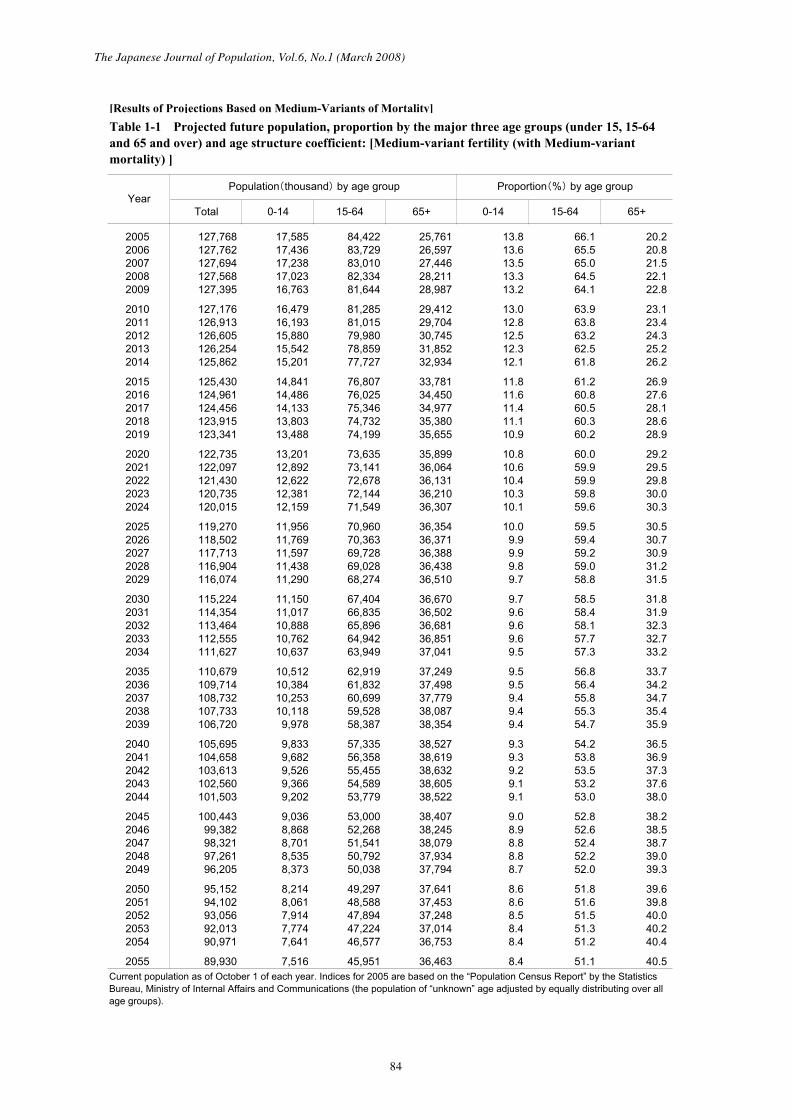
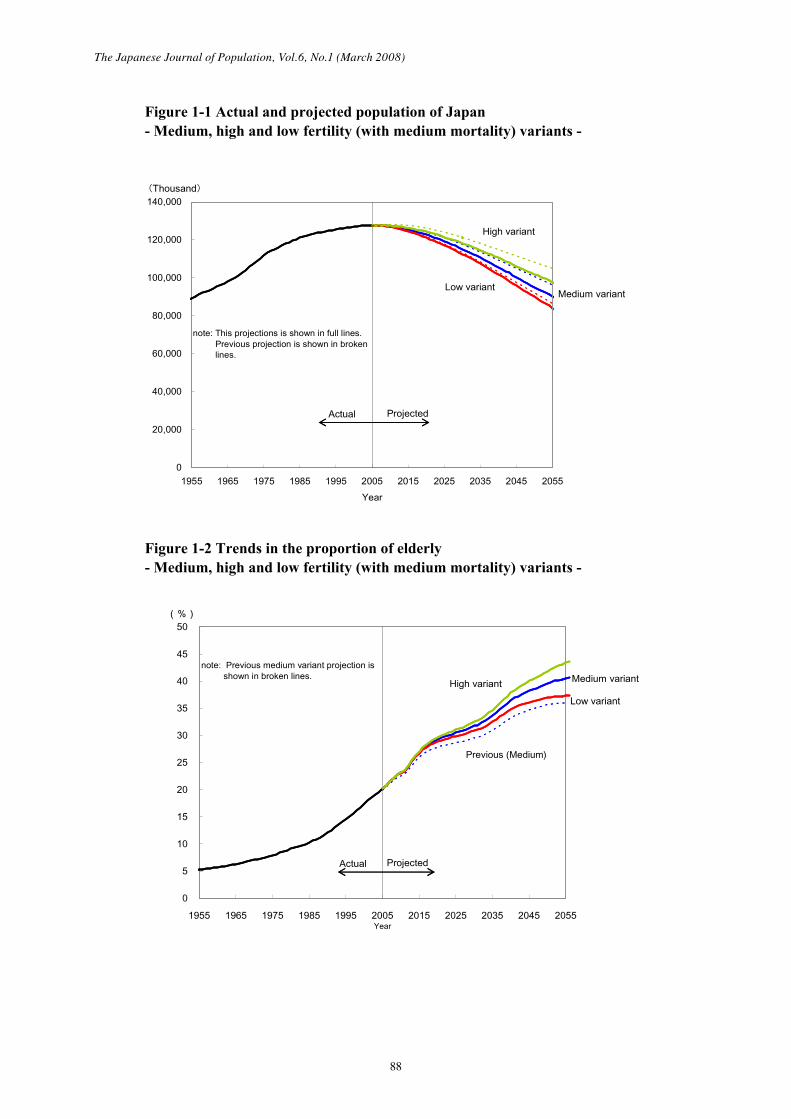
The Results of Projections Using the Three Fertility Variant Assumptions with Medium-Variant Mortality1.TotalPopulationTrendsAccording to the 2005 Population Census, the base year of this projection, the total population of Japan was 127.77 million. Based on the results of the medium-variant projection, the population is expected to enter a long period of depopulation. The population is expected to decrease to about 115.22 million in 2030, fall below 100 million to 99.38 million in 2046, and drop to 89.93 million by 2055 (see Table 1-1, Figure 1-1).
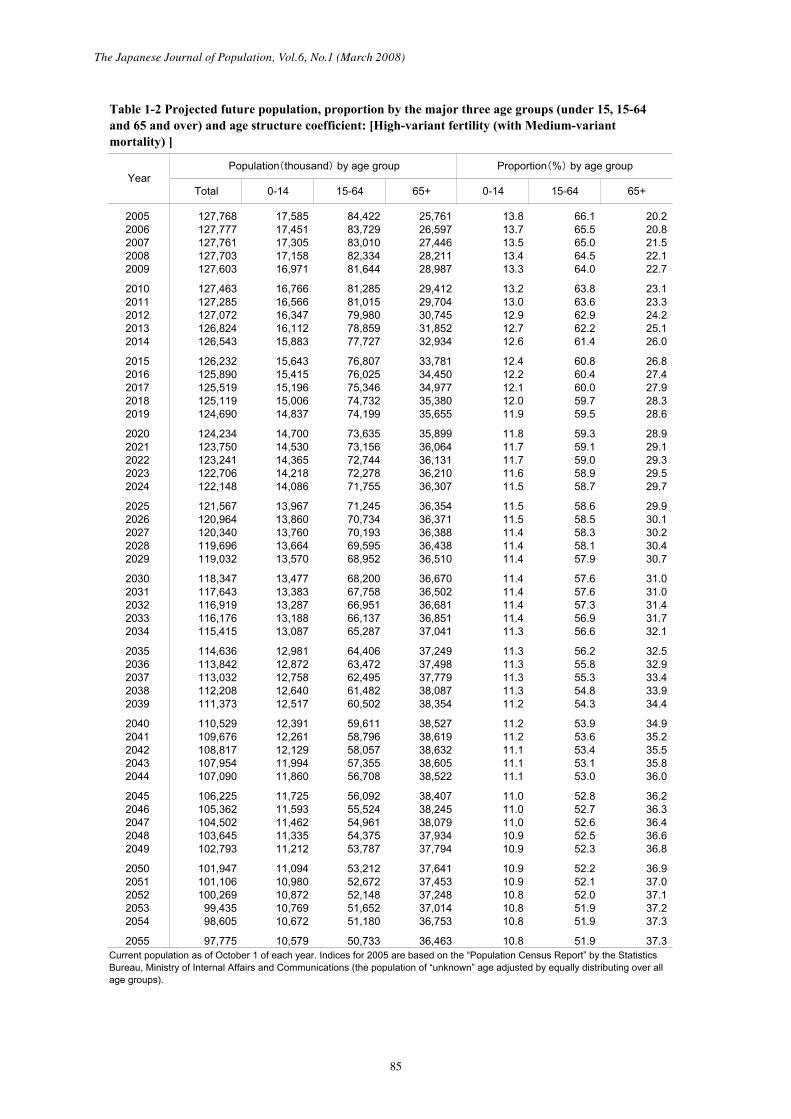
Based on the results of the high-fertility-vari-ant projection, the total population is expected to fall below 100 million by 2046 to 99.44 million, and will decrease to 97.77 million in 2055 (see Table 1-2, Figure 1-1).
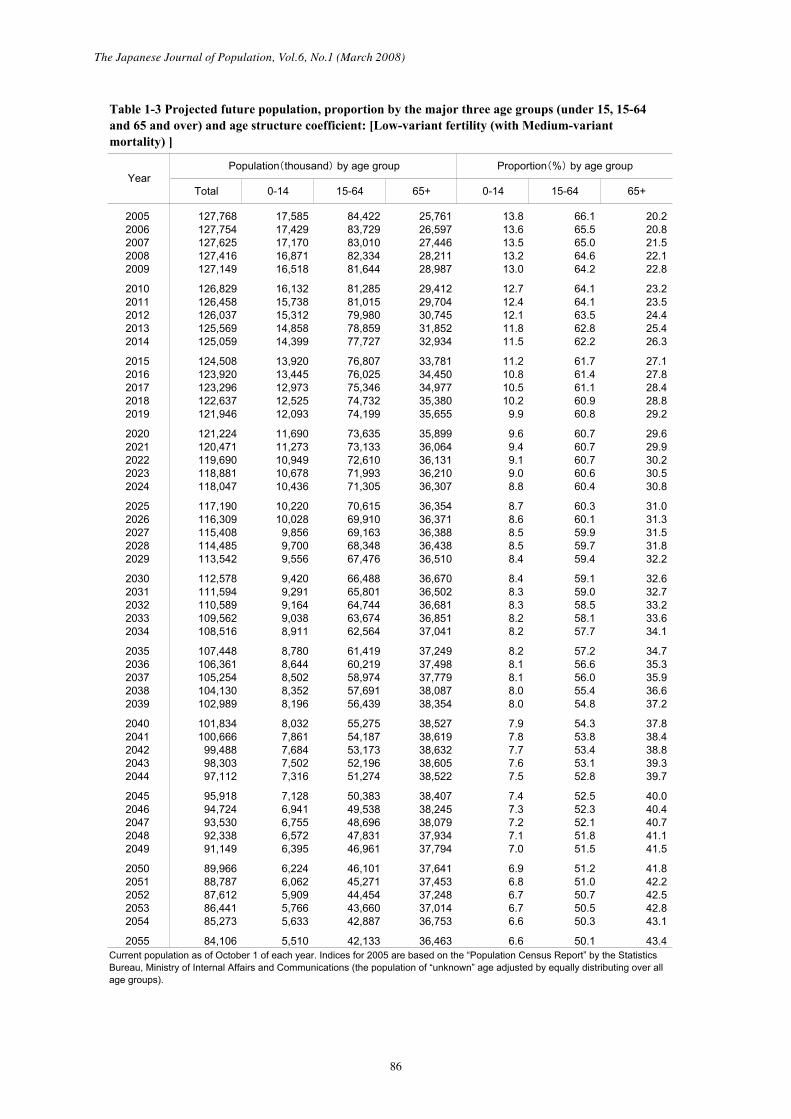
On the other hand, based on the results of the low-fertility-variant projection, the total popula-tion is expected to fall below 100 million by 2042, and decline to 84.11 million by 2055. (see Table 1-3, Figure 1-1).
2.PopulationTrendsandtheProportionofthePopulationinThreeMajorAgeGroups(1) Trends in the Number of Children under
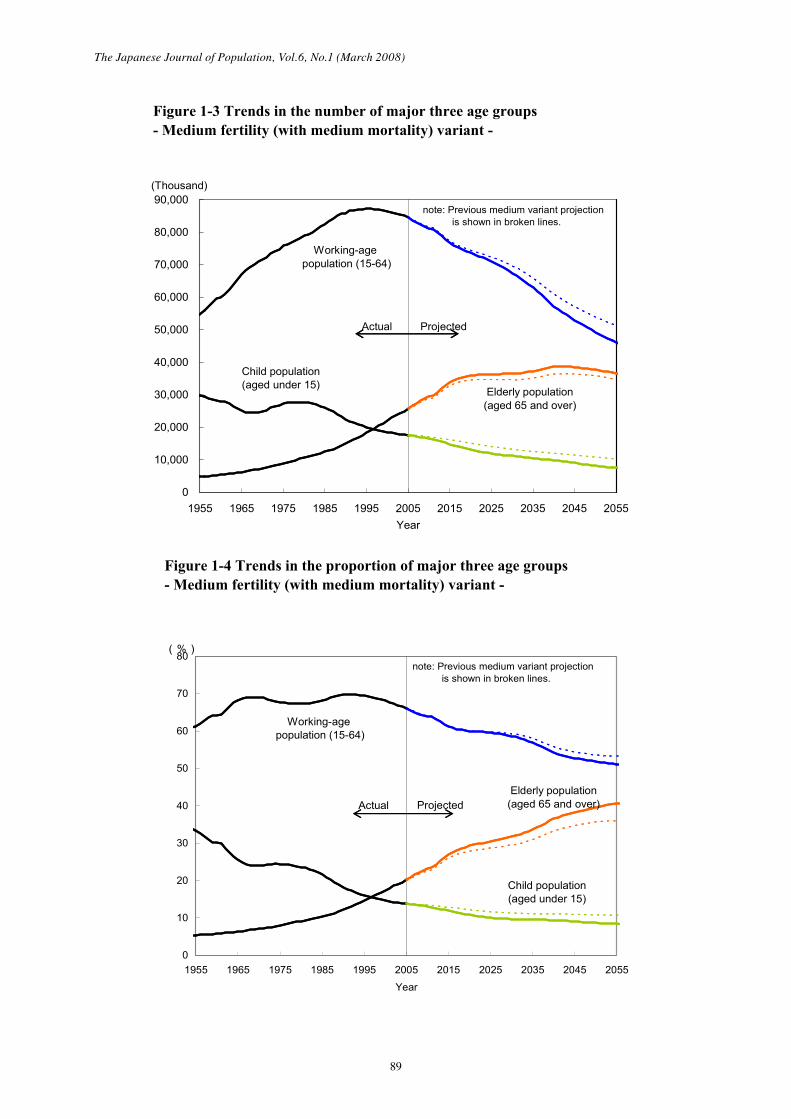
15 and Its Share of the PopulationThe annual number of births in Japan has declined from 2.09 million in 1973 to 1.06 million in 2005. Consequently, the population of children under the age of 15 has decreased from 27 million in the early 1980s to 17.52 million in the population census of 2005 (excluding the age-unknown, same below for census populations).
According to the medium-variant projection, the population size of this age group will fall to 16 million in 2009 (see Table 1-1 and Figure 1-3).
76
The Japanese Journal of Population, Vol.6, No.1 (March 2008)
77
The decline will continue, and the population of this age group is expected to fall below 10 million in 2039, eventually decreasing to around 7.52 mil-lion by 2055.
According to the trends in the number of children based on the difference of the high- and low-variant future fertility assumptions, this age group is expected to be on the decline even in the high-variant projection (due to longstanding low fertility) and will reach 10.58 million in 2055 (see Table 1-2). The low-variant assumptions lead to a projection of a more rapid decline in the size of this age group. It is projected that this demo-graphic group will shrink from its current size of 17.59 million to below 10 million in 2027, and eventually decrease to 5.51 million by 2055 (see Table 1-3).
Likewise, the share represented by this demo-graphic group, according to the medium-variant projection, is expected to shrink from 13.8% as of 2005 to 10.0% in 2025, to 9.0% in 2045, and eventually down to 8.4% in 2055 (see Table 1-1 and Figure 1-4).
The high-variant projection shows a slower decline in the number of children, falling below the 13% range in 2012 and reaching 10.8% by 2055 (see Table 1-2).
The decline in the children’s share of the population is rapid in the low-variant projection, breaking the 13% mark in 2010, falling below 10% in 2019, and ultimately dropping to 6.6% by 2055 (see Table 1-3).
(2) Trends in the Working-Age Population (aged from 15 to 64 years) and Its Share of the Population
The population of the working-age group (from 15 to 64 years of age) consistently increased during the post-war years, reaching its peak in the 1995 Population Census at 87.17 million. However, it subsequently entered a period of decline and the population has fallen to 84.09 million, according to the 2005 Population Census.
According to the results of the medium-vari-ant projection, the population of this age group is expected to fall below 80 million in 2012 and eventually drop to 45.95 million by 2055 (see Table 1-1 and Figure 1-3).
Up until 2020, the projections of working-age population trends based on the high- and low-variant assumptions are equivalent to those based on medium-variant assumptions. After 2020, the depopulation of this age group is expected to be rather slow according to the high-variant projec-tion, and the population is expected to decline to 50.73 million by 2055 (see Table 1-2). According
to the low-variant projection, the working-age population is expected to decrease more rapidly, falling below 70 million in 2026, below 50 million in 2046, and eventually to 42.13 million by 2055 (see Table 1-3).
According to the medium-variant projection, the proportion of the population in the working-age group will continue to fall from its 2005 share of 66.1%. It is expected to decline to 60.0% in 2020, reaching 56.4% (approximately ten percent-age points lower than the current level) in 2036, and will eventually decline to 51.1% by 2055 (see Table 1-1 and Figure 1-4).
Using the high-variant projection, the popula-tion share of the working-age group also shows a constant decline from the start of the projection period. The proportion of the population in this age group is expected to be 51.9% in 2055, 0.8 percentage points higher than the projected pro-portion using medium-variant assumptions.
In the low-variant projection, the propor-tion of the population in this age group shows a slow period of decline, due primarily to the sharp decline in the number of children. Therefore, the timing of the percentage falling to 60.0% will be later in 2026 than in the projection based on medium-variant assumptions. However, the sub-sequent decline accelerates, and the population share will reach 50.1% in 2055, one percentage point lower than the projection based on medium-variant assumptions.
(3) Trends in the Elderly Population (65 years of age and over) and Its Share of the Population
The trend of elderly population will be identical for the three-variant fertility projections throughout the projection period of 50 years if the assumption on mortality is the same. That is, this age group will grow from 25.76 million as of 2005 to over 30 million in 2012 when the baby-boom generation (born between 1947 and 1949) enters this group, and to 35.9 million by 2020 (see Table 1-1, Table 1-2, Table 1-3, and Figure 1-3). It will thereafter follow a modest period of increase for some time, reaching 36.67 million in 2043, and will peak in 2043, reaching the 38.63 million mark in 2042 when the second baby-boom generation enters this age group. A steady decrease will follow, and the group will ultimately reach 36.46 million by 2055.
The proportion of the elderly is expected to grow from 20.2% as of 2005 to 25.2% in 2013, already accounting for more than one-quarter of the population of Japan at this stage. According to the medium-variant projection, it will then reach
The Japanese Journal of Population, Vol.6, No.1 (March 2008)
78 79
33.7%, or more than one-third of the popula-tion, in 2035. It will reach 40.5% by 2055, which means that 1 out of 2.5 persons will be in the aged category in Japan 50 years from now (see Table 1-1, Figure 1-2).
The variant in the aging trend due to the dif-ference in the assumptions of fertility rate, derived from a comparison of the results of the high- and low-variant projections, shows a difference of 1.6 points in 2030, between 32.6% based on low-vari-ant projection of birth and 31.0% based on high-variant projection. This difference grows wider thereafter, and for 2055, the low-variant figure is 43.4% whereas the high variant figure is 37.3%, a difference of 6.1 points (see Figure 1-2).
As the above report shows, the growth rate of the aging population itself will decrease from around 2020, and the population will peak at 2042 and will decrease thereafter. Nevertheless, the proportion of the aged generation will continue to rise for 50 years from now, according to all three assumptions on fertility. This is because the per-centage of this age group will continue to increase against the declining trend other age groups, namely children and working-age population.
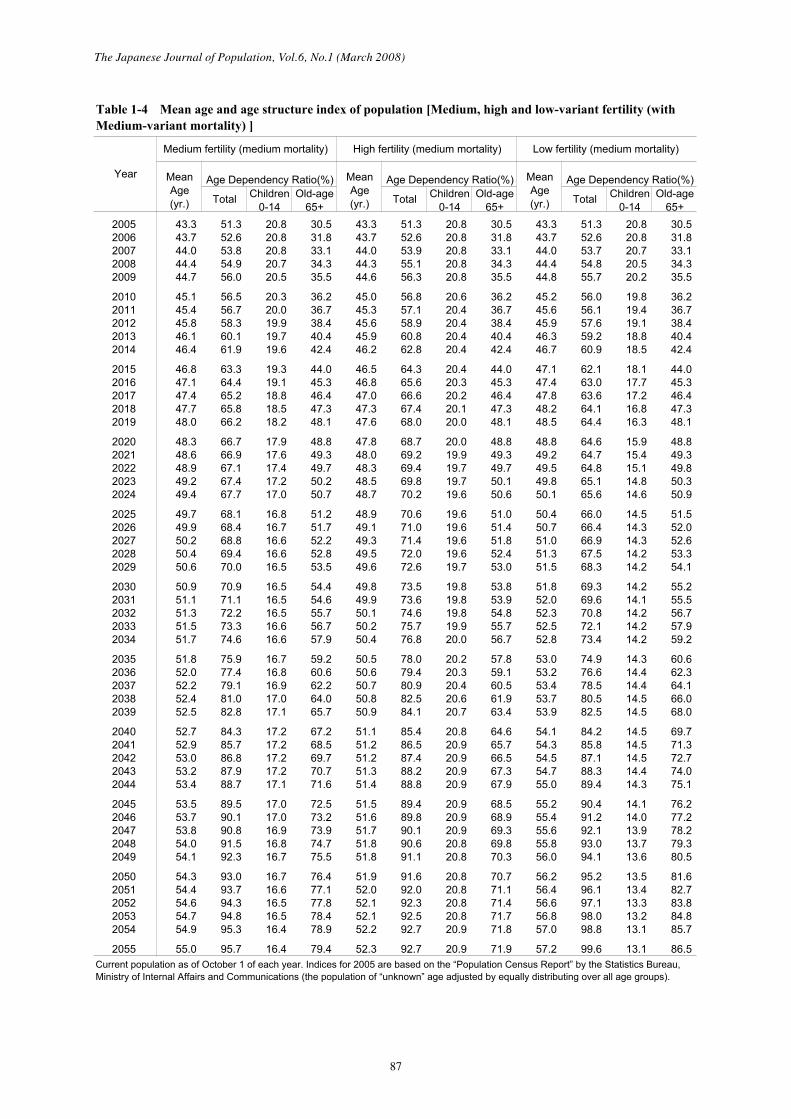
3.TrendofthePopulationDependencyRatioThe population dependency ratio is used as an index to indicate the level of support of the work-ing-age group, through comparison of the relative size of the child population and aged population groups to that of the working-age group. The old-age dependency ratio (calculated by divid-ing the aged population by the population of the working-age group) based on the medium-variant projection of birth increases from 31% (that is, 3.3 workers supporting one senior resident) as of 2005 to the 50% range (that is, two workers supporting one senior resident) in 2020. The ratio will con-tinue to rise, and eventually reach 79% (that is, 1.3 workers supporting one senior resident) by 2055 (see Table 1-4).
In contrast, the child dependency ratio (cal-culated by dividing the child population by the population of the working-age group), which is 21% (that is, 4.7 workers supporting one child) as of 2005, is expected to maintain a level of 16 to 20% in the future. Despite the decrease in the child population due to low fertility, the child dependency ratio is not expected to decrease con-siderably below a certain level, because the work-ing-age group, the generation of their parents, will simultaneously shrink in size.
The child dependency ratio and the old-age dependency ratio added together is referred to as the overall dependency ratio, and this ratio is used to show the degree of support for the entire work-ing-age population. According to the medium-variant projection of birth, the overall dependency ratio is expected to increase to 70.9% in 2030 from 51.3% in 2005, and will eventually reach 95.7% by 2055.
The overall dependency ratio based on the high-variant projection of birth will initially follow a trend that is higher than that of the medium-vari-ant projection, because the child population will be larger. However, this ratio will become lower than that of the medium-variant projection in 2045 and beyond, and is expected to reach 92.7% by 2055. In contrast, the overall dependency ratio based on the low-variant projection of birth will initially maintain a level lower than projections based on the medium-variant projection. This, however, will reverse in 2041, and will reach 99.6% by 2055.
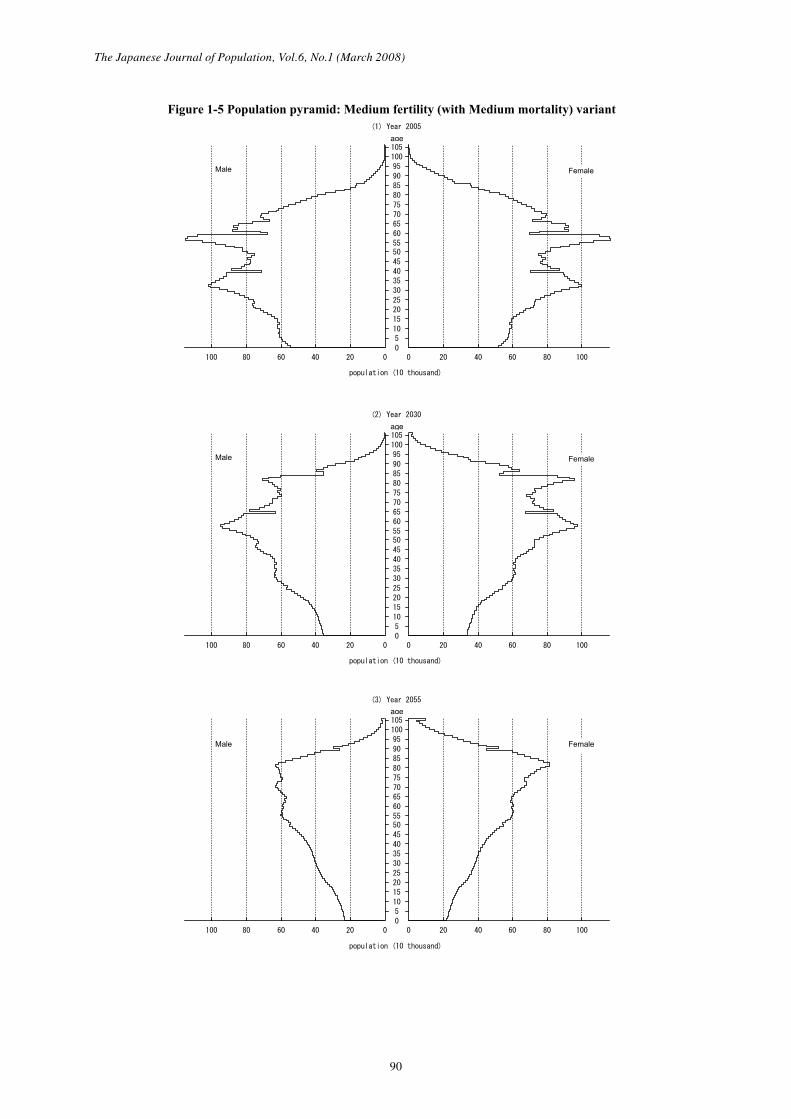
4.ChangesinthePopulationPyramidThe population pyramid in Japan has significant irregularities due to acute fluctuation in past fertil-ity rates. For example, there was a decrease in the number of live births from 1945 to 1946 in line with the termination of war, an increase in the first baby boom from 1947 to 1949, a subsequent decrease from 1950 to 1957 and in 1966, which was known as the Hinoe-Uma (fire horse) year in the traditional Japanese calendar, a subsequent increase during the second baby boom from 1971 to 1974, and a steady decrease thereafter (see Fig-ure 1-5).
In the population pyramid as of 2005, the members of first baby-boomer generation are at the end of their 50s and those of the second baby-boomer generation at the beginning of their 30s. By looking at the evolution of this pyramid according to the projection, the first baby-boom-ers will be at the beginning of their 80s and the second baby-boomers at the end of their 50s by 2030. It can therefore be concluded that the aging of society toward 2030 is centered on the aging of the first baby-boomer generation (see Figure 1-5(2)).
The progression of aging society thereafter will reflect the fact that after the second baby-boomer generation enters the elderly population; the population size of all age brackets will decrease among younger generation, due to the low fertility rate (see Figure 1-5 (3)).
78
The Japanese Journal of Population, Vol.6, No.1 (March 2008)
79
The Results of Projections of the Three Fertility Variant Assumptions with High- and Low-Variant Mortality1.SummaryoftheResultsofProjectionwith
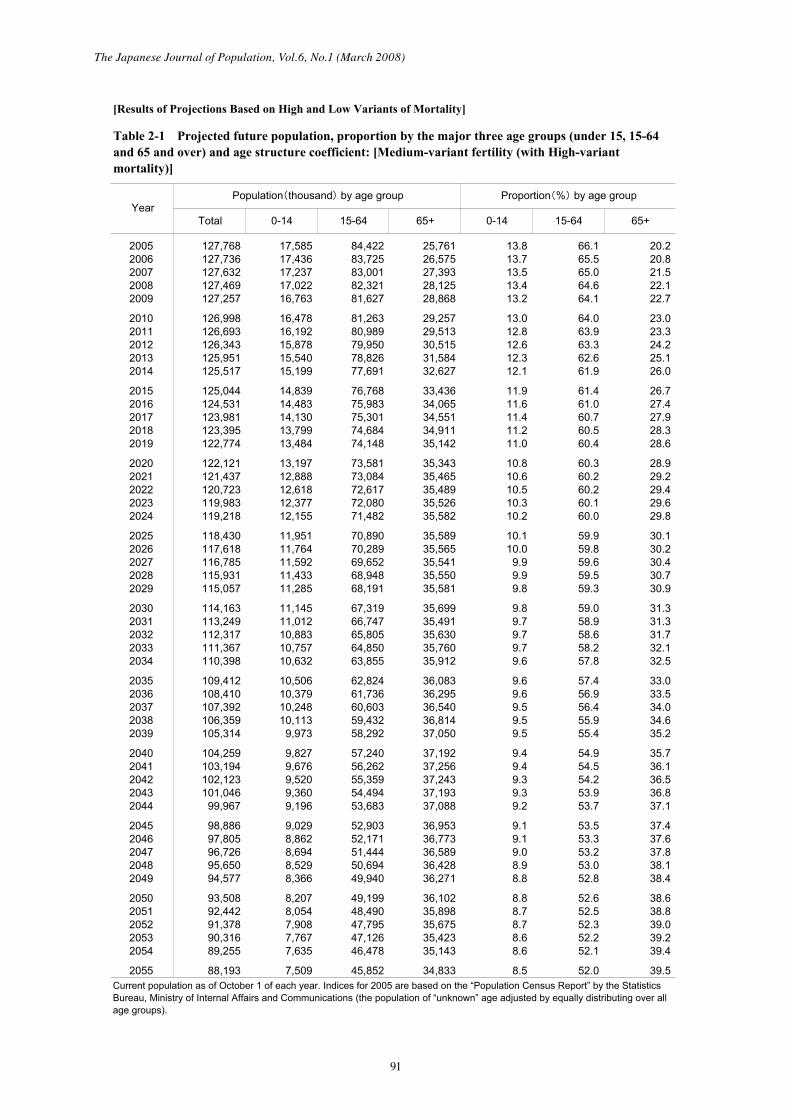
High-VariantMortalityThe high-variant mortality projection is a projec-tion that assumes higher mortality rates compared to the medium-variant mortality projection, which means slower advance in mortality improvement, and life expectancy remaining at a relatively low level. Therefore, number of deaths will be relatively large, and the population will maintain a lower level under the same assumptions on fer-tility. Compared to the total population estimate of 89.93 million in 2055 based on the medium-fertility (medium-mortality) projection, the total population in the same year based on the medium-fertility (high-mortality) projection will be lower at 88.19 million. In contrast, the trend of the population and the proportion of the three major age groups based on the medium-fertility (high-mortality) projection are as follows: the child population (and the proportion thereof) will be 7.51 million (8.5%), the working-age population (proportion) will be 45.85 million (52.0%), and elderly population (and the proportion thereof) will be 34.83 million (39.5%) in 2055. Compared to the results of the medium-fertility (medium-mortality) projection, the size of the elderly popu-lation is smaller and the proportion of the elderly population is also lower (see Table 2-1).
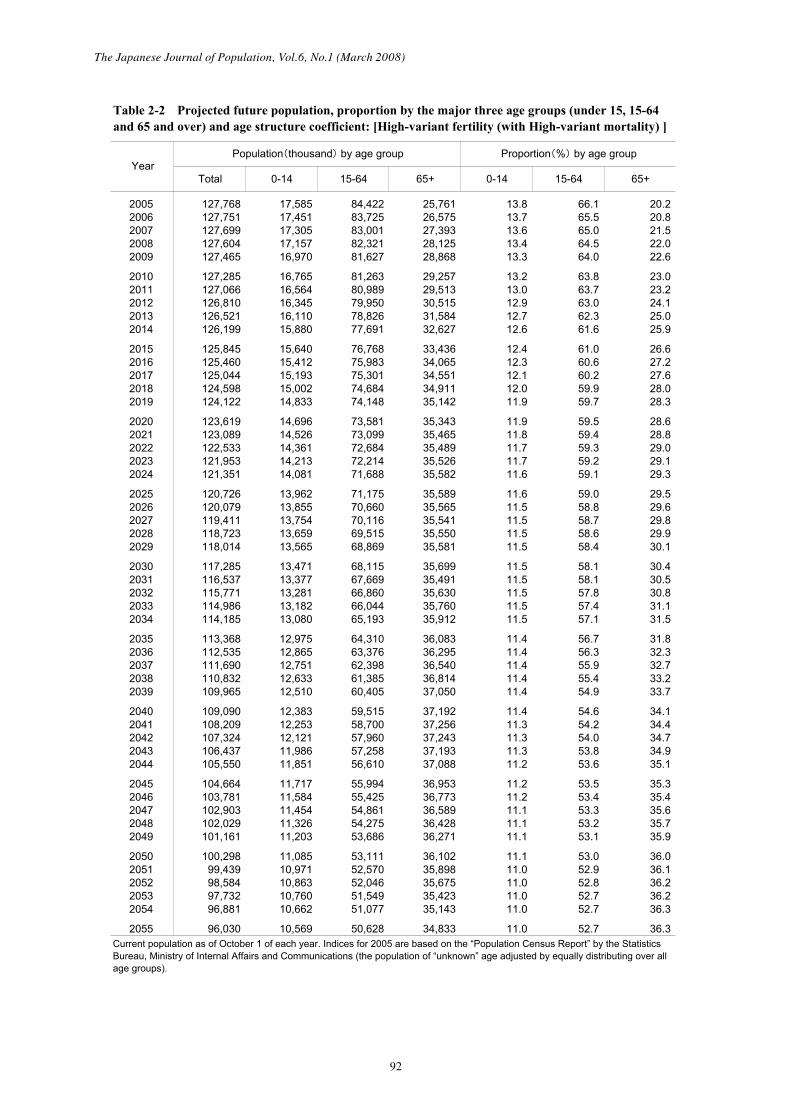
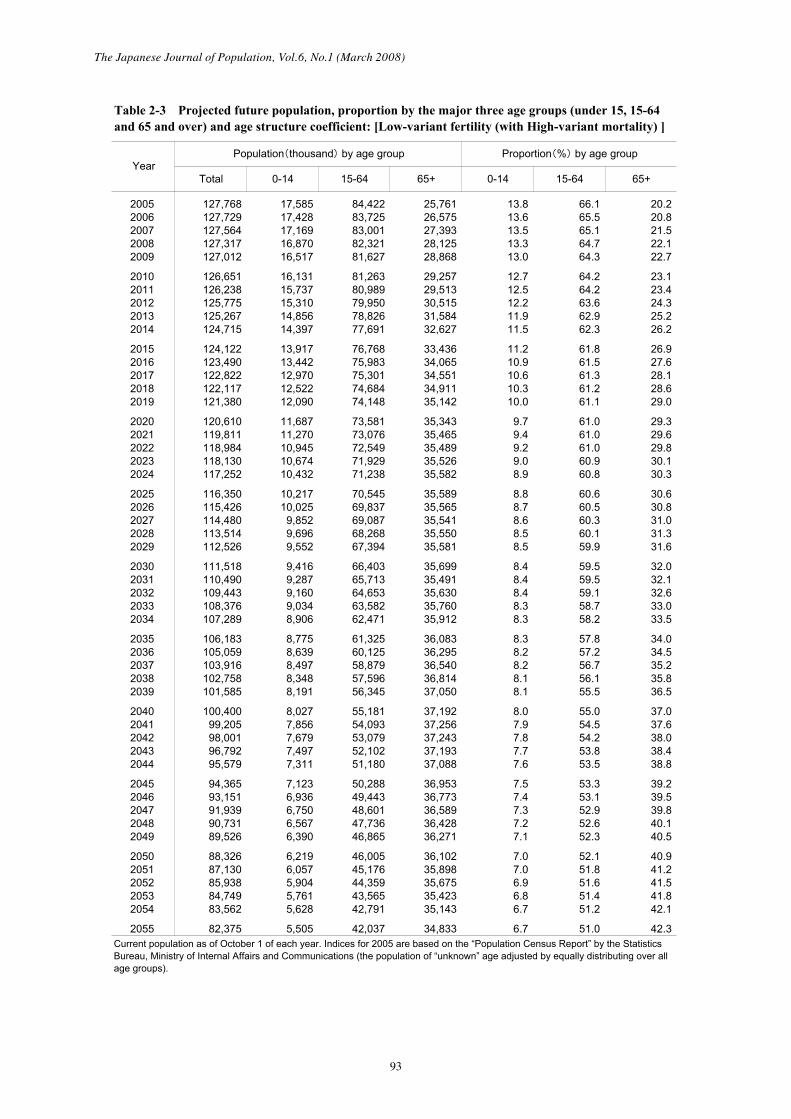
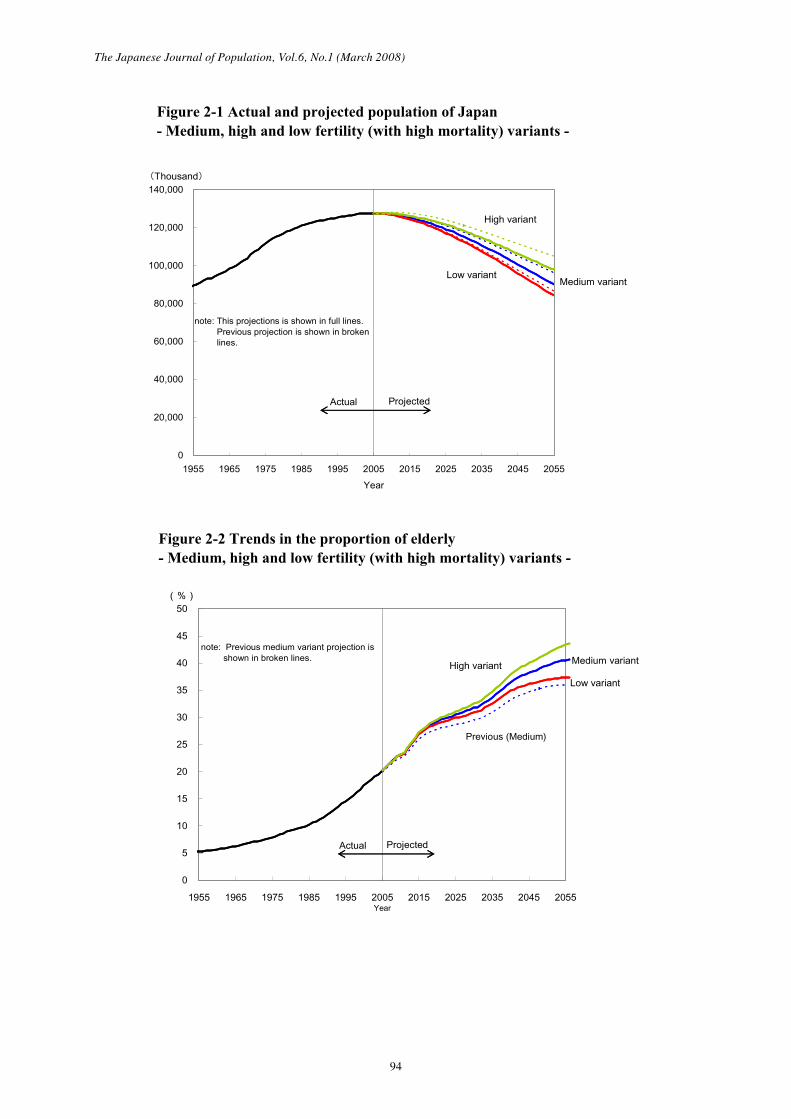
The trend in the size of total population and that in the size and proportion of the three major age groups will also differ between the three assump-tions on fertility under the high-variant mortality assumption (see Figure 2-1, Figure 2-2). In 2055, the total population will be 96.03 million based on the high-fertility projection, and 82.38 million based on the low-fertility projection. The elderly population proportion in the same year will be 36.3% based on the high-fertility projection and 42.3% based on the low-fertility projection (see Table 2-2, Table 2-3). In particular, total popula-tion based on low-fertility (high-mortality) projec-tion will be the smallest among the nine projections (combination of the three fertility assumptions and three mortality assumptions), and the proportion of elderly population is the lowest for the high-fertility (high-mortality) projection.
The low-variant mortality projection is a projection that assumes lower mortality rate as compared with the medium-variant mortality projection, which means a faster advance in mortality improvement,
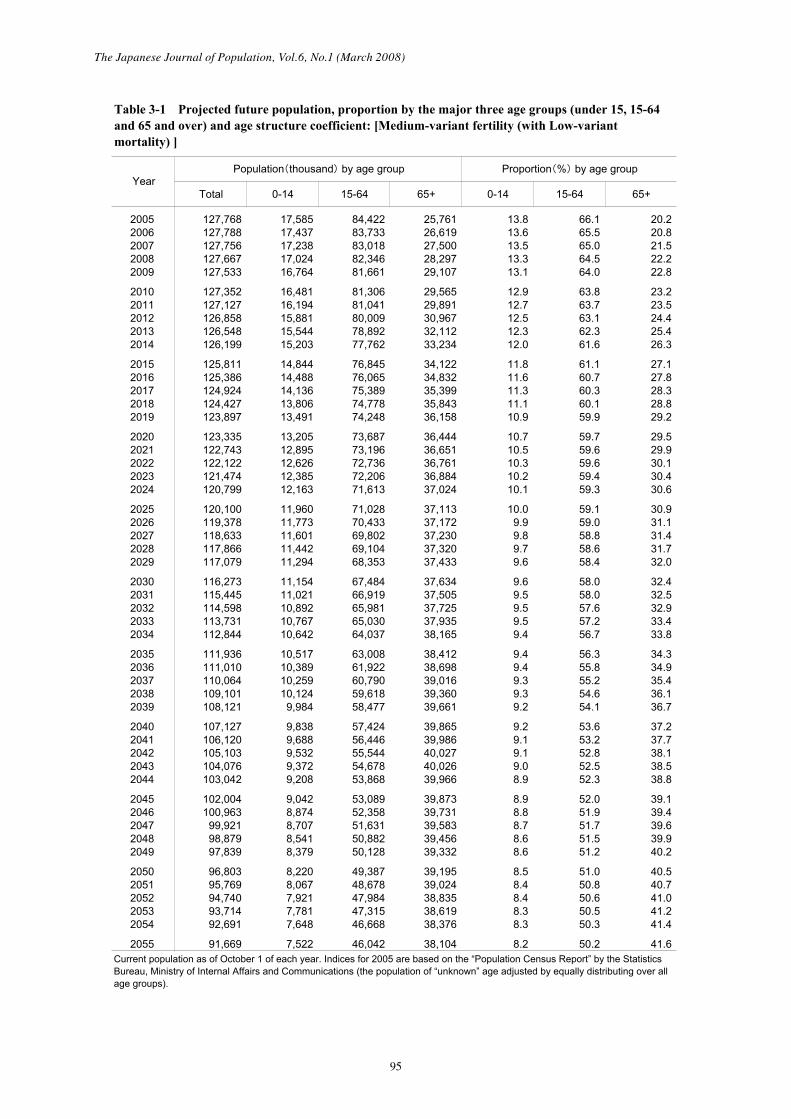
and life expectancy reaching a relatively high level. Therefore, number of deaths will be relatively small, and the population will maintain a higher level under the same assumption on fertility. That is, compared to the total population as of 2055 based on the medium-fertility (medium-mortal-ity) projection, which is 89.93 million, the total population in the same year based on the medium-fertility (low-mortality) projection will be 91.67 million. On the other hand, the trend of the size and the proportion of the three major age groups based on the medium-fertility (low-mortality) projection are as follows: child population (and the propor-tion thereof) will be 7.52 million (8.2%), working-age population (and the proportion thereof) will be 46.04 million (50.2%), and elderly population (and the proportion thereof) will be 38.1 million (41.6%) in 2055. Compared to the results of the medium-fertility (medium-mortality) projection, the size of the elderly population is larger and the proportion of the elderly population is also higher (see Table 3-1).
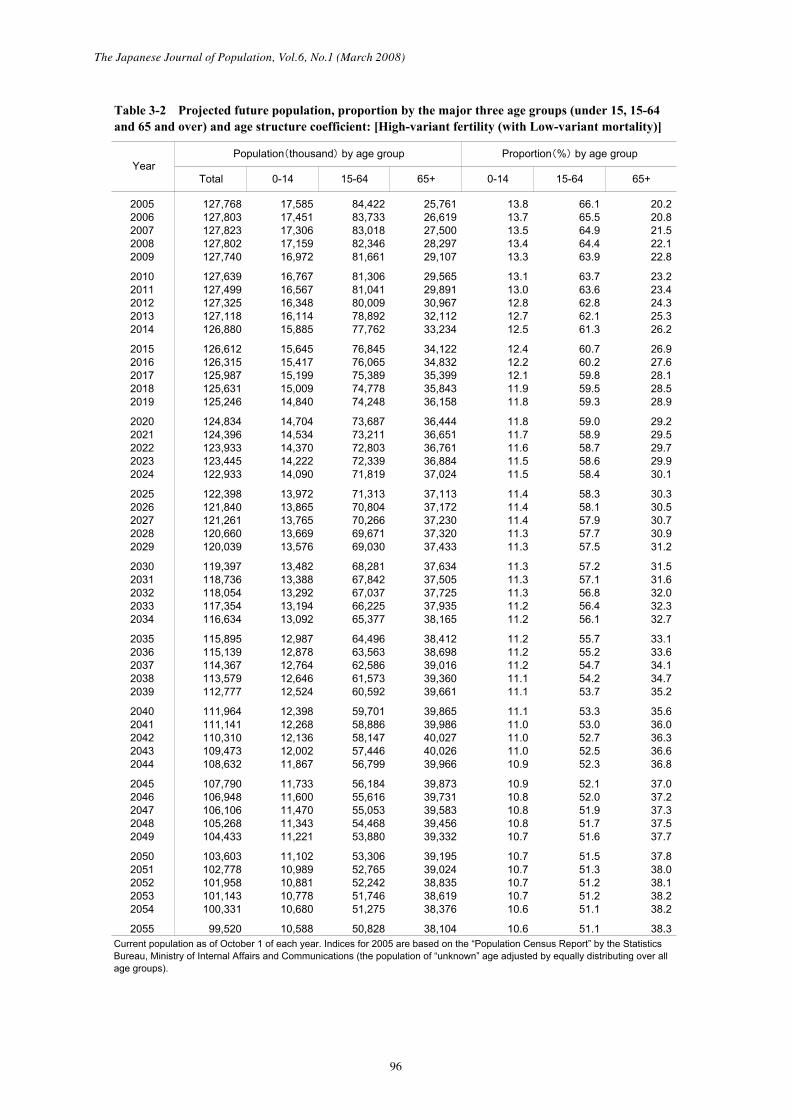
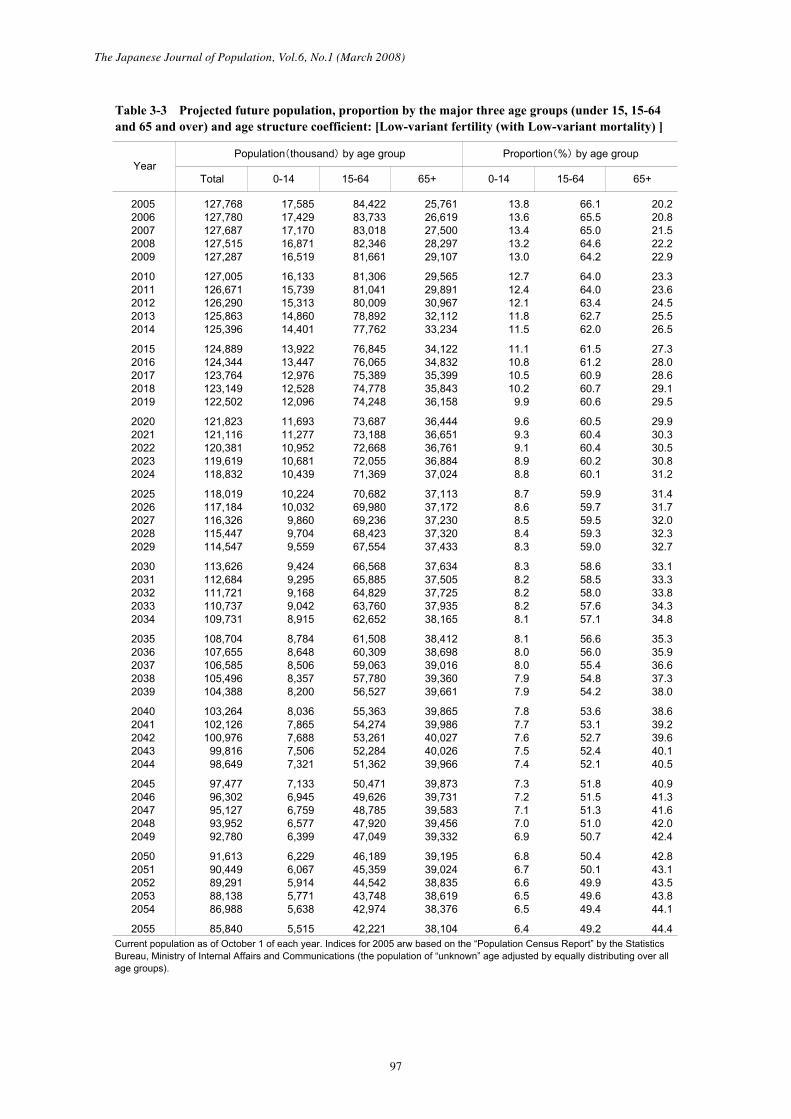
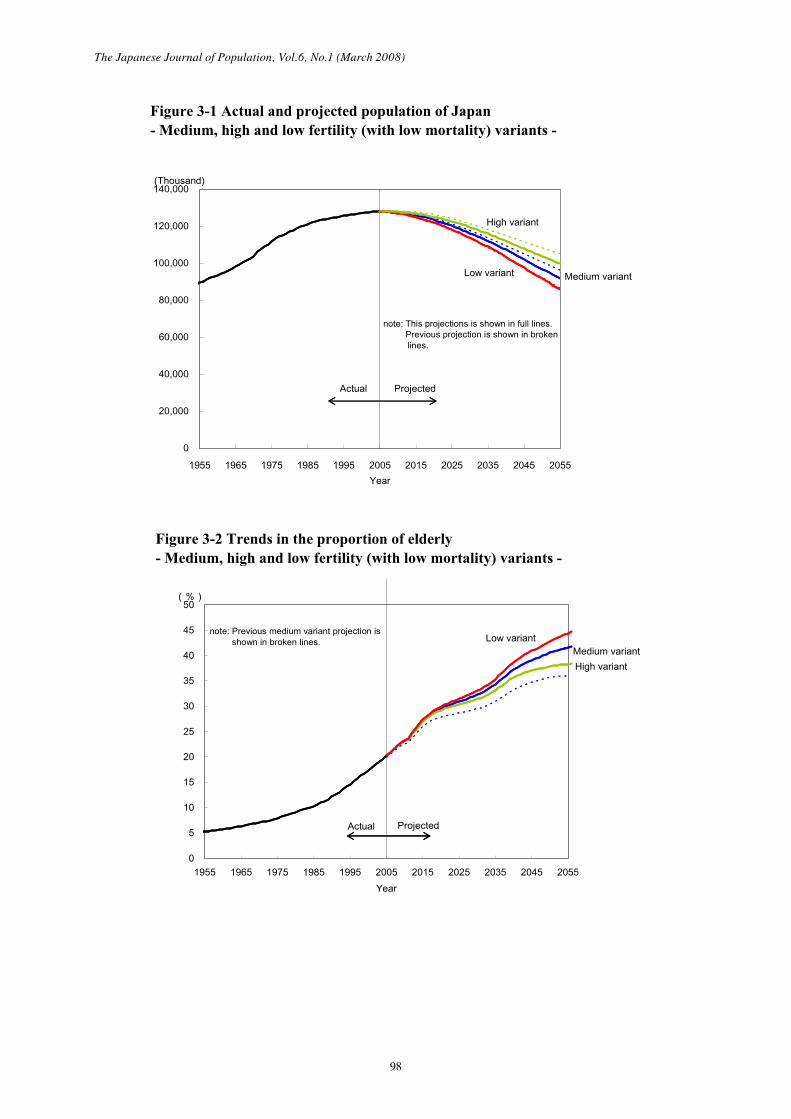
The trend in the size of total population and that in the size and the proportion of the three major age groups will also differ between the three assumptions on fertility under the low-vari-ant mortality assumption (see Figure 3-1, Figure 3-2). In 2055, the total population will be 99.52 million based on the high-fertility projection, and 85.84 million based on the low-fertility projection. The elderly population proportion in the same year will be 38.3% based on the high-fertility projec-tion and 44.4% based on the low-fertility projec-tion (see Table 3-2, Table 3-3). In particular, the total population based on the high-fertility (low-mortality) projection will be the largest among the nine projections (combination of the three fertility assumptions and three mortality assumptions), and the proportion of elderly population is the highest for the low-fertility (low-mortality) projection.
II Summary of the Method Used for Projecting Population
The cohort component method is used for Popu-lation Projections for Japan, as with the previous projections. This is a method for forecasting future population by calculating the yearly changes due to the aging of individuals by each age bracket for each component (death, birth and international migration). As for the already existing individuals, the future population is calculated by subtracting the number of deaths due to aging and international migration. The new born population will be deter-mined by calculating the number of live births from the female population in the reproductive age, and
The Japanese Journal of Population, Vol.6, No.1 (March 2008)
80 81
the number of babies remaining from death and international migration, and will be added to the population of the following year.
Projecting the population using the cohort component method requires the following infor-mation: (1) base population, (2) future fertility rate (and the sex ratio at birth), (3) future survival rate, and (4) future international migration rates (num-bers), all classified by sex and age. This projection method requires a set of assumptions by imple-menting projection techniques based on actual statistics for each component. Given that future changes in fertility and mortality are inherently uncertain, this routine provides a range of popula-tion projections based on alternative assumptions.
1.BasePopulationAs for the base population, or the starting point of the projection, this set of projections uses data on the total population by age and sex as of Octo-ber 1, 2005, in the Population Census of Japan, compiled by the Statistics Bureau of Ministry of Internal Affairs and Communications. However, the population of “unknown” age is included through its even distribution over all age groups. (The distribution of “unknown” age population is done by prefecture, and the population of Japan is obtained by summing up for all prefectures.)
2.AssumptionsofFertilityRatesandSexRatioatBirths
Projecting the future number of births in this pro-jection requires female age-specific fertility rate of the year in question. This projection uses the cohort-fertility method to estimate future fertility rate. The cohort-fertility method observes the birth process per female birth cohort over the course of their lives, and forecasts the level of completed fertility and the birth timing for cohorts in which the birth process is incomplete. The future age-specific fertility rates and total fertility rates on an annual basis can be obtained by converting the per-cohort rate into annual data. In this projection, the fertility trend for the whole population, including foreigners, is obtained by a conversion of this rate for Japanese, from the perspective of further pre-cision in the determination of fertility rate trend. Therefore, the assumed index figures in relation to marriage and childbirth described hereafter are all those of Japanese females.
Cohort age-specific fertility rates are statis-tically estimated and/or assumed by each order of birth by way of models that use lifetime birth probability and age of childbearing as index. The lifetime birth process is statistically estimated from the actual figures derived in the birth process
for cohort that is going through the birth process. As for young cohorts that have only small or no actual figures, the index at the completion of birth process is calculated based on indexes projected separately for the reference cohort. The reference cohort refers to those born in 1990. The index in question is projected based on actual statistics on first marriage behavior, couples’ reproduc-tive behavior, and behavior pertaining to divorce, bereavement and remarriage. The cohort total fer-tility rate and the distribution by birth orders are calculated as the result of such indexes.
Because future fertility is an unknown, three assumptions (medium, high, and low-variant pro-jections) are set and population is projected based on each assumption. This allows adding fluctua-tion range assumed for future population, brought by changes in birth viewed from the current state.
(1) Assumption for the Medium Variant of Fertility
(i) The mean age of first marriage of females by cohort will rise from 24.9 for the cohort born in 1955 to 28.2 for the cohort born in 1990. It eventually reaches 28.3 for the cohort born in 2005 and remains unchanged thereafter.
(ii) The proportion of never married increases from 5.8% for the cohort born in 1955 to 23.5% for the cohort born in 1990. It eventually reaches 23.6% for the cohort born in 2005, remaining unchanged there-after.
(iii) Delayed marriage, delayed childbearing, and changes in the reproductive behavior of couples affect the completed number of births from married couples Index showing changes in reproductive behav-ior of couples (marital fertility variation index), observed by establishing couples with wife in the cohorts born from 1935 to 1954 as a benchmark (1.0), declines to 0.906 for the cohort born in 1990. It reaches 0.902 for the cohort born in 2005 and remains unchanged thereafter. The number of births from married couples is obtained from this index and change in first marriage behavior shown in (i) and (ii) above as follows: 2.19 for the cohorts born from 1953 to 1957 decreases to 1.70 for the cohort born in 1990, and to 1.69 for the cohort born in 2005, remaining unchanged thereafter.
(iv) The effects of divorce, bereavement and remarriage on fertility rates are ascer-tained based on the number of births from
80
The Japanese Journal of Population, Vol.6, No.1 (March 2008)
81
females with previously mentioned experi-ences and the trend of structural changes in marital status. As a result, by setting the birth level of a first-married couple as a benchmark (1.0), the effect of divorce and bereavement and remarriage decrease from the actual figure of 0.952 for the cohort born in 1955 to 0.925 for the cohort born in 1990. It remains unchanged thereafter.
From the results of above (i) to (iv), the total fertility rate of Japanese females decreases from the observed figure of 1.964 for the cohort born in 1955 to 1.202 for the cohort born in 1990. It reaches 1.198 for the cohort born in 2005 and remains unchanged thereafter.
Cohort age-specific fertility rates calculated as above are converted into the annual fertility rate. Subsequently, the fertility rate of the entire
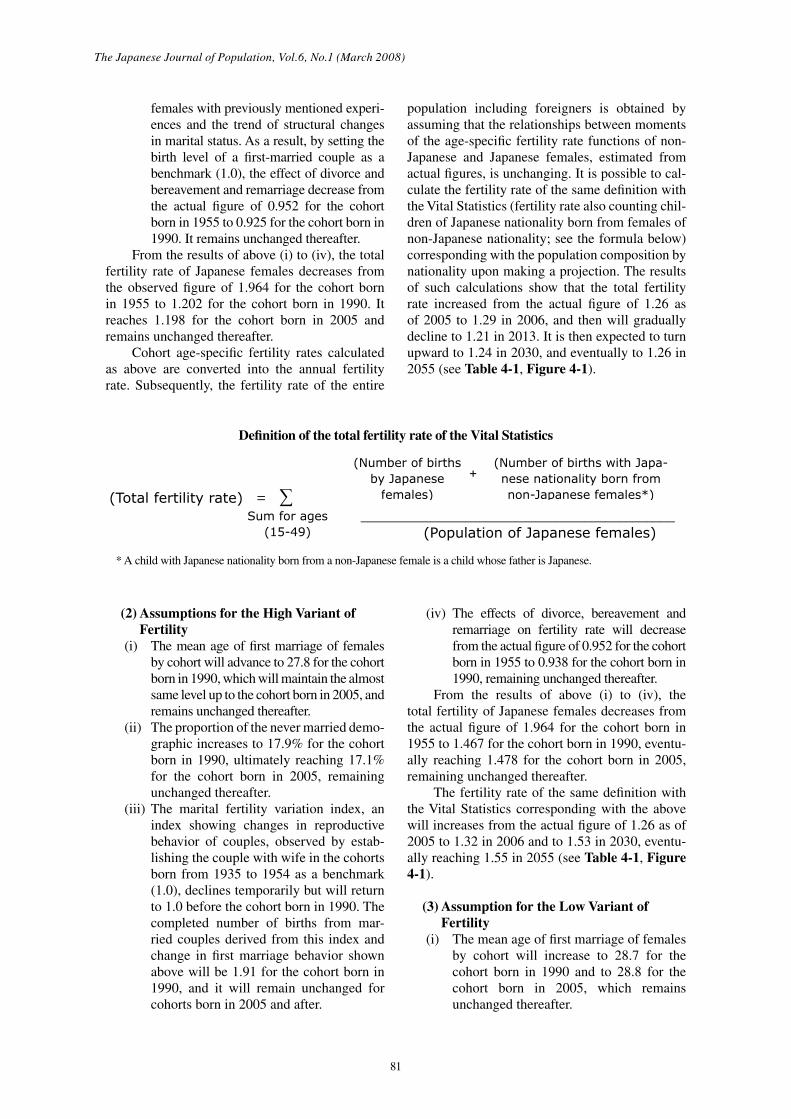
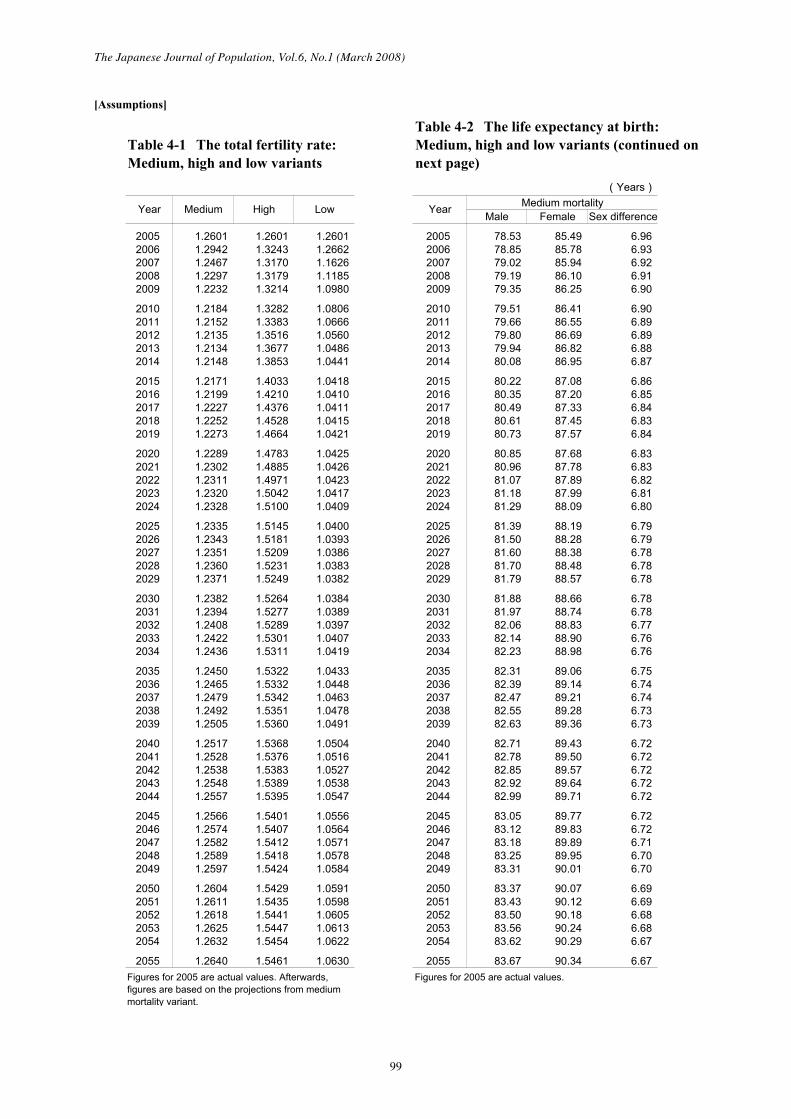
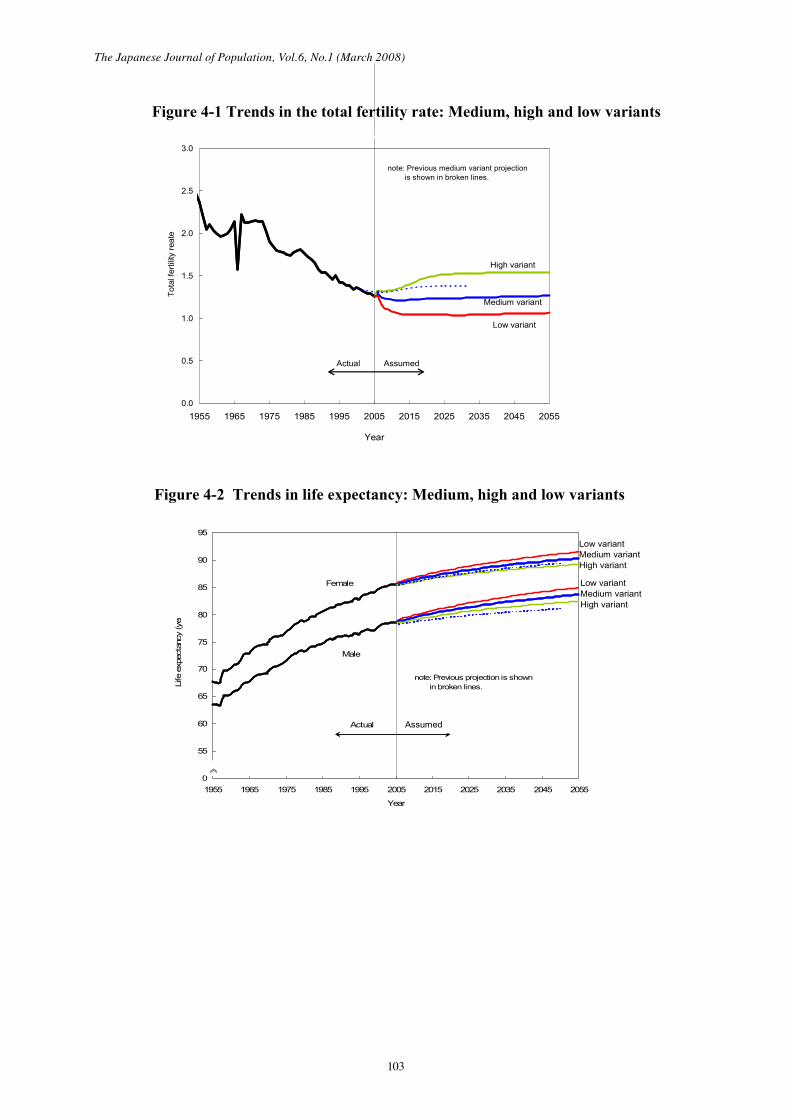
population including foreigners is obtained by assuming that the relationships between moments of the age-specific fertility rate functions of non-Japanese and Japanese females, estimated from actual figures, is unchanging. It is possible to cal-culate the fertility rate of the same definition with the Vital Statistics (fertility rate also counting chil-dren of Japanese nationality born from females of non-Japanese nationality; see the formula below) corresponding with the population composition by nationality upon making a projection. The results of such calculations show that the total fertility rate increased from the actual figure of 1.26 as of 2005 to 1.29 in 2006, and then will gradually decline to 1.21 in 2013. It is then expected to turn upward to 1.24 in 2030, and eventually to 1.26 in 2055 (see Table 4-1, Figure 4-1).
Definition of the total fertility rate of the Vital Statistics
cohort born in 1990. It reaches 1.198 for the cohort born in 2005 and remains unchanged thereafter.
Cohort age-specific fertility rates calculated as above are converted into the an-nual fertility rate. Subsequently, the fertility rate of the entire population including foreigners is obtained by assuming that the relationships between moments of the age-specific fertility rate functions of non-Japanese and Japanese females, estimated from actual figures, is unchanging. It is possible to calculate the fertility rate of the same definition with the Vital Statistics (fertility rate also counting children of Japa-nese nationality born from females of non-Japanese nationality; see the formula below) corresponding with the population composition by nationality upon making a projection. The results of such calculations show that the total fertility rate increased from the actual figure of 1.26 as of 2005 to 1.29 in 2006, and then will gradually decline to 1.21 in 2013. It is then expected to turn upward to 1.24 in 2030, and eventually to 1.26 in 2055 (see Table 4-1, Figure 4-1).
Definition of the total fertility rate of the Vital Statistics
+(Total fertility rate) =
_____________________________________________ (Population of Japanese females)
* A child with Japanese nationality born from a non-Japanese female is a child whose father is Japanese.
(2) Assumptions for the High Variant of Fertility (i) The mean age of first marriage of females by cohort will advance to 27.8 for the
cohort born in 1990, which will maintain the almost same level up to the cohort born in 2005, and remains unchanged thereafter.
(ii) The proportion of the never married demographic increases to 17.9% for the cohort born in 1990, ultimately reaching 17.1% for the cohort born in 2005, remaining unchanged thereafter.
(iii) The marital fertility variation index, an index showing changes in reproduc-tive behavior of couples, observed by establishing the couple with wife in the cohorts born from 1935 to 1954 as a benchmark (1.0), declines temporarily but will return to 1.0 before the cohort born in 1990. The completed number of births from married couples derived from this index and change in first marriage behavior shown above will be 1.91 for the cohort born in 1990, and it will remain unchanged for cohorts born in 2005 and after.
(iv) The effects of divorce, bereavement and remarriage on fertility rate will de-crease from the actual figure of 0.952 for the cohort born in 1955 to 0.938 for the cohort born in 1990, remaining unchanged thereafter.
Sum for ages (15-49)
(Number of births by Japanese
females)
(Number of births with Japa-nese nationality born from non-Japanese females*)
* A child with Japanese nationality born from a non-Japanese female is a child whose father is Japanese.
(2) Assumptions for the High Variant of Fertility
(i) The mean age of first marriage of females by cohort will advance to 27.8 for the cohort born in 1990, which will maintain the almost same level up to the cohort born in 2005, and remains unchanged thereafter.
(ii) The proportion of the never married demo-graphic increases to 17.9% for the cohort born in 1990, ultimately reaching 17.1% for the cohort born in 2005, remaining unchanged thereafter.
(iii) The marital fertility variation index, an index showing changes in reproductive behavior of couples, observed by estab-lishing the couple with wife in the cohorts born from 1935 to 1954 as a benchmark (1.0), declines temporarily but will return to 1.0 before the cohort born in 1990. The completed number of births from mar-ried couples derived from this index and change in first marriage behavior shown above will be 1.91 for the cohort born in 1990, and it will remain unchanged for cohorts born in 2005 and after.
(iv) The effects of divorce, bereavement and remarriage on fertility rate will decrease from the actual figure of 0.952 for the cohort born in 1955 to 0.938 for the cohort born in 1990, remaining unchanged thereafter.
From the results of above (i) to (iv), the total fertility of Japanese females decreases from the actual figure of 1.964 for the cohort born in 1955 to 1.467 for the cohort born in 1990, eventu-ally reaching 1.478 for the cohort born in 2005, remaining unchanged thereafter.
The fertility rate of the same definition with the Vital Statistics corresponding with the above will increases from the actual figure of 1.26 as of 2005 to 1.32 in 2006 and to 1.53 in 2030, eventu-ally reaching 1.55 in 2055 (see Table 4-1, Figure 4-1).
(3) Assumption for the Low Variant of Fertility
(i) The mean age of first marriage of females by cohort will increase to 28.7 for the cohort born in 1990 and to 28.8 for the cohort born in 2005, which remains unchanged thereafter.
The Japanese Journal of Population, Vol.6, No.1 (March 2008)
82 83
(ii) The proportion of the never married demo-graphic increases to 27.0% for the cohort born in 1990, and eventually reaches 27.4% for the cohort born in 2005, which remains unchanged thereafter.
(iii) Marital fertility variation index, a index showing changes in the reproductive behavior of couples, observed by estab-lishing couples with wives in the cohorts born from 1935 to 1954 as a benchmark (1.0), declines thereafter to 0.838 for the cohort born in 1990. It will eventually reach 0.825 for the cohort born in 2005, remaining unchanged thereafter. Com-pleted number of births from married cou-ples derived from this index and change in first marriage behavior shown above will decrease to 1.52 for the cohort born in 1990, and will reach 1.49 for cohorts born in 2005, which remains unchanged thereafter.
(iv) The effects of divorce, bereavement and remarriage on fertility rates will decrease from the actual figure of 0.952 for the cohort born in 1955 to 0.918 for the cohort born in 1990, remaining unchanged there-after.
Based on the results of (i) to (iv) above, the cohort total fertility of Japanese females decreases from the actual figure of 1.964 for the cohort born in 1955 to 1.022 for the cohort born in 1990, even-tually reaching 0.999 for the cohort born in 2005, which remains unchanged thereafter.
The fertility rate of the same definition with the Vital Statistics corresponding with the above will increase from the actual figure of 1.26 as of 2005 to 1.27 in 2006. However, it will decline to the order of 1.03 in 2026, following which it will marginally increase to 1.06 by 2055 (see Table 4-1, Figure 4-1).
As regards sex ratio at birth (the number of male children compared with 100 female children) that is used when the future number of newborns is divided into male and female, the actual figure of 105.4 for five years from 2001 to 2005 is used as remaining consistent from 2006 and thereafter.
In order to project the population from one year to the next, survivorship ratios by age and sex are needed, and, in order to obtain future survivorship ratios, it is necessary to construct future life tables. This projection has adopted the Lee-Carter model,
which is internationally recognized as the standard model, to construct future life tables. This projec-tion modifies the model by adding new features that properly respond to life expectancy trends in Japan, which is the highest in the world. The Lee-Carter model describes change in mortality rates for each age according to the general level of mortality changes, by decomposing a matrix of age-specific death rates into the “average” mortal-ity age schedule, the general level of mortality (mortality index), the age-specific changes “when the general level of mortality changes,” and an error term. In this projection, logistic curves are applied for past mortality curves so as to estimate their parameters on significance of age shifts and gradients, and the Lee-Carter model is applied by considering the age shift of advanced age mortal-ity rate, in order to suit the mortality state of Japan, where mortality rate improvement is notable.
Upon projecting the future mortality index, data after 1970 is used in order to reflect changes in the level of mortality that remained slow and grad-ual over the past 35 years. From the perspective of ensuring consistency in terms of the mortality rate of males and females, curve fittings were applied simultaneously for both males and females. Future amounts of age shift were projected using linear relations with the mortality index in the past ten years, and gradient was fixed for the future using the latest mean value (covering the past ten years for males and past the 15 years for females).
Because the improvement in mortality lev-els for recent years is showing trends beyond the assumptions of existing theory, it is assumed that future mortality rate transitions and levels reached will be highly uncertain. Therefore, in this projection, it was decided that a projection with a selected range based on several assumptions would be implemented. To obtain the variants in mortality index parameters for the standard mor-tality rate trend, the bootstrap method is used to estimate the 99% confidence interval. The “high variant of death” assumption is the projection with a high mortality rate in which the mortality index maintains the upper limit level of the confidence interval, and “low variant of death” assumption is the projection with low mortality rate in which the mortality index maintains the lower limit of the confidence interval.
The future life tables were constructed from the assumed age- and sex-specific mortality rates up until 2055, based upon the parameters obtained through the above procedures.
82
The Japanese Journal of Population, Vol.6, No.1 (March 2008)
83
(1) Assumptions for the Medium Variant of Mortality
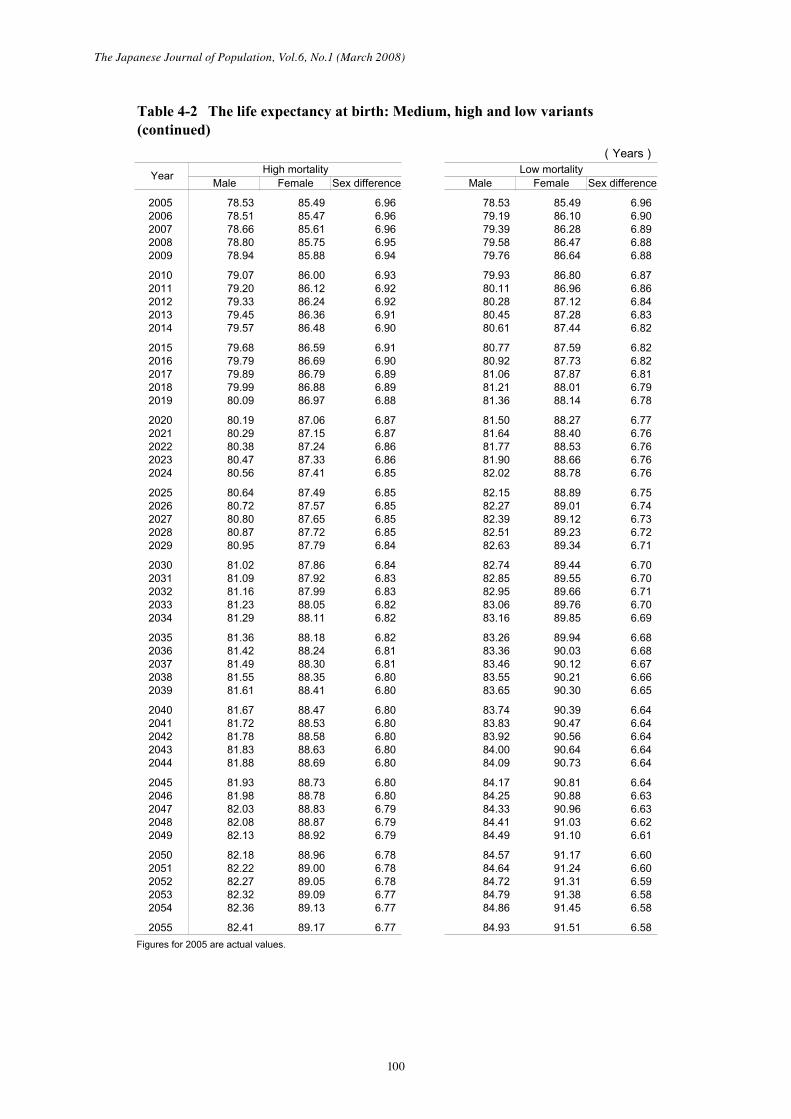
According to the standard future life tables, life expectancy, which was 78.53 years for males and 85.49 years for females in 2005, is expected to extend to 79.51 years for males and 86.41 years for females in 2010, 81.88 years for males and 88.66 years for females in 2030, and, in 2055, 83.67 years for males and 90.34 years for females (see Table 4-2, Figure 4-2).
(2) Assumptions for the High Variant of Mortality
According to the assumption for the high variant of death, the mortality rate will increase, and there-fore life expectancy will be shorter as compared to the medium-variant assumption. As a result, life expectancy in 2055 according to this assumption will be 82.41 years for males and 89.17 years for females.
(3) Assumptions for the Low Variant of Mortality
According to the assumption for the medium vari-ant of death, the mortality rate will be lower, and therefore the life expectancy will be longer as compared to the medium-variant assumption. As a result, the life expectancy in 2055 according to this assumption will be 84.93 years for males and 91.51 years for females.
International migration varies largely in line with processes in globalization and changes in the eco-nomic conditions of Japan. Additionally, it is also affected by the policies and regulations concern-ing international migration in Japan, and by the economic and social conditions of other countries as well. Other temporary circumstances that could
affect the international migration rate include ter-rorist attacks and the epidemics such as SARS (Severe Acute Respiratory Syndrome).
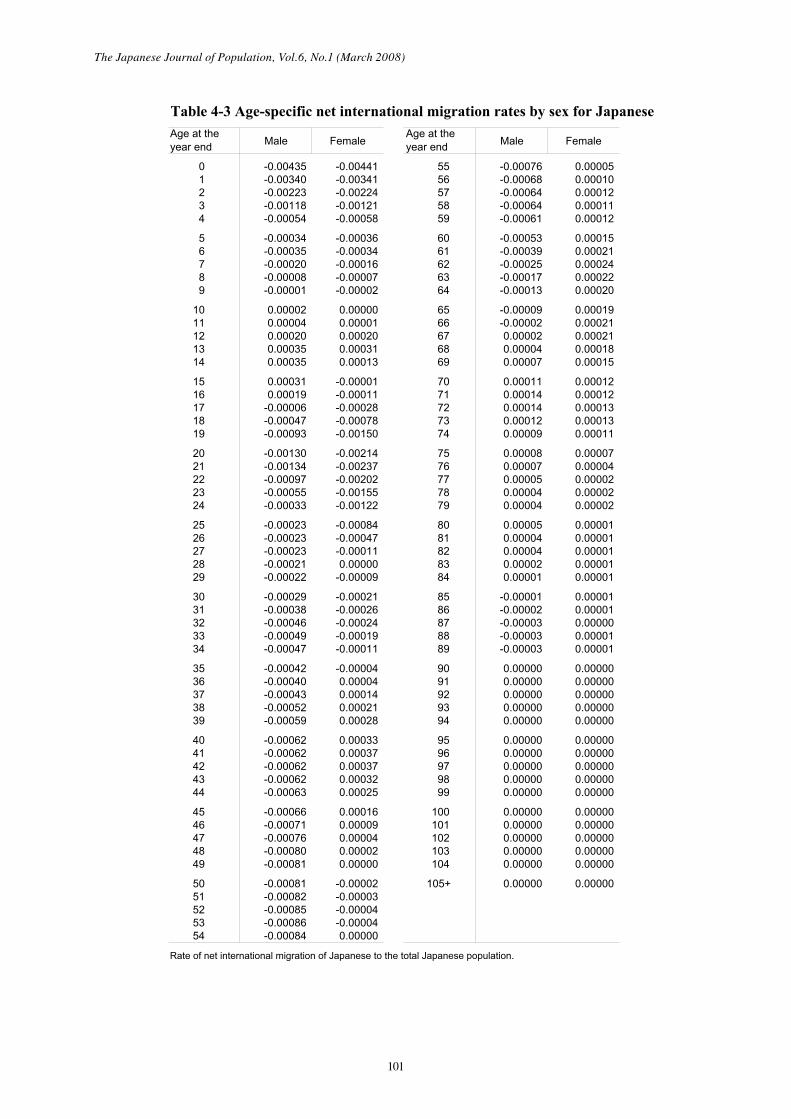
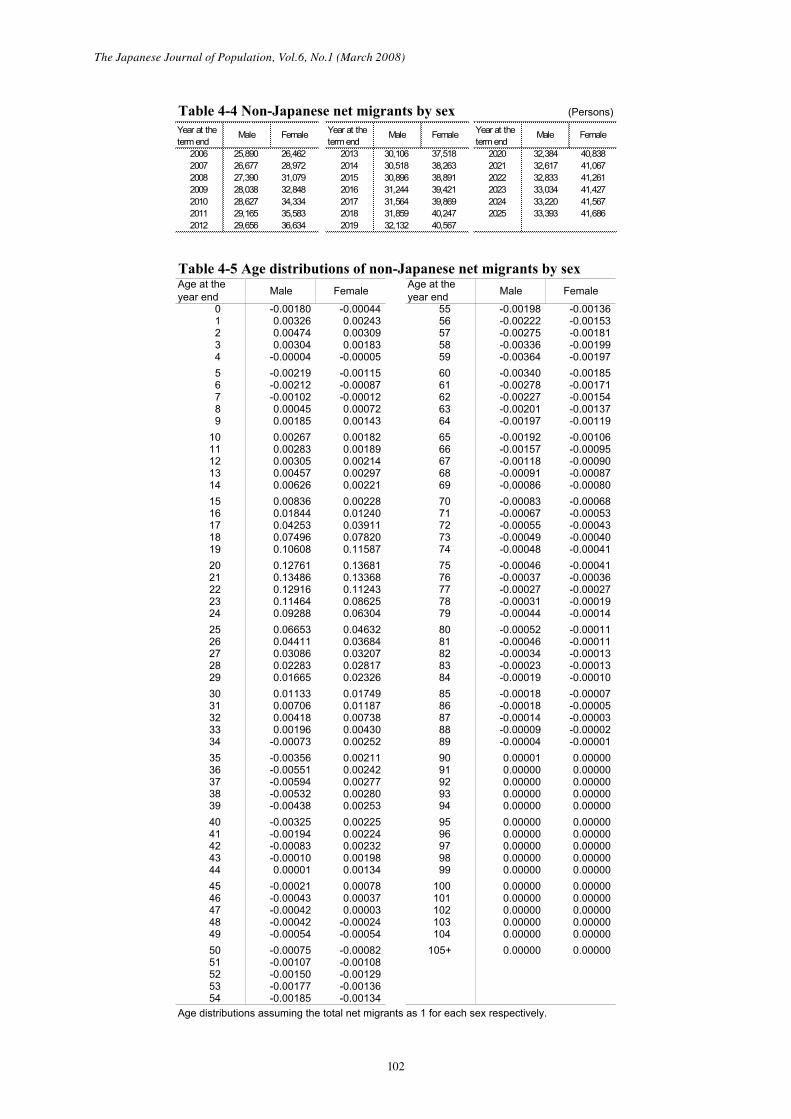
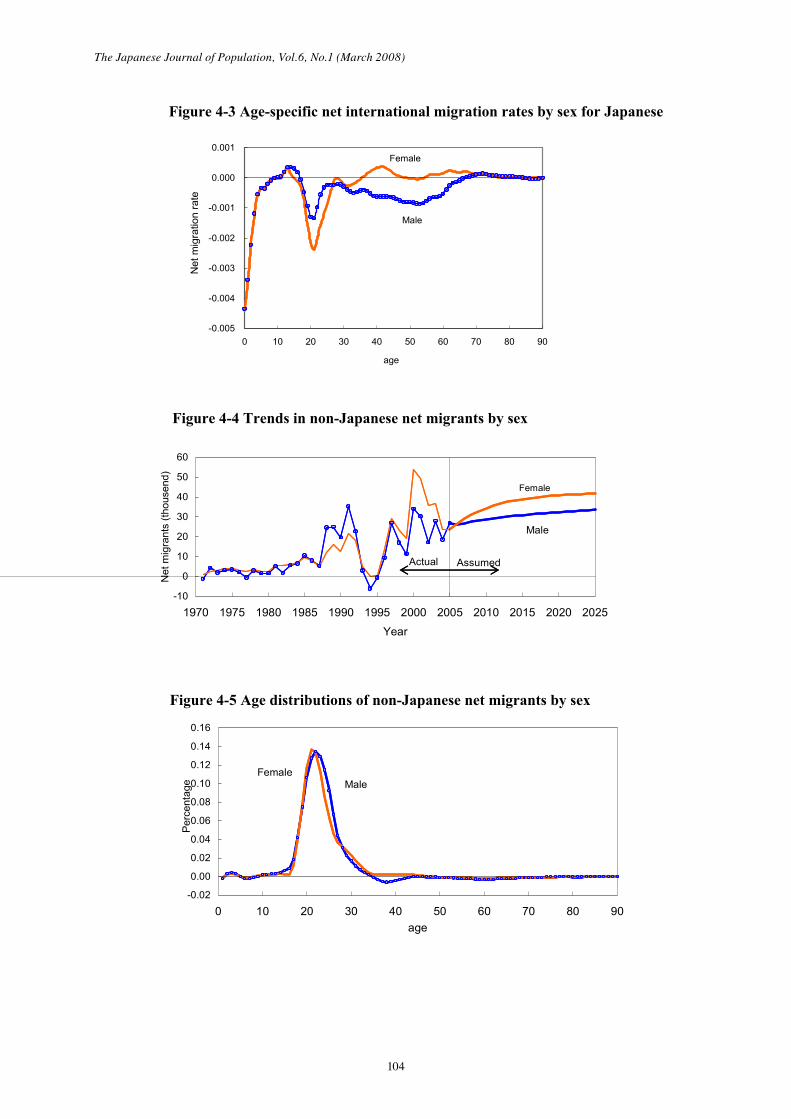
The actual figures show that international migration trends differ between Japanese and non-Japanese populations. Additionally, in theory, the number of non-Japanese entering Japan can be unrelated to the population size or age structure of Japan. Therefore, in this projection international migration figures are analyzed and projected sepa-rately for the Japanese and non-Japanese popula-tions. The report calls them the “net international migration rate for Japanese” and the “net migrants of non-Japanese,” respectively.
The overall trend in international migration of the Japanese population shows exits exceed-ing entries. This trend is relatively stable, thus the assumptions are made as follows: first, obtain the average value of the age- and sex-specific annual net international migration rate between 1995 and 2005 (excluding 2001-2004, which were the years affected by terrorist attacks and SARS), and then smooth the rate to remove random fluctuation, and set the result as the net international migration rate of Japanese for 2006 and after.
As for international migration of the non-Japanese population, the figure for net migrants is showing an overall increasing trend, although some significant fluctuation therein has been observed in recent years. The number for future net migrants for non-Japanese by sex was projected for the period from 2006 to 2025 by ascertaining actual trends of net migrants by major countries of origin. The figure was assumed to be unchanged beyond 2026. In addition, because the propor-tion of sex-specific non-Japanese entries by age has been relatively stable since 2000, the average value for 2000-2005 is adjusted and is assumed as unchanged beyond 2006 (see Tables 4-3 through 4-5, Figures 4-3 through 4-5).
The Japanese Journal of Population, Vol.6, No.1 (March 2008)
84 85
[Results of Projections Based on Medium-Variants of Mortality]Table 1-1 Projected future population, proportion by the major three age groups (under 15, 15-64and 65 and over) and age structure coefficient: [Medium-variant fertility (with Medium-variantmortality) ]
YearPopulation thousand by age group Proportion % by age group
2055 89,930 7,516 45,951 36,463 8.4 51.1 40.5Current population as of October 1 of each year. Indices for 2005 are based on the “Population Census Report” by the StatisticsBureau, Ministry of Internal Affairs and Communications (the population of “unknown” age adjusted by equally distributing over allage groups).
84
The Japanese Journal of Population, Vol.6, No.1 (March 2008)
85
Table 1-2 Projected future population, proportion by the major three age groups (under 15, 15-64and 65 and over) and age structure coefficient: [High-variant fertility (with Medium-variantmortality) ]
YearPopulation thousand by age group Proportion % by age group
2055 97,775 10,579 50,733 36,463 10.8 51.9 37.3Current population as of October 1 of each year. Indices for 2005 are based on the “Population Census Report” by the StatisticsBureau, Ministry of Internal Affairs and Communications (the population of “unknown” age adjusted by equally distributing over allage groups).
The Japanese Journal of Population, Vol.6, No.1 (March 2008)
86 87
Table 1-3 Projected future population, proportion by the major three age groups (under 15, 15-64and 65 and over) and age structure coefficient: [Low-variant fertility (with Medium-variantmortality) ]
YearPopulation thousand by age group Proportion % by age group
2055 84,106 5,510 42,133 36,463 6.6 50.1 43.4Current population as of October 1 of each year. Indices for 2005 are based on the “Population Census Report” by the StatisticsBureau, Ministry of Internal Affairs and Communications (the population of “unknown” age adjusted by equally distributing over allage groups).
86
The Japanese Journal of Population, Vol.6, No.1 (March 2008)
87
Table 1-4 Mean age and age structure index of population [Medium, high and low-variant fertility (withMedium-variant mortality) ]
Year
Medium fertility (medium mortality) High fertility (medium mortality) Low fertility (medium mortality)
2055 55.0 95.7 16.4 79.4 52.3 92.7 20.9 71.9 57.2 99.6 13.1 86.5Current population as of October 1 of each year. Indices for 2005 are based on the “Population Census Report” by the Statistics Bureau,Ministry of Internal Affairs and Communications (the population of “unknown” age adjusted by equally distributing over all age groups).
The Japanese Journal of Population, Vol.6, No.1 (March 2008)
88 89
Figure 1-2 Trends in the proportion of elderly- Medium, high and low fertility (with medium mortality) variants -
Figure 1-1 Actual and projected population of Japan- Medium, high and low fertility (with medium mortality) variants -
Actual Projected
High variant
note: Previous medium variant projection is shown in broken lines.
Child population(aged under 15) Elderly population
(aged 65 and over)
(Thousand)
note: Previous medium variant projection is shown in broken lines.
The Japanese Journal of Population, Vol.6, No.1 (March 2008)
90 91
age
Male Female
age
Male Female
age
Male Female
Figure 1-5 Population pyramid: Medium fertility (with Medium mortality) variant
90
The Japanese Journal of Population, Vol.6, No.1 (March 2008)
91
[Results of Projections Based on High and Low Variants of Mortality]
Table 2-1 Projected future population, proportion by the major three age groups (under 15, 15-64and 65 and over) and age structure coefficient: [Medium-variant fertility (with High-variantmortality)]
YearPopulation thousand by age group Proportion % by age group
2055 88,193 7,509 45,852 34,833 8.5 52.0 39.5Current population as of October 1 of each year. Indices for 2005 are based on the “Population Census Report” by the StatisticsBureau, Ministry of Internal Affairs and Communications (the population of “unknown” age adjusted by equally distributing over allage groups).
The Japanese Journal of Population, Vol.6, No.1 (March 2008)
92 93
Table 2-2 Projected future population, proportion by the major three age groups (under 15, 15-64and 65 and over) and age structure coefficient: [High-variant fertility (with High-variant mortality) ]
YearPopulation thousand by age group Proportion % by age group
2055 96,030 10,569 50,628 34,833 11.0 52.7 36.3Current population as of October 1 of each year. Indices for 2005 are based on the “Population Census Report” by the StatisticsBureau, Ministry of Internal Affairs and Communications (the population of “unknown” age adjusted by equally distributing over allage groups).
92
The Japanese Journal of Population, Vol.6, No.1 (March 2008)
93
Table 2-3 Projected future population, proportion by the major three age groups (under 15, 15-64and 65 and over) and age structure coefficient: [Low-variant fertility (with High-variant mortality) ]
YearPopulation thousand by age group Proportion % by age group
2055 82,375 5,505 42,037 34,833 6.7 51.0 42.3Current population as of October 1 of each year. Indices for 2005 are based on the “Population Census Report” by the StatisticsBureau, Ministry of Internal Affairs and Communications (the population of “unknown” age adjusted by equally distributing over allage groups).
The Japanese Journal of Population, Vol.6, No.1 (March 2008)
94 95
Figure 2-1 Actual and projected population of Japan- Medium, high and low fertility (with high mortality) variants -
Figure 2-2 Trends in the proportion of elderly- Medium, high and low fertility (with high mortality) variants -
note: This projections is shown in full lines. Previous projection is shown in broken lines.
Low variant
High variant
Medium variant
Actual Projected
High variant
note: Previous medium variant projection is shown in broken lines.
Low variant
Medium variant
94
The Japanese Journal of Population, Vol.6, No.1 (March 2008)
95
Table 3-1 Projected future population, proportion by the major three age groups (under 15, 15-64and 65 and over) and age structure coefficient: [Medium-variant fertility (with Low-variantmortality) ]
YearPopulation thousand by age group Proportion % by age group
2055 91,669 7,522 46,042 38,104 8.2 50.2 41.6Current population as of October 1 of each year. Indices for 2005 are based on the “Population Census Report” by the StatisticsBureau, Ministry of Internal Affairs and Communications (the population of “unknown” age adjusted by equally distributing over allage groups).
The Japanese Journal of Population, Vol.6, No.1 (March 2008)
96 97
Table 3-2 Projected future population, proportion by the major three age groups (under 15, 15-64and 65 and over) and age structure coefficient: [High-variant fertility (with Low-variant mortality)]
YearPopulation thousand by age group Proportion % by age group
2055 99,520 10,588 50,828 38,104 10.6 51.1 38.3Current population as of October 1 of each year. Indices for 2005 are based on the “Population Census Report” by the StatisticsBureau, Ministry of Internal Affairs and Communications (the population of “unknown” age adjusted by equally distributing over allage groups).
96
The Japanese Journal of Population, Vol.6, No.1 (March 2008)
97
Table 3-3 Projected future population, proportion by the major three age groups (under 15, 15-64and 65 and over) and age structure coefficient: [Low-variant fertility (with Low-variant mortality) ]
YearPopulation thousand by age group Proportion % by age group
2055 85,840 5,515 42,221 38,104 6.4 49.2 44.4Current population as of October 1 of each year. Indices for 2005 arw based on the “Population Census Report” by the StatisticsBureau, Ministry of Internal Affairs and Communications (the population of “unknown” age adjusted by equally distributing over allage groups).
The Japanese Journal of Population, Vol.6, No.1 (March 2008)
98 99
Figure 3-1 Actual and projected population of Japan- Medium, high and low fertility (with low mortality) variants -
Figure 3-2 Trends in the proportion of elderly- Medium, high and low fertility (with low mortality) variants -
(Thousand)
Actual Projected
Low variant
High variant
note: This projections is shown in full lines. Previous projection is shown in broken lines.
2055 1.2640 1.5461 1.0630 2055 83.67 90.34 6.67Figures for 2005 are actual values. Afterwards,figures are based on the projections from mediummortality variant.
Figures for 2005 are actual values.
The Japanese Journal of Population, Vol.6, No.1 (March 2008)
100 101
Table 4-2 The life expectancy at birth: Medium, high and low variants(continued)
Years
Year High mortality Low mortalityMale Female Sex difference Male Female Sex difference
The Japanese Journal of Population, Vol.6, No.1 (March 2008)
105
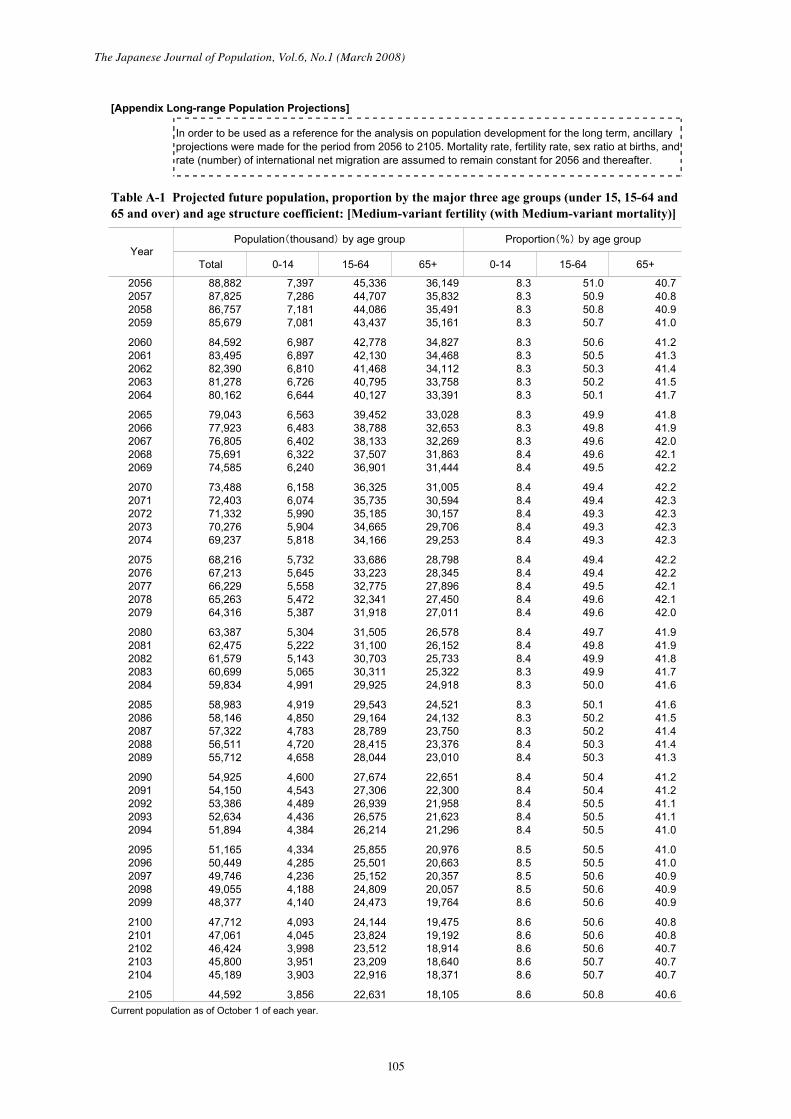
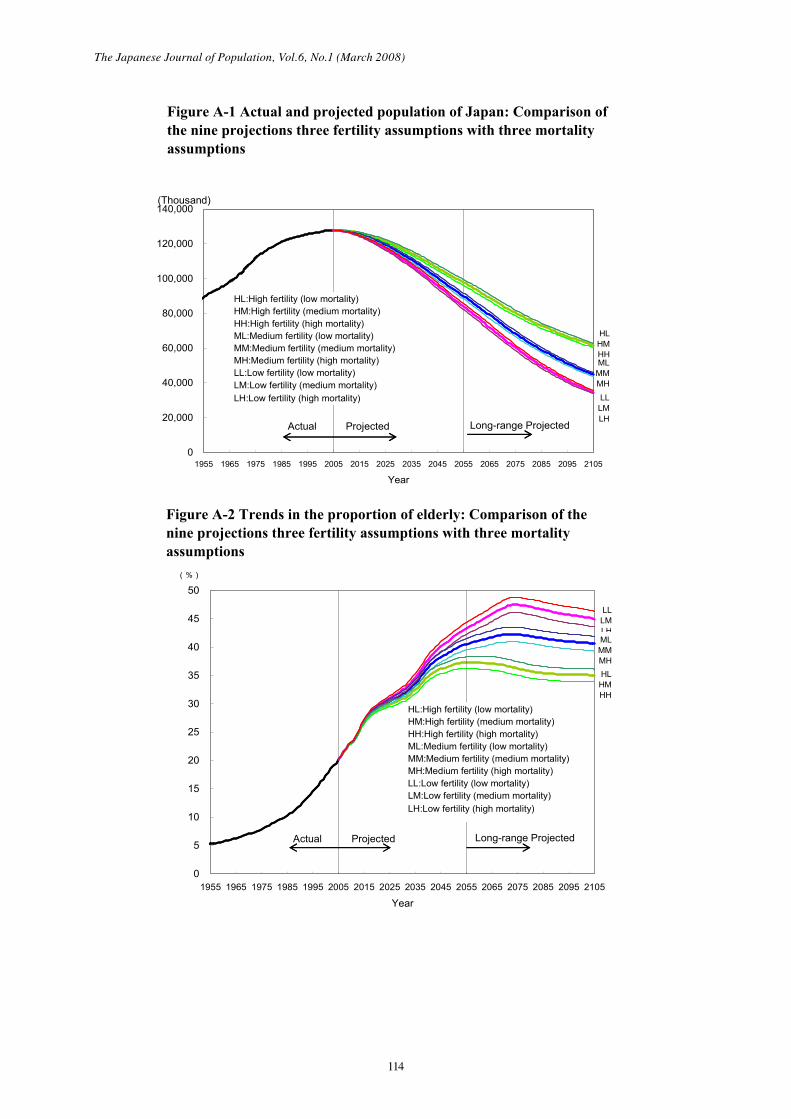
[Appendix Long-range Population Projections]
In order to be used as a reference for the analysis on population development for the long term, ancillaryprojections were made for the period from 2056 to 2105. Mortality rate, fertility rate, sex ratio at births, andrate (number) of international net migration are assumed to remain constant for 2056 and thereafter.
Table A-1 Projected future population, proportion by the major three age groups (under 15, 15-64 and65 and over) and age structure coefficient: [Medium-variant fertility (with Medium-variant mortality)]
YearPopulation thousand by age group Proportion % by age group
2105 44,592 3,856 22,631 18,105 8.6 50.8 40.6Current population as of October 1 of each year.
The Japanese Journal of Population, Vol.6, No.1 (March 2008)
106 107
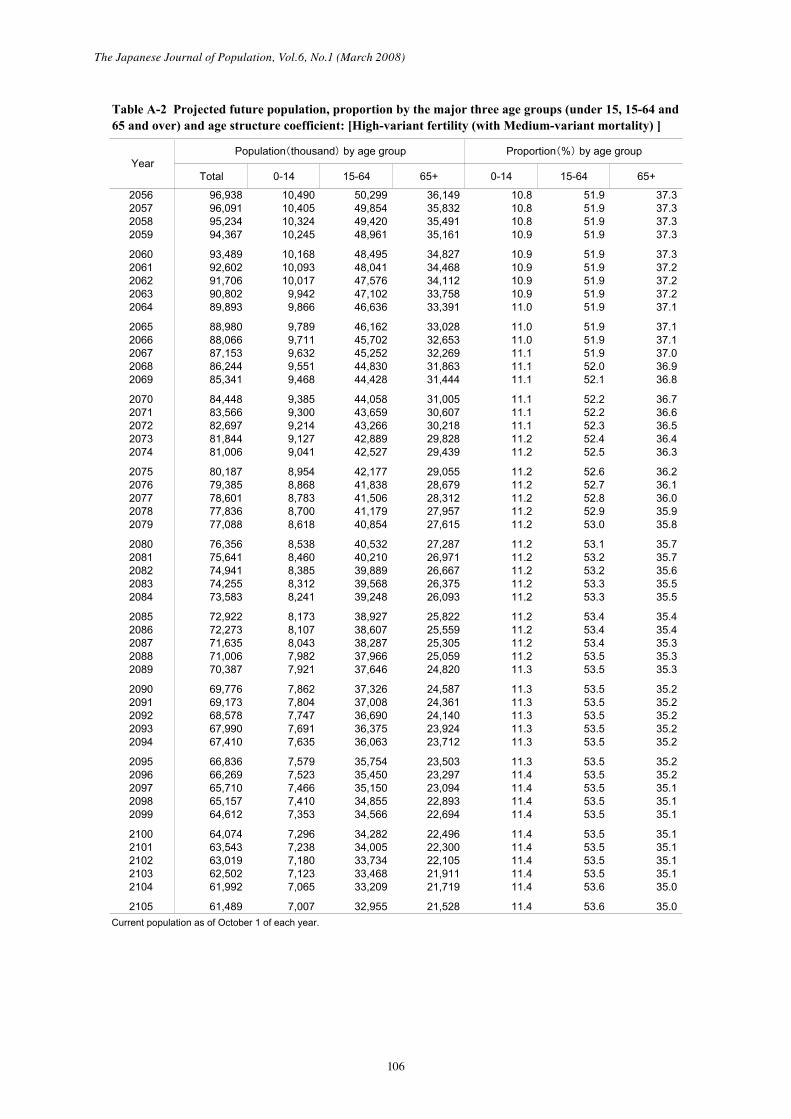
Table A-2 Projected future population, proportion by the major three age groups (under 15, 15-64 and65 and over) and age structure coefficient: [High-variant fertility (with Medium-variant mortality) ]
YearPopulation thousand by age group Proportion % by age group
2105 61,489 7,007 32,955 21,528 11.4 53.6 35.0Current population as of October 1 of each year.
106
The Japanese Journal of Population, Vol.6, No.1 (March 2008)
107
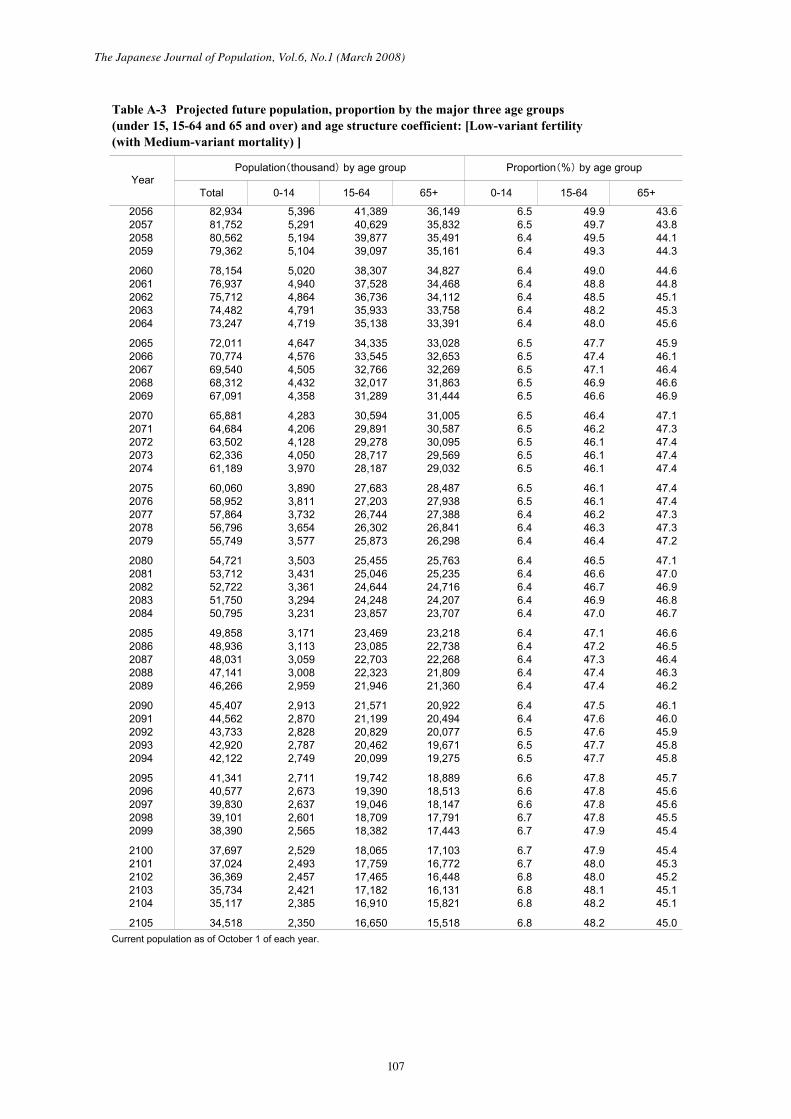
Table A-3 Projected future population, proportion by the major three age groups(under 15, 15-64 and 65 and over) and age structure coefficient: [Low-variant fertility(with Medium-variant mortality) ]
YearPopulation thousand by age group Proportion % by age group
2105 34,518 2,350 16,650 15,518 6.8 48.2 45.0Current population as of October 1 of each year.
The Japanese Journal of Population, Vol.6, No.1 (March 2008)
108 109
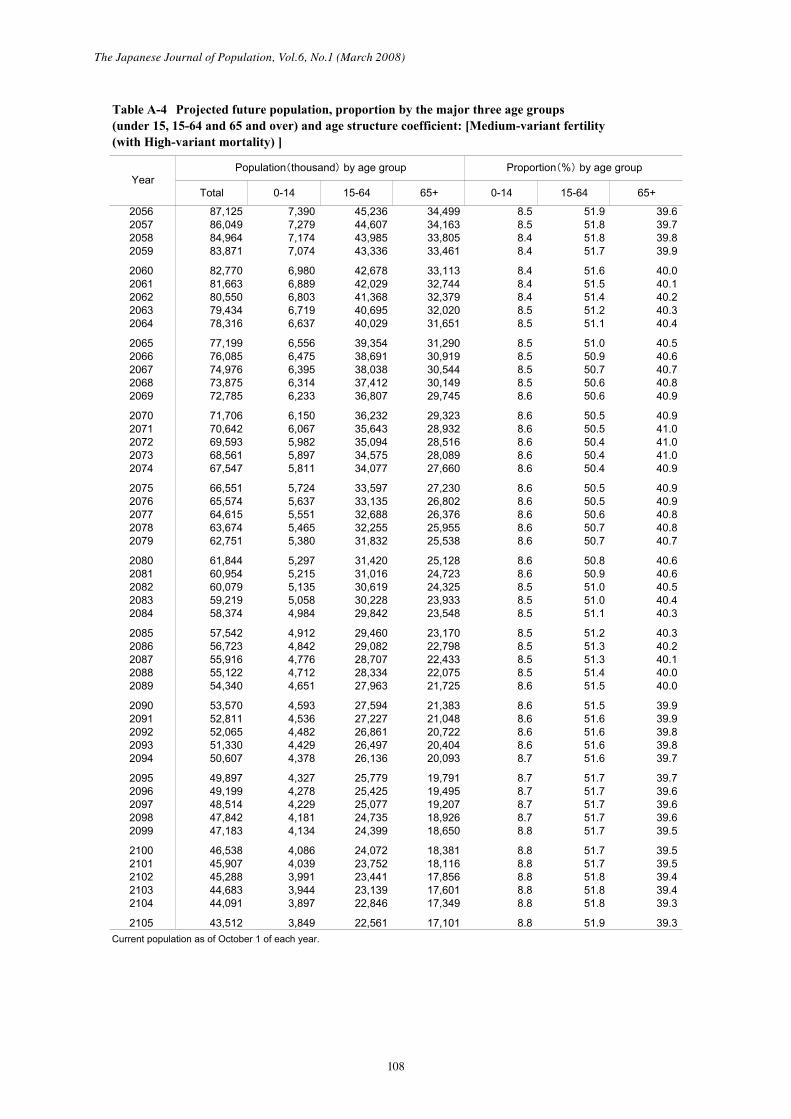
Table A-4 Projected future population, proportion by the major three age groups(under 15, 15-64 and 65 and over) and age structure coefficient: [Medium-variant fertility(with High-variant mortality) ]
YearPopulation thousand by age group Proportion % by age group
2105 43,512 3,849 22,561 17,101 8.8 51.9 39.3Current population as of October 1 of each year.
108
The Japanese Journal of Population, Vol.6, No.1 (March 2008)
109
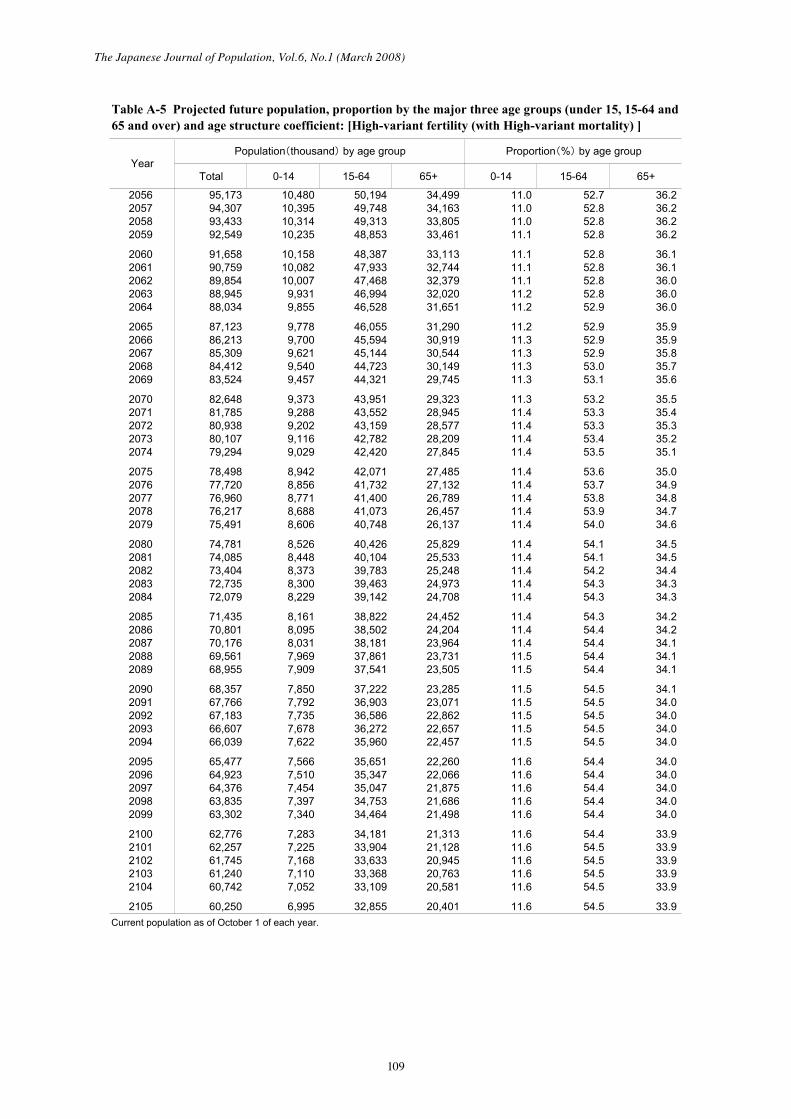
Table A-5 Projected future population, proportion by the major three age groups (under 15, 15-64 and65 and over) and age structure coefficient: [High-variant fertility (with High-variant mortality) ]
YearPopulation thousand by age group Proportion % by age group
2105 60,250 6,995 32,855 20,401 11.6 54.5 33.9Current population as of October 1 of each year.
The Japanese Journal of Population, Vol.6, No.1 (March 2008)
110 111
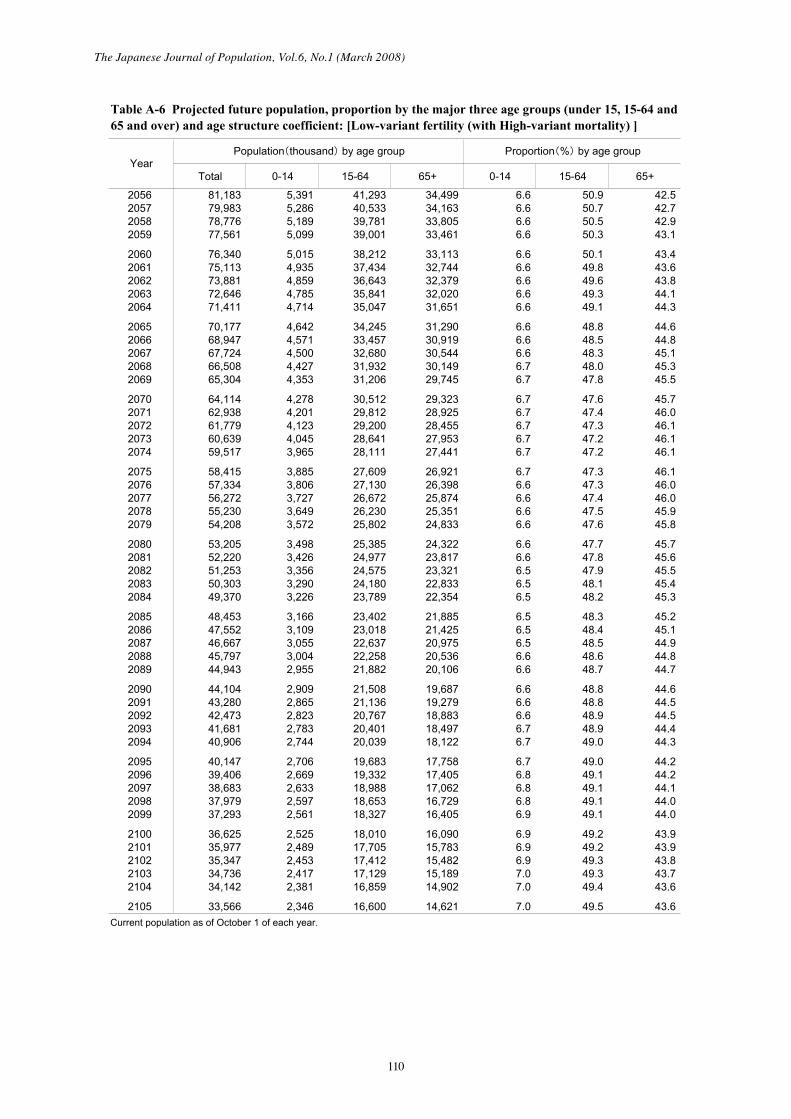
Table A-6 Projected future population, proportion by the major three age groups (under 15, 15-64 and65 and over) and age structure coefficient: [Low-variant fertility (with High-variant mortality) ]
YearPopulation thousand by age group Proportion % by age group
2105 33,566 2,346 16,600 14,621 7.0 49.5 43.6Current population as of October 1 of each year.
110
The Japanese Journal of Population, Vol.6, No.1 (March 2008)
111
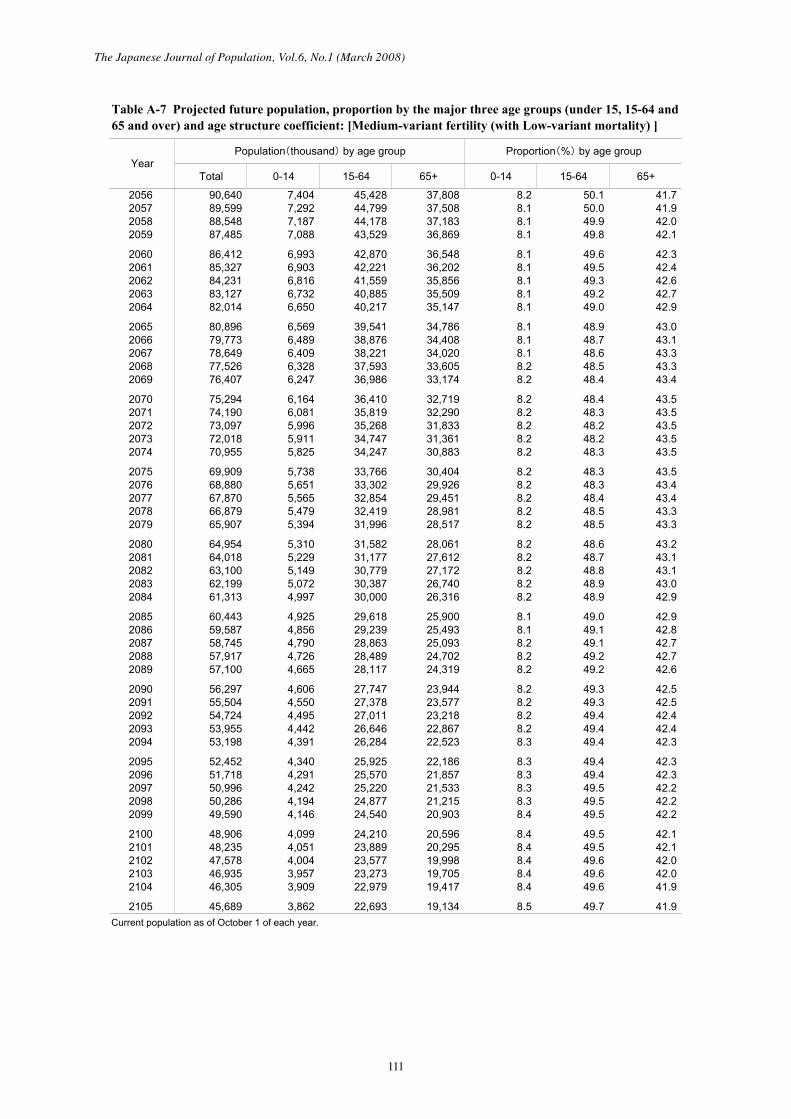
Table A-7 Projected future population, proportion by the major three age groups (under 15, 15-64 and65 and over) and age structure coefficient: [Medium-variant fertility (with Low-variant mortality) ]
YearPopulation thousand by age group Proportion % by age group
2105 45,689 3,862 22,693 19,134 8.5 49.7 41.9Current population as of October 1 of each year.
The Japanese Journal of Population, Vol.6, No.1 (March 2008)
112 113
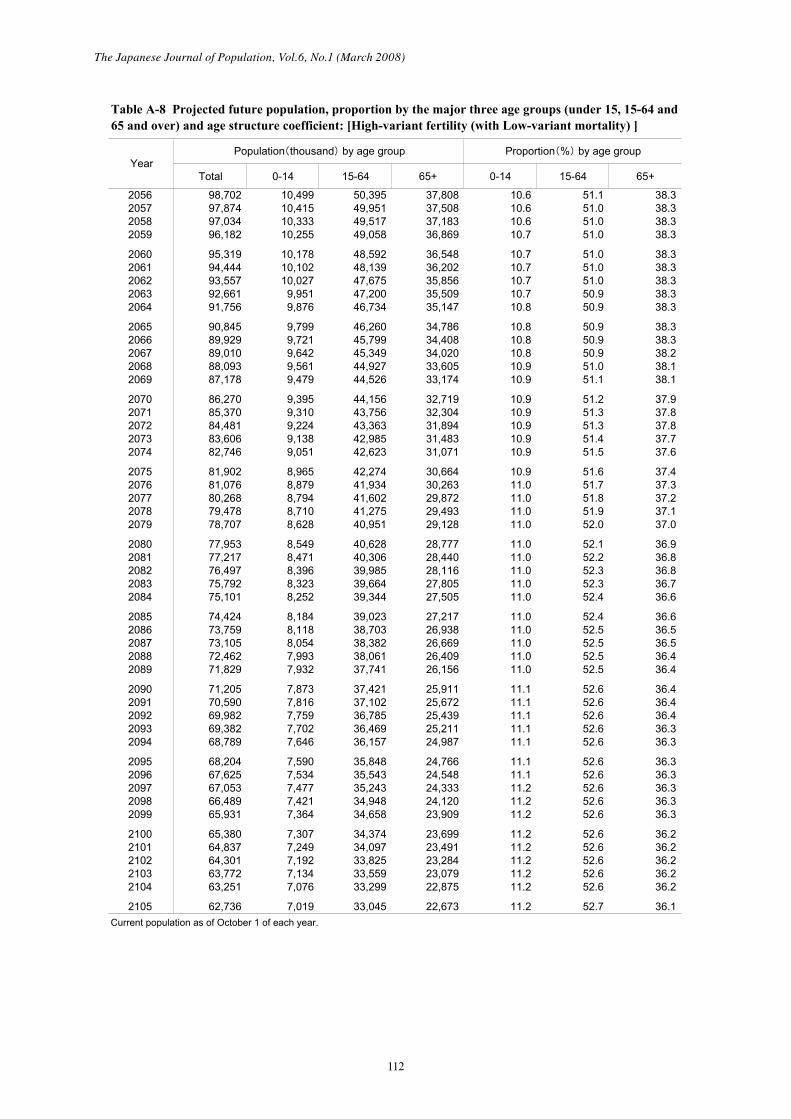
Table A-8 Projected future population, proportion by the major three age groups (under 15, 15-64 and65 and over) and age structure coefficient: [High-variant fertility (with Low-variant mortality) ]
YearPopulation thousand by age group Proportion % by age group
2105 62,736 7,019 33,045 22,673 11.2 52.7 36.1Current population as of October 1 of each year.
112
The Japanese Journal of Population, Vol.6, No.1 (March 2008)
113
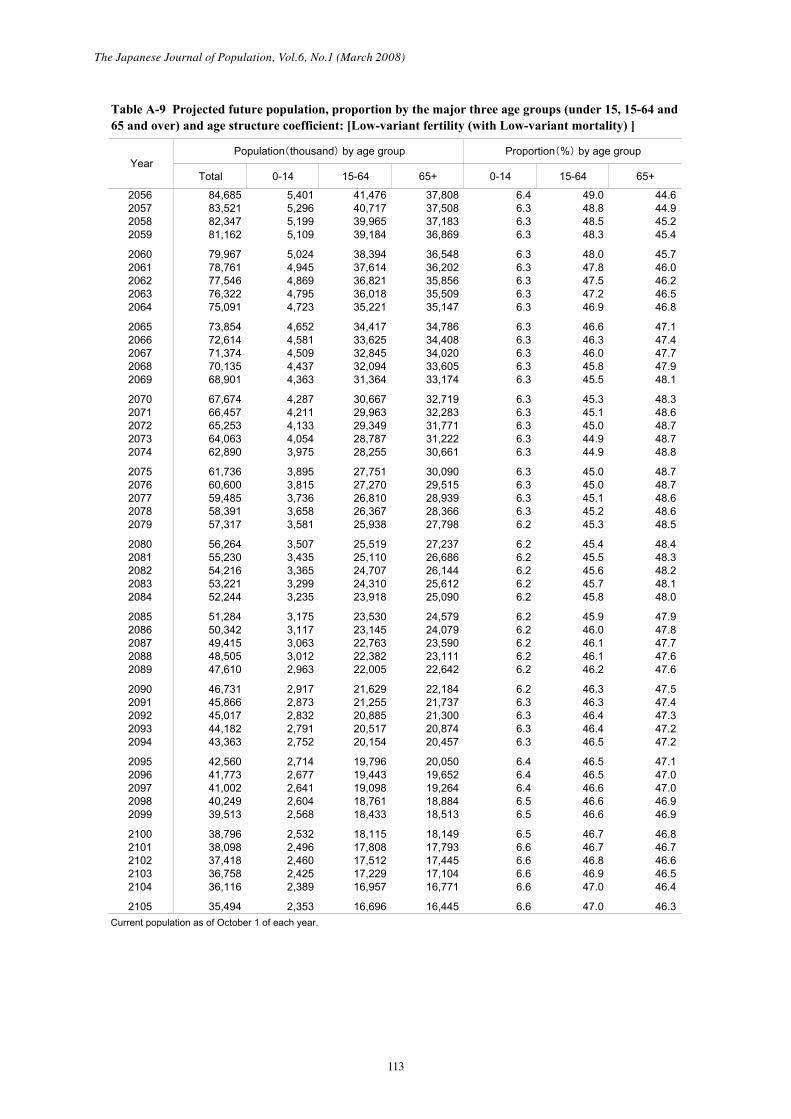
Table A-9 Projected future population, proportion by the major three age groups (under 15, 15-64 and65 and over) and age structure coefficient: [Low-variant fertility (with Low-variant mortality) ]
YearPopulation thousand by age group Proportion % by age group