+ All Categories
Home > Documents > Populations In the Rio Cruces Wetland, Chile Environmental ... · Environmental Processes, Water...

Populations In the Rio Cruces Wetland, Chile Environmental ... · Environmental Processes, Water...

Date post: 27-Oct-2018
Category:
Upload: hakhanh
View: 214 times
Download: 0 times
Share this document with a friend
15
See discussions, stats, and author profiles for this publication at: https://www.researchgate.net/publication/226793623 Environmental Processes, Water Quality Degradation, and Decline Of Waterbird Populations In the Rio Cruces Wetland, Chile Article in Wetlands · December 2008 DOI: 10.1672/07-119.1 CITATIONS 37 READS 259 6 authors, including: Some of the authors of this publication are also working on these related projects: Núcleo Milenio MUSELS View project Proyecto FONDECYT 1080023 (Regular). Natal tags, effective dispersal and population connectivity in Concholepas concholepas through the study of trace elemental composition on their statolith. View project Nelson A Lagos University Santo Tomás (Chile) 71 PUBLICATIONS 1,264 CITATIONS SEE PROFILE Cristian Duarte Universidad Andrés Bello 80 PUBLICATIONS 974 CITATIONS SEE PROFILE Heraldo Contreras Instituto de Fomento Pesquero (IFOP) 54 PUBLICATIONS 731 CITATIONS SEE PROFILE All content following this page was uploaded by Heraldo Contreras on 01 October 2015. The user has requested enhancement of the downloaded file.
Transcript

See discussions, stats, and author profiles for this publication at: https://www.researchgate.net/publication/226793623

Environmental Processes, Water Quality Degradation, and Decline Of Waterbird

Populations In the Rio Cruces Wetland, Chile

Article  in  Wetlands · December 2008

DOI: 10.1672/07-119.1

CITATIONS

37READS

259

6 authors, including:

Some of the authors of this publication are also working on these related projects:

Núcleo Milenio MUSELS View project

Proyecto FONDECYT 1080023 (Regular). Natal tags, effective dispersal and population connectivity in Concholepas concholepas through the study of trace elemental

composition on their statolith. View project

Nelson A Lagos

University Santo Tomás (Chile)

71 PUBLICATIONS   1,264 CITATIONS   

SEE PROFILE

Cristian Duarte

Universidad Andrés Bello

80 PUBLICATIONS   974 CITATIONS   

SEE PROFILE

Heraldo Contreras

Instituto de Fomento Pesquero (IFOP)

54 PUBLICATIONS   731 CITATIONS   

SEE PROFILE

All content following this page was uploaded by Heraldo Contreras on 01 October 2015.

The user has requested enhancement of the downloaded file.

BioOne sees sustainable scholarly publishing as an inherently collaborative enterprise connecting authors, nonprofit publishers, academic institutions, researchlibraries, and research funders in the common goal of maximizing access to critical research.

Environmental Processes, Water Quality Degradation, and Decline Of WaterbirdPopulations In the Rio Cruces Wetland, ChileAuthor(s): Nelson A. Lagos, Pedro Paolini, Eduardo Jaramillo, Charlotte Lovengreen, Cristian Duarte,and Heraldo ContrerasSource: Wetlands, 28(4):938-950.Published By: The Society of Wetland ScientistsDOI: http://dx.doi.org/10.1672/07-119.1URL: http://www.bioone.org/doi/full/10.1672/07-119.1

BioOne (www.bioone.org) is a nonprofit, online aggregation of core research in the biological, ecological, andenvironmental sciences. BioOne provides a sustainable online platform for over 170 journals and books publishedby nonprofit societies, associations, museums, institutions, and presses.

Your use of this PDF, the BioOne Web site, and all posted and associated content indicates your acceptance ofBioOne’s Terms of Use, available at www.bioone.org/page/terms_of_use.

Usage of BioOne content is strictly limited to personal, educational, and non-commercial use. Commercial inquiriesor rights and permissions requests should be directed to the individual publisher as copyright holder.

ENVIRONMENTAL PROCESSES, WATER QUALITY DEGRADATION, ANDDECLINE OF WATERBIRD POPULATIONS IN THE RIO CRUCES

WETLAND, CHILE

Nelson A. Lagos1, Pedro Paolini2, Eduardo Jaramillo3, Charlotte Lovengreen4, Cristian Duarte3, and

Heraldo Contreras3

1Centro de Investigacion en Ciencias Ambientales (CIENCIA-UST), Universidad Santo Tomas

Ejercito 146

Santiago, Chile 650449

E-mail: [email protected]

2Centro de Estudios Espaciales, Universidad de Chile

Tupper 2007

Santiago, Chile 8370451

3Instituto de Zoologıa

Facultad de Ciencias, Universidad Austral de Chile

Independencia 64

Valdivia, Chile 657

4Instituto de Fısica

Facultad de Ciencias, Universidad Austral de Chile

Independencia 64

Valdivia, Chile 657

Abstract: Changes in wetland ecosystems may result from the interactions of endogenous processes

with exogenous factors such as environmental fluctuations and anthropogenic influences. Since mid-

2004, the Rıo Cruces wetland, a Ramsar site located in southern Chile (40uS), exhibited a sudden increase

in mortality and emigration of the largest breeding population of Black-necked swans in the Neotropics,

a massive demise of the dominant macrophyte Egeria densa (the main food of swans and several aquatic

birds), and a seasonal appearance of turbid waters. We compared annual variation in rainfall, river flow,

and radiation over the period 2000–2005 to assess the role of environmental factors on these wetland

changes. Those factors, with the exception of a decrease in river flow during 2004, did not show

significant inter-annual differences. However, when comparing Landsat images, we found in the visible

and near-infrared spectrum, a corresponding increase and decrease in water reflectance for 2005 with

respect to 2003 and 2001, respectively. These results may reflect the appearance of turbid waters and the

decrease in cover of E. densa. All temporal changes were restricted to the northern and central zones of

the wetland. In addition, spatial analysis showed a gradient in turbidity across the wetland waters, which

was enhanced by estuarine influence during spring-tides. Censuses of aquatic birds (1999–2005) showed

that only herbivorous birds exhibited a pronounced decrease in population abundance after mid-2004,

while piscivorous birds continued normal cycling, with even some positive trends in abundance during

2004–2005. Population declines in herbivorous birds may be related to the demise of E. densa and

suspension of sediments during periods of reduced river flow (2004) that gave rise to the turbidity in the

wetland waters. Environmental changes could be related to changes in water quality after a new pulp

mill, built upstream of the wetland, initiated operations during February 2004.

Key Words: aquatic birds, Landsat image, macrophytes, Ramsar site

INTRODUCTION

Biotic and abiotic changes in wetland ecosystems

may emerge from complex interaction among

environmental processes (van Bodegom et al.

2004). In general, changes in rainfall patterns can

influence wetland hydrology by altering the timing

and amount of atmospheric and ground-water

inputs that may change water depth, solute concen-

trations, and temperature, all factors influencing

WETLANDS, Vol. 28, No. 4, December 2008, pp. 938–950’ 2008, The Society of Wetland Scientists

938

important biotic properties of wetlands (Wilson and

Keddy 1986, Gaudet and Keddy 1995, Weiher et al.

1996, Euliss et al. 2004). Additionally, water flow

interacts with aquatic plants and influences the

flushing of sediments and other chemical and

physical characteristics of the water column (Leo-

nard and Luther 1995, Rose and Crumpton 1996,

Oldham and Sturman 2001). Biotic components

associated with wetlands such as macrophytes

(Engelhardt and Ritchie 2001) and avian assemblag-

es (Jaksic 2004) are particularly sensitive to these

abiotic changes, and several studies have showed the

importance of interactions in animal and plant

assemblages associated with wetland waters (Wilson

and Keddy 1986, Gaudet and Keddy 1995, Weiher

et al. 1996). However, due to increased pressure

from human activities, the relative influences of

environmental processes must be separated from

anthropogenic influences in order to better under-

stand the ultimate causes of biotic and abiotic

changes in wetland ecosystems, and to implement

management and restoration strategies in human-

altered situations. However, disentangling environ-

mental from anthropogenic causes in wetland

changes is a major task that requires scientific

information based on precise and rigorous sampling

and experimental methodologies (Soto-Gamboa et

al. 2007, Palma et al. 2008), which is rarely available.

Alternatively, non-experimental approaches, such as

long-term monitoring of ecological systems become

useful tools for comparative studies designed to

assess spatial and temporal scales of ecological

patterns, and provide some clues about underlying

processes that cause ecosystem-level changes (Lagos

et al. 2005, Lagos et al. 2008).

The wetland of Rio Cruces, including Carlos

Anwandter Nature Sanctuary, is located near the

city of Valdivia in southern Chile (ca. 40uS,

Figure 1). It was formed in May 1961, after the

most intense earthquake ever recorded (9.5 on the

Richter scale, Cisternas et al. 2005) when an ocean

tsunami with a 10–15 m wave penetrated the

estuarine areas around Valdivia. Following the

subduction of an area of 4,877 ha, former agricul-

tural and forest lands were flooded to form a new

tidally influenced wetland ecosystem that was

colonized by a diversity of aquatic plants and water

birds (Ramırez et al. 1991, Schlatter et al. 1991,

2002). These ecological properties and their conser-

vation value were internationally recognized when

the wetland of Rio Cruces was designated as the first

Neotropical Wetland of International Importance

under the Ramsar Convention. However, since mid-

2004, the wetland has experienced sudden biotic

changes (Jaramillo et al. 2007) including: 1) mortal-

ity and massive emigration of aquatic birds,

particularly the herbivorous Black necked swan,

Cygnus melacoryphus Molina, which formerly used

this wetland as its main breeding site in the

Neotropical biogeographic region (Schlatter et al.

1991, 2002), 2) the massive disappearance of the

waterweed Egeria densa Planch, the dominant

submerged macrophyte of the ecosystem (Mulsow

and Grandjean 2006, Jaramillo et al. 2007, Soto-

Gamboa et al. 2007), and 3) the seasonal appearance

of turbid waters within the wetland during the

spring-summer season. The causes for these ecosys-

tem-level changes were unknown.

In spite of the ecological importance of Rio

Cruces wetland, no comprehensive ecological mon-

Figure 1. Geographic location of the Rıo Cruces

wetland. The shaded areas are shallow water zones

(swamps and marshes) that originated after the earth-

quake and tsunami of May 1960. NL and SL correspond

to the Northern and Southern Limits of the Carlos

Anwandter Nature Sanctuary. Numbers represent sam-

pling stations for water quality assessment during neap

and spring tides in March 2006. Dashed lines separate the

northern, central, and southern zones analyzed for

spectral reflectance profiles using Landsat images (see

Methods for details).

Lagos et al., RIO CRUCES WETLAND 939

itoring program was in place prior to the onset of

environmental changes in 2004. A study by Ramirez

et al. (1991) had described on the taxonomic status,

distribution, and abundance patterns of aquatic

macrophytes in the wetland. Schlatter et al. (1991,

2002) studied the reproductive behavior of Black

necked swans and the relationship between the

fluctuations of swan populations and environmental

processes. Post-2004 studies have focused on the

characterization of changes in the abiotic and biotic

components of this wetland. Woelfl et al. (2006)

investigated the concentration of heavy metals in

plant remains of E. densa concluding that high

concentrations of iron could explain its demise.

Similarly, Mulsow and Grandjean (2006) concluded

that a human-induced chemical disequilibrium in the

waters of the wetland caused the demise of E. densa

(but see Soto-Gamboa et al. 2007). As part of a large

integrative effort to evaluate the environmental

changes occurring within this Ramsar wetland site

(UACH 2005), it was postulated that alteration in

water quality occurred after a new pulp mill initiated

operations during February 2004. However, and due

to the lack of baseline scientific information, existing

studies did not permit the establishment of precise

cause-effect relationships concerning the ecosystem-

level changes observed in the wetland of Rio Cruces

(Palma et al. 2008). To remedy this situation, we

performed a comparative study designed to charac-

terize patterns of temporal and spatial variability in

processes operating at a hierarchy of spatial scales.

In particular, we worked 1) to identify patterns of

temporal variation in rainfall, water flow, and

radiation that operated at a regional scale and

might have been associated with the abiotic and

biotic changes observed in the wetland during 2004,

2) to characterize patterns of water reflectance using

analyses of Landsat images that might be associated

with spatial and temporal changes in water quality

and aquatic plant cover within the wetland waters,

3) at a more local scale, to characterize patterns of

spatial variation in water quality (turbidity and total

suspended solids) across the wetland, and finally 4)

to characterize intra-annual and long-term trends in

the abundances of aquatic bird populations. Our

study provides a synthesis of ecologically relevant

environmental processes operating in the region, and

is the first evaluation of changes in water quality of

the wetland waters combining field and remote

sensing data. Consequently, this information builds

the current state of knowledge of the wetland of Rio

Cruces that might be useful for ongoing efforts in

planning, monitoring, and restoration for this

threatened habitat.

METHODS

Study Area

The Rio Cruces originates in the pre-Andean

Cordillera of southern Chile (ca. 39–40uS). It moves

170 km from east to west until meeting the tidal

channel Cau Cau and the rivers Calle Calle andValdivia (Figure 1). A 30 km portion of the river

located north of the city of Valdivia corresponds to the

wetland of Rıo Cruces and Carlos Anwandter Nature

Sanctuary (Figure 1), and covers an area of 4,877 ha

including many floodplain areas inundated to depths

of almost 2 m. Most of the wetland is influenced by

tides coming from the estuaries of the rivers Calle Calle

and Valdivia. The wetland also receives inputs of freshwater from several tributaries (Nanihue, Cudico,

Pichoy, and Cayumapu Rivers; Figure 1).

Regional Environmental Processes

Periodic data collected between 2000 and 2005

from the climatological station located at the maincampus of Universidad Austral de Chile at Valdivia

were used to characterize inter-annual variability in

rainfall and photosynthetic active radiation (PAR)

in the study area. Solar radiation was measured with

a high resolution spectroradiometer (SUV-100, Bio-

spherical Instruments Inc., San Diego, CA, USA)

located on the roof (30 m above sea level) of the

Faculty of Sciences building. Solar irradiancebetween 290 and 600 nm (a resolution of 0.6 nm

wave band) was obtained in a daily scan lasting

15 minutes. During the scan a signal of PAR filter

(400–700 nm), which was placed on the integrating

sphere, was registered (see Huovinen et al. 2006).

Daily maximum values of PAR were extracted and

daily doses were calculated. We focus on the inter-

annual variation (2000–2005) of PAR due to itspotential impact on aquatic plant ecophysiology.

River flow was measured over the same period at

Rucaco station, located in the riparian area of the

Rio Cruces (ca. 25 km upstream from the northern

limit of the wetland, Figure 1).

Reflectance Data

One Landsat Thematic Mapper (TM) and two

Enhanced Thematic Mapper (ETM+) images with

Path/Row 233/88 of World Reference System 2

(WRS-2) with a central point near 40u199200 S,

72u519000 W were processed and analyzed (Table 1).

All images corresponded to relatively cloudless

days of the austral spring-summer period. Imageswere selected to contrast periods before and after

the environmental changes observed during 2004

940 WETLANDS, Volume 28, No. 4, 2008

(November 2001 and February 2003 versus February

2005). Although our focal year was 2004, no images

for spring-summer were available for that year. The

TM and ETM+ images were radiometrically cali-

brated and processed following equations and

parameters described by Chander and Markham

(2003). Briefly, digital numbers (DNs) of the image

data were converted to spectral radiance (Ll) values

in W/(m2?sr?mm units). Then, to compare images

collected on different dates and by different sensors,

Ll values were converted to top-of-atmosphere

reflectance (RTOA) percentages. Furthermore, an

atmospheric correction for Case-2 turbid waters

was applied using the path extraction method

(Hwan-Ahn et al. 2004) to account for absorption

and scattering effects on water reflectance arising

from diffusive radiation due to photons scattered by

air molecules and aerosols, in addition to that being

reflected at the water surface by total suspended

solids (TSS), chlorophyll, and colored dissolved

organic matter (CDOM). Basically, this correction

is focused on extracting the path radiance (Rpath)

from the RTOA signal by deleting the lowest radiance

values in that band from the entire image. Path

extraction assumes that in deep-blue waters the RTOA

signal is reduced to Rpath because those waters have

the lowest reflectance values (Antoine and Morel

1999), and that Rpath is spatially homogeneous over

the Landsat scene (see Hwan-Ahn et al. 2004 for

corresponding equations and parameters). Finally,

for each image, the value of reflectance was extracted

from the corresponding 1 to 4 Landsat bands. Bands

1 to 3 correspond to visible ranges (0.42–0.52 mm,

0.52–060 mm, and 0.63–0.69 mm), while band 4

correspond to the near-infrared range (NIR) (0.76–

0.90 mm). All image processing was performed using

ENVI 4.1 (ITT Industries Inc., Boulder, CO, USA).

Rio Cruces wetland waters could be categorized

into zones with different levels of change in water

quality (see also Mulsow and Grandjean 2006). We

selected three zones corresponding to the northern,

central, and southern sections of the Rio Cruces

wetland area (Figure 1), with spatial length of 15, 8,

and 6 km, respectively (Figure 1). Incidental obser-

vations suggest that after 2004 and during the spring-

summer season, brown colored waters occurred in

the northern and central zones, and intermittently in

the southern zone. This could result from estuarine

tidal influences upon wetland waters. In the northern

zone, reflectance values of the first four Landsat

bands were extracted at 630 points within the area of

the wetland waters. In the central and southern

zones, reflectance values were extracted at 245 and

157 points, respectively. This process was repeated

over each Landsat image and the corresponding

spectral profile (i.e., plot of averaged reflectance

versus Landsat bands) for each year and zone wasconstructed. As suggested by Parslow and Harris

(1990) and Penuelas et al. (1993), we used the blue/

green ratio (Landsat bands 1 and 2), as a proxy of

chlorophyll content in the water of the three zones

studied. However, for the 2001 and 2003 periods, this

surrogate measure did not distinguish between

phytoplankton and submerged plants such as E.

densa because both components were present simul-

taneously. For the 2005 image, the blue/green ratio in

the northern and central zones (under constant

presence of brown color waters) could be associated

either to phytoplankton or to absorption by CDOM

of water in the blue part of the spectrum. In addition,

differences in tidal stage at the hour of the image

acquisition may also influence the spectral properties

of the image (see Table 1).

Field Data

We measured water transparency with a Secchi

disk and took two surface water samples per station

to analyze concentrations of TSS (after Strickland

and Parsons 1972). To account for tidal effects on

horizontal water transparency distributions and

TSS, field samplings were carried out during spring

and neap tides (March 14 and March 29, 2006,

respectively). Sampling stations were situated as

evenly spaced as possible northwards along the Rio

Cruces and tributary rivers (Figure 1) with three

stations in the southern zone, two stations in the

central zone, and seven in the northern zone.

Waterbird Abundances

Monthly censuses carried out by the Corporacion

Nacional Forestal, Chile from January 1999 to

September 2005 were used to analyze long-term and

Table 1. Sensor, date information of the corresponding

Landsat images studied and hours of the tidal stage at the

time of the image acquisition. All images were acquired at

Cordoba Station, Argentina. UTC 5 Universal Time

Code. Tide hour state is referenced to the village of

Corral, located at the estuary mouth of Rio Valdivia.

Sensor Date – Hour

Tide

High – Low

Landsat7/

ETM+29-NOV-2001; 14:24 (UTC) 12:10–18:05

11:24 Summer Local Time

Landsat7/

ETM+20-FEB-2003; 14:24 (UTC) 15:49–09:44

11:24 Summer Local Time

Landsat5/TM 1-FEB-2005; 14:15 (UTC) 18:06–11:33

11:15 Summer Local Time

Lagos et al., RIO CRUCES WETLAND 941

intra-annual trends in population abundances of six

common waterbirds of the wetland. Three of them

were herbivorous: Cygnus melancoryphus (Black

necked swan), Fulica armillata Vieillot (Red gartered

coot), and F. leucoptera Vieillot (small coot), and

three were piscivorous: Ardea cocoi L. (Cocoi

Heron), Ardea alba Gmelin (Great white egret),

and Egretta thula Molina (Snowy egret).

Statistical Analyses

Pairwise comparisons and corresponding confi-

dence intervals for inter-annual differences in

rainfall, river flow, and PAR from 2000 to 2005

were assessed. Since the focal year was 2004, we

tested if the values of daily measure for those

environmental factors during this year were higher

or lower than those measured during the same days

in previous and subsequent years. We estimated the

inter-annual difference as Dt 5 variable(t 5 2004) 2

variable(t 5 year i); where variable(t 5 2004) represent

the value of the corresponding environmental

factor recorded at the day t of the year 2004 and

variable(t 5 year i) represent the value recorded in the

same day in the year i (with i being the years 2000,

2001, 2002, 2003, or 2005). Because of multiple

comparisons among years, the significance value

was corrected using a Bonferroni approximation. All

analyses were carried out using PROC GLM in SAS

System 9.0 (SAS Institute Inc., Cary, NC, USA).

Statistical significance of the temporal variations

in spectral reflectance profiles among years for each

wetland zone was assessed using ANOVA followed

by a Bonferroni multiple comparison test (PROC

GLM). We use reflectance data recorded in each

visible band and pooled them to characterize spatial

and temporal patterns of water reflectance that may

be associated with changes in water quality. We

predicted an increase in reflectance (from increased

turbidity) for the year 2005 in the northern and

central zones. To assess temporal changes in water

reflectance associated with changes in coverage of

submerged macrophytes, we compared reflectance

recorded in band 4 (NIR). In this case, we predicted

a decrease in reflectance (from decreased macro-

phytes coverage) for the year 2005 in the northern

and central zones of the wetland. We also tested for

inter-annual differences in the blue/green ratio for

each zone using ANOVA. In this case, we predicted

a decrease in ratio (less chlorophyll content in water)

for year 2005 across the whole study area. Tukey

post-hoc comparisons were used to establish the

rank of inter-annual differences in reflectance for

each Landsat band. We tested for normality of

residuals (Kolmogorov test) and for equal variance

(Barlett’s test), but did not find significant deviation

(P . 0.05) from basic ANOVA assumptions.

To describe spatial trends in water quality

parameters, a locally weighted scatter plot smooth-

ing (LOWESS; see Lagos et al. 2005) was fitted to

the spatial pattern in transparency and TSS as a

function of the relative distance from Rio Valdivia

(nearly 1 km south of station 1, Figure 1). This

process was repeated for several values of the f-

factor (or tension) to address the issue of how much

smoothing is allowed due to subjectivity in selection.

The f-factor selected was 0.5, indicating that 50% of

the data was used to predict the LOWESS trend at

the focal station. That factor produced normal

LOWESS residuals and independence from geo-

graphical distance (Kolmogorov-Smirnov tests, p .

0.05). The analyses of LOWESS fit were carried out

with MINITAB v13 (Minitab Inc., Pennsylvania,

USA). To understand the spatial scale of water

quality gradients under tidal influence, we estimated

the Moran’s I coefficients at five distance classes

(Legendre and Legendre 1998) covering the full

spatial extent of stations across the study area.

Under the null hypothesis of no spatial autocorre-

lation, the expected value of I is zero, while positive

and negative values, respectively, indicate positive and

negative spatial autocorrelation in water transparency

and TSS at the given distance class. The distance at

which Moran’s I value moves from positive to

negative values is regarded as the characteristic

spatial scale of the analyzed pattern (Lagos et al.

2005, 2008). Spatial autocorrelation analyses were

carried out using SAAP 4.3 (Wartenberg 1989).

Population abundance analysis of waterbirds was

based on the fitting of LOWESS trends as previ-

ously described, but in this case along time (Lagos et

al. 2005). We fitted the LOWESS along all time

periods to estimate the long-term trend (1999 to

2005) and trends within each year to estimate intra-

annual patterns. The correlation between raw

population abundance data and the LOWESS fit

was significant in all cases. One-way ANOVA was

used to evaluate differences in averaged population

abundances among years. Prior to the analyses, data

were log10(x + 1) transformed to meet ANOVA

assumptions.

RESULTS

Regional Environmental Processes

Over the period 2000–2005, rainfall was lowest in

2001 and highest in 2002 (Figure 2a). Mean annual

rainfall in 2004 did not differ significantly from the

annual means from 2000–2003 or 2005 (Table 2).

942 WETLANDS, Volume 28, No. 4, 2008

River flows were lowest during 2004 and highest

during 2002 (Figure 2b). Mean annual river flow in

2004 was significantly lower than flows in 2002 and

2005 (P , 0.001, Table 2). Annual means of

maximum PAR values recorded at Valdivia showed

an increasing trend until 2003 and then a drop

during 2004 and 2005 (Figure 2c), although these

inter-annual variations were not significant after

Bonferroni correction (P . 0.01, Table 2). Daily

PAR doses were greatest during 2001 and then

exhibited a decreasing trend until 2004 (Figure 2d),

although only 2001 and 2004 differed significantly

(Table 2).

Temporal Changes in Water Reflectance

As predicted, visible bands 2 and 3 in the northern

and central zones of the study area showed a

significant increase in reflectance in 2005 with

respect to those found in images from 2001 and

2003 (Figure 3 and Table 3A). On the contrary,

inter annual differences in reflectance patterns in the

southern zone were distinct for each band; no

statistical differences were found in inter-annual

variations in reflectance measured in band 3

(Figure 3, Table 3A). Pooling reflectance values

across visible bands highlight the increase in

reflectance in the 2005 image with respect to that

of 2003 and 2001, and in the northern and central

zones. On the other hand, in the southern zone,

differences in reflectance between the years 2005 and

2003 were significantly different, showing both years

had higher reflectance compared to 2001 (Table 3B).

In the northern and central zones, the NIR band

showed a significant increase in water reflectance

during 2003 with respect to the images of 2005 and

Figure 2. Temporal variation (annual mean 6 1 SD) for rainfall, river flow, and maximum and daily doses of PAR

radiation. Dashed lines and shaded areas correspond to the mean and standard deviation for each environmental variable

over the entire study period.

Lagos et al., RIO CRUCES WETLAND 943

2001. In the southern zone, differences between 2003

and 2005 did not reach statistical significance, but

both years had higher water reflectance as compared

to 2001 (Figure 3 and Table 3C).

Blue to green bands ratio, used as a proxy

measurement of chlorophyll content in the water,

showed that until 2003, high values occurred in the

northern zone with decreasing levels towards the

central and southern zones. During February 2005,

the three zones showed an inverse pattern of blue/

green ratios values (Figure 4). Results of ANOVA

indicated significant inter-annual differences in the

blue/green ratio in each zone (Table 3D). In

addition, the coefficient of variation in the blue/

green ratio was lower for the image of February

2005, suggesting a systematic decrease in spatial

variation in chlorophyll water content among

wetland zones (Figure 4).

Spatial Trends in Water Transparency and TSS

During the neap-tide, the distribution of water

transparency was very similar across most wetland

waters, with a maximum Secchi disk depth of ca.

150 cm. However, the southernmost station sampled

located at the Rio Valdivia had a Secchi disk depth

close to 220 cm (Figure 5a). During the neap-tide,

no significant spatial trend in TSS across stations

was observed (Figure 5c), and no significant spatial

gradient was evident in correlograms constructed for

transparency (Moran’s I 5 0.55, P 5 0.204,

Figure 5e) and TSS (Moran’s I 5 0.130, P 5

0.578, Figure 5g). In contrast, during the spring-tide

sampling period, a gradual decrease in water

transparency was observed as distance upstream of

the wetlands increased (Figure 5b). Concentrations

of TSS increased across the same gradient (Fig-

ure 5d). The spatial correlograms estimated for

samples gathered during the spring-tide period

showed that transparency (Moran’s I 5 20.92, P

, 0.001, Figure 5f) and TSS (Moran’s I 5 20.98, P

, 0.001, Figure 5h) exhibited significant spatial

structure, yielding positive spatial autocorrelation

values among stations located at short distances

classes (, 10 km) and a decrease to negative

autocorrelation as distance classes increased among

stations. Thus, stations located at distances , 10 km

were more similar in transparency and TSS than

expected by chance. Further, the spatial gradient in

water quality showed a characteristic spatial scale of

about 10 km (arrows in Figures 5f and 2h), which is

roughly the averaged spatial extent of the catego-

rized zones of the wetland (mean 6 1 SD 5 9.6 6

4.7 km, Figure 1) that was used for water reflectance

Table 2. Inter-annual pairwise comparisons in rainfall, river flow, and PAR recorded during the period 2000–2005. The

focal year was 2004 because it corresponded to the year when sudden environmental changes were observed in the wetland

of Rıo Cruces. Comparisons of PAR include only paired data available for January–February for 2005. D 5 averaged

pairwise difference, i.e., D 5 variable 20042variable year (t); SD5 standard deviation; CI 5 95% confidence interval of D; t 5

t-statistic for the null hypothesis Ho: D 5 0. Due to multiple comparisons, significance was assessed using a Bonferroni

approximation at P , 0.01 (in bold).

Variable Pairwise Comparison N D SD CI t P-value

Rainfall (mm/d) 2004–2000 365 20.68 20.7 (22.81 ; 1.44) 20.6 0.527

2004–2001 365 0.59 18.6 (21.32 ; 2.51) 0.6 0.542

2004–2002 365 21.85 21.0 (24.01 ; 0.31) 21.7 0.093

2004–2003 365 0.43 18.1 (21.43 ; 2.29) 0.5 0.648

2004–2005 365 20.90 18.8 (22.84 ; 1.04) 20.91 0.361

River flow (m3/s) 2004–2000 365 210.9 95.1 (220.7 ; 1.1) 22.19 0.030

2004–2001 365 213.1 105.8 (224.1 ; 2.3) 22.38 0.018

2004–2002 365 225.6 129.1 (238.9 ; 212.4) 23.8 , 0.001

2004–2003 365 27.6 69.6 (214.8 ; 20.5) 22.09 0.037

2004–2005 365 221.8 89.9 (231.1 ; 212.5) 24.61 , 0.001

PAR Maximum (mE/m2/s) 2004–2000 298 15.5 35.4 (254.1 ; 85.2) 0.4 0.661

2004–2001 359 217.1 30.2 (276.5 ; 42.4) 20.6 0.573

2004–2002 303 73.3 36.9 (0.7 ; 145.9) 2.0 0.048

2004–2003 362 254.1 30.8 (2114.7 ; 6.4) 21.8 0.080

2004–2005 59 36.7 50.5 (264.4 ; 137.8) 0.7 0.470

PAR daily doses (E/m2) 2004–2000 298 0.73 1.00 (21.24 ; 2.71) 0.7 0.464

2004–2001 359 21.23 0.87 (22.971 ; 0.516) 21.4 0.167

2004–2002 303 1.18 0.98 (20.743 ; 3.105) 1.2 0.228

2004–2003 362 20.91 0.84 (22.559 ; 0.738) 21.1 0.278

2004–2005 59 2.96 2.26 (21.57 ; 7.48) 1.3 0.196

944 WETLANDS, Volume 28, No. 4, 2008

assessment (see above). The water transparency and

TSS showed a positive and significant relationship

(Pearson r 5 0.67; P , 0.001; n 5 21), which did not

change during the neap tide (Pearson r 5 0.56; P ,

0.036) nor spring tide (Pearson r 5 0.86; P , 0.001)

periods.

Temporal Variability in Abundance of Waterbirds

Temporal trends (LOWESS) fitted to long-term

and intra-annual population abundances of herbivo-

rous and piscivorous waterbirds highlighted qualita-

tive and quantitative differences between both

functional groups (Figure 6). In general, long-term

trends of herbivorous species (Black necked swansand coots) showed abrupt changes from the first

trimester of 2004, declining to only a few hundred

individuals by 2005 (Figure 6). The results of

ANOVA show significant inter-annual differences in

population abundance for each of the three herbiv-

orous species (C. melancoryphus: F6,74 5 88.44, P ,

0.0001; F. armillata: F6,74 5 110.8, P , 0.0001; F.

leucoptera: F6,74 5 4.78, P , 0.0001), and Tukey

post-hoc comparisons show that lower population

abundances occurred during 2005 (Figure 6). On the

other hand, long-term trends in population abun-

dances of the piscivorous species (mostly herons)

remained almost unaltered over the study period.

Abundances of A. cocoi were higher in 2004 (F6,74) 5

2.41, P 5 0.035), but abundances of A. alba and E.

thula did not vary among years (P . 0.05).

DISCUSSION

Several studies have shown that environmental

variation can influence ecological community com-

position. Thus, wetland ecosystems are reactive to

environmentally driven changes affecting their

structure and function (Wilson and Keddy 1986,

Gaudet and Keddy 1995, Weiher et al. 1996).

However, in this study we found that, with the

exception of river flow, temporal variations in

environmental factors operating at regional scales

(UV radiation and PAR) were within the normal

historical conditions for the study area (see also

Huovinen et al. 2006).

Pezzato and Camargo (2004) found that in

Brazilian rivers gross photosynthesis of E. densa

was highest value of when underwater PAR was

895–1,126 mmol/m/s, and a positive relationship

existed between submersed PAR and photosynthetic

rate. Thus, we would expect a similar relationship in

the wetland of Rio Cruces and conclude that the

consistent temporal patterns in PAR variation over

the period 2000–2005 cannot explain the sudden and

massive die off of E. densa during mid-2004. On the

other hand, significant reductions in river flows,

such as those detected for the Rıo Cruces during

2004 may well influence the hydrological regime, a

recognized key driver in all wetland ecosystems

(Keddy and Fraser 2000, Mitsch and Gosselink

2000). A reduction in rainfall would exacerbate the

effects of reduced river flow. In that scenario,

discharge of wetland waters may dominate the

recharge process, altering hydroperiod, and in turn,

ecosystem functioning. Childers et al. (2006) report

that hydroperiods in estuarine wetlands decrease

during dry seasons associated with ENSO events,

and that large scale disruption may alter wetland

functioning. In southern Chile, the ENSO/Southern

Oscillation Index was negative from 2001 through

2005 indicating an extended period of dry conditions

Figure 3. Spectral reflectance profiles (mean 6 1 SD, not

visible due to minimal variation) for the three categorized

zones of the Rio Cruces wetland waters and for the years

of the Landsat images analyzed. Visible bands (1 to 3)

were used to test for inter-annual differences in reflectance

associated to changes in water transparency. NIR band (4)

was used to test for inter-annual differences in reflectance

associated with changes in aquatic submerged

macrophyte coverage.

Lagos et al., RIO CRUCES WETLAND 945

(NOAA Climate Prediction Center, www.cpc.ncep.

noaa.gov).

Remote sensing studies indicated that patterns of

spectral reflectance of waters were mainly associated

with changes in turbidity produced by TSS. In

general, low spectral reflectance was linked with

zones having relatively low concentrations of TSS

and vice versa. This was especially true for values

around 0.55 mm; at that wavelength region there is a

good match between upwelling radiance and TSS,

either in fresh or marine waters (Munday and

Zudkoff 1981). Additionally, a positive and quasi-

linear dependence is believed to exist between TSS in

the range of 0 to 50 mg?L21 and spectral responses

in the range of 0.4–0.9 mm (Curran and Novo 1988).

TSS levels in the waters of the Rıo Cruces wetland

were within this range suggesting a positive and

direct relationship with the spectral reflectance in

visible bands of the Landsat image. Our analyses of

Landsat images showed that during February 2005,

the wetland waters presented higher reflectance in

the visible range as compared to November 2001

Table 3. Results of one-way ANOVA and Tukey post hoc test analyses carried out to compare temporal variation in the

reflectance data for the three zones of the study area. Proximal analyses for turbidity compare reflectance among years

using separate (A) and pooled (B) visible Landsat bands. Reflectance by the aquatic submerged plants was assessed by

using near infrared bands (C) while water content of chlorophyll was estimated through the use of the blue/green ratio.

Due to the multiple comparisons in the Tukey test analyses, significant differences between years were corrected at the

indicated critical P value. Asterisks indicate rejection or acceptance of the underlying null hypothesis, in agreement with

our working hypotheses.

Feature

Analyzed Zone

Landsat

Band

DF

(Source, Error) MS F P-value

Tukey post hoc Test

(P critical , 0.0195)

(A) Turbidity (individual bands)

Northern 1 2, 1858 0.00955 2106.0 0.0001 2003 . 2005 . 2001

2 2, 1858 0.01726 1531.4 0.0001 2005 . 2003 . 2001*

3 2, 1858 0.01985 986.1 0.0001 2005 . 2003 . 2001*

Central 1 2, 732 0.00434 984.0 0.0001 2003 . 2005 . 2001

2 2, 732 0.00474 359.8 0.0001 2005 . 2003 . 2001*

3 2, 732 0.00653 278.2 0.0001 2005 . 2003 . 2001*

Southern 1 2, 468 0.00158 340.9 0.0001 2003 . 2005 . 2001

2 2, 468 0.00005 5.3 0.005 2005 5 2001 . 2003*

3 2, 468 0.00002 0.7 0.484 2005 5 2003 5 2001*

(B) Turbidity (pooled bands)

Northern 1, 2, 3 2, 5582 0.0371 1415.9 0.0001 2005 . 2003 . 2001*

Central 1, 2, 3 2, 2202 0.01265 334.9 0.0001 2005 . 2003 . 2001*

Southern 1, 2, 3 2, 1410 0.00040 8.5 0.0001 2005 5 2003 . 2001*

(C) Aquatic plant cover

Northern 4 2, 1858 0.00524 38.3 0.0001 2003 . 2005 5 2001*

Central 4 2, 732 0.01822 67.7 0.0001 2003 . 2005 . 2001*

Southern 4 2, 468 0.00338 8.3 0.0001 2003 5 2005 . 2001*

(D) Chlorophyll content in water

Northern 1/2 2, 1858 27.0807 1876.8 0.0001 2003 . 2005 5 2001*

Central 1/2 2, 732 6.1207 846.0 0.0001 2003 . 2005 . 2001*

Southern 1/2 2, 468 2.2749 558.5 0.0001 2003 . 2005 . 2001*

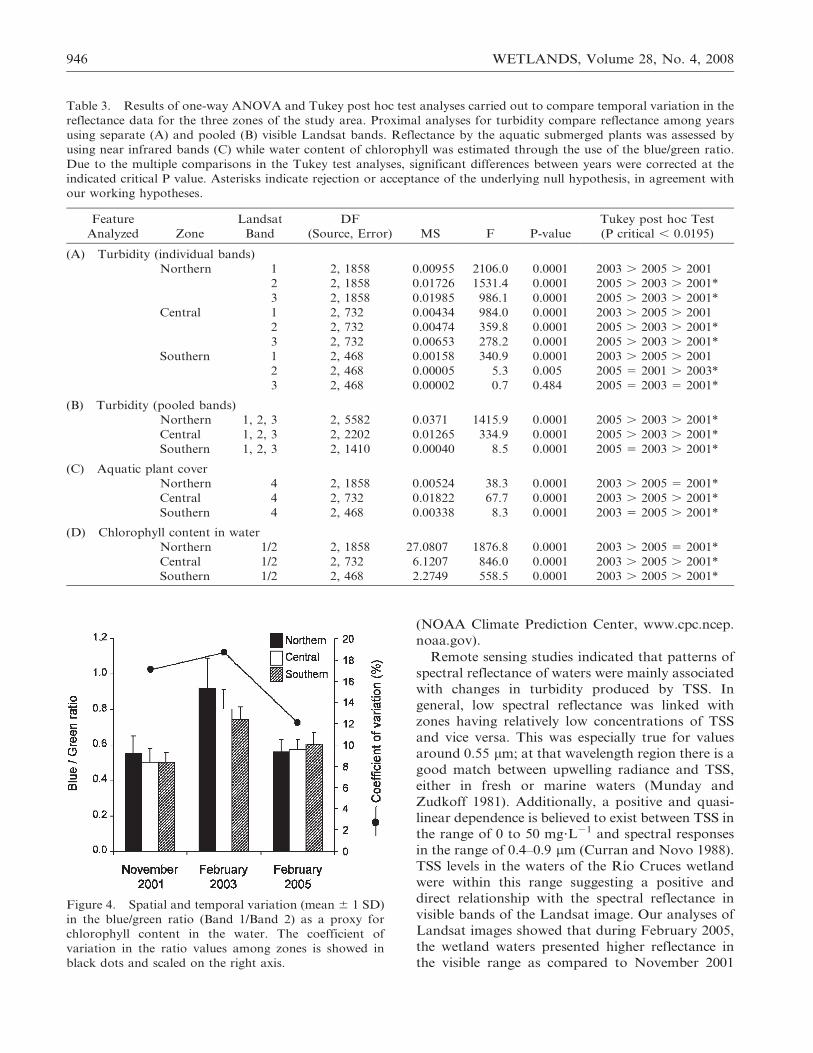
Figure 4. Spatial and temporal variation (mean 6 1 SD)

in the blue/green ratio (Band 1/Band 2) as a proxy for

chlorophyll content in the water. The coefficient of

variation in the ratio values among zones is showed in

black dots and scaled on the right axis.

946 WETLANDS, Volume 28, No. 4, 2008

and February 2003, which may correspond to the

increase in turbidity in the northern and central

zones due to a higher load of TSS (see also Jaramillo

et al. 2007).

Studies designed to characterize the spectral

properties of waters with variable phytoplankton

concentrations and aquatic macrophytes (e.g., Pe-nuelas et al. 1993) suggest that chlorophyll in water

is indicated by maximum spectral reflectance be-

tween 0.55 mm (green) and 0.70 mm (NIR) (Han

1997). Thus, lower reflectance at the NIR range

found in February 2005, as compared to 2003 and

2001, may be interpreted as a reduction in primary

productivity associated with the loss in cover of the

aquatic plant E. densa in the northern and central

zones of the Rıo Cruces wetland. However, theinfluence over the water reflectance by differences in

spectral sensitivity between Landsat 5 TM and

Figure 5. Spatial trends of transparency and concentrations of total suspended solids along the wetland of Rio Cruces

and tributary rivers. Panels on the left side correspond to the adjustment of the fitted LOWESS for transparency (a–b) and

total suspended solids (c–d) during the neap and spring tides of March 2006. Panels on the right side correspond to the

Moran’s I spatial correlograms for the corresponding variables (e–h); the values of Moran’s I index and significance for the

overall correlogram are shown. The arrows on the correlograms indicate the characteristic scale of the spatial gradient in

the distribution of transparency and total suspended solid across the area.

Lagos et al., RIO CRUCES WETLAND 947

Landsat 7 ETM for band 4 cannot be ruled out

(Teillet et al. 2007). Additionally, the values of the

blue/green algorithm (Parslow and Harris 1990)

used to estimate concentrations of chlorophyll in

this wetland, suggest a reduction of spatial hetero-geneity in environmental conditions across the area.

A decrease in primary productivity in the wetland of

Rio Cruces could be the result of a decrease in the

cover of E. densa and a corresponding replacement

by other suspended materials (see Jaramillo et al.

2007), which may include phytoplankton. However,

our remote sensing process cannot confirm this.Although changes may represent alternative stable

states operating in the aquatic ecosystem of Rio

Figure 6. Patterns of temporal variability in the population abundance of selected herbivorous and piscivorous birds

inhabiting the wetland of Rio Cruces. Dashed line 5 long-term trend; solid line 5 intra-annual trend for the corresponding

year. In all cases, trends correspond to a LOWESS fitted over the corresponding temporal scale. The arrows indicate the

start of discharges of the pulp mill effluent into the waters of Rio Cruces. r 5 Pearson correlation between raw data (black

dots) with the fitted values (lines) at the corresponding temporal scale. * P , 0.001; ** P , 0.0001.

948 WETLANDS, Volume 28, No. 4, 2008

Cruces, a lack of studies focused on temporal

variation of phytoplankton and macrophyte assem-

blages and their relative roles in productivity

preclude further interpretation.

Higher turbidity and higher loads of TSS within

the wetland (northern and central zones of the study

area) may be related to the massive reduction in

cover of E. densa, resulting in flushing of sediments

from shallow floodplain areas during periods of high

spring tides and low river levels. High turbidity and

changes in reflectance patterns remained localized

within the northern and central zones of the

wetland, while waters in the southern zone of the

study area, which were more affected by tidal

flushing, did not exhibit significant changes in terms

of reflectance patterns. Field and remote sensing

data analyzed in this study reveal that the current

state of water quality across the study area had a

spatially structured gradient, not evident in images

prior to 2004. Earlier, E. densa covered large

portions of the wetland, especially shallow areas

(Ramirez et al. 1991); this entrapped suspended

materials and improved water quality across the

wetland. The sudden disappearance of E. densa in

mid-2004 probably contributed to the deterioration

in water quality conditions of the wetland of Rio

Cruces and its continued absence may perpetuate

this state (Jaramillo et al 2007). During the austral

spring-summer seasons of 2004 to 2008, brown

colored waters have been observed moving down-

stream from the wetland and into clearer waters of

the southern zone, a situation reinforced by

simultaneous decreases in river flow (see www.

humedalriocruces.com). Finally, environmental

change could also be influenced by tidal stage.

Images for 2003 and 2005 were influenced by low

tide, while the image for 2001 was more influenced

by high tide (Table 1). As E. densa is a submerged

plant, water levels over plants may affect the

attenuation by water absorption in the NIR band

of 2001 image. High tide conditions might constrain

turbid water to the northern zone of the wetland.

However, spectral patterns were consistent for the

three images used, suggesting persistent clear water

and cover of macrophytes in the southern zone. As

such, differences in water reflectance found in this

study seem to be more determined by annual

differences in spectral properties of wetland water

rather than any influence of tidal stage.

Changes in the waterbird community were re-

stricted to herbivorous birds (swans and coot) that

foraged primarily on E. densa (Corti and Schlatter

2002). The lack of response by piscivorous herons

suggests that environmental changes in 2004 did not

propagate to all biotic components. This suggests

that herbivorous bird populations might rebound if

E. densa recovers.

Our study provides some clues about possible

causes for the observed biotic and abiotic changes

occurring in the Rio Cruces wetland. It is unlikely

that the massive die off of E. densa and the seasonal

presence of brown color waters after 2004 (Woelfl et

al. 2006, Jaramillo et al. 2007, Soto-Gamboa et al.

2007) resulted from regional environmental process

operating at spatial scales larger than the river basin.

On the contrary, our results indicate that environ-

mental changes were operating at smaller spatial

scales, within the wetland and only in the northern

and central zones. As far as we know, the only

process operating in that scale was the human-

induced change in water quality that occurred after a

pulp mill started operations in February 2004 and

introduced effluents into the Rio Cruces 25 km

upstream the wetland (UACH 2005, Mulsow and

Grandean 2006, Jaramillo et al. 2007, Soto-Gamboa

et al. 2007). On several occasions during 2004, pulp

mill effluents exceeded the authorized level of 50 mg/

L for suspended solids (see www.conama.cl and

www.e.seia.cl). In addition, large amounts of alumi-

num sulphate are used in the chemical treatment of

the liquid wastes of the pulp mill to coagulate

particles, and levels of sulphate and aluminum have

increased downstream of the mill (UACH 2005,

Mulsow and Grandjean 2006). However, more

studies, including spatio-temporal variability of

environmental factors and its interactions with

biological variables are needed to identify the

ultimate causes of ecosystem-level changes in the

Rio Cruces wetland. Such information will provide a

solid basis for future management and conservation

strategies to restore ecosystem services of this Ramsar

site in the Valdivian Forest of Southern Chile.

ACKNOWLEDGMENTS

This study was partially supported by the Comple-

mentary agreement Nu 1210-1203/2004 from the

Comision Nacional del Medio Ambiente to Universi-

dad Austral de Chile. Our sincere thanks to rangers of

Corporacion Nacional Forestal for providing census

data. We also gratefully acknowledge the editorial

assistance of Sarah Newbery and Matthew Lawrence

and two anonymous reviewers for their comments on

earlier drafts of the manuscript.

LITERATURE CITED

Ahn, Y. H., P. Shanmugam, and J. Hyung-Ryu. 2004.Atmospheric correction of the Landsat satellite imagery forturbid waters. Gayana 68:1–8.

Lagos et al., RIO CRUCES WETLAND 949

Antoine, D. and A. Morel. 1999. A multiple scattering algorithmfor atmospheric correction of remotely sensed ocean color(MERIS instrument): principle and implementation for atmo-spheres carrying various aerosols including absorbing ones.International Journal of Remote Sensing 20:1875–1916.

Chander, G. and B. Markham. 2003. Revised Landsat-5 TMradiometric calibration procedures and postcalibration dynam-ic ranges. IEEE Transactions on Geoscience and RemoteSensing 41:2674–77.

Childers, D., J. Boyer, S. Davis, C. Madden, D. Rudnick, and F.Sklar. 2006. Relating precipitation and water management tonutrient concentration patterns in the oligotrophic ‘‘upsidedown’’ estuaries of the Florida Everglades. Limnology andOceanography 51:602–16.

Cisternas, M., B. Atwater, F. Torrejon, Y. Sawai, G. Machuca,M. Lagos, A. Eipert, C. Youlton, I. Salgado, T. Kamataky, M.Shishikura, C. Rajendran, J. Malik, Y. Rizal, and M. Husni.2005. Predecessors of the giant 1960 Chile earthquake. Nature437:404–07.

Corti, P. and R. P. Schlatter. 2002. Feeding ecology of the black-necked swan Cygnus melancoryphus in two wetlands of southernChile. Studies on Neotropical Fauna and Environment 37:9–14.

Curran, P. J. and E. Novo. 1988. The relationship betweensuspended sediment concentration and remotely sensed spectralradiance: a review. Journal of Coastal Research 4:351–68.

Engelhardt, K. and M. Ritchie. 2001. Effects of macrophytespecies richness on wetland ecosystem functioning and services.Nature 411:687–89.

Euliss, N., J. LaBaugh, L. Fredrickson, D. Mushet, M. Laubhan,G. Swanson, T. Winter, D. Rosenberry, and R. Nelson. 2004.The wetland continuum: a conceptual framework for inter-preting biological studies. Wetlands 24:448–58.

Gaudet, C. L. and P. A. Keddy. 1995. Competitive performanceand species distribution in shoreline plant communities: acomparative approach. Ecology 76:280–91.

Han, L. 1997. Spectral reflectance with varying suspendedsediment concentrations in clear and algal-laden waters.Photogrammetric Engineering and Remote Sensing 63:701–05.

Huovinen, P., I. Gomez, and C. Lovengreen. 2006. A five-yearstudy of solar ultraviolet radiation in southern Chile (39uS):potential impact on physiology of coastal marine algae?Photochemistry and Photobiology 82:515–22.

Jaksic, F. 2004. El Nino effects on avian ecology: lesson learnedfrom the southeastern Pacific. Ornitologia Neotropical 15:61–72.

Jaramillo, E., R. Schlatter, H. Contreras, C. Duarte, N. Lagos, E.Paredes, J. Ulloa, G. Valenzuela, B. Peruzzo, and R. Silva.2007. Emigration and mortality of black-necked swans (Cygnusmelancoryphus) and disappearance of the macrophyte Egeriadensa in a Ramsar wetland site of southern Chile. Ambio36:607–10.

Keddy, P. and L. H. Fraser. 2000. Four general principles for themanagement and conservation of wetlands in large lakes: therole of water levels, nutrients, competitive hierarchies andcentrifugal organization. Lakes and Reservoirs: Research andManagement 5:177–85.

Lagos, N. A., B. Broitman, and J. C. Castilla. 2008. Environ-mental spatial correlates of intertidal recruitment: a test usingbarnacles in northern Chile. Ecological Monographs 78:245–61.

Lagos, N. A., S. Navarrete, F. Veliz, A. Masuero, and J. C.Castilla. 2005. Meso-scale spatial variation in settlement andrecruitment of intertidal barnacles along the coast of centralChile. Marine Ecology Progress Series 290:165–78.

Leonard, L. and M. Luther. 1995. Flow hydrodynamics in tidalmarsh canopies. Limnology and Oceanography 40:1474–84.

Mitsch, W. and J. Gosselink. 2000. Wetlands, third edition. JohnWiley & Sons, Inc., New York, NY, USA.

Mulsow, S. and M. Grandjean. 2006. Incompatibility of sulphatecompounds and soluble bicarbonate salts in the Rıo Cruceswaters: an answer to the disappearance of Egeria densa andblack-necked swans in a Ramsar sanctuary. Ethics in Scienceand Environmental Politics 2006:5–11.

Munday, J. and P. Zudkoff. 1981. Remote sensing of dinoflagel-lates bloom in a turbid estuary. Photogrammetry Enginneringand Remote Sensing 47:523–31.

Oldham, C. E. and J. Sturman. 2001. The effect of emergentvegetation on convective flushing in shallow wetlands: exper-iments and scaling. Limnology and Oceanography 46:1486–93.

Palma, A. T., M. G. Silva, C. Munoz, C. Cartes, and F. Jaksic.2008. Effect of prolonged exposition to mill pulp effluent on theinvasive aquatic plant Egeria densa and other primaryproducers: a mesocosm approach. Environmental Toxicologyand Chemistry 27:387–96.

Parslow, J. S. and G. Harris. 1990. Remote sensing of marinephotosynthesis. p. 269–90. In R. J. Hobbs and H. A. Mooney(eds.) Remote Sensing of Biosphere Functioning. Springer-Verlag, New York, NY, USA.

Pezzato, M. and A. Camargo. 2004. Photosynthetic rate of theaquatic macrophyte Egeria densa Planch (Hydrocharitaceae) intwo rivers from the Itanhaem River Basin in Sao Paulo State.Brazilian Archive of Biology and Techology 47:153–62.

Ramırez, C., C. San Martın, R. Medina, and D. Contreras. 1991.Estudio de la flora hidrofila del Santuario de la Naturaleza‘‘Rıo Cruces’’. Gayana Botanica 48:67–80.

Rose, C. and W. Crumpton. 1996. Effects of emergentmacrophytes on dissolved oxygen dynamics in a prairie potholewetland. Wetlands 16:495–502.

Schlatter, R., R. Navarro, and P. Corti. 2002. Effects of El NinoSouthern Oscillation on numbers of Black-necked swans at RıoCruces Sanctuary, Chile. Waterbirds 25:114–22.

Schlatter, R., J. Salazar, A. Villa, and J. Meza. 1991.Reproductive biology of Black-necked swans Cygnus melancor-yphus in three Chilean wetland areas. In J. Sears and J. Baco(eds.). Proceedings of the Third IWRB International SwanSymposium. Wildfowl Supplement 1:268–71.

Soto-Gamboa, M., N. A. Lagos, E. Quiroz, E. Jaramillo, R.Nespolo, and A. Casanova-Katny. 2007. Causes of thedisappearance of the aquatic plant Egeria densa and black-necked swans in a Ramsar sanctuary: comment on Mulsow andGrandjean (2006). Ethics in Science and Environmental Politics2007:7–10.

Strickland, J. D. H. and T. R. Parsons. 1972. A PracticalHandbook of Seawater Analysis. Bulletin No. 167, secondedition, Fisheries Research Board of Canada, Ottawa, Canada.

Teillet, P. M., G. Fedosejevs, K. J. Thome, and J. L. Barker.2007. Impacts of spectral band difference effects on radiometriccross-calibration between satellite sensors in the solar-reflectivespectral domain. Remote Sensing of Environment 110:393–409.

UACH. 2005. Estudio sobre origen de mortalidades y disminu-cion de aves acuaticas en el Santuario de la Naturaleza CarlosAnwandter, en la provincia de Valdivia, Chile. Final Reportavailable at: http://www.sinia.cl/1292/article-31832.html.

van Bodegom, P., C. Bakker, and H. D. van der Gon. 2004.Identifying key issues in environmental wetland research usingscaling and uncertainty analysis. Regional EnvironmentalChange 4:100–06.

Wartenberg, D. 1989. SAAP 4.3: Spatial AutocorrelationAnalyses Program. Exter Software, New York, NY, USA.

Weiher, E., I. Wisheu, P. Keddy, and D. Moore. 1996.Establishment, persistence, and management implications ofexperimental wetland plant communities. Wetlands 16:208–18.

Wilson, S. D. and P. Keddy. 1986. Species competitive ability andposition along a natural stress/disturbance gradient. Ecology67:1236–42.

Woelfl, S., M. Mages, F. Encina, and F. Bravo. 2006. Tracemetals in microcrustaceans and brazilian waterweed from acontaminated Chilean wetland using total reflection X-rayfluorescence spectrometry. Microchimica Acta 154:261–68.

Manuscript received 26 June 2007; accepted 3 June 2008.

950 WETLANDS, Volume 28, No. 4, 2008

View publication statsView publication stats


Recommended