Populism: Demand and Supply * L. Guiso † H. Herrera ‡ M. Morelli § T. Sonno ¶ November 25, 2018 Abstract Using individual data on voting and political parties manifestos in European coun- tries, we empirically characterize the drivers of voting for populist parties (the demand side) as well as the presence of populist parties (the supply side). We show that the economic insecurity drivers of the demand of populism are significant, especially when considering the key interactions with turnout incentives, neglected in previous studies. Once turnout effects are taken into account, economic insecurity drives consensus to populist policies directly and through indirect negative effects on trust and attitudes towards immigrants. On the supply side, populist parties are more likely to emerge when countries are faced with a systemic crisis of economic security. The orientation choice of populist parties, i.e., whether they arise on left or right of the political spec- trum, is determined by the availability of political space. The typical mainstream parties response is to reduce the distance of their platform from that of successful populist entrants, amplifying the aggregate supply of populist policies. Keywords: turnout, short term protection, anti-elite rhetoric, populist entry. JEL codes: D72, D78 * Luigi Guiso and Massimo Morelli wish to thank the Italian Ministry of Research (MIUR) for the PRIN funding 2016; Massimo Morelli also wishes to thank the Dondena and Igier research centers and the European Research Council, advanced grant 694583. We thank Tito Boeri, Torun Dewan, Giunia Gatta, Gloria Gennaro, Tommaso Giommoni, Simona Grassi, Sergei Guriev, John Huber, Thomas Koenig, Alex Lenk, Yotam Margolit, Nelson Mesker, Moritz Osnabruegge, Marco Ottaviani, Gerard Padr´o i Miquel, Daniele Paserman, Paola Profeta, Guido Tabellini, Stephane Wolton and Matia Vannoni for useful comments. We are grateful for their comments to participants in seminars at Queen Mary, Banco de Espa˜ na, Barcelona Forum, Bologna, University of York, Harvard University, Brown University, Ecole Polytechnique, Toulouse School of Economics, Toulouse Institute for Advanced Studies, the 2017 Lisbon Meeting of the European Economic Association, and the 2017 NBER Summer Institute. The usual disclaimer applies. † Einaudi Institute for Economics and Finance, and CEPR ‡ Warwick University, and CEPR § Bocconi University, IGIER, and CEPR ¶ University of Bologna, and CEP 1
Transcript
Populism: Demand and Supply ∗
L. Guiso† H. Herrera ‡ M. Morelli§ T. Sonno¶
November 25, 2018
Abstract
Using individual data on voting and political parties manifestos in European coun-tries, we empirically characterize the drivers of voting for populist parties (the demandside) as well as the presence of populist parties (the supply side). We show that theeconomic insecurity drivers of the demand of populism are significant, especially whenconsidering the key interactions with turnout incentives, neglected in previous studies.Once turnout effects are taken into account, economic insecurity drives consensus topopulist policies directly and through indirect negative effects on trust and attitudestowards immigrants. On the supply side, populist parties are more likely to emergewhen countries are faced with a systemic crisis of economic security. The orientationchoice of populist parties, i.e., whether they arise on left or right of the political spec-trum, is determined by the availability of political space. The typical mainstreamparties response is to reduce the distance of their platform from that of successfulpopulist entrants, amplifying the aggregate supply of populist policies.
Keywords: turnout, short term protection, anti-elite rhetoric, populist entry.JEL codes: D72, D78
∗Luigi Guiso and Massimo Morelli wish to thank the Italian Ministry of Research (MIUR) for the PRIN funding 2016; Massimo
Morelli also wishes to thank the Dondena and Igier research centers and the European Research Council, advanced grant 694583. We
thank Tito Boeri, Torun Dewan, Giunia Gatta, Gloria Gennaro, Tommaso Giommoni, Simona Grassi, Sergei Guriev, John Huber,
Thomas Koenig, Alex Lenk, Yotam Margolit, Nelson Mesker, Moritz Osnabruegge, Marco Ottaviani, Gerard Padro i Miquel, Daniele
Paserman, Paola Profeta, Guido Tabellini, Stephane Wolton and Matia Vannoni for useful comments. We are grateful for their
comments to participants in seminars at Queen Mary, Banco de Espana, Barcelona Forum, Bologna, University of York, Harvard
University, Brown University, Ecole Polytechnique, Toulouse School of Economics, Toulouse Institute for Advanced Studies, the 2017
Lisbon Meeting of the European Economic Association, and the 2017 NBER Summer Institute. The usual disclaimer applies.
†Einaudi Institute for Economics and Finance, and CEPR
‡Warwick University, and CEPR
§Bocconi University, IGIER, and CEPR
¶University of Bologna, and CEP
1
1 Introduction
On both sides of the Atlantic, the Western world is facing an unprecedented wave of
populist politics and populist rhetoric.1 Some countries have seen mounting protest
against inequality and capitalist institutions, leading to left-leaning policy demands
matched by similarly oriented populist supply; in others, right-wing populist move-
ments have found increasing support for protecting the country from immigrants and
globalization. Protectionism against immigrants and free trade is also featured in the
policy positions of the Trump administration in US and post-Brexit UK. In South-
ern Europe, the Italian Five Stars movement and the Greek and Spanish populist
movements call for a guaranteed minimum income and other forms of short-term
economic protection, in opposition to the European imposition of fiscal discipline –
what we might call Mediterranean populism. In continental Europe, populist move-
ments stress protection from immigrants (often linking them with Islamic terrorism)
and from Chinese imports. Overall, nationalism and closure to immigration are on
the rise. Why is there such a rising tide of consensus for populist proposals now
and why here - i.e. with a clear time and geographical pattern? What is driving
the simultaneous shift towards populism in so many countries? Is this a global shift
in voters’ preferences, attitudes or emotions, immediately captured by new political
leaders who enter politics? And if so, what is driving this global shift of demand? Is
it related to economic crisis or stagnation and, if so, through what channels?
This paper provides an empirical analysis of the channels through which economic
insecurity affected the demand and supply of populist policies. We believe that in
order to tackle these questions and garner a better understanding of the phenomena,
we need to abstract from the many observable differences in the existing strands of
populism and focus instead on what is common to all populist movements. We argue
that populist movements, regardless of political orientation, all share a number of
underlying common features. Focusing on these enables us to zoom in on the key
drivers of the populist wave.
1Google Trends shows an astonishing spike in the number of searches for the word populism,which quadrupled in the fall of 2016.
2
For our empirical study we will use the definition of populist parties proposed by
Van Kessel (2015) and widely accepted in the recent political science literature (see
the discussion in section 4). A consistent working definition of populism could be “a
political narrative that antagonizes the people and the corrupt elite, and that aims
for policies that reflect the will and are understood by the people” (Mudde, 2004).2
Another consistent definition of populism that turns out to be very useful is the
one offered in the Encyclopedia: populists claim to promote the interest of common
citizens against the elites; they pander to people’s fears and enthusiasms; and they
promote policies without regard to the long-term or indirect consequences.3 This
broad definition of populism highlights three important components: (1) the claim
to be on the side of the people against the elite – which we label “supply rhetoric;” (2)
the “fears or enthusiasms” of people – the demand conditions to which the populists
pander; and (3) the disregard for longer-term consequences. The first component
of anti-elite rhetoric is well recognized in the political science literature as the key
identifying feature of populist parties, whereas the second and third component of
the encyclopedia definition, which can be summarized with the synthetic term “short
term protection”, refer to policy platform characteristics that are observed in most
populist party manifestos, but have never been studied before as a supply response
given voters’ demand. One of the goals of this paper is indeed to show how the
short term protection policy complements rationally the anti-elite supply rhetoric,
and to show how this complementarity helps understand the political times we are
living. The supply of protection strategy encompasses both nationalist populism
2Donald Trump’s inauguration speech reads “...we are transferring power from Washington D.C.and giving it back to you, the people. For too long, a small group in our nation’s Capital has reapedthe rewards of government while the people have borne the cost. Washington flourished – but thepeople did not share in its wealth. Politicians prospered – but the jobs left, and the factories closed.The establishment protected itself, but not the citizens of our country...”. The anti-elite and antiestablishment rhetoric, as well as the concept of "the people" as a uniform body, which accordingto political scientists distinctly characterizes populist parties, is easily spotted and measured inobservable speeches. Given the scope and nature of our empirical study, we do not engage in thispaper the rich political theory literature on the definition of populism. We rather limit ourselvesto the definitions that are operationalizable in data analysis. Future work could attempt to studyempirically some important aspects of the political theory debate, e.g. the one on the relationshipbetween populism and pluralism – Muller (2016).
3Encyclopedia Britannica 2015: www.britannica.com/topic/populism
3
(emphasizing fear or enthusiasm regarding the protection of identity), and economic
populism (proposing redistributive policies such as minimum income, regardless of
costs). Thus, when we say that a populist party offers short-term protection we
intend to include both possibilities.
In order to understand the complementary role of the various components of
populists’ strategies, the most important first step is understanding voters’ demand
side. Analyzing the demand side and the supply side together will yield a richer
answer to the questions laid out above. We will see that populist parties are more
likely to emerge and prosper when a country has to deal with a crisis of systemic
economic security that the traditional incumbent parties (whether left-leaning, rely-
ing on government-based policies, or right-leaning, relying on markets) find it hard
to address, so that their voters lose faith in them. The 21st-century crisis (charac-
terized by the external threats of globalization and migration as well as widespread
financial crisis) undermined citizens’ confidence in both leftist (government-based)
policies and rightist (market-based) policies that respect the institutional constraints
and functioning of politics.4 Previous crises, which basically resulted in the failure of
only one side, simply generated political cycles, and did not leave space for the emer-
gence of populist platforms. Instead, at a time in which the crisis is two-sided, there
is room for new movements and transformation of existing opposition movements in
the direction of urging removal of constraining institutions.5
A key aspect of our analysis is highlighting the important role of abstention and
turnout incentives. A negative economic security shock that affects a citizen at a time
when both left and right traditional recipes are perceived as ineffective, depresses the
motivation to vote for traditional parties of both left and right; the disappointment
generates an abstention-based entry space for a populist platform, which may be
followed by a successful increase in consensus to populist parties. The figure lends
support to this sequence. It shows a pattern familiar to several European countries:
the economic crisis followed by voter apathy and disaffection with traditional parties,
4For a discussion of the specific features of the great recession, see Judis (2016).5Various forms of exit, rejection of international treaties previously subscribed, construction of
walls, and so on, are just examples of simple protection proposals that have traction today butwould not have attracted votes in other decades.
4
which in turn opened the space for entry of new populist parties or greatly magnified
the vote share of existing ones. In the paper we will offer evidence that is consistent
with this chain: economic insecurity causes faith in traditional parties to diminish,
inducing disillusioned voters to abstain; in turn, economic insecurity and disillusion
attract populist platforms offering short term protection.
[FIGURE 1 HERE]
Our framework suggests a number of testable hypotheses on both the demand
side (voter behavior) and the supply side (the appearance and political stance of
populist parties and the non-populist reaction). First, on the demand side, the
people most severely affected by the crisis, currently or in expectation, - those
facing the greatest economic insecurity - should be the most prone to abstain and
to shift to the populist party when it appears. Second, abstention and the shift to
populism should be more common among those with least trust in traditional parties,
politics and institutions, who are the most vulnerable to the manipulation of beliefs
by populist rhetoric. Third, mistrust and various negative attitudes - e.g. hostility
to immigrants - could themselves be endogenous to the crisis. That is, mistrust
and anti-immigrant attitudes may not be autonomous, cultural drivers of voting
behavior but channels through which the economic insecurity brought by the crisis
affects abstention and voting. Fourth, on the supply side, populist parties should be
more likely to be present when and where disappointment with traditional parties
is greatest - i.e. when and where the effects of economic insecurity are broadest;
and less likely where national characteristics make entering with a populist platform
more costly. We predict that the orientation of a new populist entrant (left or right)
will be related to the relative entry space on the two sides of the political spectrum
and the relative effectiveness of right-oriented or left-oriented rhetoric.
Our empirical analysis confirms these hypotheses on demand and supply, and
delivers several other, more nuanced results.
We first study the determinants of the demand for populist platforms in the coun-
tries covered by the European Social Survey. Our empirical examination emphasizes
accounting for selection issues, including endogenous entry of populist parties, which
5
other studies of populist voting typically ignore. We show that adverse shocks to
economic security and trust in political parties induce people not to vote and, if
they do, to choose a populist party. Ignoring the voter participation decisions not
only biases the estimates of the drivers of the voting choice and underestimates the
underlying demand for populist parties, but obscures the mechanism by which the
disappointment induced by the crisis favors the populist vote.
A simultaneous Heckprobit estimation of the probability of participation and of a
populist vote shows that economic insecurity has a statistically and economically sig-
nificant direct effect, and trust in political parties and attitudes toward immigrants
matter as well. Importantly, negative shocks to economic security and trust increase
the vote share of populist parties almost exclusively because they kill the incentive of
supporters of mainstream parties to participate in elections. On the other end, more
immigrant-averse attitudes have a mild effect through reduced participation but a
very large effect by switching voters preference from traditional to populist parties.
Moreover, building a pseudo-panel from the individual data we show that the trust
and immigrant attitude variables are themselves affected causally by shocks to eco-
nomic insecurity.6 Thus, we find a large total effect (direct plus indirect) of economic
insecurity on the demand for populism. This suggests that cultural attitudes are an
important channel through which economic insecurity affects populist support, but
probably not an independent cause.
On the supply side we document that the presence of populist parties in the
political arena is powerfully affected by economic insecurity and discouraged by the
presence of strong non-aligned parties, which undercuts anti-elite rhetoric and so in-
creases the cost of entry. We also show that populist parties choose their orientation
strategically, leaning left or right depending on the relative salience of left-type or
right-type cleavages weighted with the share of left-leaning and right-leaning vot-
ers. We find that the successful entry of a populist party changes the subsequent
electoral competition, prompting the established parties to adapt their platforms to
6Our finding that an economic insecurity shock significantly affects the attitudes towards im-migrants may be due to any mix of rational updating (i.e., some people may rationally expect ahigher risk of substitution) and behavioral external-blaming reactions (see e.g. the recent paper byGlaeser and Ponzetto, 2017, on the psychological tendency to focus on visible categories).
6
populist concerns, lending support to our idea that the supply of disinformation and
anti-elite rhetoric make it difficult to conduct a credible contrarian, anti-populist
campaign. In the end, the traditional parties’ attempt to contain populist success is
an adaptive reaction. Beside entry and orientation, the analysis of the supply side
will revolve around the importance of the short term protection nature of the policy
platforms, which we will show to be strongly complementary to the anti-elite rhetoric
component.
The paper is organized as follows. In the next section we review the recent litera-
ture on the positive analysis of populism. Next, we outline an empirical model of the
demand and supply of populism, list empirical predictions and discuss identification
issues. Section 4 discusses the data. Section 5 presents the empirical results on the
demand side, and Section 6 those on the supply side. Section 7 concludes.
2 Related Literature
The positive analysis of populism has focused on the institutional pre-conditions
for the formation of populist parties (Norris, 2005; Rydgen, 2007; Golder, 2016),
or electoral dynamics, identifying parties on the radical right (Mudde, 2007), but
increasingly also on the radical left (March, 2007; March and Mudde, 2005; Pauwels,
2014; Stavrakakis and Katsambekis, 2014); or else on the populists’ strategy for sur-
viving once in office (see e.g. Boix, 1999). Only recently has the attention of political
scientists shifted to the demand side. Inglehart and Norris (2016) observe that cul-
tural variables outweigh economic ones in the decision to vote for a populist party
(rather than abstain or vote for a non-populist party). But this weak direct effect
stems from a failure to consider that economic security shocks significantly affects the
decision to abstain. In addition to a stronger direct effect of economic shocks, thanks
to our consideration of the turnout effect, we also document a significant indirect ef-
fect: the shocks to economic security are responsible for a sharp change in political
trust and in attitudes towards immigration, which means that these changes in the
7
latter variables cannot be deemed independent drivers.7 Indeed, economic insecurity
may affect the populist vote in several indirect ways, as for instance fostering a fear
of white-status loss in the case of Trump voters as documented in Mutz (2018). For a
review of the literature on populism in the social sciences in general, see e.g. Gidron
and Bonikoeski (2013) and Mudde and Kaltwesser (2017).
Algan et al. (2017) study the political consequences of the Great Recession in
Europe, showing that in elections after 2008 the regions where unemployment rose
saw the sharpest decline of trust in institutions and establishment politics. Dustman
et al. (2017) reach similar results showing that in the aftermath of the crisis mistrust
of European institutions, largely explained by the poorer economic conditions of the
Euro-area countries, is correlated with the populist vote. Foster and Frieden (2017)
nuance this result using individual characteristics from the Eurobarometer survey,
and also show that the correlation is stronger in debtor countries. Like Algan et al.
(2017), we find that economic insecurity has an effect on voting for populist parties
and we document a causal effect of economic insecurity on people’s degree of trust
in politics. Further, however, we find that economic insecurity affects the consensus
for populist parties not directly but primarily because it disappoints the supporters
of the traditional parties of both left and right. This induces abstention and creates
a potential electoral basis for a populist new entrant.8 Unlike Algan et. al. (2017)
and like Rodrik (2017), we study the supply side of populism, highlighting the role
of economic insecurity in triggering entry of populist parties and the importance of
the relative political space on the left and the right in explaining the orientation
that the populist force chooses. As Rodrik (2017) notes, this is crucial in separating
the explanatory role of economic shocks from that of cultural shocks.9 As far as our
7Lucassen and Lubbers give evidence – for 8 of the 11 countries they consider – that shiftstowards far-right populism stemmed from perceived cultural threats more than economic threats,whereas it is plausible that in shifts towards left-wing populism the relevant perceived threat iseconomic. But for us, the important observation is that the perceptions of both economic andcultural threats are affected by the economic shocks.
8See Karakas (2017) for a model emphasizing the importance of being an outsider for credibility.9Rodrik (2017) traces the origin of today’s populism to the shock of globalization arguing that
history and economic theory imply that waves of globalization will predictably lead to a populistbacklash, and with specific timing (when the shock hits) and geographical pattern (in the countriesmost severely affected). While the shock of globalization generates demand for populist policies,
8
finding of policy convergence is concerned (see Section 6), the closest related result
is in Schumacher (2016), who shows from political manifestos that early success of
populist parties did heighten scepticism over multiculturalism in mainstream party
platforms.
In economics there is a literature on the economic consequences of populist poli-
cies (see e.g. Dornbush and Edwards 1991; Sachs 1989; Chesterley and Roberti,
2017), while our paper focuses on the economic causes. The prevalent existing for-
mal theory of populism is in Acemoglu et al, 2013), where the supply of short term
protection policies simply comes from pandering to voters’ implicit demand of credi-
ble differentiation of the political candidate from the interests of the elites. Exploiting
exogenous variation in import flows Steiner (2012), Autor et al. (2016), Autor et
al. (2017), Colantone and Stanig (2016), Colantone and Stanig (2017), Jensen et
al. (2016), all analyze empirically the electoral (support for populist parties) and
political (polarization) impact of economic shocks from globalization or the Euro-
pean single market (Becker et al., 2016), whereas Guiso et al (2018) focus on the
interaction of the various economic crises with the Euro-zone institutions. Pastor
and Veronesi (2018) show how the backlash against globalization is a response to
rising income inequality if aversion to inequality is assumed in voter’s preferences.
A less related literature is the literature focusing on valence politics, namely on
competence and corruption. On the competence demand side, Di Tella and Rotem-
berg (2016) analyze the demand for populism based on the behavioral observation
that voters are betrayal averse, and may accordingly prefer incompetent leaders to
minimize the danger of betrayal. On the competence supply side, Prato and Wolton
(2017) view populism as primarily political opportunism by incompetent politicians.
Corruption is more often involved in populist rhetoric, since the accusation of cor-
ruption for traditional parties and institutions is an easy component of anti-elite
campaigns. As pointed out e.g. by Levine et al. (2018), it is natural that populist
anti-corruption rhetoric be more effective in countries with higher perceived capture
Rodrik stresses the importance of also understanding the supply side, and in particular the politicalorientation that the populist parties chose, which in his view depends on the relative salience of thespecific cleavages induced by globalization. The channel of inequality is investigated for the case ofSweden in Del Bo et al (2017).
9
of politicians by lobbies and interest groups, since generally such a capture is corre-
lated with corruption.10 However, in our view the strategic use of valence advantages
and/or strategic use of incumbents’ valence disadvantages are common traits of pol-
itics, and are not confined to populists. Hence in our analysis valence politics does
not play a major role. To see clear evidence of the "normality" of political posturing,
see e.g. Ash et al (2017) and the earlier empirical studies of Canes-Wrone and Shotts
(2004) and Rottinghaus (2006).
3 Empirical framework and methodology
3.1 Specifications
In this section we propose a simple framework to empirically model demand and
supply of populism and we highlight the econometric issues that modelling people’s
voting choices and populist parties decisions poses. On the demand side, individual
voters make two decisions: they decide whether to participate in elections and, con-
ditional on participation, whether to vote for a populist party or not, if a populist
party is present. On the supply side, parties decide whether to be present with a
populist program or not and, if present, their orientation choice on the left-right po-
litical spectrum. Given orientation, their choice will depend on the expected voting
shares they can gain with such a platform. Existence of a populist party will also
depend on features of the country that affect the cost of entering the political market
with a populist program.
We can think of a two stage process. In the first stage a party decides whether to
enter with a populist platform trading off the benefit of entering with such a program
- the share of votes that it can hope to obtain given the chosen orientation - against
the cost of entering. The expected share of votes will depend on the extent of voters
disappointment with mainstream parties, itself a function of the economic insecurity
that voters experience. Conditional on entry, the populist party will position itself on
10For a recent result on long term effects of exposure to corruption on trust in institutions andhence anti-system voting see Aasve et al (2018).
10
the side of the political spectrum where there are more voters and where its rhetoric is
more effective in mobilizing them. We capture the adoption and orientation decisions
with the following two empirical specifications:
npct = αd(ect)− βzct + uct (1)
rjct = δ0 − δ1slct × Lct + δ2srct ×Rct + vct (2)
Equation (1) models entry/adoption; npct is the number of populist parties in
country c in year t and is equal to zero if no populist party is present; d(ect) is
the average level of voters’ disappointment - an increasing function of the voters
degree of economic insecurity in country c in year t, ect; zct is a vector of features of
the institutional and political system, possibly time-varying, that affect the cost of
setting up a party with a populist platform; and uct an error term. In equation (2)
rjct is the orientation of populist party j in country c at t, increasing in orientation
to the right; sLct and sRct the shares of left and right-oriented voters; Lct and Rct the
left-salient and right-salient factors; and vct an error term. This formulation captures
the idea, stressed by Rodrik (2017), that in a country a populist party chooses to
position itself more to the right if there is a larger share of right oriented voters,
catering towards some salient issue to which right-oriented voters are particularly
sensitive, e.g. immigrants. Viceversa, it will position more to the left if the share of
left oriented voters is larger and will cater to some salient issue to which these voters
are responsive, such as income inequality. We will see at the end how even in the
data these two separate types of policies share the protection strategy features.
In a second stage, voters indexed by i decide whether to participate in elections
and whether to vote for a populist party or not in country c year t. The simplest
model of voting is one in which voters are ideological and expressive. This means that:
a) first, conditional on participation, voters choose the party with their preferred
ideology, left or right – the ideological component; and b) second, that the decision
whether to vote or abstain depends exclusively on a comparison between the cost
and the expressive benefit of voting.
11
Voters are either left- or right-leaning and have a degree of disappointment with
traditional politics owing to the income difficulties they experience dict ∈ [0, 1] . For
simplicity, let this degree of disappointment differ across voters but be the same
across left and right ideologies. Disappointment is affected in the same way by an
economic crisis.11
When voter i does not feel sufficiently represented by the traditional party on
his side of the spectrum, or when he is dissatisfied enough, he abstains from voting.
Formally, the abstention condition can be expressed as:
Aict − dict < Cict + εict
where Aict is the benefit of voting for the preferred party when no disappointment is
present, Cict is the observable cost of voting, and εict a normally distributed compo-
nent affecting the net cost of voting. Rearranging, voter i participates in the election
if disappointment is contained enough:
dict < Bict + εict
where Bict = Aict − Cict is civic sense or the net benefit of voting for an ideal party.
This net benefit is clearly heterogeneous across voters due to observables. Given
normality of εict, the probability that voter i participates in election is then:
Pr (Bict − dict > −εict) = F (Bict − dict) (3)
where F (x) is the cumulative normal distribution of x.
Those who participate have in turn to decide whether to vote for a populist or
for a mainstream party. As argued above, a disappointed voter is more likely to be
supportive of a populist program offering protection, and thus to vote for a populist
party, if ever decides to participate. Let vict = 1 if Bict−dict > −εict and 0 otherwise.
Voter i will choose a populist party if
11Allowing for heterogeneous effects on the two sides would not alter our main predictions, andour empirical evidence indicates that this assumption is actually consistent with the data.
12
dict > Zict + ξict|vict = 1&npct > 0
where Zict is a vector of observable characteristics that affect party choice (in-
cluding a voter left/right ideology) and are typically a subset of those affecting par-
ticipation, and ξict is a normally distributed random component. Importantly, the
party choice can only be expressed by those voters who choose to participate and
that live in a country where a populist party exists. The probability of voting for a
Notice that disappointment, and thus economic insecurity, has opposite effects
on the probability of participation in elections and on voting for a populist party: it
lowers the first but raises the second.
3.2 Econometric problems
Estimation of our model (1)-(4) entails a number of econometric problems due to
endogenous selection. The estimation of populist parties existence does not pose
particular problems. Equation (1) is a reduced form regression and can be estimated
using standard methods such as an ordered probit or a Poisson regression.
A first issue emerges in estimating equation (2), which studies populist parties
orientation, because the latter is only observed if a populist party is present. Because
the presence of a populist party is endogenous, if we ignore this selection issue, there
may be sorting among populist parties presence and local voters preferences. Hence
the estimated orientation choice will be representative of the countries that have a
populist party but not of the population of all countries. We deal with this issue by
running a probit for the presence of a populist party and obtaining a Mills ratio that
is then added to the choice of orientation regression as a control; the specification
of equations (1) and (2) imply that valid instruments are the institutional variables
in vector zct which affect the probability that a populist platform is offered. This
13
“endogenous entry problem” affects also the estimation of equation (4), the individual
choice to vote for a populist party and has analogous implications: the estimated
parameters are representative of the preferences of the voters of countries that have
a populist party but not of the population of the voters. Compared to the latter,
the estimates would be biased. Given that the variables that affect populist parties
presence (and thus the Mill’s that ones would compute from a first stage probit) only
vary at the country-year level, in estimating equation (4) one can control for a full set
of country specific year dummies: the latter would capture all country level variables
that explain entry/existence of a populist party addressing the endogenous entry
problem. We will follow this approach and show that accounting for entry/existence
of a populist party has a very contained effect on the estimated parameters.
The second endogenous selection issue concerns the estimation of (4) and arises
because voters first of all decide whether to participate or not and, only conditional
on this, which party to vote for. To deal with this issue we will estimate a two-step
Heckman probit model, estimating first the probability of participation, and then
the probability of voting for the populist party. As observed, electoral participation
depends on the same set of variables as the choice of party, possibly with opposite
signs: that is, the characteristics that increase the likelihood of voting populist may
also discourage participation. For identification, we need a personal characteristic -
an instrument - that affects the net benefit of voting (benefit less cost), but not the
choice of the party conditional on participation.
We will discuss instruments in Sections 5 and 6 when we present the estimates
of voters decisions and populist parties presence.
4 The Data
Our main source of individual data is the European Social Survey (ESS), the richest
social scientific endeavor to map attitudes, beliefs, and behavior patterns in Europe.
The ESS systematically tracks changing values, attitudes, attributes and behavior
patterns in European polities. It covers all European countries, though not every
14
country participates in every wave. Data has been collected every two years, since
September 2002, by face-to-face interviews. We use seven waves through 2014. The
questionnaire consists of a core module, constant from round to round and smaller ro-
tating modules, repeated at intervals, on selected substantive topics. We will use the
core module, which covers a wide range of social, economic, political, psychological
and demographic variables.
4.1 Measuring voting decisions
The ESS asks people whether they voted in the last parliamentary election in their
country and which party they voted for: “Did you vote in the last [country name]
national election in [month/year?]”. This gives us an indicator of turnout. Those
answering yes were then asked: “Which party did you vote for in that election?” and
shown the list of parties. From this we construct a dummy that takes value 1 if the
voter voted for a populist party (identified in Section 4.3).
4.2 Measuring voters’ characteristics
The ESS tracks a large number of variables from which we select a subset to con-
struct proxies for the voters’ characteristics that influence both turnout and voting
decisions, as discussed in Section 3. We start with our key explanatory variable for
the rise of populism, namely economic insecurity.
Economic insecurity. We capture heterogeneity in economic insecurity with
three measures. First, whether the voter has been unemployed at some time in
the past five years, forcing search for a new job; second, as a measure of financial
distress, whether the voter is experiencing income difficulties, i.e. finds it hard to
live on his current income;12 and third, an indicator of exposure to globalization,
constructed exploiting information in the ESS on type of employment, industry and
skill level – classifying as more exposed low-skill workers in manufacturing. The
12People are asked: “Which of the descriptions on this card comes closest to how you feel aboutyour household’s income nowadays?”. Answers range from 1 (“Living comfortably on present in-come”) to 4 (“Finding it very difficult on present income”) increasing in experienced difficulty.
15
indicator takes value of 1 if the individual is a blue-collar worker in manufacturing;
0 otherwise. We will find it useful to combine these three objective measures of
financial and economic distress in a single composite index of economic insecurity by
taking the first principal component, rescaled to vary between 0 (least insecure) and 1
(most insecure). With this measure we are agnostic about the specific factor causing
economic insecurity. It clearly captures exposure to globalization (emphasized by
Rodrik, 2017; Colantone and Stanig, 2017; Autor et al., 2017; Guiso et al., 2018),
but also other forces that may have been at work, including the obsolescence of job-
specific skills, labor displacement due to rapid automation (Acemoglu and Restrepo,
2017) and enduring disruptions in personal savings and investment returns caused
by the 2008 financial crisis (Guiso et al., 2018). The point is that one single measure
- e.g. unemployment - is unlikely to really capture voters’ economic insecurity. Using
unemployment alone, for instance, it would be difficult to explain the rising populist
vote in Germany where the jobless rate is low (under 3.4% as of October 2018) and
declining (since 2010).
Economic insecurity may also be produced by labor market competition due to
immigration. Unfortunately, there are no data on immigration inflows by country
of origin and region of destination, which would enable us to obtain intra-country
variation in individual exposure to labor market pressure.13 To capture fear of dis-
placement in the labor market due to the possible arrival of cheap labor, we use
a measure of sentiments towards immigrants: whether the voter would like fewer
immigrants from low-wage countries, with answers ranging from 1 to 4 increasing in
degree of support for immigration quotas. The ESS also collects people’s attitudes
towards quotas on immigrants from countries of the same race/ethnicity and from
countries of different race and ethnicity, as well as whether people agree with the
statement that immigrants make their country worse. We will use all these measures
13Caliendo et al. (2017) make an estimate of immigrants by country of origin and country – notregion – of destination using the EU labor force survey which reports gross flows of workers into acountry by nationality and over time. The only data available at regional level are net populationflows, a gauge that is unlikely to capture competitive pressure on local labor markets due to intenseimmigration. For instance, a zero net flow may reflect an inflow of immigrants of 100 and an equaloutflow of displaced local workers: competitive pressure is high but net flow does not reflect it.
16
in studying the effects of economic insecurity on attitudes and beliefs in Section 5.4;
but our results on voting are invariant to the measure used, so Section 5 reports the
results using the first measure.14
Trust in traditional politics and institutions. In our narrative populist
platforms are more likely to succeed when voters lose faith in mainstream parties
and existing institutions. The ESS has several proxies for confidence in institutions,
governments and political parties, all on a scale between 0 (no trust) and 10 (full
trust). These indicators tend to be closely correlated and thus hard to tell apart. In
analyzing individual voting behaviour we use trust in political parties, which speaks
directly to our model. In studying the link between economic insecurity and trust in
Section 5.4, we use all the measures.
Other controls. We enrich the set of explanatory variables with two proxies for
voters’ ability to foresee the pitfalls of the populist platforms. The first is education,
measured by the number of years of full-time schooling completed. The second is
a measure of attention to politics, captured by two variables: how many hours per
week people devote to watching TV in general and how many of these hours are
spent watching news or programs about politics and current affairs. Watching TV
in general is taken as a proxy for little interest in politics, and thus as a proxy for
poor information. Watching news and programs about politics, given the time spent
watching TV, is used to proxy for information level.15 We expect better educated
people and people who watch TV programs on politics to be better able to anticipate
the cost consequences of populist policies and accordingly less likely to vote for their
proponents.
Voting for an anti establishment party may entail some risk and be more appealing
for risk prone voters. Similarly, sensitivity to policies that offer short term protection
14Using synthetic panel data we document that people who experience an increase in the indexof economic insecurity become more supportive of limiting immigration from low-wage countries(see Section 5). This justifies taking adverse attitudes towards immigrants as a gauge of economicinsecurity.
15It may well be that someone who spends 100 percent of his/her time on TV watches onlyone-sided news. This may be the reason why it turns out not to be particularly significant in theregression on party choice, but is significant for the decision to participate, since watching politicalnews correlates with mobilization.
17
at the expense of long term policies may depend on people subjective discount. We
use age as a proxy for subjective discounting, on the presumption that older people
are less likely to have to bear for the future cost of current policies (assuming they
care about future generations less than they care about themselves). As a proxy for
risk tolerance we use the ESS indicator of whether people consider it important to
avoid taking risks.
In all regressions we control for gender and political orientation, measured on a
scale from 0 (far left) to 10 (far right). Needless to say, some of the variables can
proxy for more than one of the dimensions of heterogeneity that we have listed. For
instance gender may also reflect risk preferences as may age. Table 1 panel A shows
summary statistics for these variables.
[TABLE 1 HERE]
4.3 Identifying populist parties
To identify populist parties in Europe, we rely on the classification proposed in the
recent, comprehensive study by van Kessel (2015), which studies all the parties that
gained parliamentary representation in national elections in Europe between 2000
and 2013.16 The period and the countries covered match those in the ESS data.
Van Kessel defines a party as populist if it a) portrays “the people” as virtuous and
essentially homogeneous; b) advocates popular sovereignty, as opposed to elitist rule;
c) defines itself as against the political establishment, which is alleged to act against
the interest of the people. These features reflect the general anti-elite supply rhetoric
dimension that is also mentioned as first characteristic in the Encyclopedia definition.
To detect the presence of populist parties van Kessel uses primary sources such as
party manifestos and speeches. To make sure that the classification is meaningful,
he also asks a pool of country experts to validate or reject his classification by
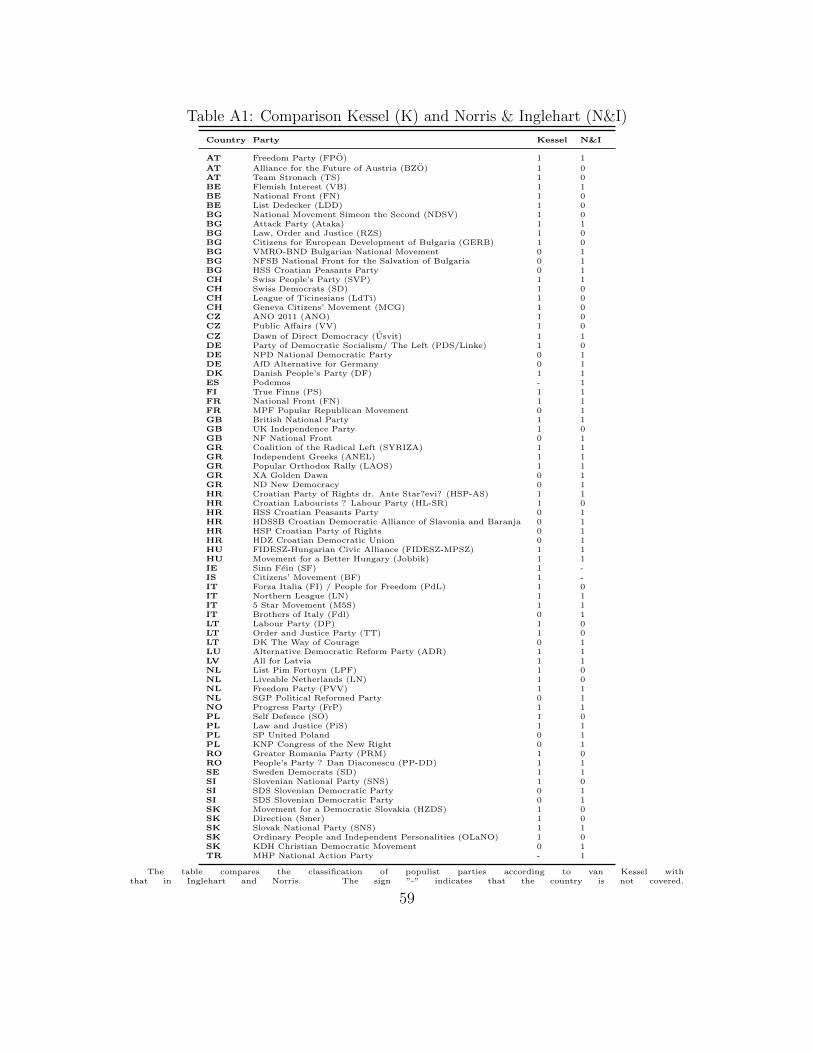
answering an ad hoc questionnaire. Using these criteria, the author identifies 59
16The countries covered are: Austria, Belgium, Bulgaria, Croatia, Cyprus, Czech Republic, Den-mark, Estonia, Finland, France, Germany, Greece, Hungary, Iceland, Ireland, Italy, Latvia, Lithua-nia, Luxembourg, Malta, the Netherlands, Norway, Poland, Portugal, Romania, Slovakia, Slovenia,Spain, Sweden, Switzerland, UK.
18
populist parties in 26 of the 31 countries examined. Since only 53 of those obtained
seats in parliaments, we conduct the analysis using those 53, but all results are robust
to including all 59.17 There are several advantages to this classification. First, it uses
a clear set of political strategy attributes, rather than subjective judgements. That
is, the “supply rhetoric” is observable and can be detected from official documents.
Second, van Kessel’s classification covers all the relevant European countries. And
third, it allows the definition to be time-varying, so that a non-populist party may
turn populist in a certain year, a feature which is important for studying the supply
side of populism. For a full list of parties, see Appendix A.
Despite these merits, the dichotomous populist non-populist classification un-
avoidably contains a certain amount of subjective judgement. The analysis of this
paper will lead to the conclusion that for identification of the populist parties the
van Kessel definition suffices (because of complementarity with the other two com-
ponents of the Encyclopedia definition) but the explicit consideration of the other
two components yields a richer and more precise characterization of what populists
do and why they are successful now and here.
4.4 Validating survey data on voting
Since we cannot observe true behaviour, we analyse voting decisions as reported.
Obviously, response to the ESS do not necessarily correspond to what people actually
did in the voting booth. Apart from recall bias, people may be reluctant to tell their
voting choice truthfully. The correlation between turnout in the ESS and actual
turnout is quite high, 80%. The correlation between ESS votes for populist parties
conditional on participation and actual voting is lower, at 65%. This is not surprising.
Apart from reluctance to reveal voting choice, the survey may be representative of
the country’s adult population but not necessarily of the electorate. Furthermore,
the low correlation can be traced to seven observations out of 106 in which the ESS
understates actual vote for the populist party by more than 25 percentage points.18
17Van Kessel’s definition is very similar to that of Mudde (2004, 2007), and in fact the partiesidentified by the two authors are essentially the same.
18All our results go through even excluding these outliers from the analysis.
19
Dropping these observations, the correlation is 85% and a regression of the average
populist vote in the ESS on actual votes yields a slope of 0.76. The hypothesis
that the slope is 1 is rejected, suggesting that the ESS sample participants tend to
systematically understate the populist vote. However, if this measurement error were
positively correlated with preferences for voting populist, our estimates of the effect
of economic insecurity on voting would be a conservative estimate of the true effect.
4.5 Data on supply
We use the ESS mostly to study individual voting behavior - what we call the demand
side of populism. For the supply side, we complement the ESS with several other
datasets. Data on national political institutions come from the World Bank Database
of Political Institutions. Data on trade with China, India and the rest of the world are
drawn from the World Bank WITS statistics (UN Comtrade). Finally, the five waves
(1999, 2002, 2006, 2010, 2014) of the CHES serve to determine whether populism,
once it appears, spills over to non-populist parties. For each of the 246 parties
included, which belong to all the countries in our sample, CHES gives a measure of
the position on a set of relevant issues, which we use to obtain measures of distance
between the position of a non-populist party from that of the populist party in
the same country. Table 1, panel D, shows summary statistics of these measures,
described in detail in Section 6.
5 Demand: the empirics of voters’ behavior
We first show results on the drivers of the vote for a populist party using the ESS
data. We model voting as a two-step decision: a) whether to participate in an election
(the participation decision); and b) conditional on participation, which party to vote
– in particular, whether or not to vote for a populist party (the voting decision).
Estimating the two decisions simultaneously is important for two related but distinct
reasons: to get consistent estimates of the voting decision if unobserved components
of the participation decision are correlated with unobserved components of the voting
20
decision; and second, to pin down the channels through which voters’ characteristics
impact on the voting choice. Let πC(x) = πJ(x)/πV (x, z) denote the probability
of preferring a populist party conditional on voting, which is defined as the ratio
of the joint probability of voting and preferring a populist party, πJ , and that of
participating in the election, πV . The effect of a change in x, say an increase in
economic insecurity, is πCx = (πJ
xπV − πV
x πJ)/(πV )2 or, in percentage, πC
x /πC =
(πJx/π
J − πVx /π
V ) which is clearly affected by the effect of x on the participation
decision. By a joint estimation of the voting and participation decisions we retrieve
consistent estimates of πCx and πV
x and can assess the economic role of turnout in the
voting results. In frequencies, πC represents the populist party’s share of the vote –
our dependent variable.
5.1 Turnout and identification
To account for the fact that the party choice only applies to those who vote in
the election, itself a choice variable, we estimate a two-step Heckman probit model,
estimating first the probability of participation, and then the probability of voting
for the populist party. As observed in Section 3, electoral participation depends on
the same set of variables as the choice of party, possibly with opposite signs: that is,
the characteristics that increase the likelihood of voting populist may also discourage
participation. For identification, we need a personal characteristic that affects the
net benefit of voting (benefit less cost), but not the choice of the party conditional
on participation. As instruments we use the mean temperature and total rainfall
on the day of the elections in each region-year. The identification assumption is
that meteorological conditions on the election day affect the cost of going to the
polls but not the preference for voting for a specific party, which should reflects less
transient factors. Because the effect of rain or heat on the cost of going to the polls
may be stronger in countries where it rains infrequently (or where temperatures are
frequently low) we also include interactions between rainfall and temperature with
a dummy variable for southern countries.
21
5.2 Estimation results
We start estimating our Heckman probit model on the sample of countries that have
a populist party in the ESS waves. Later we extend the estimates to all countries
and account for selection induced by populist party existence/entry. As we will see,
results are unaffected suggesting that the included controls already capture the vari-
ables that affects populist parties existence/entry. In all specifications we control for
gender and political orientation and for the population of the voter’s region; we also
include country-level fixed effects and ESS wave effects. Importantly, country-fixed
effects capture all the time-invariant features of the country that may affect the suc-
cess of populist platforms: the electoral system, the responsiveness of the established
parties to salient political issues (such as labor market pressure from immigrants),
and the level of corruption.19 For brevity, these controls are not reported. We run
regressions using sampling weights to account for differences in national’s sample
size. In all regressions, standard errors are clustered at the regional level. Our fi-
nal dataset consists of 136,953 observations from 25 countries when estimating the
specification with all controls.
Table 2 reports the estimates of several specifications, with a progressively aug-
mented set of controls. The bottom part shows the parameter estimates of the
meteorological instruments on the participation decision. In general, rainfall on elec-
tion day discourages participation in southern countries, while high temperatures
significantly discourage it in Nordic countries. This conforms with intuition: going
to the polls when the temperature is high is a heavy toll in a Nordic country (where
hot days are rarer), while going to vote in the rain is costly in southern countries
where people are less equipped for it. Conditional on the controls and the instru-
ments there is no sign of selection bias, as is shown by the low and insignificant
correlation between the residuals in the voting and the participation regressions in
all specifications.
The first two columns show results of participation and voting decisions control-
ling for risk and time preferences, education, political information, and the three
19These are some of the context variables that studies of populism (e.g. van Kessel, 2015) considercritical in explaining populists’ success.
22
proxies for economic insecurity. The proxy for risk aversion has a significant posi-
tive effect on participation: people who consider it important to avoid taking risks
are more likely to vote. This measure has no effect on the choice to vote for a
populist party. Hence, we find no support in the data for the idea that since the
populist choice entails risk, it is more appealing for risk-tolerant voters. Age affects
participation positively but has no effect on voting populist.20
Education - our proxy for people’s ability to foresee the long-term costs of current
policies - has a positive and precisely measured effect on voting and, conditional on
participation, a negative effect on support for a populist party. Increasing education
by 4 years (one sample standard deviation) raises participation probability by 24
percentage points (30% of the sample mean). The proxy for political information
has a significant impact on turnout - more politically informed citizens are more
likely to participate - but it has no well identified effect on voting for a populist
party (see the brief discussion on the reasonableness of these findings in footnote
15).
Economic insecurity is our key determinant of the demand of populism. Unlike
the papers that ignore turnout (e.g. Inglehart and Norris, 2016), our study confirms
the effectiveness of the economic insecurity mechanism. Economic insecurity acts on
two margins: it discourages participation and increases the likelihood of a populist
vote among those who do decide to vote. The effect on the participation margin is
precisely estimated and highly responsive to unemployment, income loss and expo-
sure to globalization. It is this margin, in our interpretation, that creates the basis
for the appearance of populist platforms. The populist party vote is more likely
among those who lost a job, suffer an income loss and are exposed to globalization.
To facilitate interpretation of the magnitude of the effects of economic insecurity,
the second set of regressions replaces the three measures of economic insecurity with
their principal component. The index of economic insecurity significantly affects
electoral participation and voting for the populist party. At sample means, increasing
economic insecurity by one standard deviation lowers turnout by 6.8% of the sample
20Interestingly, women are less likely to participate, and when they do, they are also less likelyto support populist platforms; while the politically right-leaning are more likely to participate.
23
mean and increases the populist vote by 11.5%. For an individual who transits from
no economic insecurity to economic insecurity, the probability of voting for a populist
party increases by 56% of the unconditional sample mean, while the probability of
voting falls by as much as 26 percentage points, equivalent to 33% of the sample
mean. These are substantial effects.
The third pair of columns have trust in political parties as an additional explana-
tory variable. Consistent with our proposed interpretation of the role of disappoint-
ment with politics for the rise of populism , people with greater confidence in political
parties are more likely to vote and to vote for a non-populist party. Those who have
lost faith in political parties are more likely to abstain, but if they do vote, they are
more likely to choose a populist party. Trust in political parties is on a scale of 0 to
10; a drop of 5 points increases the probability of voting for a populist party by 21%
of the sample mean. The effect on electoral participation is similarly strong: a drop
of 5 points lowers the chance of participating in elections by 8.9 percentage points,
more than 11% of the unconditional mean electoral turnout.
The last pair of columns add, as a control, a measure of attitudes towards im-
migrants, used as a proxy for fears of competition in the labor market. The specific
measure is support for policies that limit immigrants from non-EU countries; if in-
stead we use a measure of support for limiting immigrants of the same race/ethnicity
or immigrants of other race/ethnicity than that of the respondent or an average of
the three measures, the results are basically unaltered. People who are more adverse
to immigrants are less likely to vote and more likely to vote for a populist party if
they do. A 1-standard-deviation increase in hostility to immigrants lowers turnout
by 1 percent of the sample mean; the effect on voting for a populist party is more pro-
nounced: it increases by 6.1% of the sample mean. The effects of the other variables,
particularly economic insecurity and trust in political parties, are unchanged.
[TABLE 2 HERE]
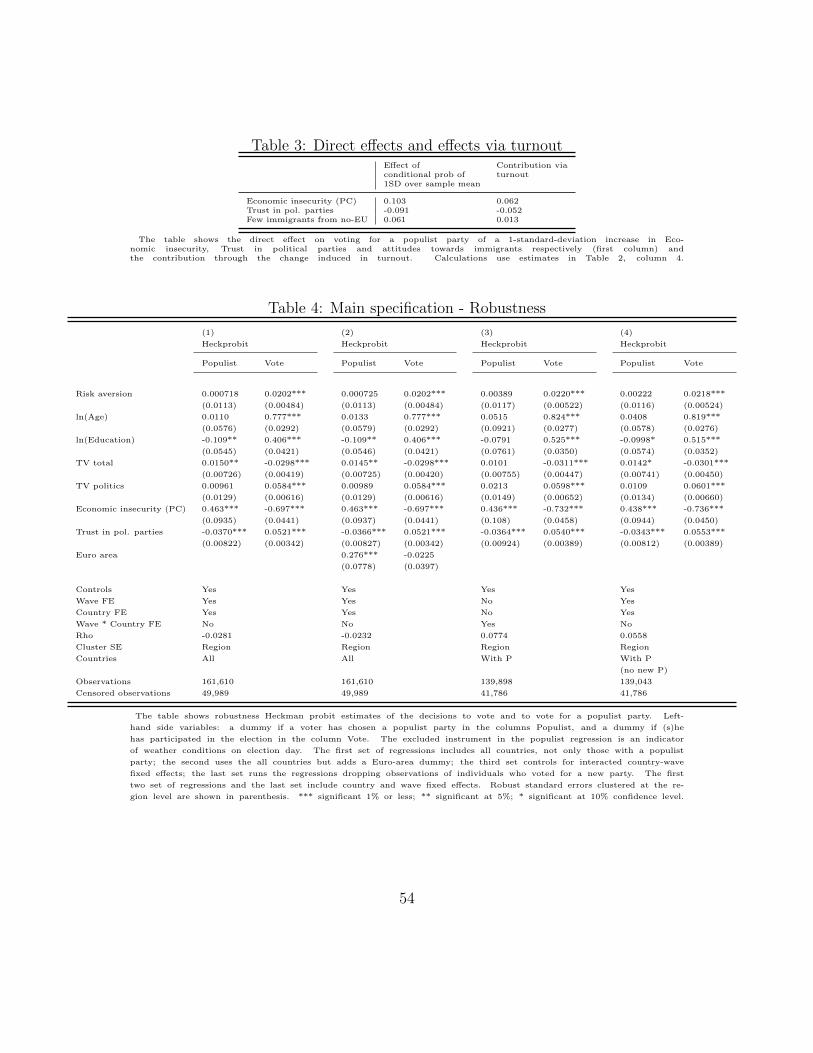
Table 3, first column, summarizes the direct effect on the conditional probability
of voting for a populist party of a 1-standard-deviation increase in economic inse-
curity, trust in political parties, and fear of immigrants. The second column shows
24
the contribution of these variables to the conditional probability of a populist vote
through their effect on the probability of voting at all. Economic insecurity and trust
in political parties affect the conditional probability of voting for a populist party
mostly through their effect on turnout. Accounting for the effects on the decision
whether or not to vote is crucial to understand how the drivers of populist voting
operate.21
[TABLE 3 HERE]
A summary illustration of the fact that economic insecurity affects populism
demand through the participation effect is given in Figure 2, where we see that panel
A and panel B have the same share of citizens who prefer to vote for the populist
option, but panel B displays a larger fraction of abstainers, with the disillusionment
affecting traditional party supporters more strongly.
[FIGURE 2 HERE]
5.3 Robustness
Table 4 reports a number of extensions and robustness exercises. To save on space,
the estimates of the instruments in the turnout regressions are shown in Appendix B.
The first two columns run the estimates of the Heckman probit using all the sample
countries, not only those that have a populist party. That is, the turnout equation
is estimated using observations for countries both with and without populist par-
ties. The endogenous presence of populist parties is fully captured by the country
dummies. The results are unaffected. Economic insecurity lowers participation and
increases the populist vote; the effects are significant and of the same order of mag-
nitude as those in Table 2. The same holds true for the effects of trust in parties
and the other controls. The second set of estimates, run on all countries, adds a
dummy for countries in the euro-area. This has no effect on turnout but significantly
raises the consensus for populist parties, possibly reflecting the dismal performance of
21From the expression πCx σx =
((πJ
xπV − πV
x πJ)/(πV )2
)σx, where σx is the standard deviation
of x, the contribution through the effect on turnout is (−πVx π
J/(πV )2)σx.
25
euro-area countries during the Great Recession. The other estimates are unaffected.
The next two columns add country-wave fixed effects, capturing changes in populist
manifestos and rhetoric. Again the results are unchanged. One concern is that, the
populist vote may actually be capturing voting for a new party as such. To address
this, in the last two columns we run the estimates after dropping individuals who
voted for any new party - i.e. a party present in the election for the first time. The
results are basically unaffected. As a final robustness exercise, we run the estimates
again, using a different exclusion restriction in the Heckman selection model. This is
not because weather on the election day is orthogonal to the voting choice, but be-
cause one may doubt its power. As an alternative instrument we use the voters’ self
reported health status, on the assumption that people in weaker health face a higher
turnout cost.22 All results (not reported for brevity) hold if we use this alternative
instrument (see working paper version, Guiso et al., 2017).
[TABLE 4 HERE]
5.4 Economic insecurity, voters trust in political parties and
attitudes toward immigrants
Economic insecurity can affect both electoral participation and populist vote also
indirectly, because it influences people’s confidence in political parties and attitudes
towards immigrants. A recent strand of work emphasizes the decline in confidence
caused by sharp drops in economic activity. Ananyev and Guriev (2016) are able
to isolate the causal effect of economic downturns on people’s trust during the 2009
recession in Russia, exploiting regional variations in the industrial structure inherited
from the Soviet Union, and noticing that capital-intensive and oil-related industries
are more responsive to shocks to GDP. They find that a decline in GDP causes a
sizeable drop in trust in other people. The same logic applies, even more plausibly,
22Health status is invalid as an instruments if it affects people’s preferences for populist or non-populist parties via differences in healthcare policies. This may apply in the US presidential elec-tions, where dismantling Obama care was part of the Trump program, but, it is not an issue inEurope, where populist versus non-populist programs do not differ on health policy.
26
to falls in trust in political parties, politicians and governments, say because citizens
blame incumbent parties (and the government) for poor economic performance. The
same logic can be extended to argue that negative attitudes towards immigrants may
be exacerbated when people, faced with economic insecurity, feel more threatened
by labor market competition.
In fact, economic insecurity and trust in political parties are negatively correlated,
when gauged using cross sectional variation in the pooled ESS. Similarly, economic
insecurity is correlated positively with hostility to immigrants from non-EU countries.
And these correlations hold even controlling for observable and country and wave
fixed effects. Of course the correlations may just reflect unobserved heterogeneity -
i.e. some individual characteristics that drive both economic insecurity and people’s
trust in politics and attitudes towards immigrants. To address this problem, we
follow Deaton (1985) and construct a pseudo-panel from the sequence of ESS waves.
We group the data into fourteen 5-year age cohorts of men and women in each
country, respectively, and estimate the following model
yjct = β1xjct + β2EIjct + fj + fct + ujct (5)
where yjct denotes the generic belief/attitude of cohort j in country c in year t, xjct
the vector of controls, EIjct the index of economic insecurity, and ujct an error term.
Unobserved heterogeneity is controlled for by the cohort-specific fixed effects fj.23
Country-specific trends in beliefs/attitudes and economic insecurity are captured by
country-year fixed effects fct. The latter pick up any country aggregate variable that
affects changes in beliefs over time, including any effect of populist party rhetoric.
Figure 3, left panel, shows a simple bivariate correlation between the change in
trust in political parties and that in economic insecurity among the pseudo-panel
cohorts. In all cases, an increase in the economic insecurity of the cohorts leads to
a decrease in trust in political parties. The right panel shows the bivariate correla-
23Our pseudo-panel consists of 840 age/country/year-of-birth groups. Cohorts are relatively large,with 293 observations on average. This reassures us that measurement error in the cohort means islikely to be negligible. Dropping cohorts with fewer than 50 observations (7.7% of the total) doesnot alter the results.
27
tion between changes in attitudes towards EU immigrants and changes in economic
insecurity for the same cohorts. This second correlation is strongly positive.
[FIGURE 3 HERE]
The first two columns of Table 5 report controlled fixed-effect pseudo-panel re-
gressions of trust in political parties and attitudes to non-EU immigrants on our
summary measure of economic insecurity and individual time-varying controls (risk
aversion, age, exposure to the media) as well as country-specific time effects com-
mon to all cohorts. Economic insecurity has a negative and highly significant effect
on trust in political parties and a positive and highly significant effect on hostility
towards immigrants.
The economic effects are substantial: a 1-standard-deviation increase in economic
insecurity lowers trust in political parties by 7.3% of its sample standard deviation
and increases hostility to non-EU immigration by 5% of its sample standard de-
viation. Because these are fixed-effects regressions, the results cannot depend on
unobserved heterogeneity.24 The results confirm the thesis that a deterioration in
individual economic security causes a loss of confidence in political parties as well as
a change in attitudes towards immigrants.25
[TABLE 5 HERE]
The rest of the table expands the evidence by regressing several measures of
trust (in politicians, in the national parliament, in the European parliament, and
an index of satisfaction with the government) and attitudes towards immigrants
(preference for fewer immigrants of different race/ethnicity; for fewer immigrants of
24The pseudo-panel regressions identify the causal effect of economic insecurity on trust in po-litical parties and on attitudes towards immigrants that is due to: a) individuals in the cohortchanging their attitudes when they experience insecurity directly; b) changes in trust towards par-ties/attitudes towards immigrants in that cohort reflecting group effects: say, an individual in agiven cohort who loses confidence in political parties because he/she observes that other membersof the same cohort have experienced economic insecurity.
25Reverse causality - people who lose trust in parties and because of this are more likely to losetheir jobs or to suffer income losses - is not plausible, particularly in light of the fact that any effectthat a generalized loss of confidence in politics has on the economy is already picked up by the timefixed effects and similarly for a change in attitudes towards immigrants.
28
same race/ethnicity; agreement that immigrants make the country worse). Economic
insecurity can be seen to cause people to lose confidence in politics, institutions and
governments and to increase aversion to immigrants across the board.26
5.4.1 Direct, indirect, and total effects of economic insecurity
We use the estimates in the first two columns of Table 5 together with those in Table
2 to obtain an estimate of the total effect of an increase in economic insecurity on
the probability of voting for a populist party among those who vote and on electoral
turnout rate.27 The estimates are shown in Table 6.
[TABLE 6 HERE]
In total, an increase in economic insecurity by 1 standard deviation increases
populist voting by 11.3% of the sample mean. Around 92% of this increase stems from
the direct effect on voting and the rest from the indirect effect through lower trust
(6%) and fears of immigrants (3%). An increase of the same magnitude in insecurity
lowers electoral turnout by 8.5% of the sample mean (6.6 percentage points); 93%
of the drop is due to the direct effect, while 6% to the indirect effect through lower
trust in political parties and a marginal 1% to increased fear of immigrants.
26Our interpretation is supported by the results in Algan et al. (2017) who show that in regionsof Europe where unemployment increased more sharply following the 2008 crisis, trust in partiesand political institutions fell more and sentiments towards immigrants deteriorated. An IV analysissuggests that the causality runs from changes in unemployment to changes in trust and sentiments.
27The magnitude of the effects of economic insecurity on trust and anti-immigrant sentimentsis taken from the pseudo-panel estimates; the effect of trust and immigrant sentiments (as well asthe direct effect of economic insecurity) on both voting populist and turnout are taken from theHeckprobit main specification.
29
6 Supply: the empirics of populist parties and
policies
6.1 Presence and entry of populist parties
Populist parties are not always present. Figure 4 (left panel) shows the share of
countries with at least one populist party among the 31 countries in our sample. In
2000, the proportion was just above 60%; by 2009 if rose to almost 85%. Our model
suggests that the presence of populist parties is heavily affected by the magnitude of
the potential demand: if underlying support is sufficiently large, a populist platform
is more likely to emerge (and to disappear if support fades). In Section 5.4 we showed
that economic insecurity undermines confidence in political parties and creates polit-
ical space for a populist platform. We accordingly predict that economic insecurity
will be a major explanatory factor for the presence of populist parties. Where the
scale of electors’ disappointment due to insecurity exceeds the cost of setting up a
party, which depends on context-specific variables, a populist party should emerge.
To test this implication we estimate the following model:
npct = αd(ect)− βzct + uct
where npct is the number of populist parties in country c in year t, d(ect) is
the level of voters’ disappointment - an increasing function of the level of economic
insecurity in country c in year t; zct is a feature of the institutional and political
system, possibly time-varying, that affects the cost of setting up a party with a
populist platform; and uct an error term. We measure heterogeneity in the supply
of populist parties with a discrete variable - the number of parties in each country
defined as populist by van Kessel, in the years from 2000 to 2015. Figure 4 (right
panel) shows the distribution of this variable. We capture economic insecurity with
two measures. The first is simply the mean in the ESS sample in country c, year t, of
our principal component measure of individual economic insecurity used in Section 5.
Because the ESS is run every two years, for the country/years when the ESS measure
30
of economic insecurity is not available we extend that of the nearest wave. Clearly,
this limits the time variability of this measure. Our second measure is the share
of imports (total imports over population), to capture exposure to globalization.
Because this measure is available every year, it adds variation in economic insecurity.
As a proxy of the cost of forming a populist party, we have experimented with several
political/institutional features, including an index of checks and balances, the nature
of the electoral system, and party-political fragmentation. Though these measures
all affect the presence of a populist party in the expected direction (populist parties
are less likely to be present in countries with stronger checks and balances, a less
fragmented political system and a proportional electoral system),28 the factors with
the greatest predictive power are the strength of the opposition parties and of non-
aligned parties (both captured by vote in the last election). We report the results
using these measures in Table 7, where we estimate a Poisson model and a Ordered
Probit model, controlling for year fixed effects (to account for the common trend in
populist parties documented in Figure 4) and macro Euro-regions fixed effects,29 and
clustering standard errors at country level, as some countries have more than one
populist party. The first column shows the results proxying zct with the share of the
votes going to opposition party. The supply of populism is greater where economic
insecurity is more widely diffused among the population and in countries more highly
exposed to globalization. It is smaller where opposition parties are strong. All the
effects are statistically significant; they are also economically relevant. All else being
equal, the expected number of populist changes by a multiplicative factor of 1.35,
for an increase of economic insecurity of 1 standard deviation (i.e. a 35% increase
in number of populist parties). An expected increase of 22% of populist parties
obtains for an increase of import of 1 standard deviation. An increase in opposition
28In principle, a proportional system should encourage the supply of populist parties by loweringthe entry costs; but because lower entry costs facilitate the entry of other parties as well, they maydilute the benefit of offering a populist platform, by leaving a smaller share of the vote on the table.In our data this effect seems to prevail.
29The macro Euro-regions are: South (Spain, Portugal, Italy, Greece, Cyprus, Malta), Baltic(Estonia, Latvia, Lithuania), East (Romania, Czech Republic, Poland, Bulgaria, Croatia, Slovenia,Slovakia, Hungary), and Centre-North (Germany, France, Belgium, Denmark, Sweden, Finland,Austria, Ireland, Luxembourg, Netherlands, UK, Switzerland, Iceland, Norway).
31
vote by 1 standard deviation decreases by 23% the expected number of populist
parties. The second column shows that the results are similar proxying zct with the
share of the votes going to non-aligned parties, but smaller in magnitude, i.e. 1
standard deviation increase in not-aligned vote share decrease the expected number
of populist parties by 7%). The measures of economic insecurity are somewhat
stronger. The third column shows that the two proxies maintain their relevance
and significance also when considered together. The negative effect of our proxies
for zct lends support to our thesis that a populist platform has a better chance of
winning consensus, and thus of inducing a party to propose it, when people lose faith
in all the established parties. A strong opposition party or the presence of strong
non-aligned parties weakens the anti-elite pillar, rendering a populist strategy less
attractive. All our results are confirmed in columns (4)-(6), when we use a different
estimation procedure, namely an Ordered Probit model with the same specification
as before, and obtaining qualitatively the same results.
[TABLE 7 HERE]
6.2 The choice between left and right
Our hypothesis is that the choice of entering on the left or on the right should
depend on the relative entry space. The latter, in turn depends on the ideological
orientation of the electorate and, as Rodrik (2017) observes, on the salient features
of the main economic insecurity determinants – e.g. a large inflow of immigrants or
a globalization shock, or a marked increase in income concentration and inequality.
In turn, these factors are likely to be differentially salient for left- or right-oriented
voters, pulling the populist party’s orientation choice one way or the other depending
on the relative weight of left- and right-wing voters and the relative salience of left-
versus right-wing factors. To test our hypothesis on our data, we estimate the model:
rjct = δ0 + δ1slct × Lct + δ2srct ×Rct + vct
where rjct is the orientation of populist party j in country c at t, increasing in
orientation to the right; sLct and sRct the shares of left- and right-oriented voters, Lct
32
and Rct the left-salient and right-salient factors and vct an error term. The party
orientation is observed in the CHES survey and measured on a scale from 1 (far
left) to 10 (far right), so our data are limited by the CHES coverage. The shares
of left-oriented and right-oriented voters, also a 1-to-10 scale, are obtained from the
waves of the ESS. As a measure of left-salient factors we use the Gini coefficient of
income inequality (from the World Bank World Income Inequality Database) and as
a measure of the right-salient factor the share of immigrants from Muslim countries
in the total population. This variable, obtained from the World Bank Bilateral
Migration Matrix, is available for three years (1999, 2010 and 2013). We predict
δ1 < 0 and δ2 > 0.
Relative entry space should be a critical determinant of the orientation choice
whenever the individual characteristics of left-leaning and right-leaning voters are
similarly distributed in terms of the key variables of economic insecurity, trust and
ability to assess populist policies that drive the consensus for populist parties, as
shown in Section 5. Table 8 confirms that this is indeed the case. The distribution of
proxies for the determinants of voting, summarized by mean and standard deviation,
are extremely similar between left-oriented and right-oriented voters.
[TABLE 8 HERE]
Figure 5 shows that in the CHES data, the distribution of the orientation of
populist parties is sharply different from that of non-populist parties: populists have
a much higher density on the right.
[FIGURE 5 HERE]
[TABLE 9 HERE]
Table 9 first column shows that the heterogeneity in populist party orientation is
consistent with our hypothesis. Income inequality weighted by the population share
of left-oriented voters tends to pull orientation of populist parties to the left, and the
effect is statistically significant. 1-standard-deviation increase in this factor shifts
orientation to the left by more than one unit in the scale, or 21% of the sample
33
mean. The share of immigrants from Muslim countries weighted by the share of
right-oriented voters has a positive and highly statistically significant effect, pulling
populist parties’ orientation to the right. A 1-standard-deviation increase in this
factor increases the score by 1.51 points, or 29% of the sample mean orientation.
Interestingly, it is not immigration per se that affects the populist orientation but
its origin from Muslim countries (see e.g. Laitin, 2018). If we replace immigration
from Muslim countries with the population share of all immigrants or of immigrants
from EU countries, the immigration variable (weighted by the share of right-oriented
voters) is not statistically significant. This strengthens our interpretation of the
results, as it strongly suggests that the orientation chosen is the one most susceptible
to effective populist rhetoric (see Rodrik 2017). Results are unchanged if we account
for selection due to endogenous populist party entry (second column) by adding as a
control a Mill’s ratio computed from a first stage Probit for the presence of a populist
party using as instruments the controls in the third column of Table 7.
In sum, the results set out here and in the previous section fully support our
interpretation. Populist parties and platforms appear when the popular disappoint-
ment is sharp enough to raise realistic hopes of winning a share of the total vote -
a scale effect - large enough to outweigh the entry cost. Conditional on entry, the
party chooses its political orientation strategically, tilting towards voters ideology and
where the factors behind the crisis are more salient - a relative size effect.30 There
may have been other ideological and cultural reasons for the orientation choice of a
new party, but we have shown that even the most standard office-seeking motivation
can explain the observed variation.
6.3 Populists’ policy choices – short term protection
Having shown the determinants of entry and orientation choices, it remains to show
the third supply choice, namely the policy platform choice. In this section we show
that both on the left and on the right a populist party consistently offers a signifi-
30An important factor determining entry incentives that we do not consider in this analysis isthe reduction in entry costs determined by the technological changes concerning social media. Seee.g. Campante et al (2018).
34
cantly greater degree of short term protection. Hence the findings of this section will
lend empirical support to the relevance of the Encyclopedia definition mentioned in
the introduction.
Using the 2014 Chapel Hill Expert Survey (CHES), in which national experts
rate European parties on a range of positions, policies and salient issues, we con-
struct continuous measures of the three dimensions of the encyclopedia definition –
(1) anti-elite rhetoric, (2) protectionism, and (3) concealment of long-term costs –
for all the parties in the CHES database. We use these measures to see if it is true
that those parties identified as populist by van Kessel (using dimension 1) are indeed
significantly more likely to choose policy platforms that conform to the second and
third dimension. The rhetoric variable averages the scores assigned to a measure
of the salience of anti-establishment and anti-elite rhetoric and of reducing political
corruption, on a scale from 0 (not important at all) to 10 (very important). The
protectionism measure is the average of the scores for the position on five policies
that may offer economic protection in different domains: deregulation (10 strongly
opposes deregulation of markets); immigration (10 strongly in favor of tough policy);
tion of wealth (10 fully in favor of redistribution). To capture the third dimension we
average parties’ positions on two long-term issues: the environment and international
security or peace-keeping. Policies on these issues will pay off in the long run, the
first by limiting global warming, the second by guaranteeing a stable international
order. We interpret a high score on downplaying the importance of these issues as the
gauge of a strategy of hiding the long-term costs of protectionism. Table 10 shows
regressions of each of the three indexes on the van Kessel populist party identifier,
after controlling for the political orientation of the party (0, far left, 10 far-right).
[TABLE 10 HERE]
Independently of political orientation, populist parties as defined by van Kessel
all score higher in each of the three indexes. The difference between populist and
35
non-populist parties is sharpest on the anti elite/anti corruption dimension (63%
above the sample average) but it is substantial for the other two (36% and 26%
above average). Consistent with populist parties playing a best response to the vot-
ers’ demand and disappointment documented in section 5, what left and right-wing
populists have in common is short term protection supply.31 The analysis presented
for the demand side (section 5) holds if we consider the discrete 3D definition of
populism just described (see Appendix C).
6.4 Non-populist parties’ reaction to populism
One possibility is that non-populist parties may adapt their own platforms in imi-
tation of a successful populist party. To test this hypothesis we use the five waves
of the Chapel Hill Expert Survey (CHES). For each of a list of issues (see Appendix
D for the full description), the CHES reports the position of the party on a scale
of 0 to 10 (for some issues, the CHES scale is 1 to 7, but we rescale them to 0-10).
To assess the party position CHES questions a pool of experts in each country. For
instance, on the issue of deregulation/regulation the position of the party is gauged
by a number, running from 0 (strongly opposed to deregulation) to 10 (strongly in
favour). We disregard issues present in only one or two survey, considering only
those that are assessed in at least three and preferably all five surveys. We group the
positions into four families: overall European integration (P EI); European policy
(P EU, obtained summing the scores on three issues: powers of European institu-
tions, European cohesion policy, and EU foreign and security policy); ideology (P ID,
obtained summing the scores on three issues: general ideological stance (left/right),
stance on intensity of government intervention in the economy, libertarian versus tra-
ditional/authoritarian stance); and an index of the positions on a set of eleven policy
issues (P PD: government expenditure versus taxation, deregulation, redistribution
of wealth, civil liberties versus law and order, social lifestyle, religious principles in
politics, immigration policy, multiculturalism, urban versus rural interests, political
31Using a first principal component of each of the three dimensions in the Encyclopedia defini-tion, the last column of Table 10 shows the correlation of this measure with van Kessel’s populistidentifier.
36
decentralization to regions/cities and position towards ethnic minorities). The first
three indexes are available for all surveys, the fourth for the last three waves.
To compare platforms we proceed as follows. Let yicjt denote the position of party
i in country c on issue j (EI, EU, ID, PD) in year t. We distinguish between platforms
of populist parties, P, and non-populist, NP, and let Dijct = (PNPijct −P P
jct)2 denote the
distance between the platform of non-populist party i and the main populist party
in its country, if there is one. Let sPt−1 denote the share of the vote going to the
populist party or parties in the last election before the survey. We test the electoral
competition hypothesis by running the regression:
Dicjt = ft + fNP + γsPt−1 + uicjt
where ft are time fixed effects, fNP are non-populist party fixed effects, and
uicjt an error term. Because parties are country-specific, the party fixed effects also
capture systematic national differences across countries. Most electoral competition
models would predict a negative value for γ, that is, the platforms of non-populist
parties should move closer to that of the populist party as the latter becomes more
successful.
[FIGURES 6 HERE]
Figure 6 plots the relation between the distance of the platforms of non-populist
parties from those of the populist and the populist share of the vote in the most
recent election for each of the issues and for the overall index. To pick up possible
non-linearities, we plot a local polynomial regression, with the 95% confidence band.
In all the issues the distance decreases as populist parties gain support, which jibes
with the thesis that populist policies are more palatable to the electorate at times
of systemic crisis. Table 11 shows the estimates of the linear regression specified
above, confirming the visual inspection of Figure 6: as populist parties gain support,
their non-populist adversaries appear to adapt their platforms to reduce the distance
from the populists. The effects,which account for endogenous presence of populist
parties,32 are substantial: increasing the share of votes to the populist party by 1
32We include in all regressions a Mill’s ratio computed from a first stage Probit for the presence
37
standard deviation (15 percentage points) shortens the distance between the non-
populist and populist platforms by 34%, 18%, 27%, and 28% of the sample mean of
our issues EI, EU, ID, PD, respectively. Table 12 rules out the possibility that it is
the populist party that moves closer to the traditional parties as it gains consensus.
To show this, we regress the change in populist positions on the populist share of
the vote. We find that populist parties do not revise their position as their share
of votes increases. Overall, this evidence means that simply counting the number
of populist parties, or tallying their share of votes/seats, understates the supply of
populist policies in a country.
[TABLE 11 HERE]
[TABLE 12 HERE]
7 Conclusions
Western countries in the last decade have experienced an unprecedented crisis that
has affected global markets and sovereign states, leaving many people on unstable
grounds in a way unseen before. Previously the crisis of the 1970s was mainly a
market crisis, while various crises in the 1990s were government crises in a context
of thriving markets. The rare combination of inability of both markets and govern-
ments to provide security has shaken the confidence in traditional political parties
and institutions, induced frustration and fears aggravated by growing threats from
mass immigration and globalization. This paper has described how this dual cri-
sis, reflected in peoples’ economic insecurity, has systematically affected the demand
for, and supply of, populist policies. We have shown that frustration-induced ab-
stention, largely ignored by previous literature, has made economic insecurity the
leading motive behind the demand of populist policies. We have highlighted that
cultural sentiments, such as distrust for traditional politics and attitudes towards im-
migrants, are key drivers of the populist vote albeit indirectly so, being themselves
of a populist party using as instruments the controls in the third column of Table 7.
38
tied to economic insecurity. In sum, populism does not have a direct cultural cause,
but rather an economic insecurity origin, with an important and traceable cultural
channel. These direct and indirect effects of economic insecurity have been clearly
internalized by existing or newly created populist parties in Europe that entered
politics on either sides of the political spectrum. On the flip side, populism and
backlashes against globalization largely did not spread to fast-developing markets
(such as Asian countries) where during this past decades growth and welfare have
greatly improved economic security and prospects for vast portions of the population.
39
References
[1] Aasve, A., G. Daniele and M. Le Moglie (2018): “Never Forget the First Time:
The Persistent Effects of Corruption and the Rise of Populism in Italy.” Mimeo,
Bocconi University.
[2] Acemoglu, Daron, Georgy Egorov and Konstantin Sonin (2013): “A Political
Theory of Populism" , Quarterly Journal of Economics, 771-805.
[3] Acemoglu, Daron and Pasqual Restrepo, (2017): “Robots and Jobs: Evidence
from US Labor Markets”, NBER Working Paper No. 23285
[4] Algan Yann and Pierre Cahuc, (2010): “Inherited Trust and Growth" , Ameri-
can Economic Review, 100 (5): 2060-92.
[5] Algan, Yann, Sergei Guriev, Elias Papaioannou, and Evgenia Passari (2017):
“The European Trust Crisis and the Rise of Populism”, Brookings Papers on
Economic Activity, Fall.
[6] Ash, Elliott, Massimo Morelli and Richard Van Weelden (2017): “Elections and
Divisiveness: Theory and Evidence,” Journal of Politics, Vol. 4, 1268-85.
[7] Autor, David , David Dorn, Gordon Hanson and Kaveh Majlesi (2016): “Im-
porting Political Polarization? The Electoral Consequences of Rising Trade
Exposure" , NBER Working Paper No. 22637.
[8] Autor, David , David Dorn, Gordon Hanson and Kaveh Majlesi (2017): “A
Note on the Effect of Trade Exposure on the 2016 Presidential Elections" , MIT
Working Paper.
[9] Ananyev Maxim and Sergei Guriev (2016): “Effect of Income on Trust: Evidence
from the 2009 Economic Crisis in Russia" , WP Science Po, Paris.
[10] Becker, Sascha O. , Thiemo Fetzer and Dennis Novy (2016): “Who Voted for
Brexit? A Comprehensive District-Level Analysis" , Warwick University WP
N. 305.
40
[11] Boix, Carles (1999): “Setting the Rules of the Game: The Choice of Electoral
Systems in Advanced Democracies" , The American Political Science Review,
93 (3), 609-624.
[12] Campante, Filipe, Ruben Durante, and Francesco Sobbrio?(2018): “Politics
2.0: The Multifaceted Effect of Broadband Internet on Political Participation,”
Journal of the European Economic Association, Vol. 16(4), 1094-136.
[13] Chesterley, Nicholas, and Paolo Roberti (2018): “Populism and Institutional
Capture,” European Journal of Political Economy
[14] Caliendo, Lorenzo, Luca David Opromolla, and Fernando Parro (2017):“Goods
and Factor Market Integration: A Quantitative Assessment of the EU Enlarge-
ment”, NBER Working Paper 23695
[15] Colantone, Italo and Piero Stanig (2016): “Global Competition and Brexit",
forthcoming American Political Science Review
[16] Colantone, Italo and Piero Stanig (2017): " The Trade Origins of Economic
Nationalism: Import Competition and Voting Behavior in Western Europe",
forthcoming American Journal of Political Science
[17] Dal Bo, Ernesto, Fred Finan, Olle Folke, Johanna Rickne and Torsten Persson
(2017): " Economic losers and political winners: The rise of the radical right in
Sweden" mimeo Uppsala University.
[18] Deaton, Angus (1985): “Panel data from time series of cross-sections" , Journal
of Econometrics, 30 (1-2), 109-26.
[19] Di Tella, Rafael, and Julio J. Rotemberg (2016): “Populism and the Return
of the ’Paranoid Style’: Some Evidence and a Simple Model of Demand for
Incompetence as Insurance Against Elite Betrayal." Harvard Business School
Working Paper, No. 17-056.
[20] Dornbusch, Rudiger, and Sebastian Edwards, eds., (1991): The Macroeconomics
of Populism in Latin America, University of Chicago Press, Chicago.
41
[21] Dustmann, Christian, Barry Eichengreen, Sebastian Otten, Andre Sapir, Guido
Tabellini, and Gylfi Zoega (2017): “Europe’s Trust Deficit: Causes and Reme-
dies" , CEPR Press.
[22] Foster, Chase and Jeffry Frieden (2017): “Crisis of Trust: Socio-economic deter-
minants of Europeans’ confidence in government” Mimeo Harvard University.
[23] Gidron, Noam and Bart Bonikowski (2013): “Varieties of Populism: Literature
Review and Research Agenda" , Harvard University, Weathgerhead Center for
International Affairs, WP n. 13.
[24] Golder, Dawn (2016): “Far Right Parties in Europe" , Annual Review of Political
Trust in pol. parties -0.0357*** 0.0550*** -0.0322*** 0.0531***
(0.00820) (0.00385) (0.00841) (0.00386)
Few immigrants from no-EU 0.0586*** -0.0347***
(0.0205) (0.00837)
Controls, Wave FE, Country FE Yes Yes Yes Yes
Rho 0.157 0.115 0.0249 0.0349
Cluster SE Region Region Region Region
Countries With P With P With P With P
Observations 152,868 152,868 139,898 136,953
Censored observations 45,679 45,679 41,786 40,574
Selection
Rain 0.00128 0.00122 0.00236 0.00239
(0.00154) (0.00152) (0.00165) (0.00166)
Rain * South -0.0222** -0.0221** -0.0224** -0.0234***
(0.00866) (0.00880) (0.00896) (0.00896)
Av. Temperature -0.00532** -0.00510** -0.00447* -0.00501**
(0.00250) (0.00249) (0.00248) (0.00251)
Av. Temperature * South 0.00718 0.00702 0.0131 0.0160
(0.0109) (0.0110) (0.0108) (0.0111)
The table shows Heckman probit estimates of the decisions to vote (Vote) and to vote for a populist party conditional on partici-
pation (Populist). Left-hand side variables: a dummy if a voter has chosen a populist party in the columns Populist and a dummy
if (s)he has participated in the election in the column Vote. The excluded instrument in the populist regression is an indicator
of weather condition on election day. All regressions include country and wave fixed effects. Robust standard errors clustered at
the region level are shown in parenthesis. *** significant 1% or less; ** significant at 5%; * significant at 10% confidence level.
53
Table 3: Direct effects and effects via turnoutEffect of Contribution viaconditional prob of turnout1SD over sample mean
Economic insecurity (PC) 0.103 0.062Trust in pol. parties -0.091 -0.052Few immigrants from no-EU 0.061 0.013
The table shows the direct effect on voting for a populist party of a 1-standard-deviation increase in Eco-nomic insecurity, Trust in political parties and attitudes towards immigrants respectively (first column) andthe contribution through the change induced in turnout. Calculations use estimates in Table 2, column 4.
The table reports summary statistics of characteristics of left-oriented and right oriented voters in our sample.
56
Table 9: Populist parties’ orientation choice
(1) (2)
Left/right orientation Left/right orientation
(increasing in right) (increasing in right)
Share of left oriented * Left-salient factor -0.606* -0.608*
(0.318) (0.349)
Share of right oriented * Right-salient factor 249.4*** 249.1***
(52.86) (57.50)
R-squared 0.264 0.264
Mills ratios No Yes
Cluster SE Country Country
Observation 46 46
The table reports regressions of the orientation of the populist parties in our sample on measures of relative en-
try space. The measure of party orientation is defined on a scale from 1 (extreme left) to 10 (extreme right). In
the second column Mill’s ratio computed from a first stage Probit for the presence of a populist party using as in-
struments the controls in the third column of Table 7 is added. Standard errors clustered at the country level,
are shown in parenthesis. *** significant 1% or less; ** significant at 5%; * significant at 10% confidence level.
Table 10: 3D and Kessel(1) (2) (3) (4)
Rhetoric Protection Concealment Populist 3D
Populist party 2.834*** 1.962*** 1.324*** 37.07***
(0.208) (0.114) (0.0944) (1.808)
Left/Right control Yes Yes Yes Yes
Observations 767 633 853 633
Percentage of sample mean 63% 36% 26% 100%
The table shows OLS regressions of the each of the three indexes of parties of the 3D measure of populism (Anti-Elite Rhetoric,
Protection, and Concealment of the long-term costs of short-term protection) as well as of the principal component of three
measures - the Populist 3D measure - on the van Kessel dummy identifying populist parties. Each regression controls for the
left/right orientation of the party. The last row shows the difference in the score of populist parties from the sample mean.
57
Table 11: Distance from populist platform and populist share of the vote
Dependent variable Coefficient Std. Err. Party FE Year FE Mills ratio Obs. R2
(1) P EI -0.514*** (0.121) Yes Yes Yes 364 0.915
(2) P EU -0.456*** (0.174) Yes Yes Yes 363 0.923
(3) P IQ -0.481** (0.213) Yes Yes Yes 364 0.891
(4) P PD -1.438* (0.845) Yes Yes Yes 264 0.900
The table shows the regression of the distance between the positions of non-populist and populist party on four
separate issues and the share of the vote that went to the populist parties in the last past election. All re-
gressions include year fixed effects and Mill’s ratio computed from a first stage Probit for the presence of a
populist party using as instruments the controls in the third column of Table 7. Robust standard errors are
shown in parenthesis. *** significant 1% or less; ** significant at 5%; * significant at 10% confidence level.
Table 12: Who movesDependent variable Coefficient Std. Err. Party FE Year FE Obs. R2
(1) P EI 0.0695* (0.0382) Yes Yes 73 0.872(2) P EU 0.0501 (0.107) Yes Yes 73 0.887(3) P IQ 0.0771 (0.170) Yes Yes 73 0.807(4) P PD 0.191 (0.732) Yes Yes 59 0.790
The table shows the regression of the change in populist positions on four separate issues and the share of the vote thatwent to the populist parties in the last past election. All regressions include year fixed effects. Robust standard er-rors are shown in parenthesis. *** significant 1% or less; ** significant at 5%; * significant at 10% confidence level.
58
Table A1: Comparison Kessel (K) and Norris & Inglehart (N&I)
Country Party Kessel N&I
AT Freedom Party (FPO) 1 1
AT Alliance for the Future of Austria (BZO) 1 0AT Team Stronach (TS) 1 0BE Flemish Interest (VB) 1 1BE National Front (FN) 1 0BE List Dedecker (LDD) 1 0BG National Movement Simeon the Second (NDSV) 1 0BG Attack Party (Ataka) 1 1BG Law, Order and Justice (RZS) 1 0BG Citizens for European Development of Bulgaria (GERB) 1 0BG VMRO-BND Bulgarian National Movement 0 1BG NFSB National Front for the Salvation of Bulgaria 0 1BG HSS Croatian Peasants Party 0 1CH Swiss People’s Party (SVP) 1 1CH Swiss Democrats (SD) 1 0CH League of Ticinesians (LdTi) 1 0CH Geneva Citizens’ Movement (MCG) 1 0CZ ANO 2011 (ANO) 1 0CZ Public Affairs (VV) 1 0
CZ Dawn of Direct Democracy (Usvit) 1 1DE Party of Democratic Socialism/ The Left (PDS/Linke) 1 0DE NPD National Democratic Party 0 1DE AfD Alternative for Germany 0 1DK Danish People’s Party (DF) 1 1ES Podemos - 1FI True Finns (PS) 1 1FR National Front (FN) 1 1FR MPF Popular Republican Movement 0 1GB British National Party 1 1GB UK Independence Party 1 0GB NF National Front 0 1GR Coalition of the Radical Left (SYRIZA) 1 1GR Independent Greeks (ANEL) 1 1GR Popular Orthodox Rally (LAOS) 1 1GR XA Golden Dawn 0 1GR ND New Democracy 0 1HR Croatian Party of Rights dr. Ante Star?evi? (HSP-AS) 1 1HR Croatian Labourists ? Labour Party (HL-SR) 1 0HR HSS Croatian Peasants Party 0 1HR HDSSB Croatian Democratic Alliance of Slavonia and Baranja 0 1HR HSP Croatian Party of Rights 0 1HR HDZ Croatian Democratic Union 0 1HU FIDESZ-Hungarian Civic Alliance (FIDESZ-MPSZ) 1 1HU Movement for a Better Hungary (Jobbik) 1 1IE Sinn Fein (SF) 1 -IS Citizens’ Movement (BF) 1 -IT Forza Italia (FI) / People for Freedom (PdL) 1 0IT Northern League (LN) 1 1IT 5 Star Movement (M5S) 1 1IT Brothers of Italy (Fdl) 0 1LT Labour Party (DP) 1 0LT Order and Justice Party (TT) 1 0LT DK The Way of Courage 0 1LU Alternative Democratic Reform Party (ADR) 1 1LV All for Latvia 1 1NL List Pim Fortuyn (LPF) 1 0NL Liveable Netherlands (LN) 1 0NL Freedom Party (PVV) 1 1NL SGP Political Reformed Party 0 1NO Progress Party (FrP) 1 1PL Self Defence (SO) 1 0PL Law and Justice (PiS) 1 1PL SP United Poland 0 1PL KNP Congress of the New Right 0 1RO Greater Romania Party (PRM) 1 0RO People’s Party ? Dan Diaconescu (PP-DD) 1 1SE Sweden Democrats (SD) 1 1SI Slovenian National Party (SNS) 1 0SI SDS Slovenian Democratic Party 0 1SI SDS Slovenian Democratic Party 0 1SK Movement for a Democratic Slovakia (HZDS) 1 0SK Direction (Smer) 1 0SK Slovak National Party (SNS) 1 1SK Ordinary People and Independent Personalities (OLaNO) 1 0SK KDH Christian Democratic Movement 0 1TR MHP National Action Party - 1
The table compares the classification of populist parties according to van Kessel withthat in Inglehart and Norris. The sign ”-” indicates that the country is not covered.
Few immigrants from no-EU 0.0406** -0.0479*** 0.0381** -0.0478***(0.0158) (0.00921) (0.0161) (0.00922)
Controls, Wave FE, Country FE Yes Yes Yes YesRho -0.0355 -0.375 -0.396 -0.275Cluster SE Region Region Region RegionCountries With P With P With P With PObservations 139,898 139,898 136,953 136,953Censored observations 75902 75902 74091 74091
The table shows robustness Heckman probit estimates of the decisions to vote and to vote for a populist party when thelatter is defined using the 3D definition. The first two columns use the continuous measure of the 3D definition of pop-ulism. The second set defines as populist all parties with a 3D score above the 75th percentile; the third set uses thisdefinition but expands the set of controls; the last set uses a tighter threshold to define a party as populist (3D score¿ 80 percentile). All regressions include country and wave fixed effects. Robust standard errors clustered at the regionlevel are shown in parenthesis. *** significant 1% or less; ** significant at 5%; * significant at 10% confidence level.
Policy issues1. Increase gov exp/reduce taxes 0(Favor gov exp)-10(Favor reduc taxes) 2006-2014 32. Deregulation 0(Oppose der)-10(Favor Der) 2006-2014 33. Redistribution of wealth 0(Favor)-10(Oppose) 2006-2014 34. State intervention in economy 0(Favor)-10(Oppose) 2014 15. Civil liberties vs law&order 0(Promote liberties)-10(Support L&O) 2006-2014 36. Social lifestyle 0(Support liberal pol)-10(Oppose lib pol) 2006-2014 37. Role of religion in politics 0(Oppose)-10(Support) 2006-2014 38. Immigration policy 0(Oppose tough policy)-10(Support tough pol) 2006-2014 39. Integration of immigrants 0(Favor multicul. policy)-10(Support multicul pol) 2006-2014 310. Urban versus rural interest 0(Support urban)-10(Support rural) 2006-2014 311. Environment 0(Support environment)-10(Support growth) 2010, 2014 212. Cosmopolitanism 0(Support cosm.)-10(Support nationalism) 2006 113. Regional decentralization 0(Support political decentr.)-10(Oppose decentr.) 2006-2014 314. International security and peace keeping 0(Support int. sec)-10(Oppose int. sec.) 20,102,014 215. Position towards US power in world affairs 0(Oppose)-10(Support) 2006 116. Rights to ethnic minorities 0(Support more rights)-10(Oppose) 2006-2014 3
Salience1. Salience of anti-establishment and anti-elite rhetoric 0(Not important at all)-10(Extremely important) 2014 12. Salience of reducing political corruption 0(Not important at all)-10(Extremely important) 2014 1
The table lists the CHES questions that we use to define the average positions of the political parties on eachof the four domains we consider (European integration, EU policy, Ideological positions; Policy issues). It showsthe years in which these items are covered by CHES and the range over which the party position is defined.