388
Jefferson County Port Hadlock UGA Sewer Facilit y Plan September 2008 Volume 1 of 2

8/14/2019 Port Hadlock Sewer Facility Plan 0908
http://slidepdf.com/reader/full/port-hadlock-sewer-facility-plan-0908 1/387
Jefferson County
Port Hadlock UGA Sewer Facility Plan
September 2008
Volume 1 of 2

8/14/2019 Port Hadlock Sewer Facility Plan 0908
http://slidepdf.com/reader/full/port-hadlock-sewer-facility-plan-0908 2/387

8/14/2019 Port Hadlock Sewer Facility Plan 0908
http://slidepdf.com/reader/full/port-hadlock-sewer-facility-plan-0908 3/387

8/14/2019 Port Hadlock Sewer Facility Plan 0908
http://slidepdf.com/reader/full/port-hadlock-sewer-facility-plan-0908 4/387

8/14/2019 Port Hadlock Sewer Facility Plan 0908
http://slidepdf.com/reader/full/port-hadlock-sewer-facility-plan-0908 5/387

8/14/2019 Port Hadlock Sewer Facility Plan 0908
http://slidepdf.com/reader/full/port-hadlock-sewer-facility-plan-0908 6/387
Port Hadlock UGA Sewer Facility Plan…
Climate.........................................................................................................................2-13
Surface Water/Wetlands..............................................................................................2-13
Groundwater ................................................................................................................2-13
Related Studies ............................................................................................................2-16
3. Permits, Requirements and Regulations ......................................................3-1
Federal Regulations .....................................................................................................3-1Federal Water Quality Acts ...............................................................................3-1
Federal Effluent Limitations..............................................................................3-2
National Environmental Protection Act.............................................................3-3
Federal Standards for Use or Disposal of Sludge ..............................................3-3
Clean Air Act .....................................................................................................3-5
EPA Reliability Criteria.....................................................................................3-5
Historical and Archaeological Sites...................................................................3-8
Floodplains, Wetlands, and Flood Insurance.....................................................3-9
Agricultural Lands .............................................................................................3-9
Coastal Zone Management ................................................................................3-9
Wild and Scenic Rivers......................................................................................3-9
Fish and Wildlife Protection ..............................................................................3-9Endangered Species Act ....................................................................................3-9
Magnuson-Stevens Fishery Conservation and Management Act ......................3-10
Public Participation............................................................................................3-10
State Policies................................................................................................................3-11
Water Quality Standards for Surface Waters.....................................................3-11
State Environmental Policy Act.........................................................................3-12
State Environmental Review Process; Department of Ecology
Documentation ............................................................................................3-12
National Pollutant Discharge Elimination System Permit.................................3-13
State Waste Discharge Permit, Wastewater Effluent.........................................3-13
Washington State Standards for Use and Disposal of Sludge ...........................3-13
Washington Department of Ecology Criteria for Sewage WorksDesign..........................................................................................................3-13
Standards for Water Reclamation ......................................................................3-14
Washington Department of Natural Resources/Shellfish Closure
Zone.............................................................................................................3-15
Office of Archaeology and Historic Preservation Approval..............................3-15
Local Policies ..............................................................................................................3-16
SEPA Review ....................................................................................................3-16
Critical Areas Review........................................................................................3-17
Shoreline Management Program........................................................................3-17
International Fire Code / National Fire Protection Association.........................3-17
International Building Code / International Building Code /
Washington State Energy Code...................................................................3-18Olympic Region Clean Air Agency...................................................................3-18
Jefferson County Solid Waste Division.............................................................3-18
4. Population, Flow and Loads...........................................................................4-1Population Forecasts....................................................................................................4-1
Background........................................................................................................4-1
Data Elements Used for Population Forecasting ...............................................4-1
Planning Horizons..............................................................................................4-6
ii
8/14/2019 Port Hadlock Sewer Facility Plan 0908
http://slidepdf.com/reader/full/port-hadlock-sewer-facility-plan-0908 7/387
...TABLE OF CONTENTS
Population Projections .......................................................................................4-7
Projected Wastewater Flows........................................................................................4-8
Flow Generation Criteria ...................................................................................4-8
Wastewater Flow Projections ............................................................................4-13
Wastewater Loading Projections .................................................................................4-15
Load Generation Criteria ...................................................................................4-15
Solids Loading Projections ................................................................................4-16
5. Collection System Alternatives......................................................................5-1Wastewater Collection Alternatives ............................................................................5-1
Alternatives Considered.....................................................................................5-1
Rejected Alternatives.........................................................................................5-1
Alternatives Considered for Further Evaluation..........................................................5-2
Conventional Gravity Sewers ............................................................................5-2
Pressurized Wastewater Collection Systems (STEP & Grinder Pumps)...........5-6
Evaluation of Collection System Alternatives.............................................................5-9
Collection System Alternatives..........................................................................5-9
Evaluation Criteria.............................................................................................5-9
Life Cycle Cost Estimating..........................................................................................5-11Cost Assumptions ..............................................................................................5-11
Cost Assumptions for Pressurized Sewers: STEP and Grinder Pump
Systems........................................................................................................5-11
Evaluation of Alternatives .................................................................................5-12
Recommended Collection System Alternative............................................................5-14
Stakeholder Workshop Process..........................................................................5-14
Recommendation ...............................................................................................5-14
Population and System Phasing...................................................................................5-15
6. Effluent Discharge/Reuse Alternatives .........................................................6-1Treatment Plant Effluent – Discharge vs. Re-Use.......................................................6-1
Surface Water Discharge vs. Land Application.................................................6-1Discharge and Reuse Systems – Treatment Requirements ................................6-1
Discharge/Re-Use Alternatives....................................................................................6-2
Alternatives Considered.....................................................................................6-2
Rejected Alternatives.........................................................................................6-3
Alternatives Considered for Further Evaluation..........................................................6-3
Irrigation at Agronomic Rates ...........................................................................6-3
Groundwater Recharge by Surface Percolation – Slow-Rate Infiltration..........6-5
Groundwater Recharge by Surface Percolation – Rapid-Rate Infiltration.........6-6
Constructed Wetlands........................................................................................6-7
Evaluation of Discharge/Reuse Alternatives ...............................................................6-8
Evaluation Criteria.............................................................................................6-8
Life Cycle Cost Estimating..........................................................................................6-8Cost Assumptions ..............................................................................................6-8
Summary of Life Cycle Costs............................................................................6-10
Summary of Evaluation of Disposal/Reuse Alternatives.............................................6-10
Recommended Re-Use Alternative .............................................................................6-13
Stakeholder Workshop Process..........................................................................6-13
Recommendation ...............................................................................................6-13
7. Wastewater Treatment Alternatives.............................................................7-1
iii

8/14/2019 Port Hadlock Sewer Facility Plan 0908
http://slidepdf.com/reader/full/port-hadlock-sewer-facility-plan-0908 8/387
Port Hadlock UGA Sewer Facility Plan…
Liquid Process Treatment Requirements.....................................................................7-1
Discharge/Reuse Method Determines Treatment ..............................................7-1
Levels of Treatment ...........................................................................................7-1
Reliability and Redundancy Requirements........................................................7-2
Wastewater Treatment Alternatives.............................................................................7-3
Alternatives Considered.....................................................................................7-3
Rejected Alternatives.........................................................................................7-4Alternatives Considered for Further Evaluation..........................................................7-5
Sequencing Batch Reactor + Filter ....................................................................7-5
Membrane Bioreactor ........................................................................................7-7
Evaluation of Wastewater Treatment Alternatives......................................................7-9
Evaluation Criteria.............................................................................................7-9
Life Cycle Cost Estimating..........................................................................................7-10
Cost Assumptions ..............................................................................................7-10
Summary of Life Cycle Costs............................................................................7-11
Summary of Wastewater Treatment Evaluation ................................................7-11
Recommended Wastewater Treatment Alternative .....................................................7-11
Stakeholder Workshop Process..........................................................................7-11
Recommendation .........................................................................................................7-11Disinfection Alternatives.............................................................................................7-12
Alternatives Considered.....................................................................................7-12
Rejected Alternatives.........................................................................................7-13
Alternatives Considered for Further Evaluation..........................................................7-13
Liquid Sodium Hypochlorite .............................................................................7-13
UV Disinfection.................................................................................................7-15
Evaluation of Disinfection Alternatives ......................................................................7-16
Evaluation Criteria.............................................................................................7-16
Summary of Disinfection Evaluation.................................................................7-16
Recommended Disinfection Alternative......................................................................7-17
Stakeholder Workshop Process..........................................................................7-17
Recommendation .........................................................................................................7-18Solids Handling/Reuse Alternatives............................................................................7-18
Alternatives Considered.....................................................................................7-18
Rejected Alternatives.........................................................................................7-19
Alternatives Considered for Further Evaluation..........................................................7-19
Storage and Decanting .......................................................................................7-19
Thickening .........................................................................................................7-20
Dewatering.........................................................................................................7-21
Haul Locally to Port Townsend.........................................................................7-22
Haul Remote to Port Angeles WWTP ...............................................................7-22
Contracted Haul and Reuse................................................................................7-23
Evaluation of Solids Handling/Treatment/Reuse Alternatives....................................7-24
Evaluation Criteria.............................................................................................7-24Summary of Solids Handling/Treatment/Reuse Evaluation ..............................7-24
Recommended Solids Handling and Treatment/Reuse System...................................7-26
8. Recommended Alternative and Implementation.........................................8-1Summary of Recommendations...................................................................................8-1
Gravity Collection System.................................................................................8-1
Effluent Reuse: Ground Water Recharge by Rapid-Rate Surface
iv
8/14/2019 Port Hadlock Sewer Facility Plan 0908
http://slidepdf.com/reader/full/port-hadlock-sewer-facility-plan-0908 9/387
...TABLE OF CONTENTS
Percolation...................................................................................................8-1
Wastewater Treatment – Membrane Bioreactor (MBR)....................................8-2
Effluent Disinfection – Sodium Hypochlorite ...................................................8-2
Solids Handling – Decanting Contracted Haul and Reuse ................................8-3
Evaluation of Wastewater Treatment Plant Locations.................................................8-5
Locations Considered ........................................................................................8-5
Evaluation Criteria.............................................................................................8-7Summary of Treatment Plant Location Evaluation............................................8-7
Recommended Treatment Plant Location..........................................................8-7
Candidate Treatment Plant Sites........................................................................8-9
Proposed Site Layout...................................................................................................8-9
Process Diagram and Site Layout ......................................................................8-9
Hydraulic Profile................................................................................................8-9
Land Needs Estimates for Recommended Treatment & Reuse System ............8-14
Summary of Estimated Costs.......................................................................................8-14
Planning level Costs vs. Life Cycle Costs .........................................................8-14
Planning Level Cost Summary ..........................................................................8-14
Staffing Requirements .......................................................................................8-15
Implementation Schedule ............................................................................................8-15
9. Cost and Financing .........................................................................................9-1Financial Program........................................................................................................9-1
Sources of Capital Funding .........................................................................................9-1
Types of Capital Funding Sources...............................................................................9-1
Grants.................................................................................................................9-1
Low-Interest Loans ............................................................................................9-3
Bonds .................................................................................................................9-3
Other Sources.....................................................................................................9-4
Users ..................................................................................................................9-5
Funding Initial Capital Costs.......................................................................................9-6
Funding Example – Shared Capital Costs ...................................................................9-8Strategies for Recovering Capital Cost from Users.....................................................9-10
Cost Implications of User Recovery Strategies...........................................................9-12
When to Pay for Sewer................................................................................................9-13
Current Sewer Expansion Examples ...........................................................................9-14
Operations and Maintenance Cost – Monthly Rates ...................................................9-15
What Does It Mean?....................................................................................................9-16
How to Continue to Move Forward and Reduce Costs ...............................................9-16
Policy Issues for Future Discussion.............................................................................9-17
10. Public Involvement and Outreach.................................................................10-1Stakeholder Workshop Process ...................................................................................10-1
Public Meetings ...........................................................................................................10-1Project Website............................................................................................................10-2
Project Mailings...........................................................................................................10-2
Comment Tracking and Response Process..................................................................10-3
v

8/14/2019 Port Hadlock Sewer Facility Plan 0908
http://slidepdf.com/reader/full/port-hadlock-sewer-facility-plan-0908 10/387
Port Hadlock UGA Sewer Facility Plan…
Appendices
A. Hydrogeological Evaluation Report
B. Public Outreach – Meeting Summaries
C. Comparative Life Cycle Cost Estimates
D. Planning Level Cost Estimates for Recommended Alternative
E. Reliability and Redundancy Requirements for Reclamation and Reuse Standards
vi

8/14/2019 Port Hadlock Sewer Facility Plan 0908
http://slidepdf.com/reader/full/port-hadlock-sewer-facility-plan-0908 11/387
...TABLE OF CONTENTS
LIST OF TABLES
No. Title
ES-1 Phasing Areas within the Port Hadlock/Irondale UGA...............................................ES-4
ES-2 Estimated Land Areas for Wastewater Facilities.........................................................ES-12
ES-3 Initial Capital Costs through 2015 (in thousands) .......................................................ES-12
ES-4 Capital Recovery Strategies.........................................................................................ES-17
ES-5 Estimate Monthly Sewer Rate .....................................................................................ES-18
ES-6 Implementation Schedule ............................................................................................ES-19
2-1 Irondale and Port Hadlock UGA Land Use and Zoning Districts ...............................2-5
2-2 Jefferson County and City of Port Townsend 20-Year Population
Projection and Distribution..........................................................................................2-7
3-1 Ceiling Concentrations for Metals in Land-Applied Sludge .......................................3-4
3-2 Metal Concentration Limits for Bulk Sewage Sludge Land Application....................3-5
3-3 Summary of EPA Design Criteria for System and ComponentReliability ....................................................................................................................3-6
3-4 Reliability Class System in the Orange Book..............................................................3-14
4-1 Planning Zone Designations within the Port Hadlock/Irondale UGA.........................4-2
4-2 Land Area by Planning Zone within the Port Hadlock/Irondale UGA........................4-4
4-3 Phasing Areas within the Port Hadlock/Irondale UGA...............................................4-6
4-4 Summary of Population Projections within the Port Hadlock/Irondale Sewer
Service Area ................................................................................................................4-9
4-5 Service Area and Estimated Population Equivalents...................................................4-11
4-6 Wastewater Peaking Factors........................................................................................4-12
4-7 2010 Wastewater Flow Projections .............................................................................4-13
4-8 2024 Wastewater Flow Projections .............................................................................4-144-9 2030 Wastewater Flow Projections .............................................................................4-15
4-10 Year 2010 Condition Solids Loading Projections .......................................................4-17
4-11 Year 2024 Condition Solids Loading Projections .......................................................4-18
4-12 Year 2030 Condition Wastewater Loading Projections ..............................................4-19
5-1 Summary of 20-Year Life Cycle Costs........................................................................5-12
5-2 Summary of Alternatives Evaluation...........................................................................5-13
5-3 Expected Number of Sewer System Connections by Phase ........................................5-15
6-1 Water Quality Requirements for Reuse Projects .........................................................6-2
6-2 Treatment and Quality Requirements for Reclaimed Water Used for
Irrigating Crops............................................................................................................6-46-3 Criteria used for Estimating Cost Quantities ...............................................................6-9
6-4 Summary of Alternatives Evaluation...........................................................................6-11
7-1 Summary of Treatment Requirements for Various Disposal/Reuse Options ..............7-1
7-2 Water Quality Requirements for Reuse Projects .........................................................7-2
7-3 Criteria Used for Estimating Treatment Plant Cost Quantities....................................7-10
7-4 Summary of Wastewater Treatment Alternatives Evaluation......................................7-12
7-5 Summary of Disinfection Alternatives Evaluation......................................................7-17
vii

8/14/2019 Port Hadlock Sewer Facility Plan 0908
http://slidepdf.com/reader/full/port-hadlock-sewer-facility-plan-0908 12/387
Port Hadlock UGA Sewer Facility Plan…
7-6 Summary of Solids Handling/Treatment/Reuse Alternatives Evaluation....................7-25
8-1 Design Data for Membrane Bioreactor Alternative.....................................................8-5
8-2 Summary of Wastewater Treatment Plant Site Evaluation..........................................8-8
8-3 Summary of Wastewater System Costs .......................................................................8-16
8-4 Implementation Schedule ............................................................................................8-15
9-1 Initial Capital Costs through 2015 (in thousands) .......................................................9-6
9-2 Initial Capital Cost through 2015 ................................................................................9-7
9-3 Financing Common/Shared Costs (General and Local) through 2015........................9-8
9-4 Example of Mixing Funding Sources ..........................................................................9-10
9-5 Estimated Repayment Stream through 2024 and 2025-2030 ......................................9-11
9-6 Compare User Recovery Strategies .............................................................................9-12
9-7 Compare Alternatives – When to Pay for Sewer.........................................................9-14
9-8 Current Sewer Expansion Examples ...........................................................................9-14
9-9 Estimated Monthly Sewer Rate ...................................................................................9-15
viii

8/14/2019 Port Hadlock Sewer Facility Plan 0908
http://slidepdf.com/reader/full/port-hadlock-sewer-facility-plan-0908 13/387
...TABLE OF CONTENTS
ix
LIST OF FIGURES
No. Title
ES-1 Vicinity Map................................................................................................................ES-1
ES-2 Service Area Boundaries and Land Use/Zoning..........................................................ES-3
ES-3 Sewer Phasing and Implementation.............................................................................ES-6
ES-4 Alternative Treatment Plant and Effluent Locations Evaluation.................................ES-10
ES-5 Candidate Sites for Wastewater Treatment Plant ........................................................ES-11
ES-6 Liquids and Solids Stream Process Diagram...............................................................ES-14
ES-7 Site Development Plan ................................................................................................ES-15
ES-8 Hydraulic Profile .........................................................................................................ES-16
2-1 Vicinity Map................................................................................................................2-2
2-2 Irondale & Port Hadlock UGA Sewer Service Area and Zoning Map........................2-4
2-3 Topographic Map ........................................................................................................2-9
2-4 Soils Map of the Port Hadlock Area............................................................................2-11
2-5 Erosion and Slide Hazard Areas ..................................................................................2-12
2-6 Seismic Hazard Areas..................................................................................................2-14
2-7 Wetlands and Environmentally Sensitive Areas..........................................................2-15
2-8 Wellheads Protection...................................................................................................2-17
2-9 CARA Locations .........................................................................................................2-18
4-1 Pt. Hadlock Future Land Use and Zoning Map...........................................................4-3
4-2 Sewer Phasing and Implementation Areas ..................................................................4-5
4-3 Graph of Population Projections for the Pt. Hadlock/Irondale Sewer Service Area ...4-10
5-1 Conventional Gravity Sewer System Service Connection ..........................................5-3
5-2 Proposed Gravity Collection System...........................................................................5-5
5-3 Septic Tank Effluent Pump (STEP) System Service Connection................................5-6
5-4 Proposed Pressurized Collection System.....................................................................5-85-5 Proposed Dual Technology (Gravity/Pressurized) Collection System........................5-10
7-1 Sequencing Batch Reactor + Filter ..............................................................................7-5
7-2 Membrane Bioreactor Process Schematic and Example Facility in
Bandon Dunes, Oregon................................................................................................7-8
7-3 Sodium Hypochlorite Feed Pumps at Vashon Island, Washington (left) and
Chlorine Contact Tank at Marysville, Washington .....................................................7-14
8-1 Alternative Treatment Plant & Effluent Reuse Locations ...........................................8-6
8-2 Candidate Sites for Wastewater Treatment Plant ........................................................8-10
8-3 Process Flow Diagram.................................................................................................8-11
8-4 Site Development Plan ................................................................................................8-128-5 Hydraulic Profile .........................................................................................................8-13

8/14/2019 Port Hadlock Sewer Facility Plan 0908
http://slidepdf.com/reader/full/port-hadlock-sewer-facility-plan-0908 14/387
ACKNOWLEDGEMENTS
The following firms, individuals, and citizen advisory groups have contributed to the
preparation of this report:
Jefferson County Board of County Commissioners
Phil Johnson (District 1), David Sullivan (District 2), John Austin (District 3)
Irondale/Port Hadlock Sewer Project Stakeholders Group
Jefferson County Administration
Interim County Administrator, Dennis Richards
Allen Sartin, Central Services Director
Jefferson County Public Works Department
Frank Gifford, Public Works Director
Jefferson County Department of Community Development
Al Scalf, Community Development Director
Tetra Tech, Inc.
Kevin Dour, Project Manager
James Santroch, Sr. Project Engineer
Raymund Vargas, Project Engineer
Triangle Associates, Inc.
Bob Wheeler, Project Manager
Ellen Blair, Project Assistant
Katy Isaksen & Associates
Katy Isaksen, Financial Analyst
HWA GeoSciences Inc.
Arnie Sugar, Environmental Geologist
x

8/14/2019 Port Hadlock Sewer Facility Plan 0908
http://slidepdf.com/reader/full/port-hadlock-sewer-facility-plan-0908 15/387

8/14/2019 Port Hadlock Sewer Facility Plan 0908
http://slidepdf.com/reader/full/port-hadlock-sewer-facility-plan-0908 16/387
Port Hadlock UGA Sewer Facility Plan…
Figure ES-1. Vicinity Map
ES-2

8/14/2019 Port Hadlock Sewer Facility Plan 0908
http://slidepdf.com/reader/full/port-hadlock-sewer-facility-plan-0908 17/387
…EXECUTIVE SUMMARY
F i g u r e E S - 2 . S e r v i c e A r e a B o u n d a r i e s a n d L a n d / U s e Z o n i n g
ES-3
8/14/2019 Port Hadlock Sewer Facility Plan 0908
http://slidepdf.com/reader/full/port-hadlock-sewer-facility-plan-0908 18/387
Port Hadlock UGA Sewer Facility Plan…
PERMITS, REQUIREMENTS, AND REGULATIONS
Regulations with which the sewage facilities must comply include the following:
• Federal Water Quality Acts
• Federal and state National Pollutant Discharge Elimination System effluent limitations
• National and state Environmental Policy Acts
• Federal and state standards for use or disposal of sludge
• Federal and state reliability criteria
• Endangered Species Act and other federal environmental regulations
• Washington Department of Ecology Criteria for Sewage Works Design
• Washington Department of Ecology and Department of Health Water Reclamation and ReuseStandards
• Washington State Waste Discharge Permit
• Uniform Fire Code / National Fire Protection Association Standards• Uniform Building Code / International Building Code / Washington State Energy Code
• Local permits and reviews
• Olympic Region Clean Air Agency.
FLOW AND LOAD ANALYSIS
Future (design) flows and loads were determined using population projections, unit flow and loadingrates, and peaking factors.
Population, Flow and Loading Projections
Tt staff prepared population and wastewater flow and loading projections for a 6-year horizon, a 20-yearhorizon, and a buildout condition. Tt developed estimates of wastewater flows, loads, and peaking factorsanticipated for the Port Hadlock and Irondale study area using population data provided by JeffersonCounty. These estimates include flows from residential, commercial, and institutional sources.
Commercial Flow and Loading Projections
Tt developed projected commercial flows, loads, and peaking factors based on recent commercial watermeter data provided by Jefferson County PUD No. 1, planned commercial acreage within the sewerboundary, and flow generation factors based upon data from similar communities.
SEWER SYSTEM PHASING
Wastewater flows and loads were estimated for a sewer system developing and expanding in phases.These phases are based upon sub-areas within the 20-year sewer boundary described in Table ES-1 andshown in Figure ES-3.
ES-4

8/14/2019 Port Hadlock Sewer Facility Plan 0908
http://slidepdf.com/reader/full/port-hadlock-sewer-facility-plan-0908 19/387
…EXECUTIVE SUMMARY
TABLE ES-1.PHASING AREAS WITHIN THE PORT HADLOCK/IRONDALE UGA
Phasing Area Description Total Acres
Core Area Initial Commercial Area within the 6-year planning boundary. This
will be the first area to be implemented.
298
Alcohol Plant Area Area east of the Core Area, area known as the Old Alcohol Plant.Location of the Hadlock Inn. This area is included in the initial 6-yearboundary and would be part of the initial implementation.
53
Rhody Drive Area Area along SR-19 from Somerville Road to approximately theintersection with Irondale Road. It is anticipated that this area wouldimplement sewers after the completion of the initial phase within the6-year boundary.
187
Residential Area #1 This area is located northeast of the Core Area. It is anticipated sewerswould extend from the Core Area to these residential areas first. Thisarea is along Irondale Road from Matheson Street to Maple Street.
109
Residential Area #2 This area is located south of the Core Area. It is anticipated sewerswould extend from the core area into this residential area as itdeveloped and as the need for sewers increased due to existing septicsystems failing. This area is south of SR 116 from Hunt Road toChristney Road.
138
Residential Area #3 This area is located north of the Core Area and extends to ChimacumCreek. It is anticipated sewers would extend north from the Core Areaalong Cedar Avenue and Mason Street. This area would develop as theresidential area continues to develop and existing septic systems fail.
505
Total 1290
A summary of estimated residential and commercial population projections for year 2010, 2024 (theCounty Comprehensive Plan 20-year planning horizon), and 2030 (the Wastewater Facilities Plan 20-yearplanning horizon) are presented in Chapter 4 of the master document, Table 4-5, but are not included inthis Executive Summary.
Projections were generated for conventional gravity sewers and for septic tank effluent pump systems(STEP). The systems differ in the amount of inflow and infiltration as well as the concentrations of pollutants, such as biochemical oxygen demand (BOD) and total suspended solids (TSS). The projectionsfor flow, BOD, TSS, and nitrogen (TKN) are summarized in Chapter 4 of the master document,Tables 4-7, 4-8 and 4-9, but are not included in this Executive Summary.
ES-5

8/14/2019 Port Hadlock Sewer Facility Plan 0908
http://slidepdf.com/reader/full/port-hadlock-sewer-facility-plan-0908 20/387
Port Hadlock UGA Sewer Facility Plan…
F i g u r e E S - 3 . S e w e r P h a s i n g a n d I m p l e m e n t a t i o n
A r e a s
ES-6

8/14/2019 Port Hadlock Sewer Facility Plan 0908
http://slidepdf.com/reader/full/port-hadlock-sewer-facility-plan-0908 21/387
…EXECUTIVE SUMMARY
COLLECTION SYSTEM
Tt evaluated five different types of collection systems: conventional gravity sewers, small-diametergravity (SDG) sewers, vacuum sewers, septic tank effluent pumping (STEP) sewers, and grinder pumpsewer systems. An initial screening shortlisted three alternatives: conventional gravity, STEP sewers, andgrinder pumps. The present worth cost of each shortlisted alternative was estimated in addition to an
evaluation of qualitative factors.
Following this analysis, Tt and County staff participated in a stakeholder workshop on collection systemalternatives where the results of the analysis were presented and questions were taken from staff and thepublic. Based on the results of the analysis and input received at this workshop, the recommendedcollection system strategy is conventional gravity. The detailed discussion of alternatives and analysis of the collection system evaluation is located in Chapter 5 of the master document.
EFFLUENT DISCHARGE/WATER RECLAMATION
Only one alternative was considered for effluent discharge: a marine outfall to Port Townsend Bay.Alternatives considered for effluent reuse (beneficial water reclamation) included irrigation at agronomicrates, natural wetlands, constructed beneficial use wetlands, groundwater recharge by surface percolation– slow rate, groundwater recharge by surface percolation – rapid rate, and a salinity barrier.
Alternatives removed from further consideration included the marine outfall, natural wetlands, and asalinity barrier. These were eliminated because they were not feasible for either regulatory orenvironmental reasons.
All remaining reclamation alternatives assumed that effluent would meet at least Washington Statereclaimed water standards for Class A reclaimed water, based on discussions with the Departments of Ecology and Health.
Irrigation at agronomic rates (with winter-time storage), groundwater recharge by surface percolation(both slow-rate and rapid-rate), and constructed wetlands were evaluated. The results of the evaluation
and life cycle cost analysis recommended groundwater recharge by surface percolation – rapid rate foreffluent reuse. The detailed discussion of alternatives and analysis of the effluent discharge/waterreclamation alternatives is located in Chapter 6 of the master document.
It should be noted that in water reclamation facilities, the reclaimed water can be used for a beneficialpurpose. The identified beneficial reuse is groundwater recharge. The generator of the reclaimed watermay retain the ownership rights for this useful resource. Jefferson County intends to retain the ownershiprights to any reclaimed water generated as part of the work described in this document.
Specific design of any percolation systems would be contingent upon results of a detailed hydrogeologicand water quality study, to be performed during later predesign efforts.
TREATMENT PROCESSESSeveral treatment processes were considered for a new treatment plant for Pt. Hadlock. The detaileddiscussions of alternatives and analyses of each process is located in Chapter 7 of the master document.
Liquid Treatment Process
Alternatives considered for the liquid treatment process were suspended growth, fixed-film, and physical-chemical treatment. All alternatives had to be able to meet Class A reclaimed water standards. Two short-
ES-7

8/14/2019 Port Hadlock Sewer Facility Plan 0908
http://slidepdf.com/reader/full/port-hadlock-sewer-facility-plan-0908 22/387
Port Hadlock UGA Sewer Facility Plan…
list alternatives were developed for detailed analysis: Sequencing Batch Reactor (SBR) plus Filter andMembrane Bioreactor (MBR).
The final analysis of treatment process alternatives included an evaluation of qualitative criteria and lifecycle costs. A stakeholder workshop was held with County staff and the public to review the varioustreatment processes being considered, identify advantages and drawback, and to take feedback. Based on
the results of the evaluation process and the stakeholder workshop, an MBR system for the liquidtreatment process is recommended.
Disinfection Alternatives
Several disinfection alternatives were evaluated:
• Hypochlorite disinfection using 12-percent liquid hypochlorite and chlorine contact basins
• On-site generation of 0.8-percent hypochlorite using salt, water, and electricity and chlorinecontact basins
• Chlorine Gas
• Ultraviolet (UV) disinfection (several types evaluated).
Because Class A Reclaimed Water Standards require a chlorine residual in the reclaimed water piping, allalternatives were assumed to have some minimal hypochlorite feed equipment.
Chlorine gas and on-site generation of sodium hypochlorite were eliminated from consideration. Chlorinegas because of safety and sodium hypochlorite generation because of operational costs. UV disinfectionwas eliminated from consideration due to the high initial capital costs, high O&M costs and therequirement for chlorine residual discussed above.
The recommended disinfection alternative is hypochlorite feed using 12-percent liquid hypochlorite andchlorine contact basins. This recommendation is based on cost and the requirement of maintaining achlorine residual in the reclaimed water piping.
Solids Handling and Treatment Alternatives
Based on the small size of the system, relatively simple solids handling alternatives were considered.More complex alternatives, such as on site digestion, require expensive solids handling equipment andstringent recordkeeping and monitoring; therefore, they were not short-listed. The following alternativeswere short-listed for solids handling:
• Decanting
• Thickening
• Dewatering.
The following alternatives were short listed for solids treatment or reuse to be implemented inconjunction with a recommended solids handling strategy:
• Haul Locally to Port Townsend Composting
• Haul Remote to Port Angeles WWTP
• Contracted Haul and Reuse.
Based upon the results of the alternative evaluation, the Storage and Decanting alternative for SolidsHandling is recommended and the Contract Haul/Reuse alternative for Treatment/Reuse is recommended.
ES-8

8/14/2019 Port Hadlock Sewer Facility Plan 0908
http://slidepdf.com/reader/full/port-hadlock-sewer-facility-plan-0908 23/387
…EXECUTIVE SUMMARY
These recommendations are based upon the simplicity of the processes, the lowest initial capital cost, andthe flexibility to switch to another system for handling and/or reuse in the future.
Each of the two recommendations has the lowest 20-year life cycle cost based upon today’s available costdata. This is a “pay-as-you-go” system. If the economics of these options change in the future, the Countywill have very little capital investment in solids handling/reuse equipment and can comfortably explore
other options.
Wastewater Treatment Plant Location
Alternative Treatment Plant Locations Considered
An evaluation of alternative wastewater treatment plant locations and effluent reuse sites was conducted.These alternative locations included a the central service area, south of the service area, adjacent to H.J.Carroll Park, the airport, and the Chimacum High School vicinity. The alternative locations evaluated areshown in Figure ES-4.
Candidate Treatment Plant Sites
An evaluation of qualitative criteria and comparative life cycle costs recommended that a location southof the service area be chosen for the treatment plant and effluent reuse site. Figure ES-5 shows candidatetreatment plant sites south of the service area. It is recommended the County continue to work tonegotiate a land purchase agreement and/or procure a site prior to the beginning of final design.
IMPLEMENTATION
The recommended plan includes the following:
• Collection System—Gravity Collection System through the service area with local pumpstations.
• Treatment—Membrane bioreactor treatment plant with anoxic basins for nitrogen removal,aerobic basins for biological oxidation, and immersed membranes for clarification.Disinfection using 12-percent sodium hypochlorite and chlorine contact basins. Solidshandling using decanting and storage on-site, and solids treatment using contracted haultreatment and disposal.
• Storage—3-days’ emergency/wintertime storage for effluent reuse and 3-days’ emergencystorage for WWTP using open earthen basins. Lined basins for emergency storage andunlined basins for wintertime storage.
• Conveyance—Pumps and piping from the collection system to the treatment plant through amain influent pump station near the intersection of Ness’ Corner Road and Shotwell Road.Effluent pumping from the treatment plant to surface percolation basins.
• Reuse—Land application using rapid rate surface percolation basins.
ES-9

8/14/2019 Port Hadlock Sewer Facility Plan 0908
http://slidepdf.com/reader/full/port-hadlock-sewer-facility-plan-0908 24/387
Port Hadlock UGA Sewer Facility Plan…
F i g u r e E S - 4 . A
l t e r n a t i v e T r e a t m e n t P l a n t a n d E f f l u e n t L o c a t i o n s E v a l u a t e d
ES-10

8/14/2019 Port Hadlock Sewer Facility Plan 0908
http://slidepdf.com/reader/full/port-hadlock-sewer-facility-plan-0908 25/387
…EXECUTIVE SUMMARY
F i g u r e E S - 5 . C
a n d i d a t e S i t e s f o r W a s t e w a t e r T r e a t m e n t P l a n t
ES-11

8/14/2019 Port Hadlock Sewer Facility Plan 0908
http://slidepdf.com/reader/full/port-hadlock-sewer-facility-plan-0908 26/387
Port Hadlock UGA Sewer Facility Plan…
The estimated land needs for the recommended facilities is shown in Table ES-2.
TABLE ES-2.ESTIMATED LAND AREAS FOR WASTEWATER FACILITIES
Description Estimated Land Area (acres)
Wastewater Treatment Plant:
2030 Treatment Plant Footprint 3 acres
Area for Future Expansion 2 acres
Buffer/Setback 1 acre
Total, Wastewater Treatment Plant 6 acres
Effluent Reuse Area:
Infiltration Basin (Sized for 2030 Flow) 3 acres
Reserve/Redundancy 3 acres
Buffers 3 acres
Total, Effluent Reuse Area 9 acresInfluent Pump Station:
Pump Station Site 1 acre
Total Estimated Land Need 16 acres
The recommended plan accounts for phased growth in the service area. It also provides flexibility toJefferson County to accommodate a wide range of future possibilities with the reclaimed water from thetreatment plant, such as in-town irrigation systems, nearby forest irrigation, additional land application assites are identified in the future, and summertime irrigation at the nearby Little League fields and/or H.J.Carroll Park. Any of these strategies would benefit the local environment by reducing the amount of
groundwater pumped out of the local aquifer and/or helping to replenish the groundwater. Estimatedcapital costs for the initial facilities through the year 2018 are presented in Table ES-3
TABLE ES-3.INITIAL CAPITAL COSTS THROUGH 2015 (IN THOUSANDS)
Est. Capital (2008estimates escalated to$2009) 2010 2011 2012 2013 2014 2015
General 19,467 - 1,337 2,206 - -
Local 6,418 - - 3,140 - -
On-site Conn. 1,412 247 282 321 367 490
Total Capital By Year 27,297 247 1,619 5,667 367 490
Cumulative Capital 27,297 27,544 29,163 34,830 35,197 35,687
No. of ERU's: 432 502 584 679 789 918
ES-12

8/14/2019 Port Hadlock Sewer Facility Plan 0908
http://slidepdf.com/reader/full/port-hadlock-sewer-facility-plan-0908 27/387
…EXECUTIVE SUMMARY
Figure ES-6 shows the liquids and solids-stream process flow schematics for the recommendedalternative. Figure ES-7 shows the site plan of the recommended treatment plant. Figure ES-8 shows thehydraulic profile for the recommended alternative. These planning-level figures may change duringdetailed design.
ES-13
8/14/2019 Port Hadlock Sewer Facility Plan 0908
http://slidepdf.com/reader/full/port-hadlock-sewer-facility-plan-0908 28/387
Port Hadlock UGA Sewer Facility Plan…
F i g u r e E S - 6 .
L i q u i d s a
n d S o l i d s S t r e a m P r o c e s s D i a g r a m
ES-14

8/14/2019 Port Hadlock Sewer Facility Plan 0908
http://slidepdf.com/reader/full/port-hadlock-sewer-facility-plan-0908 29/387
…EXECUTIVE SUMMARY
F i g u r e E S - 7 .
S i t e D e v e
l o p m e n t P l a n .
ES-15

8/14/2019 Port Hadlock Sewer Facility Plan 0908
http://slidepdf.com/reader/full/port-hadlock-sewer-facility-plan-0908 30/387

8/14/2019 Port Hadlock Sewer Facility Plan 0908
http://slidepdf.com/reader/full/port-hadlock-sewer-facility-plan-0908 31/387
…EXECUTIVE SUMMARY
FINANCING CONSIDERATIONS
Financing for the new wastewater system will likely be funded from a variety of sources. Sources of funding may include grants, low-interest loans, bonds, utility local improvement districts (ULID),connection charges, and developer extensions. Refer to Chapter 9 for more details on financing, includinghow costs vary with each phase of implementation.
During the financial analysis, capital costs were separated into three distinct categories when evaluatingmethods for financing and repayment. These costs were as follows:
• General Costs: These are costs for facilities that are used by all users or a majority of theusers. These typically include costs for the treatment plant, disinfection, effluent reuse, solidsreuse, influent pump station and oversizing of collection system mainlines to accommodatefuture flows. Oversizing of capital facilities is described as the amount of additional capacityneeded to accommodate flows from upstream areas which is beyond the minimum capacitythat would be needed to provide service to the local area.
• Local Costs: These costs include local gravity collection system lines of minimum diameter(less than 8-inches), and any local pump stations that may be required to serve a particular
area.• On-Site Costs: These include the costs to connect a home or building to the sewer system.
These usually include a service connection which is located on private property.
The financial analysis evaluated several strategies for recovering capital costs from users and focused onthe two most typical approaches. These included 1) connection charges to recover general and local costs,and 2) ULID for local costs and connection charges for general costs. Table ES-4 shows the results of theconnection charge strategy and the ULID plus connection charge strategy for funding the projected capitalcosts. These costs are presented per equivalent residential unit (ERU). This table also assumes 45 percentgrant funding for residential connections which may be procured through a number of funding programsincluding USDA-RD.
TABLE ES-4.CAPITAL RECOVERY STRATEGIES
Residential Commercial
When To Pay For Sewer
Assessed WhenULID Comes toNeighborhood
+ Pay WhenConnect
Assessed WhenULID Comes toNeighborhood
+ Pay WhenConnect
1. Conn. Chg. for GENERAL & LOCAL
Pay GENERAL & LOCAL When Connect $9,570 $17,400
+ On-site to connect $3,500 $3,500
Est. New Connection $13,070 $20,900
2. ULID for LOCAL + Conn. Chg. for GENERAL
Pay LOCAL When ULID Comes to Neighborhood $4,455 $8100
+ Pay GENERAL upon connection $5,115 $9,300
+ On-site to connect $3,500 $3,500
Est. New Connection $4,455 $8,615 $8,100 $12,800
* Assumes 45% Grant for Residential
ES-17

8/14/2019 Port Hadlock Sewer Facility Plan 0908
http://slidepdf.com/reader/full/port-hadlock-sewer-facility-plan-0908 32/387
Port Hadlock UGA Sewer Facility Plan…
Customer rates required to fund the annual O&M costs are shown in Table ES-5. This is the estimatedbeginning monthly rate for the first several years. As the number of customers increase, a reserve forreplacement will be set aside. The rates should be reviewed in three to five years to ensure costs arebeing met and to further develop a replacement funding strategy.
TABLE ES-5.ESTIMATE MONTHLY SEWER RATE
Estimated Monthly Rate For O&M/Admin Costs
O&M per ERU per Mo $50.00
Add Billing/Collection/State Tax/ Administration $10.00
= Estimated Monthly Sewer Rate $60.00
Next Steps
Recommended next steps are as follows:
• Actively pursue grant, low-interest loan and legislative funding options for implementing andfinancing the recommended improvements.
• Conduct a detailed hydrogeological analysis for the recommended land application site(s), asdescribed at the end of Chapter 8.
• Conduct detailed financial and implementation analysis.
• Develop sewer policies for implementing the system, distributing costs, provide incentive for
early participation, and recovering capital costs.
ES-18

8/14/2019 Port Hadlock Sewer Facility Plan 0908
http://slidepdf.com/reader/full/port-hadlock-sewer-facility-plan-0908 33/387
…EXECUTIVE SUMMARY
ES-19
IMPLEMENTATION SCHEDULE
Table ES-6 shows the estimated schedule for the wastewater facilities implementation. Phasing of implementation is the most significant driver for the schedule. The schedule is subject to change and willbe revised throughout the course of the project.
TABLE ES-6.IMPLEMENTATION SCHEDULE
Item/Activity Estimated Date of Completion
Wastewater Facility Plan Approval (Dept. of Ecology & Dept.of Health)
October 2008
Complete Site Procurement Finalize Environmental Review July 2009
Agency Planning for Implementation September 2009
Wastewater Facilities Implementation
Permitting September 2009
Detailed Hydrogeological Analysis and Facilities Design June 2009DOE Approval of Plans and Specs; Application for DOE
grant/loan fundinga
October 2009
Phase I Construction October 2009 - December 2010
a. Plans and Specs must be approved by DOE by October 31 in order to apply for DOE funding at the sametime, with funds to be available the following June or later in the year.

8/14/2019 Port Hadlock Sewer Facility Plan 0908
http://slidepdf.com/reader/full/port-hadlock-sewer-facility-plan-0908 34/387

8/14/2019 Port Hadlock Sewer Facility Plan 0908
http://slidepdf.com/reader/full/port-hadlock-sewer-facility-plan-0908 35/387
CHAPTER 1.
INTRODUCTION
As part of its Growth Management Act (GMA) planning activities, Jefferson County (County) hasdesignated the Port Hadlock and Irondale sewer service area as a potential center for County growth. Per
the 1990 GMA, the County pursued the designation of an Urban Growth Area (UGA) in the Port
Hadlock/Irondale service area. As part of the requirements for establishing an UGA, Jefferson County
contracted with Tetra Tech (Tt) on December 5, 2005 to prepare a Sewer Facility Plan to study
alternatives for developing a sewer system and identify the sewer planning boundary. This sewer planning
boundary will likely coincide with the UGA boundary since urban services must be provided within an
urban growth boundary and sanitary sewers are considered a key urban service.
The proposed Port Hadlock Urban Growth Area (PHUGA) is an unincorporated area locatedapproximately six miles south of the City of Port Townsend, Washington, as shown in Figure 2-1.
Currently, the PHUGA is served by public water, but no sewer facilities exist. On-site treatment anddisposal systems serve the existing dwellings and commercial establishments. This report is intended to
assist the County in planning for sewer capacity to match their population growth targets. Planning for
collection, treatment, and discharge or reuse facilities will allow sewer capacity to match population
growth in a cost-effective manner that minimizes potential harm to the environment.
AUTHORIZATION AND SCOPE
Jefferson County contracted with Tetra Tech to prepare a Sewer Facility Plan that meets the Washington
Administrative Code requirements for comprehensive sewer plans and engineering reports (WAC 173-
240-050 and 173-240-060). This document will also meet the requirements for facilities plans established
in the Code of Federal Regulations (40 CFR Part 35.2030). Under the project scope, the document is to
address the following:
• Facilities planning constraints
• Planning area description
• Regulatory requirements
• Population, flow, and load analysis
• Collection system alternatives
• Wastewater treatment alternatives
• Disposal and reuse alternatives
• Alternatives evaluation and recommended facilities
• Public participation
• Implementation program
• Environmental documentation.
1-1

8/14/2019 Port Hadlock Sewer Facility Plan 0908
http://slidepdf.com/reader/full/port-hadlock-sewer-facility-plan-0908 36/387
Port Hadlock UGA Sewer Facility Plan…
1-2
OWNERSHIP AND OPERATION OF PROPOSED FACILITIES
The owner of the proposed wastewater facilities described in this plan is Jefferson County Department of
Public Works, P.O. Box 2070, Port Townsend, WA 98368. The owner’s representative is Frank Gifford,
Jefferson County Public Works Director (360) 385-9160.
The County will operate the proposed wastewater facilities described in this plan.
The County will retain ownership rights of the treated effluent from the proposed wastewater facilities
described in this plan.
GOALS
The following goals were established for preparation of this Sewer Facility Plan:
• To identify the sewer planning boundary
• To develop and evaluate alternatives for wastewater collection, treatment, and disposal or
reuse facilities to provide adequate hydraulic and treatment capacity for the planning period;
provide planning level cost estimates for each; and recommend a preferred alternative.
• To estimate rate impacts for development of the recommended capital facilities.
• To evaluate implementation strategies for the recommended capital facilities.
• To develop a strategy for phased implementation of the recommended plan that will ensure
adequate capacity throughout the planning period.

8/14/2019 Port Hadlock Sewer Facility Plan 0908
http://slidepdf.com/reader/full/port-hadlock-sewer-facility-plan-0908 37/387
CHAPTER 2.BACKGROUND
As part of the requirements for establishing a UGA, this Sewer Facility Plan was prepared to evaluatealternatives for developing a sewer system in the Port Hadlock/Irondale area. The goal of this Sewer
Facility Plan is to assist the county in planning for growth in the area in accordance with the county’s
comprehensive planning efforts; to satisfy RCW 36.94 concerning county’s sewerage, water, and
drainage system responsibilities; and to gain approval from the Washington State Department of Ecology
and the Washington State Department of Health.
Figure 2-1 shows a vicinity map of Port Hadlock. The proposed extent of sewer service is described later
in this chapter.
JEFFERSON COUNTY VISION STATEMENT
The Jefferson County Comprehensive Plan contains the following vision for the area:
• Maintain and preserve the natural beauty, rural character, and variety of life styles that make
up the intrinsic character of this community.
• Support a healthy, diversified, and sustainable local and regional economy by recognizing
existing local businesses, making prudent and appropriate infrastructure investments, and
encouraging new business start-ups and recruitment which are compatible with and
complementary to the community.
• Protect and conserve the local natural resource base, balancing both habitat and economic
values.
• Reinforce and enhance the historic sense of "place" or "community" around traditional
population centers.
• Prevent the inappropriate or premature conversion of undeveloped land in favor of infill and
the strengthening of local communities.
• Provide a degree of flexibility and autonomy for local communities to address their own
unique needs.
• Encourage yet unrealized opportunities in community education, technology, transportation
alternatives, habitat restoration and economic diversification.
2-1

8/14/2019 Port Hadlock Sewer Facility Plan 0908
http://slidepdf.com/reader/full/port-hadlock-sewer-facility-plan-0908 38/387
Port Hadlock UGA Sewer Facility Plan…
Figure 2-1. Vicinity Map
2-2

8/14/2019 Port Hadlock Sewer Facility Plan 0908
http://slidepdf.com/reader/full/port-hadlock-sewer-facility-plan-0908 39/387
…2. BACKGROUND
SEWER PLANNING AREA AND URBAN GROWTH AREA (UGA)
This facility plan identifies two distinct areas as related to urban planning and sewer system development
within the Port Hadlock/Irondale area. These are the Port Hadlock Urban Growth Area (PHUGA) and the
Port Hadlock Sewer Planning Area (PHSPA) sewer planning area. The PHUGA is the planned urban
growth area as identified by the Jefferson County Department of Community Development and represents
the existing urban planning element for the Port Hadlock/Irondale area within the county’sComprehensive Plan through the year 2024. The PHSPA is coincident with the PHUGA and provides for
sewer service availability by the year 2024. A more detailed discussion regarding sewer planning
horizons and the planning horizon used in the county’s Comprehensive Plan is presented in Chapter 4 of
this document.
The coincident PHUGA and PHSPA are shown in Figure 2-2.
The sections below describes these areas and their important distinguishing characteristics as related to
urban planning and sewer facility planning.
Port Hadlock Urban Growth Area (PHUGA)
The PHUGA is an unincorporated UGA, located approximately six miles south of the City of Port
Townsend, adjacent to Port Townsend Bay. This unincorporated UGA is subject to the Jefferson County
Comprehensive Plan (CP) and implementing regulations. Figure 2-2 shows anticipated 6-year and 20-year
sewer service area boundaries within the PHUGA. These boundaries represent the near term plan and the
long term plan to provide sewer service availability within the sewer planning area.
PHUGA Land Use and Zoning
Per the Jefferson County Comprehensive Plan, the PHUGA encompasses approximately 1290 acres.
Population projections in this document are based on the 2000 census which showed a residential
population of 2,553 persons. The existing land use pattern is characterized by commercial development
concentrated along the major highway corridors (Rhody Drive, Ness’ Corner Road, and Chimacum Road)
and existing developed single-family neighborhoods northeast and south of the commercial core area.There are scattered multi-family apartment complexes mostly located at the fringe of the Port Hadlock
commercial core area.
Land use in the PHUGA includes commercial, public and quasi-public uses. These include facilities such
as churches, the County Library and Chimacum Creek Elementary School, the Jefferson County Sheriff’s
Office and Jail, Jefferson County Public Works Department Maintenance Yard, and the PUD’s Sparling
Well facility along Rhody Drive and the Kively Well along Chimacum Road. In addition, there are
several neighborhood parks and open space areas.
Future land use and zoning designations for the PHUGA are shown in Table 2-1 and are illustrated in the
Irondale & Port Hadlock UGA Zoning Map (Figure 2-2). Land use districts correspond to the CP general
urban land use designations and zoning districts illustrate the site-specific designations implemented bythe Irondale & Port Hadlock UGA Implementing Regulations adopted as Title 18 of the Jefferson County
Code.
2-3

8/14/2019 Port Hadlock Sewer Facility Plan 0908
http://slidepdf.com/reader/full/port-hadlock-sewer-facility-plan-0908 40/387
Port Hadlock UGA Sewer Facility Plan…
F i g u r e 2 - 2 .
I r o n
d a l e & P o r t H a d l o c k U G A S e w e r S
e r v i c e A r e a a n d Z o n i n g M a p
2-4

8/14/2019 Port Hadlock Sewer Facility Plan 0908
http://slidepdf.com/reader/full/port-hadlock-sewer-facility-plan-0908 41/387
…2. BACKGROUND
TABLE 2-1.IRONDALE AND PORT HADLOCK UGA LAND USE AND ZONING DISTRICTS
Land Use
Designation Zoning District
Total
(Gross)
Acres
Net
Developable
Acresa
Net
Developable
AcresPercent of
Total
Urban Residential
Urban Low Density Residential 801 449 56%
Urban Moderate Density Residential 66 50 86%
Urban High Density Residential 50 31 62%
Urban Commercial
Urban Commercial 263 161 61%
Visitor-Orientated Commercial 14 8 57%
Urban IndustrialUrban Light Industrial 25 15 60%
Public
Public 72 1 1%
TOTALS 1,290 715 55%
Source: Jefferson County Central Services, Jefferson County Department of Community Development
a. Net developable area is the total area on which development, residential or commercial, can take place. It is
the Total (Gross) Acres minus critical areas (environmentally sensitive areas), market factor area (land under
private ownership which is assumed to remain undeveloped by the owner’s choice), and roads and reduction
factor area (area for roads, buffers, easements, etc., that will not be built upon).
Port Hadlock Sewer Planning Area (PHSPA)
As mentioned above, the PHSPA is coincident with the PHUGA. The proposed capital facility plan
outlined in this document will demonstrate the availability of sewer service throughout the sewer planning
area within the county’s Comprehensive Plan’s 20-year planning horizon (i.e.), by the year 2024.
Sewer Planning Area Land Use and Zoning
The predominant land use type by area in the sewer planning area is single-family residential
development. It accounts for close to one-half of the existing land area. Most of the residential
neighborhoods south of Irondale Road are largely built-out, although there are a significant number of
pre-existing platted lots (from early in the 20th
century) that remain undeveloped. In fact, vacant lands
constitute about one-third of the UGA—most of which are concentrated north of Irondale Road and southof Chimacum Creek. Many of these lots are “substandard”— meaning that they cannot meet minimum lot
size requirements for on-site septic systems—and therefore must be combined through restrictive
covenant or lot consolidation in order to build upon. Under current regulations, the county may authorize
single-family home development on pre-existing platted lots provided they meet Jefferson County
Environmental Health Department standards for on-site septic systems and drainfields— usually requiring
a minimum 12,500 square foot lot (if served by a public water system). Current developed single-family
residential lots in the UGA range from 2,500 to 20,000 square feet in size and average about 13,000
square feet.
2-5

8/14/2019 Port Hadlock Sewer Facility Plan 0908
http://slidepdf.com/reader/full/port-hadlock-sewer-facility-plan-0908 42/387
Port Hadlock UGA Sewer Facility Plan…
Summary of Land Use and Zoning
Figure 2-2 and Table 2-1 summarize the land use designations and area totals for the PHUGA and sewer
planning area. Also presented below are descriptions of the various land use designations identified.
Urban Residential. The Urban Residential land use designation accounts for the largest share of land use
in the UGA. The Urban Low Density Residential (ULDR) zone will allow housing density from four (4)to six (6) dwelling units per acre, except, as previously noted, for parcels both outside the planned sewer
service area and within a designated Critical Aquifer Recharge Area where the maximum density may not
exceed 3.5 units per acre. This zone accounts for more than 800 acres although only about one-third of
those acres are undeveloped (including mostly vacant platted lots). Moderate Density Residential (MDR)
zoning will allow housing at a density of 7-14 units per acre and accounts for 66 total acres within the
UGA. The High Density Residential zone will allow housing at a density of 14-24 dwelling units per acre.
Urban Commercial. Almost one-quarter of the total UGA is designated for commercial land use. Several
different commercial zoning districts may implement this land use designation. The Urban Commercial
(UC) zone is the largest constituting approximately 263 acres. It covers both the existing and planned
future commercial development in the Port Hadlock core area and along Rhody Drive between Ness’
Corner and the “Dogbone.” The Visitor-Oriented Commercial (VOC) zone is applied to the tourism-oriented potential development area around the Old Alcohol Plant.
Urban Industrial. Approximately 25 acres of land are designated as an Urban Light Industrial (ULI)
zone in the UGA. These uses are located in the southwest corner of the UGA well buffered from the bulk
of the residential neighborhoods in the community.
Public Facilities. Public facilities (P) comprise 72 acres, including public park and open space areas, the
Library and Chimacum Creek Elementary School, the Jefferson County Sheriff’s Office and Jail,
Jefferson County Public Works Department Maintenance Yard, and the PUD’s Sparling Well facility
along Rhody Drive and the Kively Well in Port Hadlock.
POPULATIONThis section describes countywide population; population within the proposed Port Hadlock UGA area is
described in Chapter 4. The Office of Financial Management (OFM) publishes population projections for
cities and counties for use with planning under GMA. OFM published Population Trends in April 2001 as
Washington State’s official population figures. These estimates are cited in numerous statutes using
population as a criterion for fund allocations, program eligibility, or program operations and as criteria for
determining county participation in the Growth Management Act.
The City of Port Townsend and Jefferson County developed a population projection and urban population
allocation for the City of Port Townsend, Irondale/Hadlock UGA, and the Port Ludlow MPR based on the
OFM projections. The county passed Resolution #55-03 on September 22, 2003, adopting the Updated
Population Forecast. The population forecast is summarized in Table 2-2.
2-6

8/14/2019 Port Hadlock Sewer Facility Plan 0908
http://slidepdf.com/reader/full/port-hadlock-sewer-facility-plan-0908 43/387
…2. BACKGROUND
TABLE 2-2.JEFFERSON COUNTY AND CITY OF PORT TOWNSEND
20-YEAR POPULATION PROJECTION AND DISTRIBUTION
2000
Population
Anticipated
Growth (2000-
2024)
Projected 2024
Population
Percentage of
TotalCountywide
Growth
Compound
Growth Rate
Port Townsend
UGA
(incorporated)
8,344 4,985 13,329 36% 1.97%
Irondale/Hadlock
UGA
(unincorporated)
2,553 2,353 4,906 17% 2.76%
Port Ludlow
MPR
(unincorporated)
1,430 2,353 3,783 17% 4.14%
Unincorporated
Rural &
Resources Areas
13,972 4,149 18,121 30% 1.09%
County-wide
Total
26,299 13,840 40,139 100% 1.78%
Sources: 2000 US Census and 2002 Washington State OFM Population Forecasts
The only incorporated city in the county is Port Townsend. Approximately thirty percent of the county’s
population is incorporated, with the remaining areas unincorporated.
UTILITY SERVICESNearby Water Systems
There are several water purveyors in eastern Jefferson County. The large Group A Systems include: Cape
George Colony Club, Inc.; Kala Point Water System; Ludlow Water Company; the Jefferson County
PUD; and the City of Port Townsend.
Jefferson County Public Utility District No. 1 (PUD) provides water to customers in the PHUGA. The
supply is from ground water wells located within the PHUGA. The Sparling Well is located near the
intersection of Rhody Drive and Kennedy Road, while the Kively Well is located just east of Chimacum
Road.
The PUD wells have annual water rights equivalent to 1.14 million gallons per day (mgd). Currentaverage day water demands are approximately 0.72 mgd for the entire area served by the PUD wells. This
includes contracted amounts of approximately 0.114 mgd for Indian Island and 0.057 mgd for
Marrowstone Island customers (Fort Flagler and a federal fish hatchery). Current peak day demands are
approximately 1.56 mgd.
2-7

8/14/2019 Port Hadlock Sewer Facility Plan 0908
http://slidepdf.com/reader/full/port-hadlock-sewer-facility-plan-0908 44/387
Port Hadlock UGA Sewer Facility Plan…
Nearby Wastewater Facilities
Currently, there is no public sewer service within the PHUGA. All wastewater treatment is provided by
either individual on-site septic systems or small community-based on-site systems.
Existing sewer systems within approximately 20 miles of the planning area include: the Naval facility at
Indian Island, City of Port Townsend, City of Sequim, and Port Ludlow resort area.. The Port Ludlowfacility is privately owned and is not available for municipal service. The City of Port Townsend
treatment facility is located approximately eight miles north of the PHUGA, while the City of Sequim
treatment plant is located more than 15 miles from the PHUGA.
TOPOGRAPHY, SOILS AND HYDROGEOLOGY
Topography
Ground elevations in the Port Hadlock area range from zero to approximately 100 feet above sea level.
The terrain consists of the relatively flat Chimacum Creek valley, incised areas immediately adjacent to
the Creek, and upland areas surrounding the valley reaching elevations of over 400 feet above sea level.
Some areas near the coastline and valley walls have slopes greater than 15 percent. Figure 2-3 shows a
topographic map of the area.
Soils
Per Simonds, et al. (2004) Gayer (1975) and Grimstad (1981), most of the study area is underlain by
Quaternary Vashon Recessional Outwash, which generally consists of loose, clean, stratified sands and
gravels deposited by meltwater streams emanating from retreating glaciers. Recessional outwash was not
glacially overridden, and has lower densities than advance outwash or lodgement till. Typically outwash
deposits exhibit moderate to high permeabilities and infiltration rates depending on silt content.
There is some Quaternary Vashon Till in the southern portion of the study area, west of the southern cove
in Port Townsend Bay. Vashon till deposits generally consist of a compact unsorted mixture of clay to
boulder size particles, deposited at the base of the Cordilleran ice sheet during the latest glaciation.Occasional sand and gravel lenses may be present. Till is commonly referred to as “hardpan” due to its
cement-like texture. Till does not provide a favorable infiltration medium. Till acts as an aquitard that
inhibits the flow of ground water, perches water on top of it in the recessional outwash, and also confines
water below it in the advance outwash. In general, the permeability of till ranges from low in weathered
surficial deposits to relatively impermeable in very dense non-weathered materials.
A geologic map provided by Jefferson County (1995) also indicates Vashon Recessional Outwash over
much of the study area, with a large area of Vashon Lacustrine Deposits in the area bounded by the
northern reach and mouth of Chimacum Creek and the coastline (Jefferson County, 1995). Lacustrine
deposits are typically fine-grained (silt and clay) lake-bottom deposits.
2-8

8/14/2019 Port Hadlock Sewer Facility Plan 0908
http://slidepdf.com/reader/full/port-hadlock-sewer-facility-plan-0908 45/387
…2. BACKGROUND
F i g u r e 2 - 3 .
T o p
o g r a p h y M a p
2-9

8/14/2019 Port Hadlock Sewer Facility Plan 0908
http://slidepdf.com/reader/full/port-hadlock-sewer-facility-plan-0908 46/387
Port Hadlock UGA Sewer Facility Plan…
Figure 2-4 shows an excerpt of the soil survey map for the study area (McCreary & Raver, 1975). Soil
maps indicate much of the study area is underlain by three major soil types: Cassolary sandy loam, Dick
loamy sand, and Hoypus gravelly sandy loam. The Cassolary series consists of well-drained soils on
upland terraces, formed in reworked glacial and marine sediments. The Dick series consists of somewhat
excessively drained, sandy soils, formed in glacial outwash on plains and terraces. The Hoypus series
consists of somewhat excessively drained, gravelly soils, formed in glacial outwash on terraces.
Preliminary review of selected well logs in the study area on file at the Washington State Department of
Ecology suggest sand and gravel deposits near the surface over most of the study area, although some
well logs indicate clay or “hardpan.”
Hydrogeological Evaluation
A hydrogeological data review was conducted by HWA Geosciences Inc. to evaluate general
hydrogeologic and soil conditions throughout the area for potential land application or rapid rate
percolation sites for reclaimed water discharge. The study found that much or all of the study area is
underlain by relatively well-drained, granular soils, with few areas of steep slopes or wetlands. Based on
this information and other factors, such as property availability and distance to wastewater infrastructure,
several potential sites may be selected. Hydrogeological testing was conducted on a site south of theservice area boundary. The report is included as Appendix A.
HAZARD AREAS
Some geologically hazardous areas are also present in the PHUGA. These are areas particularly
susceptible to erosion, sliding, earthquakes, or other geological events. Steep slopes and marine bluffs
adjacent to Port Townsend Bay and lower Chimacum Creek are prone to impacts related to erosion,
seismic events and landslides. Protection of these areas is regulated under UDC Section 3.6.7
(Geologically Hazardous Areas).
Erosion and Landslide Hazard
Erosion hazard areas contain soils that, according to the SCS Soil Classification System, may experiencesevere to very severe erosion. The erosion hazard for any given soil type increases as slope increases.
Erosion hazard includes the transport of soil by wind and water. The susceptibility of soil to erosion
depends on the size of the soil particles, the amount of precipitation, topography, and the type and density
of vegetation. Slopes greater than 15 percent are found along the coastline, and are generally not suitable
for percolation sites. Percolation near steep slopes may impact slope stability, or may cause undesirable
discharge (daylighting) at the base of the slope or on slope faces. These steep slopes (mostly along the
coastline) are shown on Figure 2-5. Slopes less than 15 percent predominate within the area of interest
and will generally be suitable for percolation sites provided that adequate erosion control measures be
taken during construction and site use.
Landslide hazard areas are areas potentially subject to landslides based on geologic, topographic and
hydrological factors, including bedrock and soil characteristics and stratigraphy, slope, and hydrology.Areas with significant slopes in the PHUGA are located along the coastline and moderate slopes near the
northern boundary of the area are also indicated on Figure 2-5.
2-10

8/14/2019 Port Hadlock Sewer Facility Plan 0908
http://slidepdf.com/reader/full/port-hadlock-sewer-facility-plan-0908 47/387
…2. BACKGROUND
F i g u r e 2 - 4 .
S o i l s M a p o f t h e P o r t H a d l o c k A r e a
2-11
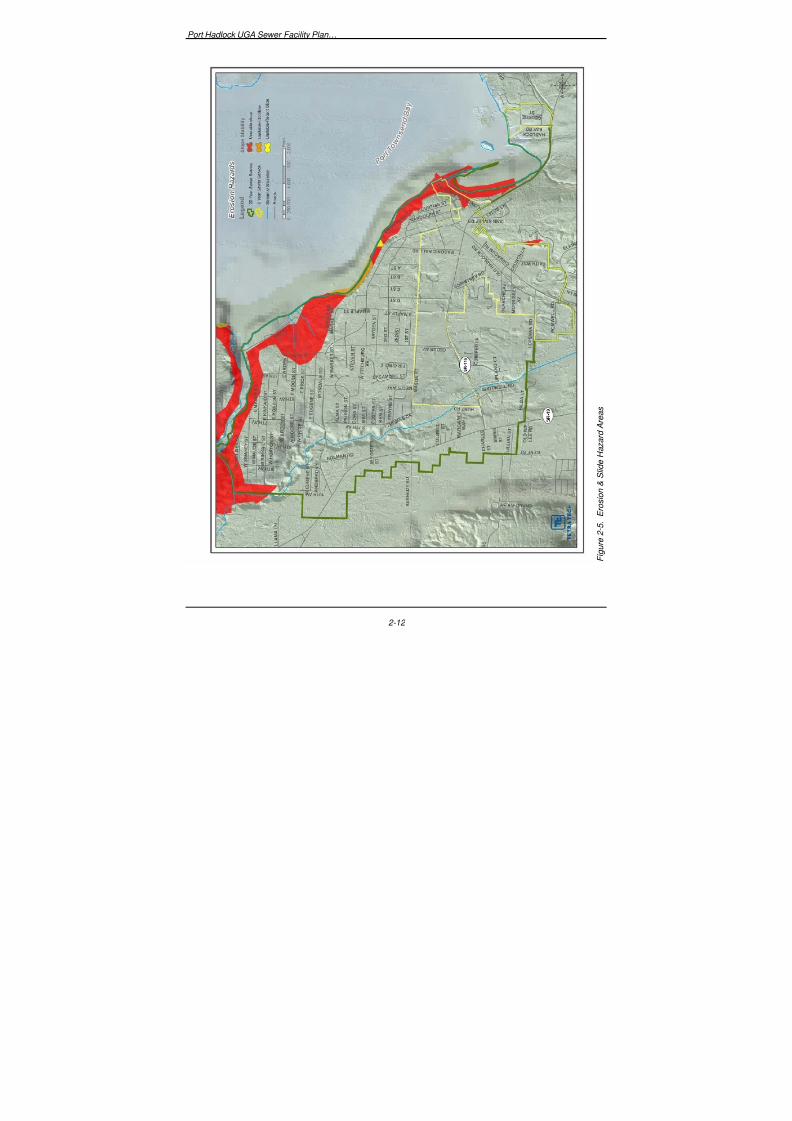
8/14/2019 Port Hadlock Sewer Facility Plan 0908
http://slidepdf.com/reader/full/port-hadlock-sewer-facility-plan-0908 48/387
Port Hadlock UGA Sewer Facility Plan…
F i g u r e 2 - 5 .
E r o
s i o n & S l i d e H a z a r d A r e a s
2-12

8/14/2019 Port Hadlock Sewer Facility Plan 0908
http://slidepdf.com/reader/full/port-hadlock-sewer-facility-plan-0908 49/387
…2. BACKGROUND
Seismic Hazard
Seismic hazard areas are areas associated with active faults and earthquakes. The potential for ground-
shaking, differential settlement, or soil liquefaction in these areas poses significant, predictable hazards to
life and property. Seismic-induced events also include tsunamis, surface faulting or seiches. Jefferson
County and all of Western Washington is at risk of seismic activity.
The International Building Code (IBC) requires that a structure be designed for “site-specific” earthquake
motions, and is no longer given a seismic zone value as in older code such as the Uniform Building Code
(UBC). A particular project site is assigned a seismic design category which determines the severity of
the design earthquake. This category is based on both the short period and one-second period response
accelerations for that particular site determined by a geotechnical engineer, and its seismic use group
based on occupancy of the facility. The Jefferson County Area is located in a region of historically high
seismic risk; therefore the seismic design category would be expected to reflect a more severe earthquake
occurrence. Figure 2-6 shows seismic hazard areas within the PHUGA.
CLIMATE
The climate of the Port Hadlock area is mid-latitude “West Coast Marine,” a climate influenced by moist
air originating from the Pacific Ocean. The high summer temperatures in the area are in the range of 60 to
70º Fahrenheit (F). Low winter temperatures are in the range of 30 to 40ºF. The greatest amount of days
in a year that have been recorded as having sub-freezing maximum temperatures is 20, or approximately
three weeks.
Due to the “rain-shadow” effect from the Olympic Mountain Range, annual rainfall averages
approximately 30 inches per year, while average potential and actual evapotranspiration are
approximately 25.2 and 17.7 inches per year, respectively.
SURFACE WATER/WETLANDS
Percolation near surface water drainages or wetlands may increase stream base flows or wetland water
levels. Increased base flows may have negative impacts on stream or wetland hydrology, including:increased flow volume, decreased time to reach receiving water, increased frequency and duration of high
stream flows, and greater stream velocities (Ecology, 2005).
No major surface water bodies other than Chimacum Creek and Port Townsend Bay are present within
the study area.
Figure 2-7 illustrates the wetlands within the PHUGA.
GROUNDWATER
The entire UGA is served by a public water system now owned and operated by Public Utility District
No. 1 (PUD) of Jefferson County. The water source is groundwater acquired by two separate wells. The
primary source is the Sparling Well located at the intersection of Rhody Drive and Kennedy Road on the
western border of the PHUGA. A secondary well, the Kivley Well, is located just southeast of the Port
Hadlock core area.
2-13

8/14/2019 Port Hadlock Sewer Facility Plan 0908
http://slidepdf.com/reader/full/port-hadlock-sewer-facility-plan-0908 50/387
Port Hadlock UGA Sewer Facility Plan…
F i g u r e 2 - 6 .
S e i s m i c H a z a r d A r e a s
2-14

8/14/2019 Port Hadlock Sewer Facility Plan 0908
http://slidepdf.com/reader/full/port-hadlock-sewer-facility-plan-0908 51/387
…2. BACKGROUND
F i g u r e 2 - 7 .
W e t l a n d s a n d E n v i r o n m e n t a l l y S e n s i t i v e A
r e a s
2-15

8/14/2019 Port Hadlock Sewer Facility Plan 0908
http://slidepdf.com/reader/full/port-hadlock-sewer-facility-plan-0908 52/387
Port Hadlock UGA Sewer Facility Plan…
Criteria which should be evaluated for potential wastewater infrastructure sites, include:
• Nearby domestic or multiple use water wells
• Nearby municipal wells, and associated wellhead protection areas
• Designated critical aquifer recharge areas
• Contaminated sites.
Portions of the PHUGA are vulnerable to groundwater pollution and are designated as a Critical Aquifer
Recharge Area (CARA) due to their hydrogeologic soil characteristics and the presence of public water
supply wellheads. The Jefferson County Public Utility District owns the water system that serves the
UGA. The water system relies on groundwater wells. There is a designated wellhead protection area
around the PUD’s Sparling Well and the Kivley Well. Figure 2-8 shows wellhead protection areas, from
the Washington State Department of Ecology Facility/Site Identification System. Figure 2-9 shows
critical aquifer recharge areas (CARA), from the Jefferson County GIS database. The treatment method
selected will impact the degree to which receptor water quality issues are considered.
The CARA is subject to enhanced wastewater treatment standards which, among other requirements, limit
land use activities; establish minimum lot sizes for uses dependent upon on-site septic systems forwastewater treatment and disposal; and requires “best management practices” for siting such
development—according to Jefferson County UDC Sections 3.6.5 (Critical Aquifer Recharge Areas);
6.18 (On- Site Sewage Disposal Best Management Practices in CARAs); and Jefferson County Code
Chapter 8.15 (On- Site Sewage Disposal Systems).
RELATED STUDIES
The following plans, studies, and other documents were reviewed as background for the current study:
• Economic and Engineering Services Inc., 2004. General Sewer Plan for the Irondale and Port
Hadlock Urban Growth Area
• Jefferson County, 2004 Update. Jefferson County Comprehensive Plan.
• Jefferson County Unified Development Code (UDC) Section 3.6.7 (Geologically Hazardous
Areas).
• U.S. Department of Agriculture, 1958. Soil Conservation Service, Soil Survey, Jefferson
County, Washington.
2-16

8/14/2019 Port Hadlock Sewer Facility Plan 0908
http://slidepdf.com/reader/full/port-hadlock-sewer-facility-plan-0908 53/387
…2. BACKGROUND
F i g u r e 2 - 8 .
W e
l l h e a d P r o t e c t i o n
2-17

8/14/2019 Port Hadlock Sewer Facility Plan 0908
http://slidepdf.com/reader/full/port-hadlock-sewer-facility-plan-0908 54/387
Port Hadlock UGA Sewer Facility Plan…
F i g u r e 2 - 9 .
C A R A L o c a t i o n s
2-18

8/14/2019 Port Hadlock Sewer Facility Plan 0908
http://slidepdf.com/reader/full/port-hadlock-sewer-facility-plan-0908 55/387
CHAPTER 3.PERMITS, REQUIREMENTS AND REGULATIONS
Wastewater must be collected, treated, and disposed of or reused in a way that protects public health andreceiving water quality, generates no objectionable off-site odors or aesthetic nuisances, and complies
with all applicable regulations. Wastewater treatment facilities must meet the regulations and
requirements of many federal, state, and local regulatory agencies. This chapter summarizes applicable
rules and regulations that typically apply to wastewater projects.
FEDERAL REGULATIONS
Federal Water Quality Acts
Programs and policies designed to protect water quality were first initiated on a nationwide scale by the
Federal Water Pollution Control Act of 1956. This act was amended by the Water Quality Act of 1965,
the Clean Water Restoration Act of 1966, and the Water Quality Improvement Act of 1970. The Federal
Water Pollution Act Amendment of 1972 (Public Law 92-500) replaced the previous language of the Actentirely. This Act requires states to establish water quality standards for all of their water bodies. The
standard must consist of two parts: a designation of the use of the water body; and the water quality
criteria that water body must maintain to protect the designated uses from pollution. The State of
Washington complies with this regulation through WAC 173-201A, which is described later.
The Clean Water Act of 1977, in further amending the Act, required any agency conducting an activity
that may result in a discharge into navigable waters to obtain certification from the appropriate water
pollution control agency, verifying that the discharge complies with applicable effluent limitations and
water quality standards. Further, these amendments established the National Pollutant Discharge
Elimination System (NPDES) permits, which regulate point discharges into water, and required varioustypes of water quality planning by states. Grants for facilities and training were also authorized under
these amendments.
With increased environmental awareness of the extent and effects of nonpoint pollution, including
stormwater, additional amendments to the Federal Clean Water Act were passed by Congress in early
1987. These amendments, referred to as the Water Quality Act of 1987, and especially Section 319, direct
the states in developing programs designed to reduce nonpoint source pollution. These sources of
pollution have become increasingly evident over the past 25 years as abatement of source pollution has
occurred. The Amendments required each state to do the following:
• Submit a report identifying navigable waters that cannot meet water quality standards without
action to control pollution.
• Identify the categories of pollution sources.
• Describe processes for identifying best management practices and control strategies.
• Identify state and local programs for controlling pollution from both point and nonpoint
sources.
These amendments resulted in the formation of the Puget Sound Water Quality Authority (PSWQA) and
the Puget Sound Water Quality Management Plan.
3-1

8/14/2019 Port Hadlock Sewer Facility Plan 0908
http://slidepdf.com/reader/full/port-hadlock-sewer-facility-plan-0908 56/387
Port Hadlock UGA Sewer Facility Plan…
Puget Sound Estuary Program
The Water Quality Act of 1987 formally established the National Estuary Program and declared that the
increase in coastal population, demands for development, and other direct and indirect uses of estuaries
threaten these unique bodies of water. The law further states that it is in the national interest to maintainthe ecological integrity of the nation’s estuaries through long-term planning and management. The EPA’s
designation of Puget Sound as an estuary of national significance is the federal government’s formalrecognition that Puget Sound is a resource of vital importance to fish and wildlife, to recreation, and to
commerce and trade.
The Puget Sound Estuary Program, which is co-managed by the EPA, the Washington State Department
of Ecology, and the Puget Sound Action Team (formerly the Puget Sound Water Quality Authority), has
been designated as the management conference for Puget Sound. The Puget Sound Action Team is
supplanted by the Puget Sound Partnership in 2007 legislation. The management conference is
responsible for the development and implementation of a site-specific “Comprehensive Conservation and
Management Plan” (CCMP). Under the law, the management plans developed by each conference must
do the following:
• Assess trends in water quality, natural resources, and uses of the estuary.
• Collect, characterize, and assess data on toxics, nutrients, and natural resources within the
estuarine zone to identify the causes of environmental problems.
• Develop the relationship between the in-place loads and point and nonpoint loadings of
pollutants to the estuarine zone and the potential uses of the zone, water quality, and natural
resources.
• Develop a comprehensive conservation and management plan that recommends priority
corrective actions and compliance schedules addressing point and nonpoint sources of
pollution.
• Develop plans for the coordinated implementation of the plan by the states as well as federal
and local agencies participating in the conference.
• Monitor the effectiveness of the actions taken pursuant to the plan.
• Review all federal financial assistance programs and federal development projects to
determine whether such assistance program or project would be consistent with and further
the purposes of the plan.
The 1987 Puget Sound Water Quality Management Plan developed by the Authority is recognized as
being a partial CCMP by the National Estuary Program. Successive updates complete the requirements
for a CCMP.
Federal Effluent Limitations
Section 301 of the Federal Water Pollution Control Act requires all publicly owned wastewater treatment
facilities to provide a minimum of secondary treatment unless a special waiver is obtained. This act
requires the following:
• The monthly average of biochemical oxygen demand (BOD) and total suspended solids
(TSS) concentrations shall not exceed 30 milligrams per liter (mg/L).
• The weekly average of BOD and TSS concentrations shall not exceed 45 mg/L.
• The monthly average removal of BOD and TSS shall be at least 85 percent.
3-2
8/14/2019 Port Hadlock Sewer Facility Plan 0908
http://slidepdf.com/reader/full/port-hadlock-sewer-facility-plan-0908 57/387
…3. PERMITS, REQUIREMENTS AND REGULATIONS
• The pH of the effluent shall be between 6.0 and 9.0.
There can be exceptions to these regulations when treatment works receive combined sewer flows or
certain industrial wastes. However, in general, these are the minimum federal requirements for effluent
quality. The Washington State Department of Ecology administers these regulations under the NPDES.
National Environmental Policy ActThe National Environmental Policy Act (NEPA) requires appropriate environmental documentation for
projects that could have a significant adverse impact on the quality of the natural and human environment.
The EPA can declare that a proposed action is categorically exempt from these requirements. Otherwise,
the proposing agency must prepare an Environmental Information Document (EID), commonly referred
to as an Environmental Assessment or Environmental Report. An Environmental Report has been
prepared for this project (Tt/KCM, 2007). An Environmental Report looks at various elements of the
environment such as soils, water quality, and air quality. In addition, the document addresses how the
proposed project complies with federal and state regulations. Letters were sent to various regulatory
agencies requesting input and comments regarding the proposed action. The EPA uses the Environmental
Report to determine whether to issue a “finding of no significant impact” or to require an environmental
impact statement.
Federal Standards for Use or Disposal of Sludge
The federal document that regulates the use and disposal of sewage sludge is the Code of Federal
Regulations, Part 503 (40 CFR 503, EPA 1993). These regulations, published in February 1993, address
three main sludge disposal options:
• Land application
• Surface disposal
• Incineration.
Land-applied sludge must meet requirements in the 503 regulations for pathogen and vector attractionreduction. Two basic classes for pathogen reduction are established in the regulations. In general, sludge
distributed in bagged form must meet Class A requirements. Sludge applied to the land in bulk form must
meet Class B requirements. The discussion below focuses on the regulations applicable to bulk land
application because that is the only disposal option evaluated in this report.
Pathogen Reduction
Class A sludge must have levels of fecal coliform organisms below 1,000 per gram of total solids and
meet other time and temperature requirements, or the sludge must have been treated with an EPA-defined
“process to further reduce pathogens.” These processes include composting, heat drying, heat treatment,
thermophilic aerobic digestion, irradiation, and pasteurization.
Class B sludge must have levels of fecal coliform organisms less than 2 million per gram of total solids,or meet other requirements, or the sludge must have been treated with an EPA-defined “process to
significantly reduce pathogens.” These processes include aerobic digestion for a mean cell residence time
greater than 40 days at 20ºC or 60 days at 15ºC, air drying, anaerobic digestion, composting, or lime
stabilization.
3-3
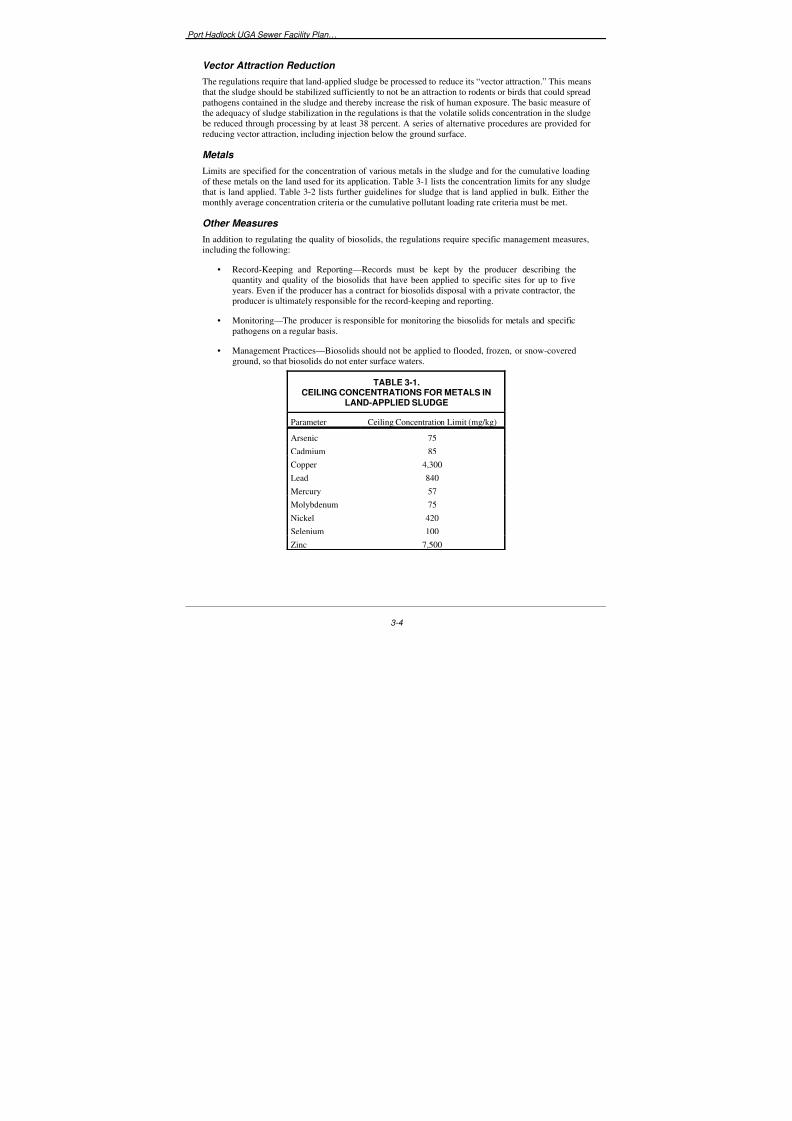
8/14/2019 Port Hadlock Sewer Facility Plan 0908
http://slidepdf.com/reader/full/port-hadlock-sewer-facility-plan-0908 58/387
Port Hadlock UGA Sewer Facility Plan…
Vector Attraction Reduction
The regulations require that land-applied sludge be processed to reduce its “vector attraction.” This means
that the sludge should be stabilized sufficiently to not be an attraction to rodents or birds that could spread
pathogens contained in the sludge and thereby increase the risk of human exposure. The basic measure of the adequacy of sludge stabilization in the regulations is that the volatile solids concentration in the sludge
be reduced through processing by at least 38 percent. A series of alternative procedures are provided forreducing vector attraction, including injection below the ground surface.
Metals
Limits are specified for the concentration of various metals in the sludge and for the cumulative loading
of these metals on the land used for its application. Table 3-1 lists the concentration limits for any sludge
that is land applied. Table 3-2 lists further guidelines for sludge that is land applied in bulk. Either the
monthly average concentration criteria or the cumulative pollutant loading rate criteria must be met.
Other Measures
In addition to regulating the quality of biosolids, the regulations require specific management measures,
including the following:
• Record-Keeping and Reporting—Records must be kept by the producer describing the
quantity and quality of the biosolids that have been applied to specific sites for up to five
years. Even if the producer has a contract for biosolids disposal with a private contractor, the
producer is ultimately responsible for the record-keeping and reporting.
• Monitoring—The producer is responsible for monitoring the biosolids for metals and specific
pathogens on a regular basis.
• Management Practices—Biosolids should not be applied to flooded, frozen, or snow-covered
ground, so that biosolids do not enter surface waters.
TABLE 3-1.CEILING CONCENTRATIONS FOR METALS IN
LAND-APPLIED SLUDGE
Parameter Ceiling Concentration Limit (mg/kg)
Arsenic 75
Cadmium 85
Copper 4,300
Lead 840
Mercury 57
Molybdenum 75Nickel 420
Selenium 100
Zinc 7,500
3-4

8/14/2019 Port Hadlock Sewer Facility Plan 0908
http://slidepdf.com/reader/full/port-hadlock-sewer-facility-plan-0908 59/387
…3. PERMITS, REQUIREMENTS AND REGULATIONS
TABLE 3-2.METAL CONCENTRATION LIMITS FOR BULK SEWAGE SLUDGE
LAND APPLICATION
Parameter
Monthly Average Concentration
Limit (mg/kg)
Cumulative Pollutant
Loading Rate (kg/hectare)
Arsenic 41 41
Cadmium 39 39
Copper 1,500 1,500
Lead 300 300
Mercury 17 17
Nickel 420 420
Selenium 100 100
Zinc 2,800 2,800
Clean Air ActThe Federal Clean Air Act of 1992 requires that all federally funded projects be in compliance with state
and regional air quality plans. The local air-quality authority for Jefferson County is the Olympic Region
Clean Air Agency; agency requirements are discussed later in this chapter.
EPA Reliability Criteria
An important reference for wastewater treatment plant reliability is the EPA’s Design Criteria for
Mechanical, Electric, and Fluid System and Component Reliability (EPA 1974). This document outlines
requirements in three reliability classes, with specific provisions for each unit process. Table 3-3
summarizes its requirements for component reliability.
3-5

8/14/2019 Port Hadlock Sewer Facility Plan 0908
http://slidepdf.com/reader/full/port-hadlock-sewer-facility-plan-0908 60/387
Port Hadlock UGA Sewer Facility Plan…
TABLE 3-3.SUMMARY OF EPA DESIGN CRITERIA FOR SYSTEM AND COMPONENT RELIABILITY
Component Class I Class II Class III
Reliability
classification
Works discharging into navigable waters that could
be permanently or unacceptably damaged byeffluent that was degraded in quality for only a few
hours. Examples of Reliability Class I works mightbe those discharging near drinking water reservoirs,into shellfish waters, or in proximity to areas used
for water contact sports.
Works discharging into navigable waters
that would not be permanently orunacceptably damaged by short-term
effluent quality degradation, but could bedamaged by continued (on the order of several days) effluent degradation.
Works not otherwise
classified as ReliabilityClass I or II
Trash removal Required Same as Class I Same as Class I
Grit removal Required if sludge is handled Same as Class I Same as Class I
Clean-out of solids Provisions for cleaning of solids required forcomponents prior to degritting or sedimentation
Same as Class I Same as Class I
Controlled
diversion
Screened, gravity overflow required with alarm,
annunciation, and measurement of flow discharged.Holding basin required
Same as Class I, but no holding basin
required
Same, as Class I but no
holding basin required
Unit operation
bypassing
Required except for unit operations with two or
more open basins
Same as Class I Same as Class I
Mechanicallycleaned bar screens
Backup manual screen required Same as Class I Same as Class I
Pumps Capacity to handle peak flow with any one pump outof service must be provided
Same as Class I Same as Class I
Comminution Overflow bypass must be provided with manual barscreen
Same as Class I Same as Class I
Primarysedimentationbasins
With largest unit out, remaining units shall havedesign flow of at least 50 percent of the total designflow to that unit operation
Same as Class I At least two basins
Final and chemical
sedimentationbasins, tricklingfilters, filters, and
activated carboncolumns
With largest unit out, remaining units shall have
design flow of at least 75 percent of the total designflow to that unit operation
With largest unit out, remaining units
shall have design flow of at least 50percent of the total design flow to thatunit operation; backup not required for
chemical sedimentation basins, filters,and activated carbon columns
At least two basins;
backup not requiredfor chemicalsedimentation basins,
filters, and activatedcarbon columns
Aeration basin At least two equal volumes shall be provided Same as Class I Single basinpermissible
Aeration blowers
or aerators
Sufficient to provide for peak oxygen demands with
the largest capacity unit out of service
Same as Class I At least two units
3-6

8/14/2019 Port Hadlock Sewer Facility Plan 0908
http://slidepdf.com/reader/full/port-hadlock-sewer-facility-plan-0908 61/387
…3. PERMITS, REQUIREMENTS AND REGULATIONS
TABLE 3-3 (continued).SUMMARY OF EPA DESIGN CRITERIA FOR SYSTEM AND COMPONENT RELIABILITY
Component Class I Class II Class III
Diffusers Designed so that isolation of the largest section of diffusers does not
measurably impair oxygen transfer capability
Same as Class I Same as Class I
Chemical flashmixer
At least two basins or a backup means of adding chemicals Backup not required Backup not required
Flocculation basins At least two basins Backup not required Backup not required
Disinfectant
contact basins
With largest unit out, remaining units shall have design flow of at least
50 percent of the total design flow to that unit operation
Same as Class I Same as Class I
Sludge handling Alternate methods of sludge disposal and/or treatment shall be
provided for each sludge treatment unit operation without installedbackup capability. No recycles permitted that will compromise liquidtreatment.
Same as Class I Same as Class I
Sludge holdingtanks
May be used to back up downstream tanks Same as Class I Same as Class I
Sludge pumps A backup pump shall be provided for each set of pumps that performsthe same function. The capacity of the pumps shall be such that with
any one pump out of service, the remaining pumps will have capacityto handle the peak flow.
Same as Class I Same as Class I
Anaerobic sludge
digestion
At least two digestion tanks shall be provided. At least two of the
digestion tanks provided shall be designed to permit processing alltypes of sludge normally digested. Tanks shall have sufficientflexibility or backup equipment to ensure that mixing is not lost whenany one piece of equipment is out of service. Uninstalled backup is
acceptable for mixing equipment
Same as Class I Same as Class I
Aerobic sludgedigestion
Backup aeration basin not required. At least two blowers shall beprovided. Uninstalled backup is permissible. Largest section of diffusers can be isolated.
Sludge holdingtanks
May be used to back up downstream tanks Same as Class I Same as Class I
Vacuum filter There shall be sufficient number of vacuum filters to enable the design
flow to be dewatered with largest capacity unit out of service. Twovacuum pumps and two filtrate pumps shall service each vacuum filter.These may be uninstalled.
Same as Class I Same as Class I
Centrifuges There shall be sufficient number of units to enable the design flow tobe dewatered with largest capacity unit out of service. The backup unit
may be uninstalled.
Same as Class I Same as Class I
Incinerators A backup incinerator is not required. Auxiliary equipment shall beprovided with backup.
Same as Class I Same as Class I
3-7

8/14/2019 Port Hadlock Sewer Facility Plan 0908
http://slidepdf.com/reader/full/port-hadlock-sewer-facility-plan-0908 62/387
Port Hadlock UGA Sewer Facility Plan…
TABLE 3-3 (continued).SUMMARY OF EPA DESIGN CRITERIA FOR SYSTEM AND COMPONENT RELIABILITY
Component Class I Class II Class III
Electric powersource
Two separate and independent sources of electric power shall beprovided to the works either from two separate utility substations orfrom a single substation and a works-based generator. Capacity of
backup power shall be sufficient to operate all vital components, duringpeak wastewater flow conditions, together with critical lighting andventilation.
Same as Class I exceptthose vitalcomponents to support
the secondaryprocesses need not beincluded as long astreatment equivalent
to sedimentation anddisinfection isprovided.
Sufficient to operatethe screening orcomminution facilities,
the main wastewaterpumps, the primarysedimentation basins,and the disinfection
facility during peak flow together withcritical lighting and
ventilation.
Power distributionexternal to the
works
The independent sources of power shall be distributed to the workstransformers in a way to minimize common mode failures from
affecting both sources.
Same as Class I Same as Class I
Power distributionwithin the works
See Referenced EPA document Same as Class I Same as Class I
Instrumentation
and controlsystems
Automatic control systems whose failures could result in a controlled
diversion or a violation of the effluent limitations shall be providedwith a manual override. Instrumentation whose failure could result in acontrolled diversion or a violation of the effluent limitations shall beprovided with an installed backup sensor and readout. Alarms shall be
provided to monitor the condition of equipment whose failure couldresult in a controlled diversion or a violation of the effluent limitations.Vital instrumentation and control equipment shall be designed topermit alignment and calibration without requiring a controlled
diversion or a violation of the effluent limitations
Same as Class I Same as Class I
Auxiliary systems If a malfunction of the system can result in controlled diversion or aviolation of the effluent limitations and the required function cannot bedone by any other means, then the system shall have backup capability.
Same as Class I Same as Class I
Reference: U. S. Environmental Protection Agency. Design Criteria for Mechanical, Electric, and Fluid System and Component Reliability.MCD-05, EPA-430-99-74-001. Office of Water Program Operations. Washington, D. C.,
The EPA’s requirements are very similar to Ecology’s reliability requirements, which are discussed later
in this chapter. The wastewater facilities proposed in this sewer plan and engineering report will comply
with the EPA and Ecology Class I reliability criteria.
Historical and Archaeological Sites
Both federal and state laws require agencies to assess the effects of their proposed projects on significant
archeological and historic properties. If facility improvement projects impact identified historical or
archaeological sites, a more detailed evaluation of the site and potential impact of the project on the site
will be required. The Washington State Office of Archaeology and Historic Preservation recommended a
professional archaeological survey of the identified area of potential effect as well as consultation withthe concerned tribes’ cultural committees and staff regarding cultural resource issues. The County will
commence with an archaeological survey prior to construction of the proposed projects. If during
3-8

8/14/2019 Port Hadlock Sewer Facility Plan 0908
http://slidepdf.com/reader/full/port-hadlock-sewer-facility-plan-0908 63/387
…3. PERMITS, REQUIREMENTS AND REGULATIONS
construction, archaeological resources are found, all work will be halted and the concerned tribe and State
Office of Archaeology and Historic Preservation will be contacted.
Floodplains, Wetlands, and Flood Insurance
The EPA restricts treatment projects on environmentally sensitive lands such as floodplains and wetlands.
Agricultural Lands
It is EPA policy under the Farmland Protection Policy Act (PL 97-98) to protect agricultural lands from
“irreversible loss as an environmental or essential food production resource.”
Coastal Zone Management
The Coastal Zone Management Act requires that all federal activities be consistent with approved state
coastal zone management programs to the maximum extent possible. This project is located in a coastal
zone county and is consistent with Washington's Coastal Zone Management Program and enforceableregulatory policies (State Environmental Policy Act, Water Quality, Air Quality and the Shoreline Master
Program). Depending on the scope of the project, Jefferson County may be required to submit a Coastal
Zone Certification of Consistency to the Department of Ecology for approval as part of obtaining theappropriate permits and approvals.
A shoreline development permit would be needed prior to construction if construction is planned within
200 feet of the ordinary high water mark.
Wild and Scenic Rivers
To comply with the Wild and Scenic Rivers Act, proposed projects should not directly and adversely
impact any wild, scenic, or recreational river area.
Fish and Wildlife Protection
The Fish and Wildlife Coordination Act requires that projects “controlling or modifying any naturalstreams or other body of water” be done in a way that protects fish and wildlife resources and habitats.
Also, since wastewater treatment facilities can attract birds, coordination with federal wildlife and
aviation officials is recommended if treatment facilities are within 2 miles of any airports. The closest
airport to the Port Hadlock area is the Jefferson County International Airport approximately 3 miles to the
northwest.
Endangered Species Act
Projects with a federal “nexus,” including federal permits, approvals or funding, require compliance with
the Endangered Species Act. Listed fish species include the following:
• Chum salmon, Hood Canal summer-run—federally threatened
• Bull trout—federally threatened and a state species of concern
• Chinook salmon—federally threatened and a state species of concern
• Coho salmon—federal candidate species.
In addition, the Bald Eagle is considered threatened by the federal and state government.
3-9

8/14/2019 Port Hadlock Sewer Facility Plan 0908
http://slidepdf.com/reader/full/port-hadlock-sewer-facility-plan-0908 64/387
Port Hadlock UGA Sewer Facility Plan…
Magnuson-Stevens Fishery Conservation and Management Act
In December 1998, the National Marine Fisheries Service (which has since been renamed as NOAA
Fisheries) issued interim final regulations to implement the Essential Fish Habitat (EFH) requirements of
the 1996 Sustainable Fisheries Act. This act significantly amended the Magnuson-Stevens Fishery
Conservation and Management Act of 1976.
The Magnuson-Stevens Act requires the following: for federal actions that may adversely affect EFH,
except activities covered by a General Concurrence, federal agencies, must provide a written assessment
of the effects of that action on EFH. EFH is defined as “waters and substrate necessary to fish for
spawning, breeding, feeding, or growth to maturity.” EFH must always include the critical habitat of
endangered and threatened species.
If a project affects an endangered species of plant or wildlife, it should include mitigating measures to
reduce the impact.
Public Participation
Jefferson County has adopted a comprehensive approach for public participation for this project. Thestrategy includes stakeholder workshops, public meetings, a project website, and press releases.
Informational fliers have been mailed to all property owners within the Port Hadlock Urban Growth Area
(PHUGA) and to those who have included themselves on the project mailing list. Within this strategy,
several public meetings were held to comply with a federal requirement for facilities plans. The federal
requirement is for at least two public meetings.
The following public meetings were held during the development of this Facility Plan:
• March 16 2006 – Stakeholder Workshop: Collection System Alternatives and Evaluation
• May 25, 2006 – Stakeholder Workshop: Discharge and Treatment Alternatives Evaluation
• June 22, 2006 – Stakeholder Workshop: Alternatives for Collection, Treatment, and
Discharge/Reuse• July 19, 2006 – Public Meeting: Alternatives for Collection, Treatment, and Discharge/Reuse
• October 10, 2006 – Stakeholder Workshop: Preliminary Design, Cost & Finance
• October 25, 2006 – Public Meeting: Preliminary Design, Cost & Finance
At each meeting, a technical presentation was given discussing the topic. Questions and answer sessions
occurred at the end of each meeting. Subsequent meetings began with a follow up on key topics and
questions from the previous meeting which required further research. All meetings were open to the
public and meeting summaries were posted on the project website (www.porthadlocksewer.org).
The project website at www.porthadlocksewer.org provided interested citizens and stakeholders with
meeting schedules, meeting summaries, maps, background information and meeting slide presentations.The website also provided a comment section and a frequently asked question section. The website
information was duplicated in hard-copy form in the project folder at the Jefferson County Library.
Appendix B contains meeting summaries from the stakeholder workshops and public meetings.
3-10

8/14/2019 Port Hadlock Sewer Facility Plan 0908
http://slidepdf.com/reader/full/port-hadlock-sewer-facility-plan-0908 65/387
…3. PERMITS, REQUIREMENTS AND REGULATIONS
STATE POLICIES
The Clean Water Act allows states to establish more stringent water quality requirements than are
required by federal law. Like most other states, Washington State has developed requirements pertaining
to surface water quality more stringent than those developed by the federal government. Ecology
administers the NPDES wastewater and stormwater permits and has requirements relating to protection of
ground and surface waters.
Agencies other than Ecology can also have involvement in construction and operation of facilities located
in critical areas. The Washington State Department of Fish and Wildlife (WDFW) has involvement in
cases involving fish-bearing streams. In addition, the Washington State Department of Natural Resources
(DNR) has authority for facilities to be constructed on tidelands or along shorelines. To promote
efficiency and reduce overlap, state agencies and the U.S. Army Corps of Engineers developed a Joint
Aquatic Resource Permit Application (JARPA), which can be submitted for the following permits:
• WDFW’s Hydraulic Project Approval (HPA)
• Local agency shoreline management permits
• Department of Ecology Water Quality Certification and Approval for Exceedance of Water
Quality Standards
• Corps of Engineers Section 404 and Section 10 Permits
• Marine and aquatic lease.
Depending upon the final location of the wastewater treatment and reuse facilities proposed in this
Facility Plan, a JARPA may be needed for the shoreline management permit. Depending on final
alignment and design considerations relating to wetlands and streams, a Corps Permit and an HPA could
be required.
Water Quality Standards for Surface Waters
The applicable water quality standards for construction in or near streams or the shoreline are thoseadopted by Ecology pursuant to Section 303 of the Federal Water Pollution Act Amendments. Water
Quality Standards for Surface Waters of the State of Washington was promulgated by Ecology in 2006
(WAC 173-201A). These standards describe general water quality conditions and classifications for
specific surface waters and the water quality desired for each class. General conditions listed under the
water quality standards are as follows:
• Existing beneficial uses shall be maintained and protected and no further degradation that
could interfere with or become injurious to existing beneficial uses shall be allowed.
• Whenever the natural conditions of waters are of a lower quality than the criteria assigned,
the natural conditions shall constitute the water quality criteria.
• Water quality shall be maintained and protected in waters designated as outstanding resource
waters. These waters are the following:
– Waters in national parks, national monuments, national preserves, national wildlife
refuges, national wilderness areas, federal wild and scenic rivers, national seashores,
national marine sanctuaries, national recreation areas, national scenic areas, and national
estuarine research reserves.
– Waters in state parks, state natural areas, state wildlife management areas, and state
scenic rivers.
3-11

8/14/2019 Port Hadlock Sewer Facility Plan 0908
http://slidepdf.com/reader/full/port-hadlock-sewer-facility-plan-0908 66/387
Port Hadlock UGA Sewer Facility Plan…
– Documented aquatic habitat of priority species as determined by the Department of Fish
and Wildlife.
– Documented critical habitat for populations of threatened or endangered species of native
anadromous fish.
– Waters of exceptional recreational or ecological significance.
• Whenever waters are of a higher quality than the criteria assigned for them, the existing water
quality shall be protected and pollution of said waters that will reduce the existing quality
shall not be allowed, except in instances where:
– It is clear, after satisfactory public participation and intergovernmental coordination, that
overriding considerations of the public interest will be served.
– All wastes and other materials and substances discharged into said waters shall be
provided with all known, available, and reasonable methods of prevention, control, and
treatment by new and existing point sources before discharge. All activities that result in
the pollution of waters from nonpoint sources shall be provided with all known,
available, and reasonable best management practices.
– When the lowering of water quality in high quality waters is authorized, the lower waterquality shall still be of high enough quality to fully support all existing beneficial uses.
General classifications applying to various surface water bodies not specifically classified under
173-201A-130 & 140 are as follows (applicable items only):
1. All surface waters lying within national parks, national forests, and/or wilderness areas are
classified Class AA or Lake Class.
2. All lakes and their feeder streams within the state are classified Lake Class and Class AA
respectively, except for those feeder streams specifically classified otherwise.
6. ( Items 3 through 5 not repeated herein) All unclassified surface waters that are tributaries to
Class AA waters are classified Class AA. All other unclassified surface waters in the state are
hereby classified Class A.
State Environmental Policy Act
A State Environmental Policy Act (SEPA) review will be required upon completion of this document. ASEPA review is an environmental checklist completed to ensure the State that there are no adverse
environmental impacts from proposed projects. Jefferson County will issue a threshold determination
based on review of the environmental checklist. This determination will be sent to the Departments of
Ecology and Health as well as USDA Rural Development for their concurrence. A copy of the SEPA
checklist is included in Port Hadlock UGA Sewer Facility Plan - Environmental Report and SEPA
Checklist .
State Environmental Review Process; Department of EcologyDocumentation
To be eligible for financial assistance from the State Water Pollution Control Revolving Fund, this plan
must comply with the State Environmental Review Process (SERP, WAC 173-98-100). The SERP was
established “to help ensure that environmentally sound alternatives are selected and to satisfy the state’s
responsibility to help ensure that recipients comply with the National Environmental Policy Act and other
applicable environmental laws, regulations, and executive orders.” This project included an extensive
public involvement program and environmental documentation, and these efforts fully satisfy SERP.
3-12
8/14/2019 Port Hadlock Sewer Facility Plan 0908
http://slidepdf.com/reader/full/port-hadlock-sewer-facility-plan-0908 67/387
…3. PERMITS, REQUIREMENTS AND REGULATIONS
In addition, the Department of Ecology has adopted a new set of requirements for environmental
documentation in coordination with USDA Rural Development. Requirements include sending out a
project description and summary of the proposed action to applicable regulatory agencies and requesting
input and comments regarding the proposed action. The environmental report, which also serves as the
Environmental Assessment for NEPA requirements, is a separate companion volume to this Facility Plan.
Since the Department of Health also has regulatory responsibility for wastewater treatment and effluentmanagement per WAC 246-271, a copy of the environmental report will be sent to them as well.
National Pollutant Discharge Elimination System Permit
Wastewater Effluent
The State of Washington administers the federal effluent limitations through the NPDES program. All
wastewater discharges into the waters of the state, including treated effluent from treatment plants, must
be permitted through the Department of Ecology with an NPDES Permit.
Stormwater Discharge
Construction projects that disturb more than 5 acres require a construction general permit for stormwaterdischarge under NPDES requirements; mitigation measures are required, including preparation of a Storm
Water Pollution Prevention Plan. During construction, temporary erosion and sediment control measures
are required.
State Waste Discharge Permit, Wastewater Effluent
All wastewater disposed of via land application must be permitted through the Department of Ecology
with a State Waste Discharge Permit. As will be discussed in Chapter 6, “disposal” via land application is
generally taken to mean that the land application process is relied on to provide further treatment. Effluent
to be “disposed” via land application is assumed not to meet reclaimed water standards before being land
applied (similar to septic tank drainfield systems).
In comparison, “water reclamation” via land application is taken to mean that the effluent is treated to a
high degree before being land applied, the land is not needed for further treatment, and the land
application is for a beneficial use, such as groundwater recharge. Refer to the “Standards for Water
Reclamation” section on the next page.
Washington State Standards for Use and Disposal of Sludge
WAC 173-308, Biosolids Management, establishes guidelines for treatment and land application of
biosolids generated by municipal wastewater treatment facilities. These mirror the federal guidelines in
40 CFR 503. The state Department of Ecology has authority to enforce these rules and may, if it chooses,
delegate some of the authority to local health departments.
Washington Department of Ecology Criteria for Sewage Works DesignThe Ecology-developed Criteria for Sewage Works Design (Ecology 2006), also known as the Orange
Book, is a guide for design of sewage collection and treatment systems. The primary goals of the manual
are as follows:
• To ensure that the design of sewage collection and treatment systems is consistent with state
public health and water quality objectives
3-13

8/14/2019 Port Hadlock Sewer Facility Plan 0908
http://slidepdf.com/reader/full/port-hadlock-sewer-facility-plan-0908 68/387

8/14/2019 Port Hadlock Sewer Facility Plan 0908
http://slidepdf.com/reader/full/port-hadlock-sewer-facility-plan-0908 69/387
…3. PERMITS, REQUIREMENTS AND REGULATIONS
If surface percolation is used for land application of reclaimed water, a nitrogen reduction step is required
in addition to other Class A requirements.
The Water Reclamation and Reuse Standards also list requirements for redundancy, including redundant
filtration and disinfection equipment. Storage requirements are also listed, including emergency storage
and wintertime storage.
Land application of reclaimed water is permitted under a single reclaimed water permit issued jointly by
the DOE and DOH. Since the reclaimed water is being beneficially reused instead of disposed of, a State
Waste Discharge Permit (described previously) is not required.
Washington Department of Natural Resources/Shellfish Closure Zone
For treatment plants that discharge to aquatic lands, the use of the aquatic lands for the outfall is granted
by the Washington Department of Natural Resources through an aquatic lands lease that must be
periodically renewed. DNR also has the authority to condition uses of state lands as needed to ensure the
well-being of lands and ecosystems, to deny uses not in compliance with applicable laws, codes, and
policies, and to seek prosecution of users trespassing on state lands.
Additionally, the Washington Departments of Ecology, Fish and Wildlife, Health, and Natural Resources
established a joint policy titled Inter-Agency Permit Streamlining Document, Shellfish and Domestic
Wastewater Discharge Outfall Projects dated October 10, 1995. The policy requires that wastewater
outfalls avoid impacts on shellfish altogether or, when that is not possible, do the following:
• Minimize shellfish impacts
• Rectify shellfish impacts
• Reduce or eliminate shellfish impacts over time
• Compensate for impacts to shellfish
• Monitor and take corrective measures over time.
The Department of Health establishes the closure zones for commercial and tribal shellfish harvesting
around all wastewater treatment plant outfalls.
Office of Archaeology and Historic Preservation Approval
Cultural resources are addressed in over 100 federal laws, regulations, and guidelines, including the
National Environmental Policy Act of 1969 (NEPA) and the National Historic Preservation Act of 1966,
amended in 1992 (NHPA). Section 106 of the NHPA requires federally assisted undertakings to take into
account the effects of those undertakings on historic properties that are included in or may be eligible to
be included in the National Register of Historic Places. “Historic properties” refers to prehistoric
archaeological sites as well as buildings, structures, and other historic sites.
Applicable state laws include the Indian Graves and Records Act (RCW 27.44), which prohibits
knowingly disturbing a Native American or historic grave, and the Archaeological Sites and Resources
Act (RCW 27.53), which requires that anyone proposing to excavate into, disturb, or remove artifacts
from an archaeological site on public or private lands obtain a permit from the Office of Archaeology and
Historic Preservation.
Three elements are involved in cultural resources studies following Section 106 procedures:
1. The identification and evaluation of historic properties.
3-15

8/14/2019 Port Hadlock Sewer Facility Plan 0908
http://slidepdf.com/reader/full/port-hadlock-sewer-facility-plan-0908 70/387

8/14/2019 Port Hadlock Sewer Facility Plan 0908
http://slidepdf.com/reader/full/port-hadlock-sewer-facility-plan-0908 71/387
…3. PERMITS, REQUIREMENTS AND REGULATIONS
agency within 15 days. An agency with jurisdiction may assume lead agency status within the 15-day
period if it disagrees with the threshold determination.
A “determination of significance” (DS), which acknowledges the potential for significant environmental
impacts, would require an environmental impact statement (EIS) that describes existing conditions,
addresses and evaluates alternatives, analyzes potential environmental impacts and addresses mitigation
measures. A scoping process would have to be conducted at the beginning of the EIS, in which theCounty would inform agencies and the public of the proposed projects and solicit comments that would
have to be addressed in the EIS.
Critical Areas Review
In noting the importance of sensitive habitats and wildlife species, and in complying with the Washington
State Growth Management Act of 1990, Jefferson County has adopted a Critical Areas Section (17.02).
Critical areas addressed in the Critical Areas Ordinance (CAO) include:
• Wetlands
• Aquifer recharge areas
• Fish and wildlife habitat conservation areas, including streams and shorelines
• Floodplains
• Geologically hazardous areas
The Jefferson County Department of Community Development reviews projects as to their impact on
these critical areas and requires protection standards and buffers for their protection.
Shoreline Management Program
Jefferson County has adopted a Shoreline Master Program as required by the Shoreline Management Act
of 1971, (RCW 90.58). Shorelines covered by each Shoreline Management Program generally include all
water areas of the state, including marine and fresh waters and their associated wetlands together with theunderlying lands, except: (a) shorelines along streams and their associated wetlands where the mean
annual flow is less than 20 cubic feet per second; and (b) shorelines of lakes less than 20 acres in area.Shoreline jurisdiction includes lands extending landward for 200 feet in all directions or measured on a
horizontal plane from the ordinary high water mark.
The program is administered by the Jefferson County Department of Community Development.
International Fire Code / National Fire Protection Association
Local County fire officials have authority to enforce the national International Fire Code (IFC). The UFC
identifies required measures to prevent, control, and mitigate dangers related to the use and storage of
hazardous chemicals.
In addition, local officials have authority to enforce National Fire Protection Association (NFPA)
standards. NFPA 820, “Fire Protection in Wastewater Treatment and Collection Facilities,” is of
particular interest.
3-17

8/14/2019 Port Hadlock Sewer Facility Plan 0908
http://slidepdf.com/reader/full/port-hadlock-sewer-facility-plan-0908 72/387
Port Hadlock UGA Sewer Facility Plan…
3-18
International Building Code / International Building Code /Washington State Energy Code
Local County building officials have authority to enforce the International Building Code (IBC) as well as
the Washington State Energy Code. These codes govern structural, architectural, and mechanical design
of buildings.
Olympic Region Clean Air Agency
The Olympic Region Clean Air Agency (ORCAA) is a local agency of government having regulatory and
enforcement authority in and for Clallam, Grays Harbor, Jefferson, Mason, Pacific, and Thurston counties
of Washington state. It was established in 1968 after passage of the Clean Air Washington Act (RCW
70.94). The agency is responsible for enforcing federal, state and local air pollution standards and
governing air pollutant emissions from new and existing sources.
The agency’s primary concern with wastewater treatment facilities is from odor generation. The agency
has indicated that permits are not required for wastewater treatment plants on the basis of occasional
sewage odors. However, if a standby generator above 250 kW in capacity is used, a permit would be
required. Also, if sludge drying or sludge incineration is used, a permit might be required, depending onthe size of the facility.
Jefferson County Solid Waste Division
The Jefferson County Department of Public Works Solid Waste Division governs the handling of solid
waste in Jefferson County. Solid waste is centralized at the Jefferson County Solid Waste Complex near
Port Townsend. From there, it is compacted into shipping containers before being trucked and trained to
Roosevelt regional landfill in eastern Washington.
For this project, a particular concern is the potential need to dispose of screenings and grit from a
wastewater treatment plant. Some wastewater treatment plants require a headworks at the front of the
plant to remove rags, sticks, plastics, grit, and/or other non-organic objects before they reach the
treatment process. The organic content, dryness, and overall aesthetics of the screenings and grit can varyconsiderably, depending on the type of collection system and the type of headworks equipment.
The Solid Waste Department may have concerns about accepting screenings and grit from a treatment
plant.
This consideration of screenings and grit may not apply. For example, treatment plants that have Septic
Tank Effluent Pumping (STEP) systems do not require headworks facilities. This will be discussed in
detail in Chapter 7.
The other consideration related to the Solid Waste Division is acceptance of solids generated as part of
the wastewater treatment process. This issue will also be discussed in detail in Chapter 7.

8/14/2019 Port Hadlock Sewer Facility Plan 0908
http://slidepdf.com/reader/full/port-hadlock-sewer-facility-plan-0908 73/387
CHAPTER 4.POPULATION, FLOW AND LOADS
This chapter presents an approach for distributing forecasted population within the Port Hadlock/Irondale
Sewer Planning Area which is coincident with the Port Hadlock UGA (PHUGA). This chapter also
projects future anticipated wastewater flows and loads based upon those forecasted population data. Nohistorical wastewater flow and load data were available since the PHUGA and Sewer Planning Area are
currently served by septic tanks. Future wastewater flows and loads were estimated using the County’s
growth projections for the proposed sewer service area, data from similar communities, engineering
experience, Department of Ecology Orange Book Design Criteria (Ecology 1998), and Jefferson County
PUD water meter data.
POPULATION FORECASTS
Background
A Geographic Information System (GIS) has been developed to assist in the planning process throughout
the development of the Facility Plan. This GIS consists of a variety of data provided by Jefferson County
and gathered from multiple sources. A data element not currently included in the available GIS data is
projected population growth within the Sewer Planning Area. While no spatially explicit population data
are available, enough data exists to perform a rudimentary population projection analysis. It should be
noted that this analysis relies upon numerous assumptions. These assumptions are noted throughout the
document. The analysis conducted within the scope of this project is based upon the residential
population within the Sewer Planning Area in the year 2000 and a residential population projection for the
year 2024 provided by Jefferson County. This analysis was not conducted by demographers. The County
may wish to follow up with a complete study by demographers to verify and refine the results presented
within this chapter.
Data Elements Used for Population Forecasting
GIS Data Several key data sets were used in this analysis. These data were all provided by the Central Services
Department of Jefferson County and include:
• Port Hadlock 20 year planning boundary (PHUGA)
• Port Hadlock/Irondale sewer planning area boundary
• Port Hadlock 6 year planning boundary
• Zoning
• Parcels
• Critical Areas.
Population Planning Data
The basis for the population projection within the Sewer Planning Area comes from Jefferson County
Resolution No. 55-03 adopted on September 22, 2003 and a section of the County’s Comprehensive Plan
provided by Jefferson County.. The resolution adopts an update to Countywide Growth Management
Planning Population Projections. Table 2-2 in this Facility Plan summarizes the population projections
codified in Resolution No. 55-03. This table identifies a residential population within Irondale/Hadlock of
2,553 people in the year 2000 and a population of 4,906 people in the year 2024.
4-1

8/14/2019 Port Hadlock Sewer Facility Plan 0908
http://slidepdf.com/reader/full/port-hadlock-sewer-facility-plan-0908 74/387
Port Hadlock UGA Sewer Facility Plan…
Planning Areas and Zoning
Figure 4-1 is a zoning map provided by Jefferson County Central Services for the Port Hadlock/Irondale
UGA.
Table 4-1 describes the zoning designation within the Sewer Planning Area.
From information provided by Jefferson County the following key areas were developed for land within
the Sewer Planning Area:
1. TOTAL ACRES BY ZONING – The total area in acres by planning zone within the
PHUGA.
2. CRITICAL AREAS (ACRES) - The area within each planning zone designated as critical
areas. These areas are considered un-buildable for the purposes of the analysis.
3. MARKET FACTOR (ACRES) – Private land that is assumed to remain undeveloped.
4. ROADS AND REDUCTION FACTOR (ACRE) – Land required for roads, buffers, and
setbacks, upon which no other development can take place.
5. TOTAL DEVELOPABLE ACRES – Net area upon which development can occur.
TABLE 4-1.PLANNING ZONE DESIGNATIONS WITHIN THE PORT HADLOCK/IRONDALE UGA
Designation Description
P Public Land: Schools, Libraries, Sheriff’s Facility
C Commercial
VOC Visitor Oriented Commercial
LI Light Industrial
LDR Low Density Residential (4-6 housing units/acre)
MDR Moderate Density Residential (7-14 housing units/acre)
HDR High Density Residential (14-24 housing units/acre)
4-2

8/14/2019 Port Hadlock Sewer Facility Plan 0908
http://slidepdf.com/reader/full/port-hadlock-sewer-facility-plan-0908 75/387
4. POPULATION, FLOWS AND LOADS
F i g u r e 4 - 1 .
P t .
H a d l o c k F u t u r e L a n d U s e a n d Z o n
i n g M a p
4-3

8/14/2019 Port Hadlock Sewer Facility Plan 0908
http://slidepdf.com/reader/full/port-hadlock-sewer-facility-plan-0908 76/387
Port Hadlock UGA Sewer Facility Plan…
Table 4-2 summarizes the land area by zone within the Sewer Planning Area/Port Hadlock/Irondale UGA.
TABLE 4-2.LAND AREA BY PLANNING ZONE WITHIN THE
PORT HADLOCK/IRONDALE UGA
Zoning
Designation
Total Acres
by Zoning
Critical Areas
(Acres)
Market Factor
(Acres)
Roads andReduction
Factor (Acres)
TotalDevelopable
Area (Acres)
LDR (4-6) 801 449
MDR (7-14) 66 49
HDR (14-24) 50
238 102 47
31
C 263 162
LI 25 15
VOC 14
78 22 16
8
P 72 0 71 0 1
Total 1290 317 195 63 715
Sewer Phasing Sub-Areas
For the purposes of planning and developing an implementation strategy for the sanitary sewer system,
the Sewer Planning Area was subdivided into several implementation areas or sub-areas. These sub-areas
were identified based upon how the planned sewer collection system could be constructed and
implemented over the planning period. The order in which sewers are constructed within these areas
provide a sequence by which a sewer plan and implementation strategy can be developed.
Figure 4-2 shows the proposed phasing areas within the Sewer Planning Area.
Table 4-3 describes the phasing sub-areas within the Sewer Planning Area.
The following sub-areas are included within the 20-year PHUGA:
• Core Area
• Alcohol Plant Area
• Rhody Drive Area
• Residential Area #1
• Residential Area #2
• Residential Area #3
It is important to keep in mind that the proposed phasing is for planning purposes only and that the actual
implementation may proceed in a manner different than what is shown in Table 4-3, especially for those
areas which will be implemented further out on the planning horizon. However, the planning analysis will
provide sewer service availability throughout the entire Sewer Planning Area within the County
Comprehensive Plan’s 20-year planning horizon.
4-4
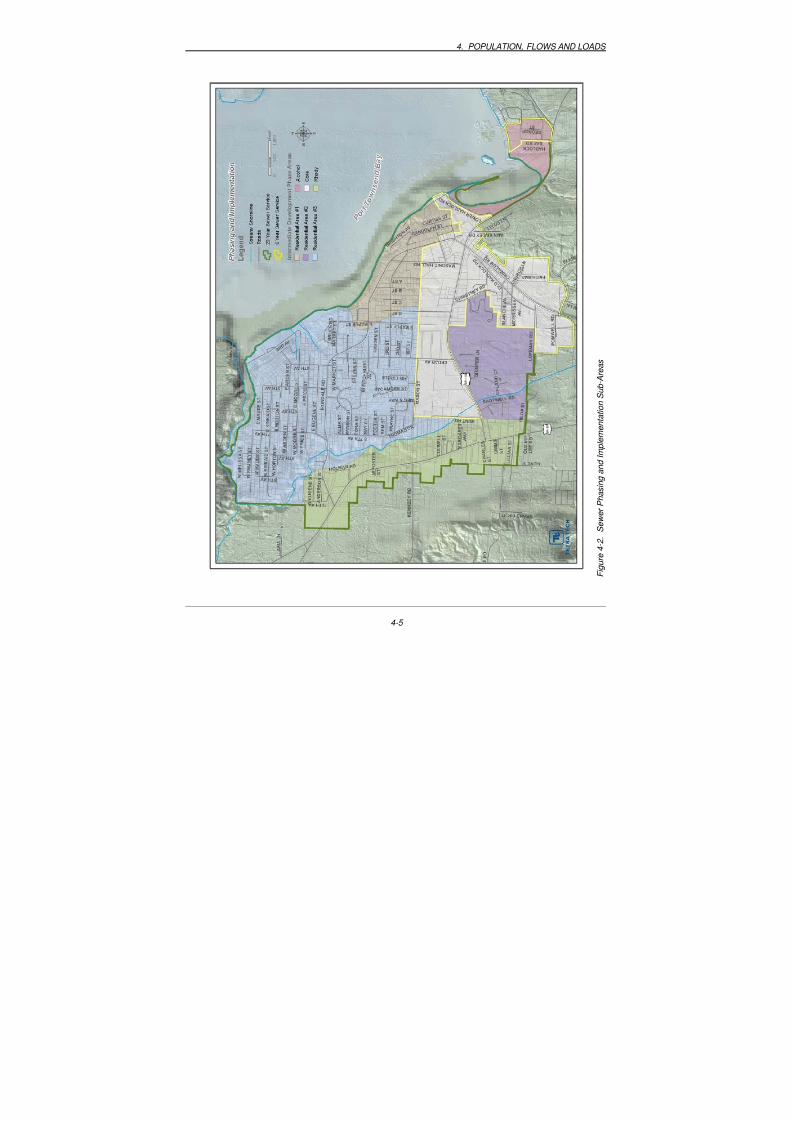
8/14/2019 Port Hadlock Sewer Facility Plan 0908
http://slidepdf.com/reader/full/port-hadlock-sewer-facility-plan-0908 77/387
4. POPULATION, FLOWS AND LOADS
F i g u r e 4 - 2 .
S e w e r P h a s i n g a n d I m p l e m e n t a t i o n S u b - A
r e a s
4-5
8/14/2019 Port Hadlock Sewer Facility Plan 0908
http://slidepdf.com/reader/full/port-hadlock-sewer-facility-plan-0908 78/387
Port Hadlock UGA Sewer Facility Plan…
TABLE 4-3.PHASING AREAS WITHIN THE PORT HADLOCK/IRONDALE UGA
Sub-Area Description Approx.
Acres
Core Area Initial Commercial Area within the 6-year planning boundary. Thiswill be the first area to be implemented.
298
Alcohol Plant Area Area east of the Core Area, area known as the Old Alcohol Plant.
Location of the Hadlock Inn. This area is included in the initial 6-yearboundary and would be part of the initial implementation.
53
Rhody Drive Area Area along SR-19 from Somerville Road to approximately the
intersection with Irondale Road. It is anticipated that this area would
implement sewers after the completion of the initial phase within the
6-year boundary.
187
Residential Area #1 This area is located northeast of the Core Area. It is anticipated sewers
would extend from the Core Area to these residential areas first. This
area is along Irondale Road from Matheson Street to Maple Street.
109
Residential Area #2 This area is located south of the Core Area. It is anticipated sewers
would extend from the core area into this residential area as itdeveloped and as the need for sewers increased due to existing septic
systems failing. This area is south of SR 116 from Hunt Road to
Christney Road.
138
Residential Area #3 This area is located north of the Core Area and extends to Chimacum
Creek. It is anticipated sewers would extend north from the Core Area
along Cedar Avenue and Mason Street. This area would develop as the
residential area continues to develop and existing septic systems fail.
505
Total 1290
Planning HorizonsThere are two distinct planning horizons discussed within this wastewater facilities plan. Each addresses
and fulfills key planning requirements. Below is a discussion of the two planning horizons and the distinctrequirements they fulfill.
County Comprehensive Plan 20-Year Planning Horizon
Jefferson County is planning under the Growth Management Act (GMA) to develop an Urban Growth
Area (UGA) in the Pt. Hadlock/Irondale Area.. The County’s current comprehensive planning horizon is
a 20-year period beginning in 2004 and ending in 2024.
This wastewater facility plan will present population, flow, and load estimates for the year 2004 to 2024
to coincide with the County’s Comprehensive plan’s 20-year planning horizon. Cost estimates will also
be presented throughout this 20-year planning horizon.
Wastewater Facilities Planning 20-Year Horizon
This document also presents a facilities plan 20-year forward-looking time horizon for the purposes of
fulfilling State and Federal sewer planning requirements as indicated in 40 CFR Part 35. This forward-
looking timeline - starts in the year 2010 and ends in the year 2030.
4-6
8/14/2019 Port Hadlock Sewer Facility Plan 0908
http://slidepdf.com/reader/full/port-hadlock-sewer-facility-plan-0908 79/387
4. POPULATION, FLOWS AND LOADS
Population Projections
Residential Population Projections
The residential population projection within the Port Hadlock/Irondale UGA and the Sewer Planning
Area were estimated using planning forecasts from Jefferson County Comprehensive Plan provided by
Jefferson County. The key population numbers provided are as follows:
Sewer Planning Area Residential Population Year 2000 = 2,553
Sewer Planning Area Residential Population Year 2024 = 4,906
This results in an annual compounded growth rate of 2.76 percent over the 24-year period.
As described in the planning horizon discussion in the section above, the 2024 residential population will
be used for analysis and discussion as relates to the County Comprehensive Plan Planning horizon. The
County currently does not have population forecasts beyond the year 2024; population forecasts beyond
the current County planning horizon will be included in the next revision of the County’s ComprehensivePlan. For the purposes of providing a 20-year forward looking sewer plan as required by Federal and State
requirements, an estimate of future population is presented assuming the same compounded annualgrowth rate of 2.76 percent to the year 2030.
Using the same annual compounded growth rate projected to the year 2030 results in a projected Sewer
Planning Area residential population of 5,776 residents in the year 2030.
Commercial Population Projections
Commercial wastewater flows were estimated using a combination of recent commercial water meter data
provided by Jefferson County PUD No. 1 and typical residential-to-commercial usage ratios experienced
in other similar communities.
The average daily wet-weather water consumption for commercial accounts within the Core Area of the
PHUGA was estimated to be 47,082 gallons per day in 2003. Using average wet-weather waterconsumption will indicate the amount of wastewater generated since irrigation does not typically occur
during wet-weather months.
The equivalent commercial population was back-calculated from the commercial consumption using a per
capita (or “per person”) flow factor. To estimate an equivalent residential population for commercial
consumption, this amount was divided by an average per capita flow factor of 60 gallons per person per
day. This results in an equivalent commercial equivalent population of 784.7 people in 2003. (47,082gallons/day ÷ 60 gallons/day/person)
A projected equivalent commercial population for the year 2024 was identified for the Port Hadlock area
based upon similar communities and their experience. A projected commercial equivalent population
equaling approximately 60 percent of the projected residential population was identified for the year2024. This assumption is supported by consumption ratios of similar developed communities such as the
City of Winslow on Bainbridge Island.
A projected equivalent commercial equivalent population of 2,944 people in the year 2024 was used
for the population projection analysis. This equates to exactly 60 percent of the projected residential
population of 4,906 people in 2024 (and is approximately 40 percent of the total flow generated). The
compounded annual growth rate of the commercial population is therefore calculated to be 6.5 percent
between the year 2003 and 2024.
4-7

8/14/2019 Port Hadlock Sewer Facility Plan 0908
http://slidepdf.com/reader/full/port-hadlock-sewer-facility-plan-0908 80/387
Port Hadlock UGA Sewer Facility Plan…
Between the year 2024 and 2030, the commercial population is calculated at 60-percent of the residential
population estimated for each year. This results in a commercial equivalent population of 3,466 people
in the year 2030 (5,776 people x 0.60).
Sewered Population Projections
The sewered population projection (or the anticipated number of people within the sewer planning areaconnected to sewer) was based upon an assumed startup equivalent population and growing that
population at a rate adequate to “catch up” with the residential population growth within the PHUGA over
the 20-year sewer planning period; between 2010 and 2030. However, the capital facilities at the
wastewater treatment plant and key infrastructure for the collection system will be implemented such that
sewer service will be available throughout the sewer planning area by the year 2024 (the end of the
County’s Comprehensive Plan 20-year planning horizon).
For the flow analysis, it was assumed that the initial sewered population within the Core and Alcohol
Area in the year 2010 would be 950 population equivalents. This population number represents an
estimate of the active commercial accounts within the Core and Alcohol area that would connect initially
to the sewer system. Once the sewer system is available within the Core and Alcohol area it is
acknowledged that some residential properties may indeed connect initially and some commercial
properties may not connect, but that the anticipated number of initial planned connections will equal
approximately 950 population equivalents.
The sewered population is then projected to grow at a compounded rate adequate to meet the projected
equivalent population of 9,242 for residential and commercial population in the year 2030. This
represents a compounded annual growth rate of 16.28 percent for the sewered population within the
PHUGA between the years 2010 and 2030.
Summary of Population Projections
Table 4-4 is a summary of the population projections estimated for the Pt. Hadlock/Irondale sewer service
area. The table summarizes projected population numbers and equivalent residential units per year
between 2003 and 2048 (buildout). An equivalent residential unit (ERU) is used in community planningto represent an average residential home. An ERU is calculated as 2.2 people/home on average.
Figure 4-3 graphs the population projections discussed above and shows their interrelationship.
Table 4-5 shows the projected population equivalents distributed by phasing area for the years 2010,
2024, and 2030. These numbers are estimated based upon current land use designations within the
PHUGA and estimated rates of growth within the phasing areas.
PROJECTED WASTEWATER FLOWS
Flow Generation Criteria
Residential Residential flow is estimated based upon the forecasted residential population multiplied by an estimated
flow factor representing the average amount of wastewater generated per person per day. Based upon
review of the water meter data provided by Jefferson County PUD and referencing Department of
Ecology Criteria, a residential wastewater generation factor of 60 gallons/person/day was used to
estimate base residential wastewater flow.
Calculations for equivalent residential units use 60 gallons/person/day and assumes an average population
of 2.2 people/dwelling unit throughout the PHUGA.
4-8

8/14/2019 Port Hadlock Sewer Facility Plan 0908
http://slidepdf.com/reader/full/port-hadlock-sewer-facility-plan-0908 81/387
4. POPULATION, FLOWS AND LOADS
TABLE 4-4.SUMMARY OF POPULATION PROJECTIONS WITHIN THE PORT
HADLOCK/IRONDALE SEWER SERVICE AREA
Year
Residential
Planning
Population
Commercial
Population
Equivalent
Residential
ERU's
Commercial
ERU's
Sewered
Population
Sewered
ERU's
2000 2,553a
0 1,160 0 0 0
2001 2,623 0 1,192 0 0 0
2002 2,696 0 1,225 0 0 0
2003 2,770a
785b
1,259 357 0 0
2004 2,847 836 1,294 380 0 0
2005 2,925 890 1,330 405 0 0
2006 3,006 948 1,366 431 0 0
2007 3,089 1,009 1,404 459 0 0
2008 3,174 1,075 1,443 489 0 0
2009 3,262 1,145 1,483 520 0 0
2010 3,352 1,219 1,523 554 950 432
2011 3,444 1,299 1,565 590 1,105 502
2012 3,539 1,383 1,609 629 1,285 584
2013 3,637 1,473 1,653 669 1,494 679
2014 3,737 1,569 1,699 713 1,737 789
2015 3,840 1,670 1,746 759 2,020 918
2016 3,946 1,779 1,794 809 2,348 1,067
2017 4,055 1,895 1,843 861 2,731 1,241
2018 4,167 2,018 1,894 917 3,175 1,443
2019 4,282 2,149 1,946 977 3,692 1,678
2020 4,400 2,289 2,000 1,040 4,294 1,952
2021 4,521 2,437 2,055 1,108 4,993 2,269
2022 4,646 2,596 2,112 1,180 5,806 2,639
2023 4,774 2,764 2,170 1,257 6,751 3,069
2024 4,906a
2,944 2,230 1,338 7,850 3,568
2025 5,041 3,025 2,292 1,375 8,066 3,666
2026 5,180 3,108 2,355 1,413 8,289 3,768
2027 5,323 3,194 2,420 1,452 8,517 3,872
2028 5,470 3,282 2,486 1,492 8,752 3,978
2029 5,621 3,373 2,555 1,533 8,994 4,088
2030 5,776 3,466 2,626 1,575 9,242 4,201
a. Population Data from Jefferson County Comprehensive Plan
b. Equivalent Population Estimated from PUD meter data for existing commercial accounts
c. Equivalent Residential Unit (ERU) = 2.2 people/household
4-9
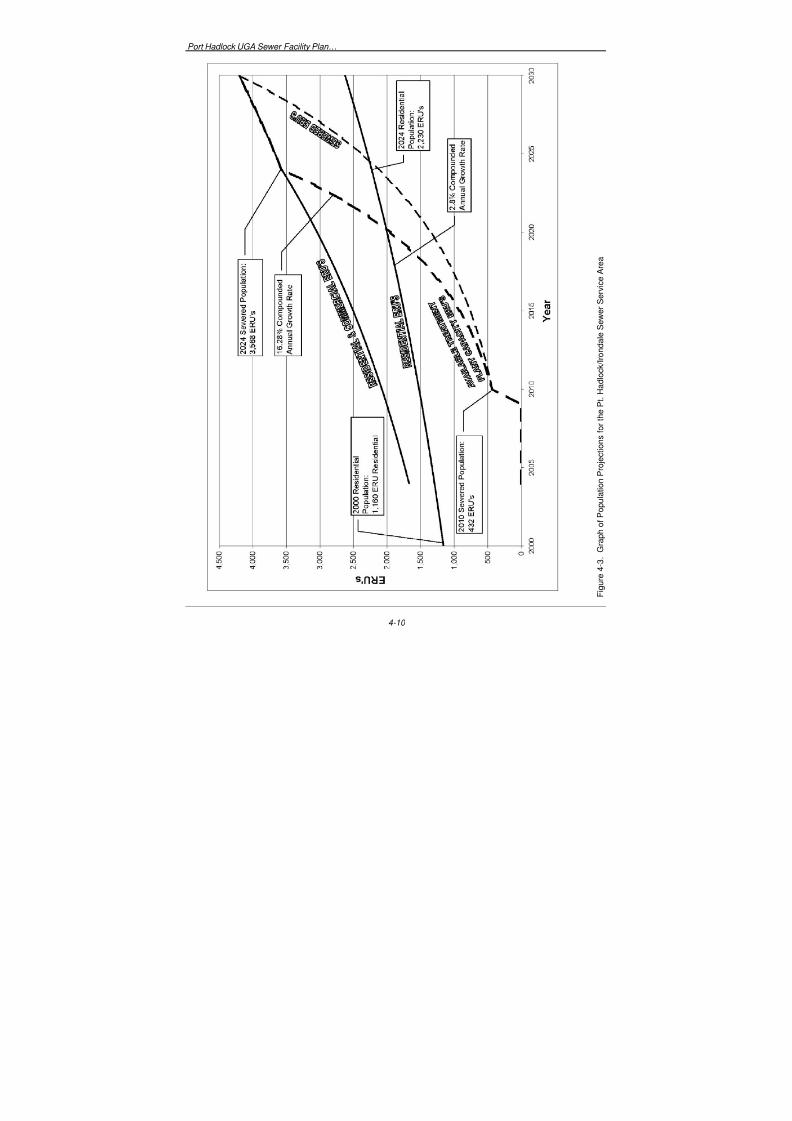
8/14/2019 Port Hadlock Sewer Facility Plan 0908
http://slidepdf.com/reader/full/port-hadlock-sewer-facility-plan-0908 82/387
Port Hadlock UGA Sewer Facility Plan…
F i g u r e 4 - 3 .
G r a p h o f P o p
u l a t i o n P r o j e c t i o n s f o r t h e P t . H a d l o c k / I r o n d a l e S e w e r S e r v i c e A r e a
4-10
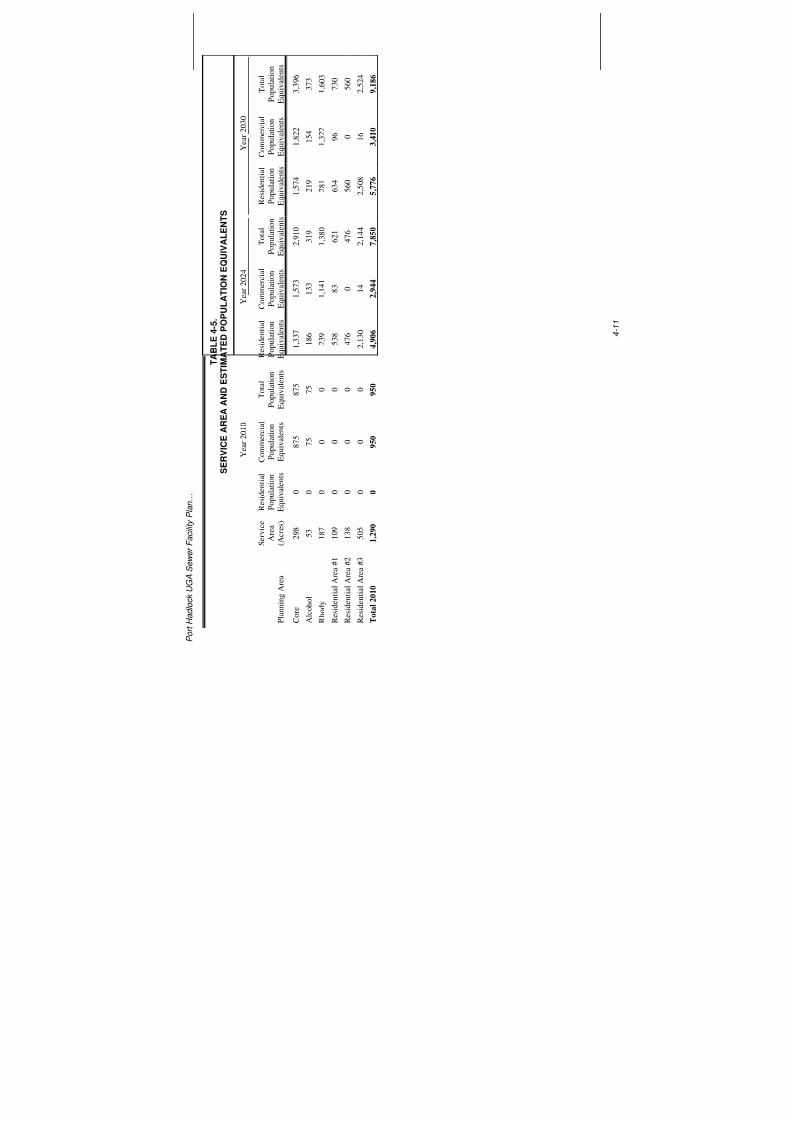
8/14/2019 Port Hadlock Sewer Facility Plan 0908
http://slidepdf.com/reader/full/port-hadlock-sewer-facility-plan-0908 83/387 P o r t H a d l o c k U G A S e w e r F a c i l i t y P l a n …
T A B L E 4 - 5 .
S E R V I C E A R E A
A N D E S T I M A T E D
P O P U L A T I O N
E Q U I V A L E N T S
Y e a r 2 0 1 0
Y e a r 2 0 2 4
Y e a r 2 0
3 0
P l a n n i n g A r e a
S e r v i c e
A r e a
( A c r e s )
R
e s i d e n t i a l
P o p u l a t i o n
E q u i v a l e n t s
C o m m e r c i a l
P o p u l a t i o n
E q u i v a l e n t s
T o t a l
P o p u l a t i o n
E q u i v a l e n t s
R e s i d e n t i a l
P o p u l a t i o n
E q u i v a l e n t s
C o m m e r c i a l
P o p u l a t i o n
E q u i v a l e n t s
T o t a l
P
o p u l a t i o n
E
q u i v a l e n t s
R e s i d e n t i a l
P o p u l a t i o n
E q u i v a l e n t s
C o m m e r c
i a l
P o p u l a t i o
n
E q u i v a l e n
t s
T o t a l
P o p u l a t i o n
E q u i v a l e n t s
C o r e
2 9 8
0
8 7 5
8 7 5
1 , 3 3 7
1 , 5 7 3
2 , 9 1 0
1 , 5 7 4
1 , 8 2 2
3 , 3 9 6
A l c o h o l
5 3
0
7 5
7 5
1 8 6
1 3 3
3 1 9
2 1 9
1 5 4
3 7 3
R h o d y
1 8 7
0
0
0
2 3 9
1 , 1 4 1
1 , 3 8 0
2 8 1
1 , 3 2 2
1 , 6 0 3
R e s i d e n t i a l A r e a # 1
1 0 9
0
0
0
5 3 8
8 3
6 2 1
6 3 4
9 6
7 3 0
R e s i d e n t i a l A r e a # 2
1 3 8
0
0
0
4 7 6
0
4 7 6
5 6 0
0
5 6 0
R e s i d e n t i a l A r e a # 3
5 0 5
0
0
0
2 , 1 3 0
1 4
2 , 1 4 4
2 , 5 0 8
1 6
2 , 5 2 4
T o t a l 2 0 1 0
1 , 2
9 0
0
9 5 0
9 5 0
4 , 9
0 6
2 , 9
4 4
7 , 8
5 0
5 , 7
7 6
3 , 4
1 0
9 , 1
8 6
4 - 1 1

8/14/2019 Port Hadlock Sewer Facility Plan 0908
http://slidepdf.com/reader/full/port-hadlock-sewer-facility-plan-0908 84/387
4. POPULATION, FLOWS AND LOADS
Commercial
Commercial flow is estimated based upon planned commercial acreage within the sewer boundary
multiplied by an estimated flow factor representing the average amount of wastewater generated per acre
of commercial property per day. Based upon water meter data from Jefferson County PUD and planning
experience for similar communities, a commercial wastewater generator factor of 1,100 gallons/acre/day
was used to estimate base commercial wastewater flow.
Infiltration & Inflow (I/I)
An allowance is included for additional wastewater flow volumes termed infiltration and inflow (I&I).
These flows represent groundwater entering the collection system through opening in joints (infiltration)
and through surface connections such as manhole lids or storm drains improperly connected to the sewer
(inflow).
Different I&I rates are used for gravity collection systems and pressurized sewer systems. This is
primarily due to the difference in the collection system infrastructure. Typically, more infiltration is
experienced in a gravity collection system than a pressurized sewer system due to the access for water
through manholes and gravity pipe joints as the system ages. I&I in a pressurized system is typically dueto inflow from illegal or unauthorized storm drain connections to the collection system and through septic
tank lids and risers if a septic tank effluent pump (STEP) system is used.
Gravity Sewers
Gravity systems are more susceptible to I&I. A base flow rate of 250 gallons/acre/day was used to
estimate I/I flows in gravity sewer systems. A peak-hour flow rate of 1,100 gallons/acre/day was used for
peak hour flow estimates.
Pressurized Sewers
A base flow rate of 125 gallons/acre/day was used for pressurized systems (50% of the I&I flow rate of
gravity systems). A peak-hour flow rate of 550 gallons/acre/day was used for peak hour flow estimates.
Peaking Factors
Table 4-6 summarizes the peaking factors used for estimating the design flow conditions for planning
wastewater facilities.
TABLE 4-6.WASTEWATER PEAKING FACTORS
Base Flow I/I
Gravity & Pressurized Sewers
Annual Average 1.00 1.00
Maximum Month 1.25 1.80
Peak Day 1.50 3.00
Peak Hour 3.50 4.40
4-12

8/14/2019 Port Hadlock Sewer Facility Plan 0908
http://slidepdf.com/reader/full/port-hadlock-sewer-facility-plan-0908 85/387

8/14/2019 Port Hadlock Sewer Facility Plan 0908
http://slidepdf.com/reader/full/port-hadlock-sewer-facility-plan-0908 86/387
Port Hadlock UGA Sewer Facility Plan…
TABLE 4-8.2024 WASTEWATER FLOW PROJECTIONS
Projected Wastewater Flows
(million gallons per day)
ConditionAnnualAverage
MaximumMonthly
Peak Day Peak Hour
Gravity Collection System
Core + Alcohol 0.23 0.31 0.40 0.84
Rhody Drive 0.10 0.14 0.19 0.38
Area #1 0.05 0.07 0.09 0.18
Area #2 0.04 0.06 0.08 0.15
Area #3 0.18 0.25 0.34 0.66
Total 0.60 0.82 1.09 2.22
STEP Collection System
Core + Alcohol 0.21 0.28 0.35 0.76Rhody Drive 0.09 0.12 0.16 0.34
Area #1 0.04 0.06 0.07 0.16
Area #2 0.03 0.05 0.06 0.12
Area #3 0.15 0.20 0.27 0.56
Total 0.54 0.70 0.90 1.93
Wastewater Facilities Plan 20-Year Flow Projections – Year 2030
Table 4-9 summarizes the estimated wastewater flow projections for gravity and pressurized sewer
systems for the year 2030.
4-14

8/14/2019 Port Hadlock Sewer Facility Plan 0908
http://slidepdf.com/reader/full/port-hadlock-sewer-facility-plan-0908 87/387
4. POPULATION, FLOWS AND LOADS
TABLE 4-9.2030 WASTEWATER FLOW PROJECTIONS
Projected Wastewater Flows
(million gallons per day)
ConditionAnnualAverage
MaximumMonthly
Peak Day Peak Hour
Gravity Collection System
Core + Alcohol 0.27 0.36 0.47 0.98
Rhody Drive 0.12 0.16 0.22 0.44
Area #1 0.06 0.08 0.11 0.21
Area #2 0.05 0.06 0.09 0.17
Area #3 0.21 0.29 0.40 0.78
Total 0.70 0.96 1.28 2.59
STEP Collection System
Core + Alcohol 0.25 0.32 0.40 0.89Rhody Drive 0.11 0.14 0.18 0.39
Area #1 0.05 0.07 0.09 0.18
Area #2 0.04 0.05 0.07 0.15
Area #3 0.18 0.24 0.31 0.65
Total 0.63 0.82 1.05 2.26
WASTEWATER LOADING PROJECTIONS
Load Generation Criteria
Residential Loads
Loads were calculated for biochemical oxygen demand (BOD), suspended solids (SS), and total nitrogen
(TKN). A “unit load” approach was used to project future loads. Unit loads are typical values for loads
expected per capita or per acre. Unit loads were based on data from similar communities, engineering
experience, and Ecology’s Criteria for Sewage Works Design (Ecology, updated 2006)
As with flows, loads vary depending on the type of collection system used. Gravity collection systems
collect all wastewater, including solids, and convey it to the treatment plant. Solids in the septic tanks
must be pumped every few years and will require additional treatment after they are pumped out.
Gravity Sewers
For gravity sewers, BOD and SS loads are approximately equal. A unit loading factor of 0.2 pounds per
person per day was used for both BOD and TSS. These are typical unit loads; they are also referenced inthe Ecology’s Criteria for Sewage Works Design. TKN was assumed to be 18 percent of the BOD load .
This percentage is based on previous engineering experience.
STEP Sewers
For STEP systems, waste loads are lower than for conventional gravity sewers. A unit loading factor of 0.12 pounds per person per day was used for both BOD and SS. TKN was also assumed to be 18 percent
of the BOD load based upon engineering experience.
4-15

8/14/2019 Port Hadlock Sewer Facility Plan 0908
http://slidepdf.com/reader/full/port-hadlock-sewer-facility-plan-0908 88/387
Port Hadlock UGA Sewer Facility Plan…
Commercial Loads
Commercial flows were assumed to be at a typical BOD strength of 400 milligrams per liter (mg/L) based
on data from similar communities. This value corresponds to the previously described unit flow and loads
of 60 gallons per capita per day and 0.2 pounds per capita per day. Peaking factors were the same as thoseused for domestic loads. Estimates for SS and TKN used the same methodology as the approach for
estimating residential loads.The analysis does not account for high-strength commercial wastes, such as wastes from large industrial
food processors. Such wastes generally have a significantly higher pollutant concentration than most
domestic or commercial connections. If high-strength wastes are later added as part of the
implementation, the flow and load analysis would need to be revised to account for these additional
pollutant loads.
Solids Loading Projections
Initial Loading Projections – Year 2010
Table 4-10 summarizes the initial solids loading projections for the year 2010 for biochemical oxygen
demand (BOD), suspended solids (SS), and total nitrogen (TKN). Loads were estimated for Annual
Average and Maximum Monthly conditions.
4-16

8/14/2019 Port Hadlock Sewer Facility Plan 0908
http://slidepdf.com/reader/full/port-hadlock-sewer-facility-plan-0908 89/387
4. POPULATION, FLOWS AND LOADS
TABLE 4-10.YEAR 2010 CONDITION
SOLIDS LOADING PROJECTIONS
Projected Solids Loads (pounds per day)
Condition/AreaAnnualAverage
MaximumMonthly
AnnualAverage
MaximumMonthly
BOD
Gravity Collection
System
STEP Collection
System
Core + Alcohol 190 261 114 157
Rhody Drive 0 0 0 0
Area #1 0 0 0 0
Area #2 0 0 0 0
Area #3 0 0 0 0
Total 190 261 114 157
SS
Gravity Collection
System
STEP Collection
System
Core + Alcohol 190 261 114 157
Rhody Drive 0 0 0 0
Area #1 0 0 0 0
Area #2 0 0 0 0
Area #3 0 0 0 0
Total 190 261 114 157
TKN
Gravity Collection
System
STEP Collection
System
Core + Alcohol 34 48 20 29
Rhody Drive 0 0 0 0
Area #1 0 0 0 0
Area #2 0 0 0 0
Area #3 0 0 0 0
Total 34 48 20 29
4-17

8/14/2019 Port Hadlock Sewer Facility Plan 0908
http://slidepdf.com/reader/full/port-hadlock-sewer-facility-plan-0908 90/387

8/14/2019 Port Hadlock Sewer Facility Plan 0908
http://slidepdf.com/reader/full/port-hadlock-sewer-facility-plan-0908 91/387
4. POPULATION, FLOWS AND LOADS
4-19
TABLE 4-12.YEAR 2030 CONDITION
SOLIDS LOADING PROJECTIONS
Projected Solids Loads (pounds per day)
Condition/AreaAnnualAverage
MaximumMonthly
AnnualAverage
MaximumMonthly
BOD
Gravity Collection
System
STEP Collection
System
Core + Alcohol 755 1038 453 623
Rhody Drive 321 441 193 265
Area #1 146 201 88 120
Area #2 112 154 67 92
Area #3 505 695 303 417
Total 1,839 2,528 1,103 1,517
SS
Gravity Collection
System
STEP Collection
System
Core + Alcohol 755 1038 453 623
Rhody Drive 321 441 193 265
Area #1 146 201 88 120
Area #2 112 154 67 92
Area #3 505 695 303 417
Total 1,839 2,528 1,103 1,517
TKN
Gravity Collection
System
STEP Collection
System
Core + Alcohol 136 189 81 113
Rhody Drive 58 80 34 48
Area #1 26 36 16 22
Area #2 20 28 12 17
Area #3 91 126 54 76
Total 331 460 198 276

8/14/2019 Port Hadlock Sewer Facility Plan 0908
http://slidepdf.com/reader/full/port-hadlock-sewer-facility-plan-0908 92/387

8/14/2019 Port Hadlock Sewer Facility Plan 0908
http://slidepdf.com/reader/full/port-hadlock-sewer-facility-plan-0908 93/387
CHAPTER 5.COLLECTION SYSTEM ALTERNATIVES
This chapter evaluates alternative wastewater collection system technologies. Each technology isdescribed along with the relative advantages and drawbacks for each as they would apply to the Pt.Hadlock sewer service area.
A technical evaluation comparing the alternative collection systems is presented in this chapter along witha technical recommendation for a preferred collection system technology.
WASTEWATER COLLECTION ALTERNATIVES
Alternatives Considered
Five wastewater collection system technologies were considered for evaluation. These are describedbelow:
• Conventional gravity collection – Wastewater flows through a series of sloped pipes to pumpstations where it is pumped to the wastewater treatment plant.
• Septic tank effluent pump (STEP) collection – Wastewater flows from the building drain to aseptic tank on the property. Most of the wastewater solids remain in the septic tank. Theclarified effluent from the tank is pumped into a pressurized sewer main using a high-pressure pump. The pressurized main conveys the clarified effluent to the wastewatertreatment plant.
• Grinder pumps – Wastewater flows from the building drain into a sump on the property.When the sump fills a float activates a grinder pump within the sump. A grinding mechanismon the pump grinds solids down and pumps the ground solids and wastewater into a
pressurized sewer main. The pressurized main conveys the wastewater to the wastewatertreatment plant.
• Small diameter gravity – A small diameter gravity collection system is a cross between aconventional gravity collection system and a STEP system. Like a STEP system, there is aseptic tank on the private property. Most of the wastewater solids remain in the septic tank.The clarified effluent from the tank flows by gravity through a series of sloped small diameterpipes to pump stations where it is pumped to the wastewater treatment plant.
• Vacuum sewers – Vacuum sewers convey wastewater by use of vacuum stations and vacuumcollection lines located in each neighborhood. Wastewater flows from the building drain intoa sump (or vacuum pit) located on the property. When the sump fills, a valve opens and thewastewater is sucked into the vacuum main. Once the pit is empty, the valve closes. Thewastewater is conveyed via small diameter vacuum pipes to the vacuum station where it ispumped to the wastewater treatment plant.
Rejected Alternatives
Two alternatives were rejected early in the evaluation process. The rational for their rejection is asfollows:
5-1

8/14/2019 Port Hadlock Sewer Facility Plan 0908
http://slidepdf.com/reader/full/port-hadlock-sewer-facility-plan-0908 94/387
Port Hadlock UGA Sewer Facility Plan…
Small Diameter Gravity Sewers
Small diameter gravity sewers were not recommended for further consideration. Small diameter gravitywas rejected because it did not provide enough advantage given the local terrain, would require deep pipeexcavations, and would not provide significant benefit over conventional gravity sewers principallybecause septic tanks would be required on private properties.
Vacuum Sewers
Vacuum sewers were rejected because they are not suitable for the varied terrain found in the sewerservice area, they provide limited lift capability thereby requiring additional local pump stations, wouldrequire vacuum pits at each property, and additional odor control facilities would be required at thevacuum stations.
ALTERNATIVES CONSIDERED FOR FURTHER EVALUATION
After review of the service area and the key features of each evaluated technology; gravity collection,STEP, and grinder pump systems were recommended for further evaluation.
Conventional Gravity SewersDescription
Conventional gravity sewers use a series of sloped pipes between manholes to collect and convey rawwastewater from the sewer connection to the wastewater treatment plant. The pipelines are a minimum of 8-inch diameter, are sloped at a minimum slope of 0.004 feet/foot, and are typically laid between 8 feetand 20 feet deep. Wastewater is collected within sewer mains and slope towards the wastewater treatmentplant or to a local pump station.
Each service connection to the wastewater treatment plant is achieved through a sloped pipe (servicelateral) from the building’s drain to the gravity sewer main in the street. The construction of the servicelateral is typically the responsibility of the property owner from the property line to the building drain.
Within the street right-of-way, construction of the service connection from the sewer main to the propertyline is the responsibility of the sewer agency. This type of collection system does not require any accessand maintenance easements since maintenance of the service lateral on private property is theresponsibility of the property owner.
Figure 5-1 shows a typical service connection to a gravity sewer system.
In some instances, parts of the service area are located in basins requiring the construction of a pumpstation to locally collect the wastewater and pump it out of the basin towards to the wastewater treatmentplant. It is through a series of gravity collection lines and pump stations that wastewater within the servicearea is collected and conveyed to the wastewater treatment plant.
A key strategy in the design of a gravity collection system is to use the contours of the existing terrain tomaximize efficiency in the construction of pipelines towards the wastewater treatment plant. An efficientdesign strategy involves sewers excavated as shallow as possible while minimizing the number of pumpstations.
5-2

8/14/2019 Port Hadlock Sewer Facility Plan 0908
http://slidepdf.com/reader/full/port-hadlock-sewer-facility-plan-0908 95/387
…5. COLLECTION SYSTEM ALTERNATIVES
Figure 5-1. Conventional Gravity Sewer System and Service Connection
Maintenance for a gravity collection system involves pump station checks, routine maintenance of thepump station equipment, and flushing of the gravity collection lines. Operational costs for a typicalgravity collection system involve electricity to operate the pump stations.
Design Criteria
The gravity collection system was developed using design criteria prescribed in the Washington State
Department of Ecology Criteria for Sewage Works Design, Water Quality Program, December 1998
(“Orange Book”) and flow generation criteria developed in Chapter 4 – Population, Flow and Loads.
The key design criteria used in the development of the gravity collection system are as follows:
• Average Daily Flow(Q) = 75 gallons/capita/day (for base flow of 60 gpcd and I/I allowancesof 250 gpad based upon flow assumptions in Chapter 4 – Population, Flow and Loads.
• Peak Flow – Ratio of Peak Hour flow to Average Daily flow based upon peaking factorequation in Section C1-3.3.2 of the Orange Book. The equation is as follows:
P4
P18
averagedesignQ
hourlypeak Q
+
+=
• Minimum pipeline diameter = 8-inch.
• Minimum Pipeline Depth = 8 feet.
• Maximum Pipeline Depth = 20 feet.
• Minimum Slope = 0.40 feet/100 feet. This is the minimum slope prescribed in DOE Criteriafor Sewage Works Design for an 8-inch diameter sewer. Shallower slopes are allowed forlarger diameter sewers. However, all pipes were laid out using the 0.40 slope to beconservative and to account for inaccuracies in the base map contours (10-foot contourintervals).
5-3

8/14/2019 Port Hadlock Sewer Facility Plan 0908
http://slidepdf.com/reader/full/port-hadlock-sewer-facility-plan-0908 96/387
Port Hadlock UGA Sewer Facility Plan…
Proposed Layout
The preliminary design for a gravity collection system was developed throughout the service areaboundary. The sewer laterals were developed along existing right-of-way to serve the land area within theservice area boundary. A 20-foot contour map was used to develop an overall collection system strategywhich included planned flow direction, pipeline diameters, pump station locations, and a central
collection point from which to send flow to a wastewater treatment plant through an influent pumpstation. The proposed gravity collection system layout is shown in Figure 5-2.
Advantages and Drawbacks
Several advantages and drawbacks of gravity collection systems were identified during the evaluation of collection system alternatives. Below is a summary of the advantages and drawbacks of gravity collectionsystems.
Advantages • Proven Reliability—This is the most common type of wastewater collection system. This
type of technology has been in service longer than any other type of technology.
• Length of Service—This type of collection system will provide the longest reliable servicelife compared to other types of collection system technologies. There are no individual on-site mechanical installations required. The gravity collection lines can have a 50-year servicelife provided they can convey the anticipated future design flows.
• Lowest Operation and Maintenance Costs—This type of collection system has the lowestoperation and maintenance costs compared to pressurized collection systems. This is becausethere are no on-site pumps or equipment at each service connection.
• On-Site Equipment—This type of system does not require on-site equipment. A gravityservice lateral is required on the private property between the building drain and the serviceconnection in the right-of-way. On site connection costs are less than for other technologies
• No Maintenance Easements—Since the property owner is responsible for maintenance of the
service connection to the sewer, no maintenance easement is required.
• Lower Life Cycle Costs—Cost of gravity conveyance is less over the life cycle of a projectsince the cost for on-site connections, operations, and maintenance are less than forpressurized sewers. Cost savings become significant as the population density increases andthe on-site connection, operations, and maintenance costs per connection become a larger partof the total life cycle cost.
Drawbacks • Requires Constant Downward Slope – Deep sewers may have to be dug for flat terrain,
intermediate pump stations may be required for hilly areas.
• Higher Initial Costs – Construction of the sewer mains may be more expensive due to deeper
trench excavation.• Infiltration & Inflow – Gravity collection systems are more susceptible to infiltration and
inflow through manholes and some joints in the pipeline system. Unlike a pressurizedcollection system, there is no back pressure within the pipes to prevent water from enteringthe collection system.
5-4

8/14/2019 Port Hadlock Sewer Facility Plan 0908
http://slidepdf.com/reader/full/port-hadlock-sewer-facility-plan-0908 97/387
…5. COLLECTION SYSTEM ALTERNATIVES
F i g u r e 5 . 2
P r o
p o s e d G r a v i t y C o l l e c t i o n S y s t e m
5-5

8/14/2019 Port Hadlock Sewer Facility Plan 0908
http://slidepdf.com/reader/full/port-hadlock-sewer-facility-plan-0908 98/387
Port Hadlock UGA Sewer Facility Plan…
Pressurized Wastewater Collection Systems (STEP & Grinder Pumps)
STEP (Septic Tank Effluent Pump) Description
A STEP system uses pressurized sewer mains to collect and convey wastewater to the wastewatertreatment plant. Typically, each service connection has an individual septic tank with pump which pumpsinto the pressurized main.
For a STEP collection system, wastewater flows from the building drain to the septic tank where solidssettle. Inside the tank is a pump chamber which houses a high head pump and control floats. The clarifiedeffluent is pumped from the septic tank into the pressurized main. The effluent flows through thepressurized mains to the wastewater treatment plant.
Figure 5-3 shows a typical service connection in a STEP collection system.
Figure 5-3. Septic Tank Effluent Pump (STEP) System Service Connection
Since the solids stay behind in the septic tanks, screening and/or primary treatment facilities are notrequired at the wastewater treatment plant. This benefit, however, is off-set by the requirement for routineand emergency maintenance and repair of each septic tank and pumping system in the service area. Thismaintenance is generally provided by the wastewater authority since the septic tanks and pumps areconsidered to be components of the wastewater infrastructure. This arrangement can be quite costly,cumbersome and labor intensive. Service calls for pumping septic tanks, pump maintenance, pump and/orcontrol equipment malfunction and electrical supply malfunctions must be provided in a timely fashion,often during off-hours, weekends and holidays. Additionally, each property owner must provide anaccess-and-maintenance easement.
Grinder Pumps Description
Similar to a STEP collection system, a grinder pump collection system uses pressurized sewer mains tocollect and convey wastewater to the wastewater treatment plant. A grinder pump is located at eachservice connection. Wastewater flows from the building drain to the grinder pump sump. Within the sumpis a grinder pump and pump control system (floats). Once the basin is full, the grinder pump turns on,grinds any solids within the sump and pumps the liquids and ground solids into the pressurized sewermain. The wastewater flows through the small diameter sewer piping to the wastewater treatment plant.
5-6

8/14/2019 Port Hadlock Sewer Facility Plan 0908
http://slidepdf.com/reader/full/port-hadlock-sewer-facility-plan-0908 99/387
…5. COLLECTION SYSTEM ALTERNATIVES
Since solids are conveyed with the wastewater to the treatment plant, facilities need to be included at theplant to handle solids. Like a STEP system, the grinder pumps are typically considered part of thewastewater infrastructure; maintenance and upkeep is generally provided by the wastewater authority.Unlike the STEP system, the grinder pump system does not require a septic tank. Otherwise, maintenanceand access issues are quite similar.
Design Criteria
The pressurized sewer system was developed using design criteria prescribed in the Washington State
Department of Ecology Criteria for Sewage Works Design, Water Quality Program, December 1998
(“Orange Book”) and flow generation criteria developed in Chapter 4 – Population, Flow and Loads.
The key design criteria used in the development of the pressurized collection system are as follows:
• Average Daily Flow = 60 gpcd (no I/I allowance) based upon flow assumptions in Chapter 4– Population, Flow and Loads.
• Peak Flow – Peak flow as described in Section C1-10.2.2A of the Orange Book. The equationis as follows:
Q peak = 15 + .15 P; where P= population.
• Minimum Pipe Diameter = 2-inches.
• Headloss Calculation – Hazen Williams Formula.
• Hazen Williams Roughness Coefficient C = 150 (PVC Pipe).
• Pump Shutoff Head = 300 feet for STEP high-head pumps.
Proposed Layout
The proposed pressurized collection system is shown in Figure 5-4. The layout and pipe sizes are thesame for both STEP and grinder pump technologies. The pressurized sewer system was laid out to conveyflow to the same central collection point as identified for the gravity collection system. This was done for
consistency when comparing the two alternative collection system technologies.
Advantages and Drawbacks of STEP Collection Systems
Advantages • Low initial cost for collection mainlines compared to gravity.
• Smaller pressurized sewers can follow the terrain reducing the depth of excavation.
Drawbacks • Septic tank (and access to the tank) required.
• Must develop ownership agreements for equipment with property owner.
• Easements required for wastewater authority to access and maintain the equipment.
• Pumping of septic tank on regular schedule. High disposal costs of septic tank solids.
• Electrical connection, electrical panel, and control panel must be located on the property orside of home.
5-7

8/14/2019 Port Hadlock Sewer Facility Plan 0908
http://slidepdf.com/reader/full/port-hadlock-sewer-facility-plan-0908 100/387
Port Hadlock UGA Sewer Facility Plan…
F i g u r e 5 . 4 .
P r o
p o s e d P r e s s u r i z e d C o l l e c t i o n S y s t e m
5-8
8/14/2019 Port Hadlock Sewer Facility Plan 0908
http://slidepdf.com/reader/full/port-hadlock-sewer-facility-plan-0908 101/387
…5. COLLECTION SYSTEM ALTERNATIVES
Advantages and Drawbacks of Grinder Pump Collection Systems
Advantages • Good when terrain does not work well with gravity sewers and septic tanks are not desired.
• Low initial cost for collection mainlines compared to gravity.
• Smaller pressurized sewers can follow the terrain reducing the depth of excavation.
Drawbacks • Pump must pass solids (more difficult than passing liquids only, additional maintenance
required because of harder duty).
• Must develop ownership agreements for equipment with property owner.
• Easements required for wastewater authority to access and maintain the equipment.
• Electrical connection, electrical panel, and control panel must be located on the property orside of home.
EVALUATION OF COLLECTION SYSTEM ALTERNATIVES
Collection System Alternatives
The shortlisted technologies were applied to the sewer service area to develop alternative collectionsystems for evaluation. Three distinct alternatives were developed. These alternatives were a gravitycollection system, a pressurized sewer system (STEP or grinder pump), or a dual technology systemconsisting of gravity collection in the 6-year planning area (or “core” area) and pressurized sewer in theoutlying 20-year planning area.
The proposed gravity collection system layout is shown in Figure 5-2. The proposed pressurized sewerlayout is shown in Figure 5-4. The dual technology system is shown in Figure 5-5.
Evaluation CriteriaThe following evaluation criteria were used when comparing the collection system alternatives:
Phasing
Does the system lend itself to phasing? Does it provide flexibility for expansion in the future? Does thecollection system adapt well to population increases and in-filling?
Easement Requirements
Are easements on private property required?
Constructability
Are there constructability issues associated with the alternative technology that would be a concern forthe Port Hadlock Area? This could include issues such as pipe depth, depth to groundwater, significantareas of bedrock, extensive utility conflicts, etc.
5-9

8/14/2019 Port Hadlock Sewer Facility Plan 0908
http://slidepdf.com/reader/full/port-hadlock-sewer-facility-plan-0908 102/387
Port Hadlock UGA Sewer Facility Plan…
F i g u r e 5 . 5 .
P r o p o s e d D u a l T e c h n o l o g y ( G r a v i t y / P
r e s s u r i z e d ) C o l l e c t i o n S y s t e m
5-10
8/14/2019 Port Hadlock Sewer Facility Plan 0908
http://slidepdf.com/reader/full/port-hadlock-sewer-facility-plan-0908 103/387
…5. COLLECTION SYSTEM ALTERNATIVES
Operation and Maintenance Requirements
What are the key operation and maintenance requirements which will be needed for the collection systemon an ongoing basis? This will have a significant impact on the long term life cycle costs for the system.It also may affect the quality of service for the end user due to service calls and on-site pumpmalfunctions, etc.
Odor and Corrosion Potential
What are the odor and corrosion potential issues typically associated with each collection system?
Life Cycle Costs
What are the life cycle cost differences between the alternatives which include capital costs for collectionand conveyance, on-site costs (on private property), and operation and maintenance costs (includingequipment replacement, electricity, and other incidentals)? Costs are compared on a 20-year life cyclesince most systems require significant equipment replacement in 20-years. Some consideration is givenfor longer life cycles to see if systems costs compare differently over a longer term.
LIFE CYCLE COST ESTIMATINGCost Assumptions
Total present worth and annualized costs were estimated for a 20-year period. The 20-year period isconsistent with an approach of designing mechanical equipment to its expected life. Structures, such asbuildings, were sized based on anticipated needs for a 50-year time span. A detailed breakdown of theestimates is attached in Appendix C. Estimated costs were identified from the following sources:
• Price quotes from local equipment suppliers.
• Unit prices for construction based on industry standards (Means 2008 Building ConstructionCost Data).
• Bid tabulations from similar projects.
The capital cost represents the total project cost for implementation of each alternative. It includesequipment costs, installation costs for piping, electrical, and controls, site work,mobilization/demobilization/bonding, contractor overhead and profit, escalation to mid-point of construction, planning-level contingency, engineering design and construction management, andWashington state sales tax. These amounts are reflected in the attached cost estimates.
Annual O&M costs were estimated based on power requirements, chemicals, and labor (generalmaintenance and cleaning). Additionally, replacement cost of equipment and structures are included inthe comparative life cycle costs. Replacement costs represent a dollar amount required each year to be setaside in order to replace building, structures, and equipment. Replacement allowances of 2 percent forbuildings and structures (replace every 50-years), and 4 percent for equipment (replace every 20 to
25 years) were included in the life cycle cost estimates. These amounts are reflected in the attached costestimates.
Cost Assumptions for Pressurized Sewers: STEP and Grinder PumpSystems
Throughout the evaluation, it was determined that STEP and grinder pump systems were comparativeequal on a life cycle cost basis. The on-site costs for equipment were similar (about $4,000 per
5-11

8/14/2019 Port Hadlock Sewer Facility Plan 0908
http://slidepdf.com/reader/full/port-hadlock-sewer-facility-plan-0908 104/387
Port Hadlock UGA Sewer Facility Plan…
connection) and the costs for electrical connection and building drain connections were equivalent. Costsfor operation and maintenance were also deemed about equivalent. Equipment replacement costs may behigher for grinder pumps due to wear and tear on grinder blades (this is dependent upon the individualuser). However, there are costs associated with septic tank pumping for a STEP system not associatedwith a grinder pump system. When these factors are considered, both systems projected basicallyequivalent life cycle costs.
Detailed cost estimates are included for a STEP collection system within Appendix C. These costs areassumed equivalent to a grinder pump system for each alternative that includes a pressurized sewersystem.
Summary of Life Cycle Costs
Table 5-1 below summarizes the 20-year life cycle costs for each of the collection system alternatives.
TABLE 5-1.SUMMARY OF 20-YEAR LIFE CYCLE COSTS
Alternative
Capital Costs Gravity Collection STEP Collection Dual Technology
On-Sitea $14,868,000 $42,275,000 $37,605,000
Sharedb $32,011,000 $6,454,000 $15,708,000
Subtotal Capital Costs $46,879,000 $48,729,000 $53,313,000
Annual Costs
O&M + Replacement $7,620 $17,400,000 $17,178,000
Total 20-year Life Cycle Cost $54,499,000 $66,137,000 $70,491,000
a. On-Site Costs include service connection from house and all other applicable equipment and appurtenanceson private property (STEP tank, grinder pump, control equipment, electrical connection, etc.)
b. Shared Costs include costs for over-sizing equipment which serves more than one neighborhood.. Thistypically involves costs for sizing gravity conveyance lines larger than 8-inch diameter and pressurizedsewer lines larger than 2-inch diameter. It also includes costs for regional pump stations which collect andtransmit wastewater from several neighborhoods to the wastewater treatment plant.
Evaluation of Alternatives
Each of the alternatives was evaluated against the above described criteria. Table 5-2 is a summary of theevaluation of the alternatives against the criteria.
5-12

8/14/2019 Port Hadlock Sewer Facility Plan 0908
http://slidepdf.com/reader/full/port-hadlock-sewer-facility-plan-0908 105/387
…5. COLLECTION SYSTEM ALTERNATIVES
TABLE 5-2.SUMMARY OF ALTERNATIVES EVALUATION
Alternative
Evaluation Criteria Gravity Sewer
Pressurized Sewer
(STEP or GrinderPumps)
Combination of Gravity
Sewer and PressurizedSewer
Ease of Phasing Provides the highest degreeof flexibility. The systemcan receive wastewaterfrom subsequent phasesemploying pressurizedsewers. Well suited forhigher density in-filling inthe future (greater than 2.5connections/acre)
Least flexible. If theinitial phase is pressuresewer, subsequentphases would need to bepressurized. Any initialsavings is reduced whenarea develops and in-fills beyond 2.5connections per acre.
Provides flexibility. Corearea can be developed tofull density andpressurized sewers canbe implemented in lessdense residential areas.
Easement Requirements No private easements
required.
Private easements
required to access on-site pumping equipment.
No easements required in
core area with gravitycollection. Easementsrequired in outlayingareas where pressurizedsewers are installed.
Constructability Sewers would be laidbetween 8 and 25 feet deep.Depths to groundwater arebetween 20-30 feet deep sosome groundwater wouldbe encountered. Soils aretypically Vashon
Lodgement Till and VashonRecessional Outwash.Significant bedrock is notanticipated.
Sewers would be laidbetween 6 to 15 feetdeep. Little groundwateris anticipated.Significant bedrock isnot anticipated.
Considerations forgravity sewer wouldapply to core area, andconsiderations topressurized sewerswould apply to theoutlying areas.
Operation andMaintenanceRequirements
Fewest operation andmaintenance requirements.Operations andmaintenance would involveoperation and maintenanceof pumping stations, routineservicing of the pumpstation, flushing of lines,
and replacement of equipment in pumpstations.
Highest operation andmaintenance costs.Costs would involveservicing of pumps atindividual connections,electricity to operate thepumps, pumpreplacement, service
calls for pumpmalfunctions, andpumping and disposal of septic tank solids (forSTEP system).
High operation andmaintenance costs. Thissystem would have costsassociated with the pumpstations for a gravitycollection system and foron-site pumps associatedwith the pressurized
system. There would alsobe additional odor andcorrosion facilitymaintenance associatedwith sewage from thepressurized systemconnecting to the gravitysystem.
5-13

8/14/2019 Port Hadlock Sewer Facility Plan 0908
http://slidepdf.com/reader/full/port-hadlock-sewer-facility-plan-0908 106/387
Port Hadlock UGA Sewer Facility Plan…
TABLE 5-2 (CONTINUED).SUMMARY OF ALTERNATIVES EVALUATION
Alternative
Evaluation Criteria Gravity Sewer
Pressurized Sewer
(STEP or GrinderPumps)
Combination of Gravity
Sewer and PressurizedSewer
Odor and CorrosionPotential
There would be odorpotential at the pumpstations. Facilities wouldhave to include someprovisions for odor controlat pump stations and at thewastewater treatment plantdepending upon location.
Minimal odor potentialalong the collectionsystem since the sewermains are pressurizedand there is littleopportunity for fugitiveodors. Additional odorcontrol would berequired at the treatmentplant since in the
influent is septic.
High odor and corrosionpotential at locationwhere pressurized sewerdischarges into thegravity collectionsystem. Septic tank effluent has high odorand corrosion potentialwhen exposed to airwithin gravity collection
system. Additional odorand corrosion facilitieswould be required alongthe collection system.
Comparative 20-yearLife Cycle Costs
$54,499,000 $66,137,000 $70,491,000
RECOMMENDED COLLECTION SYSTEM ALTERNATIVE
Stakeholder Workshop Process
The results of the alternative evaluation were presented to the Jefferson County of Board of CountyCommissioners at a workshop on March 16, 2006. The workshop was open to the public and some keystakeholders in the community were invited to attend. A presentation was given outlining the alternativetechnologies, their relative advantages and drawbacks, and their respective life cycle costs.
The design team received feedback and questions from the Board of County Commissioners, Countystaff, the stakeholders/public attending the workshop. This feedback was considered in the technicalrecommendation.
Recommendation
It was recommended that a gravity collection system be selected as the preferred collection systemtechnology for the Port Hadlock sewer service area.
The gravity collection system was recommended based upon the following key reasons:
1. Lowest 20-year life cycle cost. The 20-year service area can be economically developed toplanned densities at a lower cost than for pressure sewers. This is because the individual on-site costs and additional space requirements for a gravity collection system are less than for aSTEP or grinder pump system.
5-14
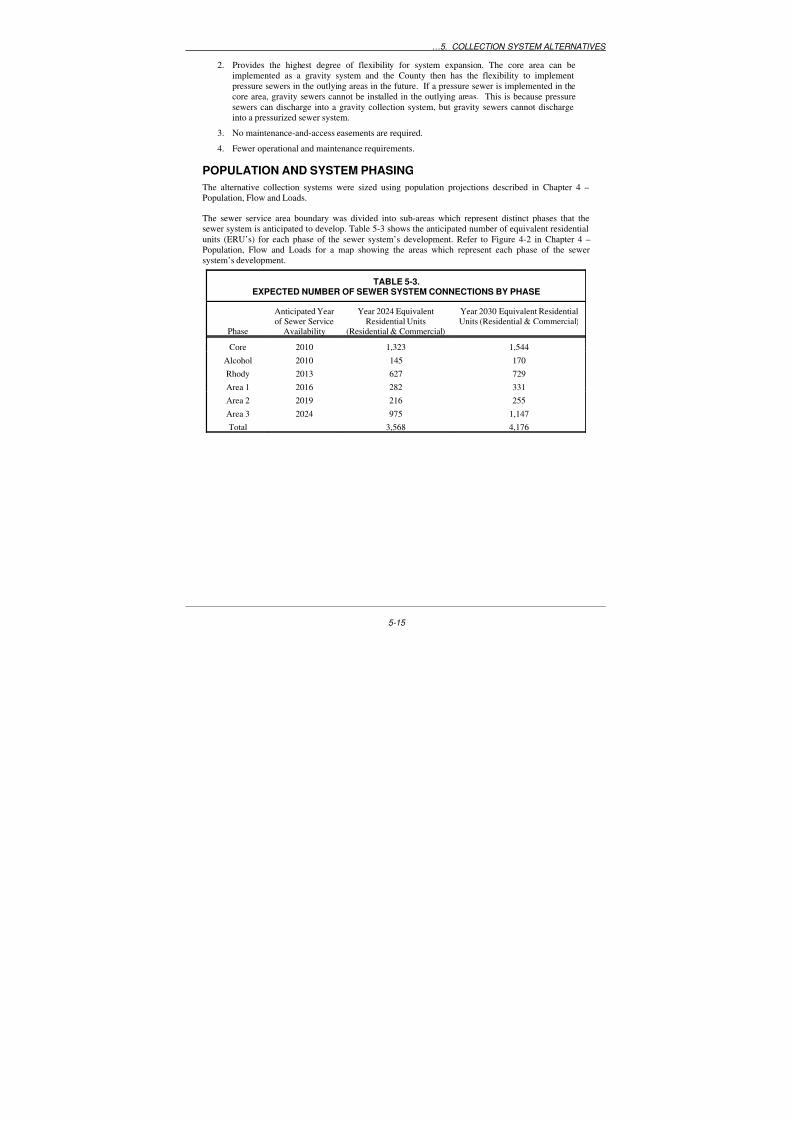
8/14/2019 Port Hadlock Sewer Facility Plan 0908
http://slidepdf.com/reader/full/port-hadlock-sewer-facility-plan-0908 107/387
…5. COLLECTION SYSTEM ALTERNATIVES
5-15
2. Provides the highest degree of flexibility for system expansion. The core area can beimplemented as a gravity system and the County then has the flexibility to implementpressure sewers in the outlying areas in the future. If a pressure sewer is implemented in thecore area, gravity sewers cannot be installed in the outlying areas. This is because pressuresewers can discharge into a gravity collection system, but gravity sewers cannot dischargeinto a pressurized sewer system.
3. No maintenance-and-access easements are required.
4. Fewer operational and maintenance requirements.
POPULATION AND SYSTEM PHASING
The alternative collection systems were sized using population projections described in Chapter 4 –Population, Flow and Loads.
The sewer service area boundary was divided into sub-areas which represent distinct phases that thesewer system is anticipated to develop. Table 5-3 shows the anticipated number of equivalent residentialunits (ERU’s) for each phase of the sewer system’s development. Refer to Figure 4-2 in Chapter 4 –
Population, Flow and Loads for a map showing the areas which represent each phase of the sewersystem’s development.
TABLE 5-3.EXPECTED NUMBER OF SEWER SYSTEM CONNECTIONS BY PHASE
Phase
Anticipated Yearof Sewer Service
Availability
Year 2024 EquivalentResidential Units
(Residential & Commercial)
Year 2030 Equivalent ResidentialUnits (Residential & Commercial)
Core 2010 1,323 1,544
Alcohol 2010 145 170
Rhody 2013 627 729
Area 1 2016 282 331
Area 2 2019 216 255
Area 3 2024 975 1,147
Total 3,568 4,176

8/14/2019 Port Hadlock Sewer Facility Plan 0908
http://slidepdf.com/reader/full/port-hadlock-sewer-facility-plan-0908 108/387
8/14/2019 Port Hadlock Sewer Facility Plan 0908
http://slidepdf.com/reader/full/port-hadlock-sewer-facility-plan-0908 109/387
CHAPTER 6.EFFLUENT DISCHARGE/REUSE ALTERNATIVES
This chapter presents discharge and treatment alternatives for treatment plant effluent (effluent or final
effluent) within the Pt. Hadlock sewer service area. Advantages and drawbacks of each alternative arepresented along with a technical recommendation.
TREATMENT PLANT EFFLUENT – DISCHARGE VS. RE-USE
Wastewater treatment requirements vary significantly dependent upon the fate of the final effluent. Thisevaluation considers both discharge and re-use of final effluent from the proposed wastewater treatmentplant. The distinction between use of the word “discharge” and “re-use” is significant in the eyes of theregulations and the regulatory community.
Surface Water Discharge vs. Land Application
Final effluent must be discharged or reused in some manner. Typically, effluent is discharged into a large
receiving body of water, such as Puget Sound. For the Pt. Hadlock sewer service area, this approach,termed surface water discharge, would include a pipeline outfall discharging into Pt. Townsend Bay.
Alternatively, final effluent can be land-applied for “disposal” or for beneficial “reuse.” Disposalstrategies generally aim solely to dispose of the effluent and provide minimal treatment. Disposal relieson significant subsurface treatment of the effluent in the ground. This approach is typical of septic tank and drainfield systems.
Reuse strategies accomplish the goal of beneficially using effluent in some advantageous manner. Thiscan be uses such as irrigating crops, supplying water for industrial processes, or supplementinggroundwater aquifers. Reuse strategies require the effluent to be of very high quality, having beenadequately and reliably treated before reaching the land application site. At this point, the treated effluent
is no longer considered wastewater and is now termed “reclaimed water”. The ground is no longerrequired to provide significant treatment. In fact, Washington Administrative Code (WAC) 173-240prohibits the use of subsurface treatment and disposal for domestic wastewater facilities above a certainsize (3,500 gallons per day for mechanical treatment plants and 14,500 gallons per day for septic tank-based disposal systems) “except under those extraordinary circumstances where no other reasonablealternative exists.”
Discharge and Reuse Systems – Treatment Requirements
Treatment plant effluent which is discharged to surface water, such as Puget Sound or a stream, needs tobe treated to secondary treatment standards or better. This typically involves primary treatment, asecondary treatment process (such as extended aeration with secondary sedimentation), and disinfection.
Discharge of final effluent to a surface water of the United States is regulated by the US EnvironmentalProtection Agency and requires a National Pollutant Discharge Elimination System permit.
Treatment plant effluent which is reused needs to be treated to standards defined by the Departments of Health and Ecology in the Water Reclamation and Reuse Standards. The highest reuse standard, Class A,usually involves advanced wastewater treatment. Advanced wastewater treatment can be an additionalfiltration process after secondary treatment or an advanced wastewater treatment process such as amembrane bioreactor plus additional disinfection as described in Table 6-1.
6-1

8/14/2019 Port Hadlock Sewer Facility Plan 0908
http://slidepdf.com/reader/full/port-hadlock-sewer-facility-plan-0908 110/387
Port Hadlock UGA Sewer Facility Plan…
Reclaimed water standards vary depending on the type of end-use and the potential for human contactwith the reclaimed water. The requirements range from Class A (highest quality) to Class D (lowestquality). Table 6-1 summarizes the basic requirements.
TABLE 6-1.WATER QUALITY REQUIREMENTS FOR REUSE PROJECTS
Parameter Class A Class B Class C Class D
BOD 30 mg/L 30 mg/L 30 mg/L 30 mg/L
TSS 30 mg/L 30 mg/L 30 mg/L 30 mg/L
TotalColiforms
2.2/100 ml (7 day);23/100 ml at any time
2.2/100 ml (7 day);23/100 ml at any time
23/100 ml (7 day);240/100 ml at any time
240/100 ml(7 day)
Turbidity 2 NTU monthly;5 NTU at any time
N/A N/A N/A
DissolvedOxygen
>0 mg/L >0 mg/L >0 mg/L >0 mg/L
Chlorineresidual 0.5 mg/L in conveyancepiping 0.5 mg/L in conveyancepiping 0.5 mg/L in conveyancepiping 0.5 mg/L inconveyance piping
NTU = nephelometric turbidity unit
Additionally, the Washington State Department of Ecology’s Criteria for Sewage Works Designstipulates reliability and redundancy requirements for the disposal system in Article 10 of the WaterReclamation and Reuse Standards. This article addresses the requirements for emergency storage anddisposal of reclaimed water where no approved alternative disposal system exists. A copy of this Articlecan be found in Appendix E.
DISCHARGE/RE-USE ALTERNATIVES
Alternatives ConsideredSeven alternatives were considered in the discharge/reuse evaluation. These alternatives are describedbelow:
• Marine Outfall: Discharge of treatment plant effluent to Port Townsend Bay through apipeline outfall.
• Irrigation at Agronomic Rates: Reuse of reclaimed water to irrigate a crop or timberland atrates not to exceed the plants’ ability to absorb the water and nutrients.
• Natural Wetlands: Discharge of final effluent into a natural wetland. The wetland wouldprovide additional treatment, nutrient removal and water uptake through transpiration andevapo-transpiration.
• Constructed Beneficial Use Wetlands: Reuse of reclaimed water using a ConstructedBeneficial Use Wetlands. Constructed wetlands provide wildlife habitat and associatedpublic benefits, water uptake through transpiration and evaporation and additional treatmentof the reclaimed water.
• Groundwater Recharge by Surface Percolation – Slow Rate Infiltration: Reuse of reclaimedwater by surface percolation into the groundwater by land application using a slow rateinfiltration gallery. The rate of application is controlled by the treatment plant operator.
6-2

8/14/2019 Port Hadlock Sewer Facility Plan 0908
http://slidepdf.com/reader/full/port-hadlock-sewer-facility-plan-0908 111/387
…6. EFFLUENT DISCHARGE/REUSE ALTERNATIVES
• Groundwater Recharge by Surface Percolation – Rapid Rate Infiltration: Reuse of reclaimedwater by surface percolation into the groundwater by land application using a rapid rateinfiltration basin (often described as a leaky bottom pond). The rate of application is limitedonly by the percolation rate of the pond bottom.
• Salinity Barrier: This is a form of reuse in which the reclaimed water is injected into thegroundwater to provide an intrusion barrier between a potable water aquifer and a saltwaterbody such as Puget Sound or the Port Townsend Bay.
Rejected Alternatives
Three alternatives were rejected early in the evaluation process. The rationale for their rejection is asfollows:
Marine Outfall
The marine outfall alternative was not considered for further evaluation following a discussion with DOEStaff in which an inter-agency agreement involving the Washington State Department of Ecology,Washington State Department of Fish and Wildlife, Washington State Department of Health, and
Washington State Department of Natural Resources was discussed. This agreement titled Inter-AgencyPermit Streamlining Document, Shellfish and Domestic Wastewater Discharge Outfall Projects, Dated
October 10, 1995 addresses the permitting of new marine outfalls for wastewater treatment plant effluentdischarge into Puget Sound. Section III(3) states:
“In exercising existing regulatory authority, state agencies with jurisdiction will
authorize domestic wastewater discharge outfall projects proposed in, near, or upon
shellfish harvesting areas only upon a demonstration of compelling reasons for approval
of the domestic wastewater discharge outfall project in question. Compelling reasons for
approval include: No other reasonable, feasible, or practical siting alternative exists.”
A marine outfall serving the proposed Port Hadlock sewer system would necessarily be adjacent toexisting harvestable shellfish beds. There are other reasonable and feasible alternatives to a marineoutfall. Therefore, a marine outfall was removed from consideration.
Natural Wetlands
The natural wetlands alternative was not considered for further evaluation since the regulatoryrequirements for discharge of treatment plant effluent to a natural wetlands are quite extensive. There is anatural wetland within the study area boundary. However, there is question as to whether the size of thewetland would be adequate and whether the regulatory community would approve such use for a naturalwetland.
Salinity Barrier
The salinity barrier alternative was not considered for further evaluation since there are not any local saltwater intrusion issues identified for the local aquifer and water wells. Additionally, the costs associatedwith treatment to the standard for direct groundwater recharge, usually requiring reverse osmosis, are veryprohibitive.
6-3

8/14/2019 Port Hadlock Sewer Facility Plan 0908
http://slidepdf.com/reader/full/port-hadlock-sewer-facility-plan-0908 112/387
Port Hadlock UGA Sewer Facility Plan…
ALTERNATIVES CONSIDERED FOR FURTHER EVALUATION
Irrigation at Agronomic Rates
Technology Description
Irrigation at agronomic rates involves applying reclaimed water to forested land or a crop. The reclaimed
water is applied only to the rate that the plants can accept water and nutrients. This reuse method does notrely on infiltration of the reclaimed water through the ground and into the groundwater. The level of treatment required for irrigation at agronomic rates is dependent upon the use of the application site, thecrops, and how the crops will be used. Table 6-2 summarizes treatment and quality requirements forreclaimed water used for irrigating crops.
TABLE 6-2.TREATMENT AND QUALITY REQUIREMENTS FOR RECLAIMED WATER USED FOR
IRRIGATING CROPS
Type of Reclaimed Water Allowed
Use Class A Class B Class C Class D
Irrigation of Nonfood Crops
Trees and Fodder, Fiber, and Seed Crops YES YES YES YES
Sod, Ornamental Plants for Commercial Use, and Pastureto which Milking Cows or Goats Have Access
YES YES YES NO
Irrigation of Food Crops
Spray Irrigation:
All Food Crops YES NO NO NO
Food Crops Which Undergo Physical or ChemicalProcessing Sufficient to Destroy All PathogenicAgents
YES YES YES YES
Surface Irrigation:
Food Crops Where There is No Reclaimed WaterContact with Edible Portion of Crop
YES YES NO NO
Root Crops YES NO NO NO
Orchards and Vineyards YES YES YES YES
Food Crops Which Undergo Physical or ChemicalProcessing Sufficient to Destroy All PathogenicAgents
YES YES YES YES
Landscape IrrigationRestricted Access Areas (e.g., Cemeteries and FreewayLandscapes
YES YES YES NO
Open Access Areas (e.g., Golf Courses, Parks, Playgrounds,School Yards and Residential Landscapes)
YES NO NO NO
6-4

8/14/2019 Port Hadlock Sewer Facility Plan 0908
http://slidepdf.com/reader/full/port-hadlock-sewer-facility-plan-0908 113/387
…6. EFFLUENT DISCHARGE/REUSE ALTERNATIVES
Irrigation Design Criteria
The key criteria for design of an irrigation system for application of reclaimed water involves the rate atwhich it can be applied to the land, and the requirements for storage during the wet season when theplants cannot accept additional moisture. For the purposes of comparing alternatives a representative rateat which plants can use water and nutrients from the reclaimed water was used. Additionally, a
representative amount of storage was used. Actual rates for application of reclaimed water and storagewould be verified depending upon the type of crop used and its actual water and nutrient requirements.
The key design criteria used for estimating land area requirements for irrigation at agronomic rates are asfollows:
Application rate: 0.1 gpd/square foot
Storage Requirements: 7 months of storage for treated effluent
Advantages and Drawbacks of Irrigation at Agronomic Rates
Several advantages and drawbacks of irrigation at agronomic rates were identified during the evaluationprocess. Below is a summary of the advantages and drawbacks of irrigation:
Advantages • Fewest regulatory issues – This system, when implemented correctly, is subject to the fewest
regulatory requirements. This is because this method does not involve disposal of treatmentplant effluent to surface water bodies or to the groundwater.
• Range of uses – Can be applied for forest lands, grasses, or non-food crops.
• Has been implemented in Western Washington.
Drawbacks • Largest land area required of all the land based reuse options.
• Largest standby storage area required of all the land based reuse options.
• Potential for public contact.
Groundwater Recharge by Surface Percolation – Slow Rate Infiltration
Technology Description
Groundwater recharge by surface percolation using slow rate infiltration involves applying reclaimedwater to the land using a series of pipes and diffuser such that the reclaimed water is applied to the land ata slow and controlled rate. The reclaimed water infiltrates through the ground to the groundwater.
Since the end fate of the treatment plant effluent is to the groundwater, it must be treated to Class A waterreuse standards plus appropriate treatment to reduce the nitrogen content to the level required by the
groundwater recharge criteria (RCW 90.46.080 and 1997 DOE Water Reclamation and Reuse Standards).
Design Criteria for Groundwater Recharge by Surface Percolation - Slow Rate Infiltration
The key criteria for the design of a slow rate infiltration system is the rate at which reclaimed water isapplied to the land and the amount of storage required for severe wet weather during winter months whenthe land is too wet to accept any water. For the purposes of comparing alternatives a representative rate atwhich soil can accept the reclaimed water was used. Additionally, a representative amount of storage was
6-5

8/14/2019 Port Hadlock Sewer Facility Plan 0908
http://slidepdf.com/reader/full/port-hadlock-sewer-facility-plan-0908 114/387
Port Hadlock UGA Sewer Facility Plan…
used. Actual rates for application of reclaimed water and storage would be verified depending upon thehydrogeologic conditions at the site.
Typical design criteria used for estimating land requirements for groundwater recharge by surfacepercolation – slow rate infiltration are as follows:
Application rate: 0.1 – 2.0 gpd/sf (dependent upon the local geology)
Storage Required: 3 days of storage for treated effluent
A preliminary geologic investigation of the area indicates that the soils in the Pt. Hadlock area have acomparatively high acceptance rate. Soils acceptance rates may be approximately 30 – 150 gpd/sf (2 -10inches per hour).
Advantages and Drawbacks of Groundwater Recharge by Surface Percolation – Slow Rate Infiltration
Advantages
• Minimizes potential for public contact.• Provides groundwater recharge.
Drawbacks • Relatively high land area required.
• Regulatory considerations (sub-surface vs. surface application critical to regulatoryrequirements), aquifer protection.
Groundwater Recharge by Surface Percolation – Rapid RateInfiltration
Technology Description
Groundwater recharge by surface percolation using rapid rate infiltration involves applying reclaimedwater to the land at a rate which is not necessarily controlled. The reclaimed water infiltrates into theearth as fast as the soils can accept it. Reclaimed water infiltrates through the soil to the groundwaterbelow. Typically and simply stated, treatment plant effluent is introduced into a “leaky bottom” pondwhere it infiltrates into the earth.
The level of wastewater treatment required for rapid rate infiltration is the same as for surface percolation– slow rate infiltration, both requiring Class A reclaimed water.
Design Criteria for Groundwater Recharge by Surface Percolation – Rapid Rate Infiltration
The key criteria for the design of a rapid rate infiltration system is the rate at which reclaimed water isapplied to the land and the amount of storage required for severe wet weather during winter months whenthe land is too wet to accept any water. For the purposes of comparing alternatives a representative rate atwhich soil can accept the reclaimed water was used. Additionally, a representative amount of storage wasused. Actual rates for application of reclaimed water and storage would be verified depending upon thehydrogeologic conditions at the site.
6-6

8/14/2019 Port Hadlock Sewer Facility Plan 0908
http://slidepdf.com/reader/full/port-hadlock-sewer-facility-plan-0908 115/387
…6. EFFLUENT DISCHARGE/REUSE ALTERNATIVES
Typical design criteria used for estimating the land requirements for groundwater recharge by surfacepercolation – rapid rate infiltration are as follows:
Application rate: 1.5 – 8.0 gpd/sf (dependent upon the local geology)
Storage Required: 3 days of storage for treated effluent
A preliminary geologic investigation (see Appendix A) of the area indicates that the soils in the Pt.Hadlock area have a comparatively high acceptance rate. Soils acceptance rates may be approximately 30– 135 gpd/sf (2 -9 inches per hour). These high acceptance rates make rapid rate infiltration a viablealternative. These values will be confirmed with a more extensive geological study during design. Aconservative application rate of 8.0 gpd/sf will be used for the purposes of estimating at this facilitiesplanning stage.
Advantages and Drawbacks of Groundwater Recharge by Surface Percolation – Rapid Rate Infiltration
Advantages
• Least land area required.• Least expensive approach due to less capital and land expenditures, low O&M costs.
• Provides groundwater recharge.
Drawbacks • Regulatory considerations regarding aquifer protection.
Constructed Wetlands
Technology Description
Constructed wetlands can be employed for either beneficial reuse of Class A reclaimed water or for
additional treatment of Class B reclaimed water. Constructed wetlands are an artificial, man-madewetland into which reclaimed water is introduced. Resident plants, animals and microorganisms utilizeany available nutrients and moisture for growth, metabolism and reproduction. These activities result inimproved water quality, wildlife habitat (and associated public benefits), and water uptake throughtranspiration and evaporation. The wetland is often constructed by installing a liner in an excavateddepression and bringing in topsoil and plants to create the wetland habitat. The reclaimed water is thendischarged at the opposite end where it can infiltrate into the groundwater, or in some cases, discharge tosurface water (such as a stream or a bay).
Constructed Wetlands Design Criteria
For the purposes of comparing alternatives a representative rate at which a constructed beneficial use wetland can use water and nutrients from the reclaimed water was used. Additionally, a representative
amount of storage was used. Actual rates for application of reclaimed water and storage would be verifieddepending upon the type of wetland plants used, their actual water and nutrient requirements, and thewetland design.
Typical design criteria used for estimating land area requirements for constructed wetlands are as follows:
Application rate: 0.5 – 1.2 gpd/sf
Storage Required: 3 days of storage for treated effluent
6-7

8/14/2019 Port Hadlock Sewer Facility Plan 0908
http://slidepdf.com/reader/full/port-hadlock-sewer-facility-plan-0908 116/387
Port Hadlock UGA Sewer Facility Plan…
Advantages and Drawbacks of Constructed Wetlands
Advantages • Provides wildlife habitat and associated public benefit.
• Works in association with groundwater recharge.
• Provides additional treatment of plant effluent.
Drawbacks • Requires more land than other land base options including, in most cases, an infiltration basin
• Creates mosquito habitat.
• Regulatory considerations (wetlands and aquifer protection).
EVALUATION OF DISCHARGE/REUSE ALTERNATIVES
Evaluation Criteria
The following evaluation criteria were used when comparing the discharge/reuse alternatives:
Land Required
How much land is required to implement the proposed method? The higher the land requirement, the lessdesirable the alternative. Both land costs and future use potential were considered.
Storage Required
How much storage is required based upon the storage criteria for the proposed method? The higher theland requirement, the less desirable the alternative. Both land costs and future use potential wereconsidered
Treatment Requirements
What is the treatment requirement associated with the proposed method? Methods requiring a higher levelof treatment to protect groundwater, the environment, and/or the public are less desirable than methodswhich require a lower level of treatment.
Opportunities for Beneficial Reuse
Does the proposed method provide opportunities for one or more means of beneficial reuse for thetreatment plant effluent? Methods which provide more opportunities for beneficial reuse are preferable.
Life Cycle Costs
What is the life cycle cost of the proposed method? These include costs for land purchase, equipmentdesign and installation, operation and maintenance, and equipment replacement costs. Alternatives withlower life cycle costs are preferable.
LIFE CYCLE COST ESTIMATING
Cost Assumptions
Total present worth and annualized costs were estimated for a 20-year period assuming 4 percent interest.The 20-year period is consistent with an approach of designing mechanical equipment to its expected life.
6-8

8/14/2019 Port Hadlock Sewer Facility Plan 0908
http://slidepdf.com/reader/full/port-hadlock-sewer-facility-plan-0908 117/387
…6. EFFLUENT DISCHARGE/REUSE ALTERNATIVES
Structures, such as buildings, were sized based on anticipated needs for a 50-year time span. A detailedbreakdown of the estimates is in Appendix C. Estimated costs were identified from the following sources:
• Land value per acre estimated from Jefferson County Assessor’s parcel database. Per acreestimates were calculated using representative parcels adjacent to the service area for slowrate and rapid rate infiltration ($28,000/acre) and remote to the service area for irrigation and
constructed wetlands ($25,000/acre). These values were estimated by multiplyingrepresentative assessed values for properties by a factor of 50 percent.
• Price quotes from local equipment suppliers.
• Unit prices for construction based on industry standards (Means 2008 Building ConstructionCost Data).
• Bid tabulations from recent, similar projects.
Table 6-3 summarizes factors used when estimating quantities for the comparative life cycles costs.
TABLE 6-3.CRITERIA USED FOR ESTIMATING COST QUANTITIES
Criteria Value/Factor
Flow Condition 2030 Maximum Monthly Flow
Storage Ponds (for constructed wetlands) 4 feet deep, 2.5 acres
Land Area Contingency 100% (estimated twice the land needed for100% reliability)
Land Buffers Added 25% of the total land area
Acceptance Rate/Days Storage: Rapid Rate Infiltration 8 gpd/square foot/3 days
Acceptance Rate/Days Storage: Slow Rate Infiltration 2 gpd/square foot/3 days
Acceptance Rate/Days Storage: Wetlands 1.2 gpd/square foot/3 days
Acceptance Rate/Days Storage: Irrigation 0.1 gpd/square foot/210 daysLand Value –Infiltration $28,000/acre
Land Value – Irrigation & Wetlands $25,000/acre
The capital cost represents the total project cost for implementation of each disposal/reuse alternative.
The life cycle costs include land cost, equipment costs, installation costs for piping, electrical, andcontrols, site work, mobilization/demobilization/bonding, contractor overhead and profit, escalation tomid-point of construction, planning-level contingency, engineering design and construction management,and Washington state sales tax. These amounts are reflected in the attached cost estimates.
Annual O&M costs for each disposal/reuse alternative were estimated based on power requirements,
chemicals, and labor (general operation, maintenance and cleaning). Additionally, replacement cost of equipment and structures are included in the comparative life cycle costs. Replacement costs represent adollar amount required each year to be set aside in order to replace buildings, structures, and equipment.Replacement allowances of 2 percent for buildings and structures (replace every 50-years), and 4 percentfor equipment (replace every 20 to 25 years) were included in the life cycle cost estimates. These amountsare reflected in the attached cost estimates.
6-9

8/14/2019 Port Hadlock Sewer Facility Plan 0908
http://slidepdf.com/reader/full/port-hadlock-sewer-facility-plan-0908 118/387
Port Hadlock UGA Sewer Facility Plan…
6-10
Summary of Life Cycle Costs
Summaries of the 20-year life cycle costs for each of the disposal/reuse alternatives are located at thebottom of Table 6-4 in the next section.
Structural costs include costs for site work, process piping, valving and electrical. Equipment costs
include pump stations and force main/distribution piping associated with the pump station. The operationand maintenance costs represent a net present value of the annual operations and maintenance costs overthe next 20 years for each alternative.
The life cycle costs do not include costs for associated treatment processes. An evaluation of the costs fortreatment alternatives is presented in Chapter 7 – Wastewater Treatment Alternatives.
SUMMARY OF EVALUATION OF DISPOSAL/REUSE ALTERNATIVES
Each of the alternatives was evaluated against the above described criteria. Table 6-4 is a summary of theevaluation of the alternatives against the criteria. The Land Application areas shown in Table 6-4 includethe necessary area for a 100% redundant disposal field.

8/14/2019 Port Hadlock Sewer Facility Plan 0908
http://slidepdf.com/reader/full/port-hadlock-sewer-facility-plan-0908 119/387
…
6 .
E F F L U E N T D I S C H A R G E / R E U S E A L T E R N A T I V E S
T A B L E 6 - 4 .
S U M M A R
Y O F A L T E R N A T I V E S E V A L U A
T I O N
A l t e r n a t i v e
E v a l u a t i o n C r i t e r i a
I r r i g a t i o n
S l o w R a t e I n f i l t r a t i o n
R a p i d R a t e I n f i l t r a t i o n
C o n s
t r u c t e d W e t l a n d s
L a n d R e q u i r e d
L
a n d A p p l i c a t i o n : 4 6 0 a c r e s
S
t o r a g e : 8 1 a c r e s
B
u f f e r s ( 2 5 % o f t o t a l ) : 1 3 5 a c r e s
L a n d A p p l i c a t i o n : 2 3 a c r e s
S t o r a g e : I n c l u d e d i n l a n d
a p p l i c a t i o n a r e a
B
u f f e r s ( 2 5 % o f t o t a l ) : 8 a c r e s
L a n d
A p p l i c a t i o n : 5 . 7 a c r e s
S t o r a g e : I n c l u d e d i n l a n d
a p p l i c a t i o n a r e a
B u f f e r s ( 2 5 % o f t o t a l ) : 3 a c r e s
L a n d A p p l i c a t i o n : 2 9 a c r e s
S t o r a g e : 2 . 5 a c r e s
B u f f e r s
( 2 5 % o f t o t a l : 9
a c r e s )
S t o r a g e R e q u i r e d
E
s t i m a t e d t h a t e f f l u e n t w i l l n e e d
t o b e s t o r e d f o r 7 m o n t h s d u r i n g
t h e y e a r w h e n t h e s o i l w i l l b e t o o
w
e t f o r i r r i g a t i n g . A t 1 m g d
m
a x i m u m m o n t h l y f l o w , 2 1 0
m
i l l i o n g a l l o n s o f s t o r a g e w i l l b e
r e q u i r e d
E f f l u e n t w i l l b e s t o r e d f o r 3
d a y s d u r i n g s e v e r e w e t
c o n d i t i o n s w h e n s o i l s c a n n o t
i n
f i l t r a t e a n y a d d i t i o n a l w a t e r .
A
t 1 m g d m a x i m u m m o n t h l y
f l o w , 3 m i l l i o n g a l l o n s o f
s t
o r a g e w i l l b e r e q u i r e d .
E f f l u
e n t w i l l b e s t o r e d f o r 3
d a y s
d u r i n g s e v e r e w e t
c o n d
i t i o n s w h e n s o i l s c a n n o t
i n f i l t r a t e a n y a d d i t i o n a l w a t e r .
A t 1
m g d m a x i m u m m o n t h l y
f l o w , 3 m i l l i o n g a l l o n s o f
s t o r a
g e w i l l b e r e q u i r e d .
E f f l u e n t w i l l b e s t o r e d f o r 3
d a y s d u r i n g s e v e r e w e t
c o n d i t i o
n s w h e n s o i l s c a n n o t
i n f i l t r a t e a n y a d d i t i o n a l
w a t e r . A
t 1 m g d m a x i m u m
m o n t h l y
f l o w , 3 m i l l i o n
g a l l o n s o f s t o r a g e w i l l b e
r e q u i r e d
.
T r e a t m e n t
R e q u i r e m e n t
E
f f l u e n t c a n b e t r e a t e d t o
s e c o n d a r y t r e a t m e n t s t a n d a r d s .
P
l a n t s w i l l p r o v i d e a d d i t i o n a l
t r e a t m e n t . W a t e r w i l l b e a p p l i e d
a
t a r a t e w h i c h p l a n t s w i l l u s e .
N
o i n f i l t r a t i o n t h r o u g h t h e s o i l t o
g
r o u n d w a t e r .
M
u s t t r e a t t o C l a s s A R e u s e
s t
a n d a r d s w i t h n i t r o g e n
r e
m o v a l t o m e e t g r o u n d w a t e r
r e
c h a r g e c r i t e r i a s i n c e e f f l u e n t
w
i l l r e a c h g r o u n d w a t e r a f t e r
i n
f i l t r a t i o n t h r o u g h s o i l .
M u s t t r e a t t o C l a s s A R e u s e
s t a n d
a r d s w i t h n i t r o g e n
r e m o
v a l t o m e e t g r o u n d w a t e r
r e c h a r g e c r i t e r i a s i n c e e f f l u e n t
w i l l r e a c h g r o u n d w a t e r a f t e r
i n f i l t r a t i o n t h r o u g h s o i l .
C o m p l i c a t e d r e g u l a t o r y
r e q u i r e m
e n t s s p e c i f y l e v e l o f
t r e a t m e n t t o C l a s s A t h r o u g h
C l a s s C
s t a n d a r d s d e p e n d i n g
o n p o t e n
t i a l f o r h u m a n
c o n t a c t ,
t y p e a n d u s e o f
c o n s t r u c
t e d w e t l a n d ,
h y d r o l o g i c c o n d i t i o n s .
6 - 1 1

8/14/2019 Port Hadlock Sewer Facility Plan 0908
http://slidepdf.com/reader/full/port-hadlock-sewer-facility-plan-0908 120/387
P o r t H a d l o c k U G A S e w e r F a c i l i t y P l a n …
6 - 1 2
T A B L E 6 - 4 ( C O N T I N U E D ) .
S U M M A R
Y O F A L T E R N A T I V E S E V A L U A
T I O N
A l t e r n a t i v e
E v a l u a t i o n C r i t e r i a
I r r i g a t i o n
S l o w R a t e I n f i l t r a t i o n
R
a p i d R a t e I n f i l t r a t i o n
C o n s t r u c t e d W e t l a n d s
O p p o r t u n i t i e s f o r
B e n e f i c i a l R e u s e
T
h i s m e t h o d d o e s n o t l e n d i t s e l f
t o m a n y o p p o r t u n i t i e s f o r
b
e n e f i c i a l r e u s e b e c a u s e o f t h e
l e v e l o f t r e a t m e n t . T h e
s e c o n d a r y e f f l u e n t m u s t b e
r e u s e d a t t h e d e s i g n a t e d
i r r i g a t i o n s i t e s i n c e t h e e f f l u e n t
i s n o t a d e q u a t e l y t r e a t e d f o r
u
n r e s t r i c t e d r e u s e a n d / o r h u m a n
c
o n t a c t . T h i s m e t h o d m a y
p
r o d u c e t h e a d d i t i o n a l b e n e f i t o f
a
h a r v e s t a b l e p r o d u c t s u c h a s
t i m b e r , o r s o m e o t h e r n o n - f o o d
c
r o p .
T h i s m e t h o d l e n d s i t s e l f t o
s e
v e r a l o p p o r t u n i t i e s f o r
b e n e f i c i a l r e u s e s i n c e t h e
e f f l u e n t m u s t b e t r e a t e d t o
C
l a s s A r e u s e s t a n d a r d s . T h e
l e
v e l o f t r e a t m e n t a n d
d i s i n f e c t i o n r e s u l t i n e f f l u e n t
w
h i c h i s s u i t a b l e f o r r e u s e a n d
p u b l i c c o n t a c t . T h e e f f l u e n t
c a n b e u s e d t o r e c h a r g e
g r o u n d w a t e r a n d s o m e o r a l l
o f i t c a n b e u s e d f o r o t h e r u s e s
s u
c h a s i r r i g a t i o n i n p a r k s / g o l f
c o u r s e s ,
i n
d u s t r i a l / c o m m e r c i a l u s e ,
s e
w e r l i n e f l u s h i n g , e t c .
S a m e a s f o r s l o w r a t e
i n f i l t r a t i o n .
C o n s t r u c t e d B e n e f i c i a l U s e
W e t l a n d
s p r o v i d e m a x i m u m
o p p o r t u n i t y f o r r e u s e
e x c l u d i n
g o n l y g r o u n d w a t e r
r e c h a r g e . C o n s t r u c t e d
T r e a t m e
n t W e t l a n d s p r o v i d e
m o r e l i m
i t e d o p p o r t u n i t i e s ,
d e p e n d i n g o n t h e u l t i m a t e
l e v e l o f
t r e a t m e n t o b t a i n e d
b y t h e s y s t e m .
C o m p a r a t i v e 2 0 - y e a r
L i f e C y c l e C o s t s
S t o r a g e
$ 3 , 3 5 7 , 5 0 0
- -
- -
$ 1 0 4 , 2 0 0
L a n d A p p l i c a t i o n
$ 1 9 , 1 3 4 , 4 0 0
$ 1 , 1 3 6 , 4 5 0
$ 2 6 8 , 2 5 0
$ 1 , 5 9 4 , 8 0 0
S t r u c t u r a l / E q u i p m e n t
$ 1 6 , 5 3 9 , 7 0 0
$ 2 , 6 7 3 , 5 5 0
$ 1 , 4 1 0 , 7 5 0
$ 4 6 , 9 9 8 , 5 0 0
S u b t o t a l C a p i t a l
$ 3 9 , 0
3 1 , 6
0 0
$ 3 , 8
1 0 , 0
0 0
$ 1 , 6
7 9 , 0
0 0
$ 4 8 , 6
9 7 , 5
0 0
N P V O & M
$ 2 , 8 2 1 , 0 0 0
$ 6 2 9 , 0 0 0
$ 7 2 8 , 0 0 0
$ 8 , 2 0 0 , 0 0 0
T o t a l 2 0 - Y e a r L i f e
C y c l e C o s t s
$ 4 1 , 8
5 2 , 6
0 0
$ 4 , 4
3 9 , 0
0 0
$ 2 , 4
0 7 , 0
0 0
$ 5 6 , 9
8 7 , 5
0 0

8/14/2019 Port Hadlock Sewer Facility Plan 0908
http://slidepdf.com/reader/full/port-hadlock-sewer-facility-plan-0908 121/387
…6. EFFLUENT DISCHARGE/REUSE ALTERNATIVES
RECOMMENDED RE-USE ALTERNATIVE
Stakeholder Workshop Process
The results of the alternative evaluation were presented to the Jefferson County Board of CountyCommissioners at a workshop on May 25, 2006. The workshop was open to the public and some key
stakeholders in the community were invited to attend. A presentation was given outlining the alternativedisposal/reuse options, their relative advantages and drawbacks, and their respective life cycle costs.
The design team presented its technical perspective on each of the alternatives and received feedback andquestions from the Board of County Commissioners, County staff, the stakeholders/public attending theworkshop. This feedback was considered in the technical recommendation.
Recommendation
It was recommended that treatment plant effluent reuse through rapid rate infiltration be selected as thepreferred alternative for the proposed wastewater treatment facility.
Reuse through rapid rate infiltration was recommended based upon the following key reasons:• Lowest 20-year life cycle cost. This alternative has the lowest 20-year life cycle costs because
the amount of land required is less than any of the other land based reuse or disposalalternatives considered. Additionally, rapid rate infiltration requires the least amount of piping and associated equipment further reducing the capital cost and the operation andmaintenance requirements.
• Provides opportunities for beneficial reuse. This alternative provides good opportunities forbeneficial reuse. Stakeholders and the community have expressed interest in beneficial reuseopportunities for treatment plant effluent. A specific reuse strategy mentioned by members of the public was water recharge for Chimacum Creek. The use of rapid rate infiltration at a sitelocated in the vicinity of Chimacum Creek would provide recharge through localgroundwater. Determination of an advantageous site would be part of a hydrogeologic surveyof potential reuse sites.
6-13

8/14/2019 Port Hadlock Sewer Facility Plan 0908
http://slidepdf.com/reader/full/port-hadlock-sewer-facility-plan-0908 122/387

8/14/2019 Port Hadlock Sewer Facility Plan 0908
http://slidepdf.com/reader/full/port-hadlock-sewer-facility-plan-0908 123/387
CHAPTER 7.WASTEWATER TREATMENT ALTERNATIVES
This chapter summarizes wastewater treatment (including liquid process, disinfection, and solidshandling), provides a technical evaluation of the alternative options, and presents a technicalrecommendation for preferred wastewater treatment, disinfection, and solids handling methods.
LIQUID PROCESS TREATMENT REQUIREMENTS
Discharge/Reuse Method Determines Treatment
The level of treatment is dependent upon the selected method of effluent disposal or reuse. Theregulations dictate the requirements for treatment depending upon the end use of the final effluent.Table 7-1 summarizes the general level of treatment required depending upon the disposal or reuse optionfor the final effluent. The following sections describe the treatment requirements in greater detail.
Levels of Treatment
Water reuse systems must meet treatment standards, as defined by the Departments of Health andEcology in the Water Reclamation and Reuse Standards. Reclaimed water standards vary depending onthe type of end-use and the potential for human contact with the reclaimed water. The requirements varyfrom Class A (highest quality) to Class D (lowest quality). Reclaimed water of each quality level can beachieved through appropriate levels of secondary or advanced treatment and disinfection. Table 7-2summarizes the treatment criteria for various reuse applications.
TABLE 7-1.
SUMMARY OF TREATMENT REQUIREMENTS FOR VARIOUS DISPOSAL/REUSE OPTIONS
Disposal/Reuse Option Secondary Treatment Advanced Treatment
Irrigation/Land Application Certain Types of Fodder & FiberCrops
Most Applications (food, publicaccess)
Groundwater Recharge by SurfacePercolation – Slow RateInfiltration
No Yes
Groundwater Recharge by SurfacePercolation – Rapid RateInfiltration
No Yes
Marine Outfall Unlikely LikelyConstructed Wetlands Possible Likely
Groundwater Injection No Yes (with reverse osmosis)
7-1

8/14/2019 Port Hadlock Sewer Facility Plan 0908
http://slidepdf.com/reader/full/port-hadlock-sewer-facility-plan-0908 124/387
Port Hadlock UGA Sewer Facility Plan…
TABLE 7-2.WATER QUALITY REQUIREMENTS FOR REUSE PROJECTS
Parameter Class A Class B Class C Class D
BOD 30 mg/L 30 mg/L 30 mg/L 30 mg/L
TSS 30 mg/L 30 mg/L 30 mg/L 30 mg/L
TotalColiforms
2.2/100 ml (7 day);23/100 ml at any time
2.2/100 ml (7 day);23/100 ml at any time
23/100 ml (7 day);240/100 ml at any time
240/100 ml(7 day)
Turbidity 2 NTU monthly;5 NTU at any time
N/A N/A N/A
DissolvedOxygen
>0 mg/L >0 mg/L >0 mg/L >0 mg/L
Chlorineresidual
0.5 mg/L in conveyancepiping
0.5 mg/L in conveyancepiping
0.5 mg/L in conveyancepiping
0.5 mg/L inconveyance piping
NTU = nephelometric turbidity unit
Secondary Treatment
Secondary treatment typically involves a biological oxidation process which produces a biological“sludge” which can be separated from the liquid process. The liquid is then disinfected by one of avariety of methods prior to disposal or reuse. Wastewater treatment processes which achieve secondarylevels of treatment include activated sludge, sequencing batch reactors (SBR), rotating biologicalcontactors, trickling filters, lagoons and oxidation ditches. All are followed by secondary clarification.Wastewater treated to the secondary level can meet Class B, C, or D reclaimed water standards if specificdesign and operational standards are met. These standards and processes are discussed in further detail insubsequent sections of this chapter.
Advanced Wastewater Treatment
Some type of advanced wastewater treatment is needed to achieve Class A level final effluent. Advancedwastewater treatment processes include membrane bioreactors (MBR’s), reverse osmosis or one of avariety or mechanical filtration systems following an appropriate secondary treatment process.Supplemental filtration is typically provided by media filters using sand and/or anthracite coal or clothfilters.
Advanced wastewater treatment can also provide ammonia removal (nitrification) and nitrate removal(denitrification) which are required for beneficial-reuse land-application in excess of agronomic uptakerates. For surface percolation facilities, nitrate levels must be reduced to 10 mg/L and nitrite levelsreduced to 1 mg/L. These levels are based on the federal primary standards for drinking water.
Reliability and Redundancy RequirementsWashington State Department of Ecology’s Criteria for Sewage Works Design stipulates reliability andredundancy requirements for the treatment system in Article 11 of the Water Reclamation and ReuseStandards. This article addresses the requirements for emergency storage and disposal of untreated orpartially treated wastewater. A copy of this Article can be found in Appendix E.
7-2

8/14/2019 Port Hadlock Sewer Facility Plan 0908
http://slidepdf.com/reader/full/port-hadlock-sewer-facility-plan-0908 125/387
…7. WASTEWATER TREATMENT ALTERNATIVES
WASTEWATER TREATMENT ALTERNATIVES
Alternatives Considered
Eight wastewater treatment processes were considered for evaluation. These alternatives are describedbelow:
• Recirculating filters – This process uses a filtration media to treat the wastewater. Typically,a septic tank is provide upstream of the filter to remove settleable solids. Effluent from theseptic tank is passed through a coarse media filter. A portion of the filter effluent isrecirculated back through the filter combining with the incoming septic tank effluent. Theremaining final effluent is discharged to disposal or reuse.
• Lagoons – Facultative lagoons, stabilization ponds and aerated lagoons use large, open,earthen lagoons to store wastewater, provide aeration, and settle solids.
• Constructed Treatment Wetlands – Constructed Treatment Wetlands are an artificial, man-made wetland into which wastewater is introduced. Resident plants, animals andmicroorganisms utilize any available nutrients and moisture for growth, metabolism andreproduction. These activities result in improved water quality, wildlife habitat (and
associated public benefits), and water uptake through transpiration and evaporation.
• Fixed Film Processes – Fixed film or attached growth processes use an inert media asattachment sites for growth of microorganisms that convert organic material in wastewaterinto biological cell matter. Examples of fixed processes include trickling filters and rotatingbiological contactors.
• Oxidation Ditch – An oxidation ditch uses a long, continuous channel, typically oval orcircular to provide an aerobic environment where oxidation of carbonaceous and nitrogenouswastes (BOD) occurs. This aerobic environment is typically created by low-speed surfaceaerators that also serve as mixers.
• Sequencing Batch Reactor (SBR) – SBR’s are a variation of the activated sludge process thatoperate in a batch mode instead of a continuous-flow mode. Aeration and secondary
clarification occur in the same tank. Two or more parallel basins are required so that influentflows can be treated continuously by this batch process. Control valves, mixers, aerators, anddecanters cycle the wastewater flow through different operational modes within the tanks.Aeration can be in the form of diffused air or jet aeration. The sequential operating modes,which take place in the same basin, include filling, reacting, settling, decanting, and sludgewasting. If designed and operated properly, this type of system can remove nutrients such asnitrogen and phosphorus through proper programming of the batch process.
• Membrane Bioreactor (MBR) – The MBR process combines the extended aeration activatedsludge process with a physical separation process using membranes immersed in the aerationbasins. The membranes replace separate downstream clarifiers. By providing a positivebarrier to virtually all particulate, colloidal and dissolved solids above the 0.1 micron range,
the membranes produce an exceptional effluent quality, superior to that of extended aerationactivated sludge followed by conventional filters. Chemical coagulation is likely not requiredfor MBRs to meet Class A reclaimed water standards. Because the membranes provide apositive barrier to solids, the activated sludge system can operate at very high mixed-liquorsuspended solids (MLSS) concentrations, significantly reducing the size of the aeration basincompared to typical extended aeration activated sludge plants.
• Reverse Osmosis (RO) – Reverse osmosis systems produce an ultra-high quality, purifiedClass A reclaimed water. RO systems are typically used to “polish” the effluent from an
7-3
8/14/2019 Port Hadlock Sewer Facility Plan 0908
http://slidepdf.com/reader/full/port-hadlock-sewer-facility-plan-0908 126/387
Port Hadlock UGA Sewer Facility Plan…
advanced wastewater treatment system when direct discharge to ground water is employed asthe preferred reuse option. Reverse Osmosis involves forcing the process water through asemi-permeable membrane at high pressure. Pollutant removal is achieved through diffusionand electrostatic charge exclusion as well as size exclusion, thereby providing significantvirus, dissolved salt and metal ion removal.
Rejected Alternatives
Six alternatives were rejected early in the evaluation process. The rationale for their rejection is asfollows:
Recirculating Filters + Filter
Recirculating filters can meet secondary effluent quality standards for biochemical oxygen demand(BOD) and total suspended solids (TSS). However, using this technology, it is difficult to producer aneffluent which can be reliably filtered to meet advanced treatment requirements for Class A turbidity.Additionally, this process does not provide sufficient nitrogen removal without supplemental treatment.This process is generally not used for treatment plants over 0.5 mgd because it has high capital costs andrequires a large area for the filters.
Lagoons + Filter
Lagoons were rejected because it is difficult to producer an effluent which can be reliably filtered to meetadvanced treatment requirements for Class A TSS due to high levels of algae generated in the lagoon.Additionally, lagoons cannot provide consistent nitrogen removal, require significant land area, can bequite odorous and do not lend themselves to odor control.
Constructed Wetlands
Constructed wetlands require a large land area in order to meet anticipated regulatory standards. Pastexperience indicates wetlands can meet BOD, TSS, and nitrogen reduction requirements when operated atrelatively low wastewater loading rates. However, constructed wetlands can provide polishing treatment
after all standards have been met.
Fixed Film Processes + Filter
Fixed film processes can meet BOD and TSS requirements. However, using this technology, it is difficultto produce an effluent which can be reliably filtered to meet advanced treatment requirements for Class Aturbidity. Additionally, fixed film processes are not able to meet nitrogen removal requirements withoutsupplemental treatment. Finally, these processes are prone to high odor potential requiring expensive andcomplex odor control systems.
Reverse Osmosis
Reverse osmosis was rejected due to high capital and operating costs. The energy cost to provide high
pressure feed water is prohibitive. Maintenance of the semi-permeable membranes is also expensive andtime consuming. Since direct injection to the groundwater is not being considered, this alternative is not justifiable.
Oxidation Ditch + Filter
Oxidation ditch plus filtration was rejected due to the difficulty in implementing the system in phasesadequate to provide redundancy and reliability. These systems are not modular and thus, result inoversizing of initial phases. This leads to higher initial costs and could prove to be difficult to operate at
7-4

8/14/2019 Port Hadlock Sewer Facility Plan 0908
http://slidepdf.com/reader/full/port-hadlock-sewer-facility-plan-0908 127/387
…7. WASTEWATER TREATMENT ALTERNATIVES
the subsequent low wastewater loading rates. Initial estimates suggest that the higher costs of phasingwould not be sufficiently off-set by lower O&M costs.
ALTERNATIVES CONSIDERED FOR FURTHER EVALUATION
Sequencing Batch Reactor + Filter
Technology Description
SBRs are a variation of the activated sludge process that operate in a batch mode instead of a continuous-flow mode. Aeration and secondary clarification occur in the same tank. Two or more parallel basins arerequired so that influent flows can be treated continuously by this batch process.
Control valves, mixers, aerators, and decanters cycle the wastewater flow through different operationalmodes within the tanks. Aeration can be in the form of diffused air or jet aeration. The sequentialoperating modes, which take place in the same basin, include filling, reacting, settling, drawing ordecanting, and idle mode when sludge is wasted from the wastewater treatment process to the solidshandling processes. During the fill phase, the basin is filled with wastewater and aeration begins. Aerationcontinues through the react phase. The aerators are then turned off and the biomass is settled. During the
draw phase, treated effluent is removed from the basin by a decanter. Finally, settled sludge is pumpedfrom the basin for final treatment during the idle mode while the basin waits to receive the next batch of wastewater flow and repeat the cycle of phases. If designed and operated properly, this type of system canremove nutrients such as nitrogen and phosphorus through proper programming of the batch process.Figure 7-1 shows a simple process diagram and a photo of a typical SBR facility.
Decant To Filter
Screened andDegritted RawWastewater
Figure 7-1. Sequencing Batch Reactor Process Schematic and Example Facility in Waldport, Oregon
Because mixed liquor is retained in the reactor during all cycles, separate secondary clarifiers are notrequired. However, batch treatment operation leads to peaking flows downstream, and these flows wouldhave to be equalized to minimize the size of downstream facilities. Flow equalization would be sized to
process decant flows. Tanks would not be allowed to fill and decant simultaneously at high flows.
The control system allows for control over a range of flows; a batch-proportional program is used forlow-flow conditions and a flow-proportional program is used for average and peak-flow conditions. SBRsystems are computer-controlled and tend to be more complex and mechanically intensive than otheractivated sludge treatment processes. Variation of the cycles and their timing results in greater operationalflexibility to meet different effluent requirements. The reliance on automated equipment andcomputerized control demands a higher level of operational and maintenance sophistication thanconventional activated sludge systems. Maintenance of these systems can be expensive and demanding.
7-5

8/14/2019 Port Hadlock Sewer Facility Plan 0908
http://slidepdf.com/reader/full/port-hadlock-sewer-facility-plan-0908 128/387
Port Hadlock UGA Sewer Facility Plan…
Design Criteria: Sizing & Phasing
A sizing and phasing plan for an SBR with filter treatment system was developed for use in comparingalternatives. The system was sized and phased to meet population, flow, and loading estimates describedin Chapter 4 – Population, Flow and Loads.
The system was planned in four distinct phases. These phases are described as follows:• Phase I: Two 0.125 mgd Reactors - Construct two 0.125 mgd reactors with a third 0.125 mgd
reactor for standby. The two 0.125 mgd reactors to be constructed as a single 0.25 mgdreactor cell which can be combined to function as one cell in the future. A filter buildingwould be constructed and filter equipment needed for initial flows through Phase II installed.
• Phase II: Two 0.25 mgd Reactors with Storage – Expand the 0.125 mgd standby reactor cellto 0.25 mgd by constructing a 0.125 mgd expansion. Combine the two working cells fromPhase I by demolishing the wall between them or opening a sluice gate between the two cellsso they can operate as a single volume. This results in two working 0.25 mgd cells. Constructa 0.75 mgd storage basin for equalization and emergency storage. This emergency storage isin addition to the emergency storage provided at the disposal site. This would provide backup
in conjunction with storage should one 0.25 mgd cell need to go offline.• Phase III: Three 0.25 mgd Reactors – Construct a third 0.25 mgd reactor to accommodate
increasing flows. The 0.75 mgd storage pond constructed in Phase II would still be used forequalization storage and to provide storage should one or more reactors need to go offline.Additional filter equipment would be installed to meet increased wastewater flow.
• Phase IV: Four 0.25 mgd Reactors – Construct a fourth 0.25 mgd reactor to accommodateincreasing flows. The storage pond would still be used for flow equalization and backupshould part of the system need to go offline. This would provide a firm treatment capacity of 1 mgd to meet the anticipated 2030 maximum monthly flow of 0.98 mgd.
Advantages and Drawbacks
Several advantages and drawbacks of sequencing batch reactors with filtration for processing wastewaterwere identified during the evaluation. Below is a summary of the advantages and drawbacks:
Advantages • Provides good effluent quality – Can meet Class B, C, D reclaimed water standards.
• Can achieve Class A reclaimed water standards and nitrogen reduction with filtration.
• Proven technology – experience within Washington State.
• Modular – The system can be constructed in smaller phases to accommodate populationgrowth.
• Operational Flexibility – Through variation of the cycles and their timing, greater operational
flexibility can be achieved to meet different regulatory requirements.
Drawbacks • Treats wastewater in batches making system timing and sequencing critical. This can present
challenges when responding to significant variations from peak flow events. However, SBR’scan address peaks by equalizing fill cycles. But equalizing fill cycles also can result inoperational issues and problems with batch consistency.
7-6

8/14/2019 Port Hadlock Sewer Facility Plan 0908
http://slidepdf.com/reader/full/port-hadlock-sewer-facility-plan-0908 129/387
…7. WASTEWATER TREATMENT ALTERNATIVES
• System requires more computer control and mechanical valving than other extended aerationtreatment processes.
• Equipment maintenance – Prompt repairs are essential because SBR’s usually have lessredundancy than other activated sludge systems.
Membrane BioreactorTechnology Description
The membrane bioreactor (MBR) process combines the extended aeration activated sludge process with aphysical separation process using membranes immersed in the aeration basins. The membranes replaceseparate downstream clarifiers. By providing a positive barrier to virtually all particulate, colloidal anddissolved solids above the 0.1 micron range, the membranes produce an exceptional effluent quality,superior to that of extended aeration activated sludge followed by conventional filters. Chemicalcoagulation is likely not required for MBRs to meet Class A reclaimed water standards since sludgesettleability is not a consideration. Figure 7-2 shows a membrane bioreactor system.
In addition to aeration air, coarse bubble diffused air is used to scour the membranes and prevent
excessive fouling. Significant quantities of air are required for membrane scouring, usually equaling orexceeding the requirement for aeration air. This can result in significant operating costs, since aeration airproduction is often the most energy intensive component of wastewater treatment plant operation. Back-pulsing with chemical cleansing agents may be required to remove accumulated solids, depending on thetype of membranes.
Because the membranes provide a positive barrier to solids, the activated sludge system can operate atvery high mixed-liquor suspended solids (MLSS) concentrations, on the order of 10,000 to 15,000 mg/L.Typical extended aeration activated sludge plants operate at MLSS concentrations between 2,000 and4,000 mg/L. The high MLSS concentrations mean that the plant can run at a low hydraulic retention timeand a high solids retention time, significantly reducing the size of the aeration basin compared to typicalextended aeration activated sludge plants.
Two types of membranes are available: hollow fiber units composed of a membrane wrapped around areinforced hollow fiber tube; and flat membrane sheets on top of plastic panels for reinforcement. Ineither case, wastewater is filtered through the membrane, and filtered effluent passes through themembrane onto the next step of the treatment plant.
Settleability is not a consideration with this process due to the membranes’ being a barrier to solids. Thisis a significant advantage over typical activated sludge plants, where the activated sludge biology must bemonitored to encourage development of microorganisms that settle quickly in a clarifier basin.
A disadvantage of the MBR process is that the membranes are not well-suited to treating peak flows.Because membrane capacity must be designed for treating peak flows, much of the capacity will not beused until infrequent peak flows occur. In many cases, pre-MBR equalization basins are recommended toequalize peak flows to the MBRs. Alternatively, equalization can be achieved by providing additionalfreeboard in the membrane basins.
Another disadvantage is the requirement to replace membranes every five to ten years, depending on themanufacturer. The membranes make up a significant portion of the cost of the facilities, so frequentreplacement can translate into high present worth costs.
7-7

8/14/2019 Port Hadlock Sewer Facility Plan 0908
http://slidepdf.com/reader/full/port-hadlock-sewer-facility-plan-0908 130/387
Port Hadlock UGA Sewer Facility Plan…
Addition of an anoxic selector tank upstream of the aeration basins with internal recycle allows fornitrogen reduction.
Design Criteria: Sizing & Phasing
A significant advantage of the MBR process is its ability to be implemented in phases. It can be
constructed in many small increments by adding basins and membrane cassettes as needed.
A sizing and phasing plan for an MBR system was developed for use in comparing alternatives. Thesystem was sized and phased to meet population, flow, and loading estimates described in Chapter 4 –Population, Flow and Loads.
Figure 7-2: Membrane Bioreactor Process Schematic and Example Facility in Bandon Dunes, Oregon
The system was planned in four distinct phases. These phases are described as follows:
• Phase I: Two 0.25 mgd MBR Treatment Trains - Construct two 0.25 mgd reactors. Onereactor will provide capacity for treatment of the initial flows, the other reactor will bestandby to provide redundancy.
• Phase II: Add Storage – Once flows exceed 0.25 mgd, both reactor trains will be used forprocessing of wastewater. At this point, a storage basin sized for 3 days’ of flow from a singletreatment train will be added to provide emergency storage should one of the trains be taken
7-8

8/14/2019 Port Hadlock Sewer Facility Plan 0908
http://slidepdf.com/reader/full/port-hadlock-sewer-facility-plan-0908 131/387
…7. WASTEWATER TREATMENT ALTERNATIVES
offline for maintenance or repair. Additionally, the storage can be utilized for flowequalization in the future when peak flows might temporarily exceed the capacity of theexisting systems. This emergency storage is in addition to the storage provided at the disposalsite.
• Phase III: Add MBR Treatment Capacity – Construct tankage for an additional 0.50 mgd of
capacity. However, membranes will be installed in this phase for an additional 0.25 mgd of treatment capacity. This will result in a total treatment capacity of 0.75 mgd. The Phase IIstorage facility will still be used for equalization and for redundancy should any of thetreatment process need to be taken offline.
• Phase IV: Add Membranes for 1.0 mgd Total Capacity – Install the remaining membranes inthe Phase III tankage. This will provide 1.0 mgd total capacity and the storage will provideequalization and capacity should part of the treatment process need to be taken offline.
Advantages and Drawbacks
Several advantages and drawbacks of membrane bioreactors for processing wastewater were identifiedduring the evaluation. Below is a summary of the advantages and drawbacks:
Advantages • Continuous treatment of wastewater making controlling and monitoring the treatment process
easier. This can result in more consistent and reliable effluent quality.
• Produces Class A reclaimed water without a separate filtration process.
• No separate secondary clarifiers or coagulation process required.
• State-of-the-art wastewater treatment process which is best suited to address future potentialwastewater treatment requirements such as removal of pharmaceuticals and personal careproducts and endocrine disruptors (hormones) in wastewater.
• Modular and scalable process making expanding the treatment process easy throughout thedevelopment phases of the wastewater system.
Drawbacks • Potentially higher cost – Membrane bioreactors have historically been a more cost intensive
process due to the capital investment in the membranes and operations costs associated withadditional aeration and pumping. However, these costs have been coming down significantlyin recent years making MBR processes more competitive with other advanced wastetreatment systems.
• Membrane Maintenance – The membranes must be maintained and kept clean so they do notfoul. This increases the requirement for system air in order to “shake off” accumulated solidsand keep the membranes clean.
EVALUATION OF WASTEWATER TREATMENT ALTERNATIVESEvaluation Criteria
The following evaluation criteria were used when comparing the wastewater treatment alternatives:
Effluent Quality
Can the proposed process reliably and consistently provide effluent to an acceptable level of treatment?Are there any additional design provisions, operational considerations, and/or redundancies that need tobe included in order to reliably and consistently perform?
7-9

8/14/2019 Port Hadlock Sewer Facility Plan 0908
http://slidepdf.com/reader/full/port-hadlock-sewer-facility-plan-0908 132/387
Port Hadlock UGA Sewer Facility Plan…
Phasing
Does the technology lend itself to developing the treatment system in discreet phases? Are thecomponents of the process modular and have some flexibility regarding size (i.e.) are they scalable?
Operational Characteristics
Are there any operational advantages or drawbacks associated with the proposed treatment technology?
Life Cycle Costs
What is the life cycle cost of the proposed method? These include costs for land purchase, equipment,design and installation, operation and maintenance, and equipment replacement costs. A lower life cyclecost is preferable.
LIFE CYCLE COST ESTIMATING
Cost Assumptions
Total present worth and annualized costs were estimated for a 20-year period assuming 2008 dollars. The
20-year period is consistent with an approach of designing mechanical equipment to its expected life.Structures, such as buildings, were sized based on anticipated 20-year needs. Replacement of buildingsand structures were estimated based upon a 50-year life span. A detailed breakdown of the estimates is inAppendix C. Estimated costs were identified from the following sources:
• Land value per acre estimated from Jefferson County Assessor’s parcel database. A per acreestimate was calculated using representative parcels adjacent to the service area of $28,000/acre.
• Price quotes from local equipment suppliers.
• Unit prices for construction based on industry standards (Means 2008 Building ConstructionCost Data).
• Bid tabulations from recent, similar projects.
Table 7-3 summarizes factors used when estimating quantities for the comparative life cycles costs.
TABLE 7-3.CRITERIA USED FOR ESTIMATING TREATMENT PLANT COST QUANTITIES
Criteria Value/Factor
Flow Condition 2030 Maximum Monthly Flow
Storage Ponds 8 feet deep
Land Area Contingency Twice the land area needed for 2030 year facilities
were estimated so the plant could be expanded inthe future to buildout
Land Buffers Added 25% of the total land area
Land Value $28,000/acre
The capital cost represents the total project cost for implementation of each treatment alternative.
The life cycle costs include land cost, equipment costs, installation costs for piping, electrical, andcontrols, site work, mobilization/demobilization/bonding, contractor overhead and profit, escalation to
7-10

8/14/2019 Port Hadlock Sewer Facility Plan 0908
http://slidepdf.com/reader/full/port-hadlock-sewer-facility-plan-0908 133/387
…7. WASTEWATER TREATMENT ALTERNATIVES
mid-point of construction, planning-level contingency, engineering design and construction management,and Washington state sales tax. These amounts are reflected in the attached cost estimates.
Annual O&M costs for each wastewater alternative were estimated based on power requirements,chemicals, and labor (general operation, maintenance and cleaning). Additionally, replacement cost of equipment and structures are included in the comparative life cycle costs. Replacement costs represent a
dollar amount required each year to be set aside in order to replace buildings, structures, and equipment.Replacement allowances of 2 percent for buildings and structures (replace every 50-years), and 4 percentfor equipment (replace every 20 to 25 years) were included in the life cycle cost estimates. These amountsare reflected in the attached cost estimates.
Summary of Life Cycle Costs
Summaries of the 20-year life cycle costs for each of the wastewater treatment alternatives are located atthe bottom of Table 7-4.
The life cycle costs do not include costs for associated effluent disposal/reuse. An evaluation of the costsfor effluent disposal/reuse alternatives is presented in Chapter 6 – Effluent Discharge/Reuse Alternatives.
Summary of Wastewater Treatment Evaluation
The SBR and MBR treatment alternatives were evaluated against the above described criteria. Table 7-4is a summary of the evaluation of the alternatives against the criteria.
RECOMMENDED WASTEWATER TREATMENT ALTERNATIVE
Stakeholder Workshop Process
The results of the alternative evaluation were presented to the Jefferson County Board of CountyCommissioners at a workshop on August 8, 2006. The workshop was open to the public and some keystakeholders in the community were invited to attend. A presentation was given outlining the alternativewastewater treatment options, their relative advantages and drawbacks, and their respective life cycle
costs.
The design team presented its technical perspective on each of the alternatives and received feedback andquestions from the Board of County Commissioners, County staff, the stakeholders/public attending theworkshop. This feedback was considered in the technical recommendation.
RECOMMENDATION
Based upon the results of the alternative evaluation and feedback from the stakeholder workshop, amembrane bioreactor system (MBR) is recommended. This system is recommended primarily because of the reliable level of Class A effluent it can provide. Additionally, it is the most advance treatmenttechnology available and is best suited to address existing and future regulatory requirements regarding
treatment. The 20-year life cycle costs are slightly higher than anticipated for SBR. The additional costdoes not outweigh the benefits provided through reliability and superior effluent quality offered by anMBR system.
7-11

8/14/2019 Port Hadlock Sewer Facility Plan 0908
http://slidepdf.com/reader/full/port-hadlock-sewer-facility-plan-0908 134/387
Port Hadlock UGA Sewer Facility Plan…
TABLE 7-4.SUMMARY OF WASTEWATER TREATMENT ALTERNATIVES EVALUATION
Alternative
Evaluation Criteria Sequencing Batch (SBR) Reactor + Filter Membrane Bioreactor (MBR)
Effluent Quality - Can provide Class A effluent with filtration. SBRwithout filtration can meet Class B, C, or D effluentquality standards.
- Must monitor filters and system batches closely toensure reliable Class A effluent quality.
- Provides Class A reclaimedwater without a separate filtrationprocess.
- State-of-the-Art Wastewatertreatment process which is bestsuited to address future potentialwastewater treatmentrequirements such aspharmaceuticals and personal careproducts and endocrine disruptors(hormones) in wastewater.
Phasing - The system is modular. Treatment cells can be
added or enlarged to increase treatment capacity.
- The system is modular.
Treatment capacity can beincreased through addition of membranes and treatment cells.
OperationalCharacteristics
- Treats wastewater in batches making systemtiming and sequencing critical.
- Requires more computer control and mechanicalvalving than other extended aeration treatmentprocesses.
- Operational Flexibility: Through variation of thecycles and their timing, greater operational
flexibility can be achieved to meet different effluentrequirements.
- Continuous Treatment of Wastewater making controllingand monitoring the treatmentprocess easier. This can result inmore consistent and reliableeffluent quality.
- Requires more computer controland mechanical valving than other
extended aeration treatmentprocesses.
- No separate secondary clarifiersor coagulation process required.
- Membrane maintenance: themembranes must be maintainedand kept clean so they do not foul.
Comparative 20-yearLife Cycle Costs
Capital $21,860,000 $26,242,000
O&M $6,932,000 $9,005,000Total 20-year Life CycleCost
$28,792,000 $35,247,000
DISINFECTION ALTERNATIVES
Effluent disinfection prevents the spread of waterborne diseases. The intent of the Class A reclaimedwater standards are to produce reclaimed water that is essentially pathogen-free. This entire treatmentprocess is geared towards this goal, with the disinfection step being the final means of achieving this goal.
7-12

8/14/2019 Port Hadlock Sewer Facility Plan 0908
http://slidepdf.com/reader/full/port-hadlock-sewer-facility-plan-0908 135/387
…7. WASTEWATER TREATMENT ALTERNATIVES
Alternatives Considered
Four disinfection processes were considered for evaluation. These alternatives are described below:
• Liquid Sodium Hypochlorite – Disinfect the treatment plant effluent with 12.5 percent liquidsodium hypochlorite (bleach).
• Ultraviolet (UV) Disinfection – Disinfect the treatment plant effluent with ultraviolet light.• Chlorine Gas – Disinfect the treatment plant effluent using chlorine gas.
• On-Site Generation of Sodium Hypochlorite – Disinfect the treatment plant effluent using<1.0 percent liquid sodium hypochlorite (bleach) generated on site using salt andhypochlorite generation equipment.
Rejected Alternatives
Two alternatives were rejected early in the evaluation process. The rational for their rejection is asfollows:
Chlorine Gas
This alternative was rejected due to safety and transportation concerns. Chlorine gas is very toxic and aleak can cause harm or death. Due to the dangerous nature of chlorine gas, handling and transportation isa significant concern. Due to these concerns, chlorine gas is seldom considered in the design of smallwastewater treatment facilities.
On-Site Generation of Sodium Hypochlorite
On-site generation of sodium hypochlorite uses complex, electrically powered mechanical equipment togenerate low concentration (<1.0 percent) liquid sodium hypochlorite from salt water. The comparativelysmall amount of liquid sodium hypochlorite needed to disinfect the required effluent flows do not justifythe costs for equipment, operation, maintenance and electricity when compared to purchasing liquidsodium hypochlorite from a bulk supplier.
ALTERNATIVES CONSIDERED FOR FURTHER EVALUATION
Liquid Sodium Hypochlorite
Technology Description
This alternative involves disinfecting the treatment plant effluent with liquid sodium hypochlorite(bleach). The chlorine in liquid sodium hypochlorite directly kills the microorganisms through its strongoxidizing power. Sodium hypochlorite (12-percent to 15-percent by weight) would be purchased anddelivered by a vendor to the wastewater treatment plant site and stored within a chemical holding tank.Chemical metering pumps, control equipment, and associated piping would be used to inject the sodiumhypochlorite into the chlorine contact tank (CCT) influent. The CCT is designed to provide gentle mixing
and sufficient hydraulic residence time to kill pathogens to the required disinfection level prior to deliveryof the reclaimed water to the point of reuse. Figure 7-3 shows typical equipment for disinfection using12.5-percent sodium hypochlorite.
7-13

8/14/2019 Port Hadlock Sewer Facility Plan 0908
http://slidepdf.com/reader/full/port-hadlock-sewer-facility-plan-0908 136/387
Port Hadlock UGA Sewer Facility Plan…
Figure 7-3. Sodium Hypochlorite Feed Pumps at Vashon Island, Washington (left) and Chlorine Contact Tank at Marysville, Washington
Design Criteria: Sizing and Phasing
The liquid sodium hypochlorite system would be designed for storage of at least 14 days of bleach atpeak-month flows at a peak design dosage of approximately 2 mg/L (Department of Ecology criteriarequires a minimum dose of 1 mg/L).
Building facilities will be designed to meet the anticipated 20-year maximum month flows. The storagearea would initially house 3-55 gallon drums of liquid sodium hypochlorite to accommodate initial flows.The enclosed building is sized at 100 square feet to adequately house additional drums or a larger storagetank for bulk shipment of sodium hypochlorite to accommodate future flows.
Advantages and Drawbacks
Several advantages and drawbacks of using liquid sodium hypochlorite were identified during the
evaluation process. Below is a summary of the identified advantages and drawbacks:
Advantages • Low initial capital investment – The initial capital investment associated with this alternative
is relatively low considering that no complicated mechanical equipment is required. Thesystem involves chemical metering pumps, flow controls, piping, and chemical storage.Operation and maintenance costs involve purchase of liquid sodium hypochlorite, andoperation and maintenance of the pumping equipment.
• Safety – This process is relatively safe. Liquid sodium hypochlorite is not as hazardous aschlorine gas, but provides excellent effluent disinfection.
Drawbacks • Cost of Liquid Sodium Hypochlorite – Liquid sodium hypochlorite is relatively cheap topurchase. However, the relative advantages of this alternative could change in the future if the market price of liquid sodium hypochlorite should rise significantly.
• Chemical Storage – This alternative requires the handling and storage of a hazardouschemical (bleach) which will require worker safety training. Chemical containment aroundthe storage tank area will be required in the event of a spill or a leak.
7-14

8/14/2019 Port Hadlock Sewer Facility Plan 0908
http://slidepdf.com/reader/full/port-hadlock-sewer-facility-plan-0908 137/387
…7. WASTEWATER TREATMENT ALTERNATIVES
• Chemical Degradation – Liquid sodium hypochlorite tends to degrade over time due totemperature and exposure to sunlight. This decreases the effective concentration of chlorineand the ability of the chemical to oxidize microorganisms. This drawback can be easilymitigated with proper design and good operating practices.
• Corrosive Damage – Liquid sodium hypochlorite tends to be corrosive to piping and pumping
systems. Although modern materials and equipment have mitigated many of these problems,some maintenance and replacement of piping, valves, and pump parts will be required.
UV Disinfection
Technology Description
This technology involves disinfecting the wastewater treatment plant effluent by exposing the wastewaterto high levels of ultraviolet light. Ultraviolet light mutates microorganism DNA, preventing cellreproduction, which effectively kills the microorganism population since the organisms’ life expectanciesare short.
Ultraviolet disinfection systems use several types of technology: low-pressure open-channel systems,
medium-pressure systems, and low-pressure, high-intensity systems.
One consideration of using UV disinfection in reuse applications is the requirement by Department of Ecology to have a chlorine residual at the point of use. This would require the use of chlorine after UVdisinfection resulting in the need to provide chlorination equipment and facilities or equipment to providecontact time.
Design Criteria: Sizing & Phasing
The disinfection system was designed initially to handle 0.5 mgd of treated effluent and then doubled tohandle 1.0 mgd for the 20-year maximum monthly flow. The UV and chlorine system sizing criteria forthese flows were as follows:
UV System: 40 gpm/lamp, 200 watts/lamp, 24 hrs/day.
Chlorination System: 0.5 mg/L dose.
Advantages and Drawbacks
Several advantages and drawbacks of UV disinfection of treatment plant effluent were identified duringthe evaluation process. Below is a summary of the advantages and drawbacks:
Advantages • UV disinfection systems are relatively safe and do not expose the operator to chemicals.
• Less contact time with UV light is required to achieve disinfection due to high germicidal
efficiency.
Drawbacks • Bulbs are prone to deposits and require routine wiping to prevent fouling.
• Bulbs loose their efficiency and require regular monitoring and replacement in order toensure adequate disinfection.
• Supplemental chlorine-based disinfection would be required to provide chlorine residual inthe distribution system in order to meet Class A effluent requirements. This requires a
7-15

8/14/2019 Port Hadlock Sewer Facility Plan 0908
http://slidepdf.com/reader/full/port-hadlock-sewer-facility-plan-0908 138/387
Port Hadlock UGA Sewer Facility Plan…
chlorine system be installed and negates some of the benefits of not having to handlechemicals. This also will increase capital and O&M costs since two systems need to beconstructed, operated, and maintained.
EVALUATION OF DISINFECTION ALTERNATIVES
Evaluation CriteriaThe following criteria were used when comparing disinfection alternatives:
Effluent Quality
Does the system reliably provide the required level of disinfection?
Phasing
Does the proposed system lend itself to phasing? Can the system be designed to effectively accommodateincreases in flow as the wastewater system develops?
Safety What is the relative safety of the proposed system?
Life Cycle Costs
What are the comparative 20- year life cycle costs for the proposed system? These include costs forequipment, design and installation, operation and maintenance, and equipment replacement costs. A lowerlife cycle cost is preferable.
Summary of Disinfection Evaluation
Each of the alternatives was evaluated against the above criteria. Table 7-5 is a summary of the evaluationof the alternatives against the criteria.
7-16

8/14/2019 Port Hadlock Sewer Facility Plan 0908
http://slidepdf.com/reader/full/port-hadlock-sewer-facility-plan-0908 139/387
…7. WASTEWATER TREATMENT ALTERNATIVES
TABLE 7-5.SUMMARY OF DISINFECTION ALTERNATIVES EVALUATION
Alternative
Evaluation Criteria Liquid Sodium Hypochlorite UV Disinfection
Effluent Quality - Provides effective disinfection of microorganismsthrough oxidation with chlorine.
- Well suited to provide the required chlorineresidual of 0.50 mg/L for Class A reclaimed water.
- Provides effective disinfectionof microorganisms throughmutating microorganisms’ DNAusing UV radiation.
- Supplemental chlorinationrequired to provide residual of 0.50 mg/L for Class A reclaimedwater.
Phasing - The system is scalable. Additional storage capacity
for liquid sodium hypochlorite can be installed.Chemical feed pumps and chemical feed piping canbe enlarged or expanded to accommodate increaseddosage requirements as effluent flow rates increasein the future.
- The system is scalable.
Additional lamps and chamberscan be installed to provideadditional disinfection capacityas effluent flow rates increase inthe future.
Safety - System is safer than gaseous chlorine. However,stringent safety measures must be employed duringchemical handling and equipment operation andmaintenance.
- UV system does not involve theuse of chemicals. However, sincesupplemental chlorination isrequired (sodium hypochlorite),stringent safety measures must beemployed during chemicalhandling and equipment
operation and maintenance.Comparative 20-yearLife Cycle Costs
Capital $512,000 $1,466,000
O&M $179,000 $473,000
Total 20-Year LifeCycle Costs
$691,000 $1,939,000
RECOMMENDED DISINFECTION ALTERNATIVE
Stakeholder Workshop Process
The results of the alternative evaluation were presented to the Jefferson County Board of CountyCommissioners at a workshop on August 8, 2006. The workshop was open to the public and some keystakeholders in the community were invited to attend. A presentation was given outlining the alternativedisinfection options, their relative advantages and drawbacks, and their respective life cycle costs.
The design team presented its technical perspective on each of the alternatives and received feedback andquestions from the Board of County Commissioners, County staff, the stakeholders/public attending theworkshop. This feedback was considered in the technical recommendation.
7-17
8/14/2019 Port Hadlock Sewer Facility Plan 0908
http://slidepdf.com/reader/full/port-hadlock-sewer-facility-plan-0908 140/387
Port Hadlock UGA Sewer Facility Plan…
RECOMMENDATION
Liquid sodium hypochlorite is the recommended disinfection system. This system has a lower 20-year lifecycle cost and provides acceptable and proven disinfection. It is suited to provide the required chlorineresidual for Class A reuse and is easily scalable as the system grows. UV disinfection does not provideenough additional benefits and features to warrant the higher 20-year life cycle cost.
SOLIDS HANDLING/REUSE ALTERNATIVES
When evaluating alternatives for handling treatment plant solids, two distinct components wereconsidered; solids handling and treatment/reuse. Solids handling involves removal of some of the waterand storage at the treatment plant site prior to the treatment/reuse phase. Treatment/reuse involvestreatment through digestion, composting, or chemical treatment and reuse through land application orland filling. Combinations of solids handling and treatment/reuse alternatives will be combined andevaluated.
Alternatives Considered
Three solids handling alternatives and five treatment and reuse alternatives were considered for
evaluation. These alternatives are described below:
Solids Handling
The following processes were considered for solids handling prior to treatment/reuse:
• Decanting: Decanting involves allowing solids to settle by gravity either within a holdingtank or within a treatment basin in the wastewater treatment plant. The clarified supernatantis then separated from the heavier subnatent.
• Thickening: Thickening involves some equipment dedicated to removing some water fromthe wastewater solids to about 4 percent solids. This is done in an effort to reducetransportation costs.
• Dewatering: Dewatering involves removing enough water from the wastewater solids tomake it semi-solid (about 16 percent solids). This is done to further reduce transportationcosts by reducing the amount of the water that needs to be hauled and or to concentrate thesolids for use in composting or other reuse operations.
Solids Treatment and Reuse
The following processes were considered for treatment and reuse of treatment plant solids:
• Haul Locally to Port Townsend Composting: This involves hauling the treatment plant solidsto a composting facility at the City of Port Townsend Solid Waste Facility for treatment andreuse.
• Haul Remote to Port Angeles WWTP: This involves hauling solids to another wastewatertreatment plant which has facilities to digest and reuse solids.
• Contracted Haul & Reuse: A hired contractor would provide hauling, treatment and reuse of solids.
• On-Site Digestion: On-site digestion involves constructing facilities at the WWTP site totreat, and handle treatment plant solids. Treatment plant solids would be thickened and thensent to an aerobic digester where the solids would be stabilized aerobically (in the presence of oxygen). The resulting solids would be Class A or Class B depending upon the holding
7-18

8/14/2019 Port Hadlock Sewer Facility Plan 0908
http://slidepdf.com/reader/full/port-hadlock-sewer-facility-plan-0908 141/387
…7. WASTEWATER TREATMENT ALTERNATIVES
temperature and solids retention time during the digestion process. Solids would then behauled for reuse by a contract hauler.
• Forest Application: Forest application would involve sending thickened or dewatered solidsto a forest application site. The solids would be aerobically digested to Class B standards.This alternative would require an agreement with a forest management company or the
purchase of forest land for the application of solids.
Rejected Alternatives
Two alternatives were rejected early in the evaluation process. The rationale for their rejection is asfollows:
On-Site Digestion
On-site digestion was rejected due to the extensive capital costs associated constructing, operating, andmaintaining digesters and associated solids handling equipment. It is estimated that approximately2,000 gallons per day of thickened 4 percent solids on average will be generated between 2010 and 2030.This would not justify the costs associated with constructing a digester system which could cost on the
order of several million dollars.
Forest Application
Forest application was not considered for further evaluation due to the land costs associated withoperating and maintaining a forest application site. Additionally, there are significant permitting andforest management practices which need to be implemented for this alternative which are dependent uponthe treatment level (Class A or B) of the solids and the use of the land and crops. The associated costs andpermitting requirements rendered this alternative unappealing compared to other alternatives beingconsidered.
ALTERNATIVES CONSIDERED FOR FURTHER EVALUATION
Storage and DecantingTechnology Description
Solids are removed from the wastewater treatment system by removing a calculated volume of mixedliquor or waste activated sludge from the biological treatment process. This waste activated sludge isthen stored on site in a storage tank or basin where the heavier solids are allowed to settle to the bottom.The heavier solids, or subnatant are then separated from the lighter supernatant by decanting.
Providing a decanting system is optional for an MBR process since the system operates at high mixed-liquor-suspended-solids concentrations. Solids can be pulled off the process and be at 1 – 1.5 percentsolids without decanting. However, solids storage is essential during periods of inclement weather.
The decanting process requires only minimal equipment, labor and energy costs and can result in aremarkably improved subnatant with perhaps as high as a 50 percent volume reduction. The reduction inhauling and handling costs can be significant. Decanting and storage typically involves a holding tank fordecanted solids, minor piping and pumps, and some provisions for odor control. Decanting and storageare accomplished in the same tank.
At a future date, the decanting process can be enhanced with polymer addition at minimal cost. Improvedsolids separation by use of polymer will essentially increase the emergency on-site solids storage capacityduring periods of inclement weather when hauling and/or land application is curtailed.
7-19

8/14/2019 Port Hadlock Sewer Facility Plan 0908
http://slidepdf.com/reader/full/port-hadlock-sewer-facility-plan-0908 142/387
Port Hadlock UGA Sewer Facility Plan…
Design Criteria
The following key design criteria were used when evaluating decanting:
• Decant to 1.2 percent solids by weight.
• No polymer or chemical addition initially.
• Provide 20,000 gallons of storage on site for decanted solids.
• Provide odor control for storage tank.
Advantages and Drawbacks
The following advantages and drawbacks were identified for decanting solids:
Advantages • Low Capital Costs – This alternative does not involve expensive or complicated equipment
for handling solids. No chemical addition is involved to flocculate solids.
• Operation and Maintenance – Since there is minimal equipment associated with this process,
the system is easy and inexpensive to operate and maintain.
Drawbacks • Solids Content – This system results in the lowest concentration of solids. The low solids
content (high water content) will result in additional hauling and handling costs.
Thickening
Technology Description
Thickening involves some equipment dedicated to removing water from the wastewater solids. Enoughwater is removed to thicken the solids to about 4 percent. This results in reduced transportation costs.Several thickening processes were considered in this evaluation including gravity belt thickeners,
dissolved air flotation thickeners, and rotary screen thickeners. Polymers can be added prior to thethickener to aid in the thickening process by coagulating and wetting the wastewater solids.
Ancillary equipment would include chemical storage systems, storage tanks, day tanks, mixers, meteringpumps, piping, valving, safety equipment and odor control equipment.
Design Criteria
The following key design criteria were used when evaluating thickening:
• Thickening equipment assumed for this analysis is a rotary screen thickener.
• Polymer addition will be used to coagulate solids and aid in water removal.
• Provide 10,000 gallons of storage on site for thickened solids.• Provide odor control scrubbers and blower equipment.
Advantages and Drawbacks
The following advantages and drawbacks were identified for thickening solids:
7-20

8/14/2019 Port Hadlock Sewer Facility Plan 0908
http://slidepdf.com/reader/full/port-hadlock-sewer-facility-plan-0908 143/387
…7. WASTEWATER TREATMENT ALTERNATIVES
Advantages • Solids Content – This system results in a higher solids content resulting in lower hauling
costs than decanted solids.
Drawbacks • Capital Costs – This system involves investment in equipment to thicken solids. Additional
odor control is required since thickened solids have greater odor potential than decantedsolids.
• Operation and Maintenance –This equipment will result in higher operation and maintenancecosts. This will be in the form of labor, equipment maintenance, chemical costs, and power.
Dewatering
Technology Description
Dewatering involves removing enough water from the wastewater solids to make it a semi-solid. This isdone to further reduce transportation costs by reducing the amount of the water that needs to be hauled.Dewatering is often accomplished employing the same equipment used for thickening sludge except the
equipment is designed to remove more water from the solids. Typical equipment includes centrifuges, beltfilter presses, and screw presses. Solids from activated sludge processes are typically dewatered to about16 percent solids.
Ancillary equipment would include solids holding facilities, solids handling/conveyance systems,chemical storage systems, storage tanks, day tanks, mixers, metering pumps, piping, valving, safetyequipment and HVAC systems, buildings, and odor control equipment
Design Criteria: • Dewatering equipment assumed for this analysis is a belt filter press.
• Polymer addition will be used to coagulate solids and aid in water removal.
• Dewatered sludge to be conveyed to truck using belt conveyors.• Provide odor control scrubbers and blower equipment.
Advantages and Drawbacks
The following advantages and drawbacks were identified for dewatering solids:
Advantages • Solids Content – This system results in a higher solids content resulting in lower hauling
costs than decanted or thickened solids.
Drawbacks
• Capital Costs – This system involves investment in more expensive equipment to removeadditional water to achieve higher solids content. Belt conveyors will be needed to transportdewatered sludge to trucks so they can be hauled away for treatment and reuse. Additionalodor control is required since thickened solids have greater odor potential than decantedsolids.
• Operation and Maintenance –This equipment will result in higher operation and maintenancecosts than for thickening. These higher costs will be in the form of labor, equipmentmaintenance, chemical costs, and power.
7-21

8/14/2019 Port Hadlock Sewer Facility Plan 0908
http://slidepdf.com/reader/full/port-hadlock-sewer-facility-plan-0908 144/387
Port Hadlock UGA Sewer Facility Plan…
Haul Locally to Port Townsend
Technology Description
This alternative involves hauling the treatment plant solids to a composting facility at the City of PortTownsend Solid Waste Facility. The City operates a composting facility where it receives “clean green”yard waste, anarobically digested/dewatered class “B” biosolids from the Port Townsend WWTP andseptage from septic tank pumping contractors. The septage is thickened using polymer and a gravity beltthickener and mixed with the shredded green material and biosolids prior to composting. Decant waterfrom the thickening process is treated in a single sequencing batch reactor at the site. The treated effluentis then reused in a constructed wetland at the site.
Design Criteria: • The distance to haul solids from the treatment plant to the composting facility is
approximately 8 miles.
• The contractor would haul decanted sludge (unthickened) initially. Thickening equipmentmay be installed in the future to reduce the number of truck trips should it be economicallyfeasible.
• Cost to treat unthickened sludge at the composting facility is estimated at $0.36/gallon(including haul costs).
Advantages and Drawbacks
The following advantages and drawbacks were identified when evaluating hauling solids to PortTownsend composting:
Advantages • Short distance to haul. Reduced hauling expense.
• Beneficial reuse of solids.
• No need to install digesters at the treatment plant site which are a significant capital expense.
Drawbacks • Costs for treatment are relatively high compared to other treatment providers.
• There is limited capacity at the composting facility to accept solids. The facility currentlyprovides treatment services for local septic tank haulers and has spare solids handlingcapacity. However, the SBR treatment system at the compost facility is not designed, orpermitted, to handle the anticipated liquid volume of unthickened sludge from the PortHadlock system.
Haul Remote to Port Angeles WWTP
Technology Description This alternative involves hauling solids to another wastewater treatment plant which has facilities todigest and transport the solids for reuse. The nearest facility identified which could receive solids was theCity of Port Angeles WWTP.
Design Criteria: • The distance to haul solids from the treatment plant to Port Angeles is approximately 43
miles.
7-22

8/14/2019 Port Hadlock Sewer Facility Plan 0908
http://slidepdf.com/reader/full/port-hadlock-sewer-facility-plan-0908 145/387
…7. WASTEWATER TREATMENT ALTERNATIVES
• The contractor would haul decanted sludge (unthickened) initially. Thickening equipmentmay be installed in the future to reduce the number of truck trips should it be economicallyfeasible.
• The cost to treat unthickened sludge at Port Angeles is estimated at $0.22/gallon.
Advantages and Drawbacks The following advantages and drawbacks were identified when evaluating hauling solids to the PortAngeles WWTP:
Advantages • No need to install digesters at the treatment plant site which are a significant capital expense.
Drawbacks • Higher costs associated with hauling solids to Port Angeles. This method is dependent upon
fuel costs and can change the economic viability of the alternative.
• Costs associated with treatment – This method is dependent upon treatment costs and can
change the economic viability of the alternative.
Contracted Haul and Reuse
Technology Description
This alternative involves hiring a contractor to provide transportation, treatment and reuse of thewastewater solids. The contractor would load solids into a tanker truck and haul the material off site fortreatment and reuse. Kitsap Bio-Recycle in Belfair Washington was identified as a contractor which couldprovide this service.
Design Criteria: • The process for treatment and reuse is stabilization using lime, land application, and plowing
under to reduce potential vectors and odors.• The contractor would haul decanted sludge (unthickened) initially. Thickening equipment
may be installed in the future to reduce the number of truck trips should it be economicallyfeasible.
• Costs for haul and reuse of decanted solids to Kitsap Bio-Recycle is estimated at $0.12/gallon
Advantages and Drawbacks
The following advantages and drawbacks were identified when evaluating contracted haul and reuse:
Advantages • Minimal capital costs – Facilities for storage and decanting and transferring solids to the
contractor’s truck are minimal compared to other alternatives. Costs for thickening equipmentwould be deferred until the future.
• If using decanted solids – No equipment for removing water or chemical treatment.
• Flexibility – This alternative involves the lowest initial capital cost and allows for flexibilityto implement a different method of solids handling should the economics of hiring acontractor change in the future.
7-23

8/14/2019 Port Hadlock Sewer Facility Plan 0908
http://slidepdf.com/reader/full/port-hadlock-sewer-facility-plan-0908 146/387
Port Hadlock UGA Sewer Facility Plan…
7-24
Drawbacks • Costs associated with hauling, treatment, and reuse – This method is dependent upon
contractor costs and can change the economic viability of the alternative.
EVALUATION OF SOLIDS HANDLING/TREATMENT/REUSE
ALTERNATIVESEvaluation Criteria
The following criteria were used when comparing the solids handling and treatment/reuse alternatives:
Phasing
Does the proposed combination of processes lend itself to phasing? Is there opportunity to change or alterthe process in the future if the economics change?
Life Cycle Costs
What are the comparative 20-year life cycle costs for the proposed system? These include costs for
equipment, design and installation, operation and maintenance, and equipment replacement costs. A lowerlife cycle cost is preferable.
Summary of Solids Handling/Treatment/Reuse Evaluation
Each of the solids handling and treatment/reuse alternatives were evaluated against the above describedcriteria. Table 7-6 is a summary of the evaluation.

8/14/2019 Port Hadlock Sewer Facility Plan 0908
http://slidepdf.com/reader/full/port-hadlock-sewer-facility-plan-0908 147/387
… 7 . W A S T E W A T E R T R E A T M E N T A L T E R N A T I V E S
T A B L E 7 - 6 .
S U M M A R Y O F S O L I D S H A N
D L I N G / T R E A T M E N T / R E U S E A
L T E R N A T I V E S E V A L U A T I O N
S o l i d s H a n d l i n g A l t e r n a t i v e s
T r e a t m e n t / R e u s e A l t e r n a t i v e s
E v a l u a t i o n C r i t e r i a
D e c a n t i n g
T h i c k e n i n g
D e w a t e r i n g
H a u l L o c a l l y t o
P
t . T o w n s e n d
H a u l t o P t .
A n g e l e s W W T P
C o n t r a c t e d H a u l & R e u s e
P h a s i n g
- E a s y t o p h a s e .
M i n i m a l i n i t i a l
c a p i t a l c o s t .
M i n o r i n c r e a s e s
i n h o l d i n g t a n k
a s s y s t e m
d e v e l o p s
- S y s t e m c a n b
e
p h a s e d . H o w e v e r ,
a d d i t i o n a l c a p i t a l
i n v e s t m e n t w i l l b e
r e q u i r e d f o r
t h i c k e n i n g
e q u i p m e n t a n d
h o l d i n g t a n k s . .
- S y s t e m c a n b e
p h a s e d . H o w e v e r ,
a d d i t i o n a l c a p i t a l
i n v e s t m e n t w i l l b e
r e q u i r e d f o r
d e w a t e r i n g
e q u i p m e n t , a n d
c o n v e y i n g e q u i p m e n t
- L i m i t e d a b i l i t y
t o e x p a n d .
E x i s t i n g s y s t e m
w o u
l d b e n e a r o r
a b o v e c a p a c i t y
w i t h
p r o j e c t e d
s o l i d s a t s t a r t u p .
- D e s i r a b i l i t y o f
a l t e r n a t i v e i s
s e n s i t i v e t o
c h a n g e s i n p e r
g a l l o n c o s t t o
t r e a t . A l s o
d e p e n d e n t u p o n
h a u l i n g c o s t s .
- A b i l i t y t o
e x p a n d . C a n s e n d
s o l i d s t o o n e o r
m o r e p l a n t s a s
s y s t e m g r o w s .
- D e s i r a b i l i t y o f
a l t e r n a t i v e i s
s e n s i t i v e t o
c h a n g e s i n p e r
g a l l o n c o s t t o
t r e a t . A l s o
d e p e n d e n t u p o n
h a u l i n g c o s t s .
- A b i l i t y t o e x p a n d . C a n
s e n d m o r e s o l i d s t o t h e
c o n t r a c t o r a s t h e s y s t e m
g r o w s .
- D e s i r a b i l i t y o f
a l t e r n a t i v e i s s e n s i t i v e t o
c h a n g e s i n p e r g a l l o n c o s t
t o h a u l a n d t r e a t .
C o m p a r a t i v e 2 0 - y e a r
L i f e C y c l e C o s t s
C a p i t a l
$ 1 0 9 , 0 0 0
$ 1 , 3 8 8 , 0 0 0
$ 2 , 6 7 1 , 0 0 0
$ 1 4 8 , 0 0 0
$ 1 4 8 , 0 0 0
$ 1 4 8 , 0 0 0
N P V O & M
$ 4 , 4 1 8 , 0 0 0
$ 3 , 5 0 1 , 0 0 0
$ 2 , 0 1 2 , 0 0 0
$ 3 , 0 0 6 , 0 0 0
$ 1 , 8 3 7 , 0 0 0
$ 1 , 0 0 2 , 0 0 0
T o t a l 2 0 - Y e a r L i f e
C y c l e C o s t s
$ 4 , 5
2 7 , 0
0 0
$ 4 , 8 8
9 , 0
0 0
$ 4 , 6
8 3 , 0
0 0
$ 3 , 1
5 4 , 0
0 0
$ 1 , 9
8 5 , 0
0 0
$ 1 , 1
5 0 , 0
0 0
7 - 2 5

8/14/2019 Port Hadlock Sewer Facility Plan 0908
http://slidepdf.com/reader/full/port-hadlock-sewer-facility-plan-0908 148/387
Port Hadlock UGA Sewer Facility Plan…
RECOMMENDED SOLIDS HANDLING AND TREATMENT/REUSESYSTEM
Based upon the results of the alternative evaluation, the Storage and Decanting alternative for SolidsHandling is recommended and the Contract Haul/Reuse alternative for Treatment/Reuse is recommended.
These recommendations are based upon the simplicity of the processes, the lowest initial capital cost, andthe flexibility to switch to another system for handling and/or reuse in the future.
Each of the two recommendations has the lowest 20-year life cycle cost based upon today’s available costdata. This is a “pay-as-you-go” system. If the economics of these options change in the future, the Countywill have very little capital investment in solids handling/reuse equipment and can comfortably exploreother options.
7-26

8/14/2019 Port Hadlock Sewer Facility Plan 0908
http://slidepdf.com/reader/full/port-hadlock-sewer-facility-plan-0908 149/387
CHAPTER 8.RECOMMENDED ALTERNATIVE AND IMPLEMENTATION
This chapter summarizes the recommendations presented in the previous chapters for collection, liquidtreatment process, disinfection, solids handling, and effluent reuse. A proposed treatment plant layout,
process schematic, and hydraulic profile is also provided. Also presented in this chapter is an evaluation
of the alternative options for treatment plant location and a summary of the estimate costs. Finally an
implementation schedule is presented.
SUMMARY OF RECOMMENDATIONS
The sections below present a summary of the recommended systems and key sizing and phasing criteria
to be considered in the system implementation. Detailed discussion of each system, sizing criteria, and
alternative evaluations can be found in the respective chapters of this plan.
Gravity Collection SystemRecommendation
The recommended collection system technology is a gravity collection system. The alternatives analysis
of the evaluated collection system technologies is found in Chapter 5 – Collection System Alternatives
Evaluation.
The gravity collection system was recommended for the following key reasons:
• Lowest 20-year life cycle cost.
• Provides the highest degree of flexibility for future system expansion. Outlying areas can be
installed as gravity collection systems or pressurized sewer systems.
• No private property maintenance and access easements required.
• Fewer operational and maintenance requirements than pressurized sewer systems.
Sizing and Phasing
The gravity collection system and pump stations will be sized and designed according to Washington
State Department of Ecology Criteria for Sewage Works Design (updated 2006). The collection system is
conceptualized to be implemented in phases according to sub-areas as shown in Figure 4-2.
Effluent Reuse: Ground Water Recharge by Rapid-Rate SurfacePercolation
Recommendation It is recommended that treated wastewater effluent be reused by recharging the groundwater by rapid -
rate surface percolation. The alternatives analysis of the evaluated discharge and reuse alternatives is
found in Chapter 6 – Wastewater Discharge and Reuse Alternatives.
Groundwater Recharge by rapid rate infiltration through surface percolation was recommended for the
following key reasons:
• Lowest 20-year life cycle cost.
8-1

8/14/2019 Port Hadlock Sewer Facility Plan 0908
http://slidepdf.com/reader/full/port-hadlock-sewer-facility-plan-0908 150/387
Port Hadlock UGA Sewer Facility Plan…
• Provides opportunities for beneficial reuse. Recharged groundwater can benefit Chimacum
Creek flows and associated salmon habitat.
Sizing and Phasing
It is recommended the system be sized to provide enough space and capacity for the 20-year projected
effluent flows with enough room to provide 3-days’ storage during severe wet conditions when soils mayhave difficulty infiltrating water. The total recommended area includes 9 acres (see Table 6-3 and 6-4).
The percolation basins can be developed in phases as the wastewater system grows.
Wastewater Treatment – Membrane Bioreactor (MBR)
Recommendation
The recommended process for treating wastewater is the membrane bioreactor (MBR). The alternatives
analysis of the evaluated treatment alternatives is found in Chapter 7 – Wastewater Treatment
Alternatives Evaluation.
An MBR system is recommended for the following key reasons:
• Reliably provides Class A level of reclaimed water.
• Modular and scalable process facilitating future expansion needs.
• No separate secondary clarifiers or coagulation process required.
• Best suited to address existing and future regulatory requirements treatment.
Sizing and Phasing
It is recommended the wastewater treatment process be implemented in four phases as described in
Chapter 7. These are briefly described as follows:
• Phase I – Install two 0.25 mgd MBR treatment trains; one working and one standby.
• Phase II – Add 3 days for one treatment train storage once flows exceed 0.25 mgd and useboth treatment trains simultaneously.
• Phase III – Add an additional 0.5 mgd of treatment tankage; phase in membranes as needed.
• Phase IV – Install remaining membranes to provide 1.0 mgd of capacity.
Effluent Disinfection – Sodium Hypochlorite
Recommendation
The recommended process for disinfecting treated effluent is liquid sodium hypochlorite. The alternatives
analysis of the evaluated disinfection alternatives is found in Chapter 7 – Wastewater Treatment
Alternatives Evaluation.
A liquid sodium hypochlorite system is recommended for the following key reasons:
• Lowest 20-year life cycle cost.
• Suited to provide the required chlorine residual for Class A effluent reuse.
• Is easily scalable to address future growth of the wastewater system.
8-2

8/14/2019 Port Hadlock Sewer Facility Plan 0908
http://slidepdf.com/reader/full/port-hadlock-sewer-facility-plan-0908 151/387
8. RECOMMENDED ALTERNATIVE AND IMPLEMENTATION
Sizing and Phasing
The sizing and phasing of the sodium hypochlorite system is based upon the following criteria detailed in
Chapter 7:
• Provide 14 days storage at peak monthly flow and 2 mg/L dose.
• Building and facilities will be constructed to meet the capacity needs for 20-year maximummonthly flow.
Solids Handling – Decanting and Contracted Haul and Reuse
Recommendation
The recommended process for solids handling is to decant solids directly from the MBR process and use
contracted haul and reuse. The alternatives analysis of the evaluated solids handling alternatives is found
in Chapter 7 – Wastewater Treatment Alternatives Evaluation.
Decanting solids and contracted haul and reuse is recommended for the following key reasons:
• Least amount of equipment required resulting is the lowest initial capital cost.• Lowest 20-year life cycle cost.
• The process is simple.
• The system provides flexibility to switch to another system for handling and/or disposal in
the future.
Sizing and Phasing
The sizing and phasing of the solids handling system is based upon the following criteria detailed inChapter 7:
• Provide 20,000 gallons of storage on-site for solids wasted from the MBR process.
• Evaluate viability of thickening in the future as the wastewater system develops, quantity of
solids increase, and/or the economics of contracted haul and reuse change. Budget has been
included in the cost summary for thickening equipment to be installed in the year 2013. The cost
has been included to account for the possibility that thickening equipment may be incorporated
into the solids handling process in the future.
Table 8-1 summarizes the design criteria for the recommended wastewater treatment alternative.
8-3

8/14/2019 Port Hadlock Sewer Facility Plan 0908
http://slidepdf.com/reader/full/port-hadlock-sewer-facility-plan-0908 152/387
Port Hadlock UGA Sewer Facility Plan…
TABLE 8-1.DESIGN DATA FOR MEMBRANE BIOREACTOR ALTERNATIVE
Phase 1 (2010) Phase 2 (2013)a
Phase 3 (2018)a
Phase 4 (2024)a
Design Flow (maximum monthly) 0.25 0.5 0.75 1
Headworks
Fine Screen 1 duty + 1 stby 1 duty + 1 stby 2 duty + 1 stby 2 duty + 1 stby
Membrane Bioreactors
Anoxic Basins
Number of Basins 1 1 2 2
Design Side Water Depth (ft) 9 - 13 9 - 13 9 - 13 9 - 13
Freeboard at Design Depth (ft) 4 - 8 4 - 8 4 - 8 4 - 8
Volume (gallons) 140,000 to200,000 ea
140,000 to200,000 ea
140,000 to200,000 ea
140,000 to200,000 ea
Mixer 1 @ 5hp 1 @ 5hp 2 @ 5hp 2 @ 5hp
Feed Forward Pumps
Number of Pumps 1 duty + 1 stby 1 duty + 1 stby 2 duty + 2 stby 2 duty + 2 stby
Capacity (gpm) 2,480 ea 2,480 ea 2,480 ea 2,480 ea
Horsepower 10 ea 10 ea 10 ea 10 ea
Aerobic Basins
Number of Basins 2 2 4 4
Design Side Water Depth (ft) 15 15 15 15
Freeboard at Design Depth (ft) 2 2 2 2
Volume (gal) 59,000 ea 59,000 ea 59,000 ea 59,000 ea
Aeration System Fine bubblediffusers
Fine bubblediffusers
Fine bubblediffusers
Fine bubblediffusers
Blowers 1 duty + 1 stby
@ 20 hp ea
1 duty + 1 stby
@ 20 hp ea
2 duty + 1 stby
@ 20 hp ea
2 duty + 1 stby
@ 20 hp ea
Mixer 1 @ 2.3 hp 1 @ 2.3 hp 2 @ 2.3 hp 2 @ 2.3 hp
Membrane Basin
Number of Basins 2 2 4 4
Design Side Water Depth (ft) 14 14 14 14
Freeboard at Design Depth (ft) 3 3 3 3
Volume (gal) 40,000 ea 40,000 ea 40,000 ea 40,000 ea
Number of Membrane Racksper Basin
b
2 2 3 4
Blowers 1 duty + 1 stby
@ 100 hp ea
1 duty + 1 stby
@ 100 hp ea
2 duty + 1 stby
@ 100 hp ea
2 duty + 1 stby
@ 100 hp ea
8-4

8/14/2019 Port Hadlock Sewer Facility Plan 0908
http://slidepdf.com/reader/full/port-hadlock-sewer-facility-plan-0908 153/387
8. RECOMMENDED ALTERNATIVE AND IMPLEMENTATION
TABLE 8-1 (CONTINUED).DESIGN DATA FOR MEMBRANE BIOREACTOR ALTERNATIVE
Phase 1 (2010) Phase 2 (2013)a
Phase 3 (2018)a
Phase 4 (2024)a
Permeate Pumps
Number of Pumps 2 duty + 1 stby 2 duty + 1 stby 4 duty + 2 stby 4 duty + 2 stby
Capacity (gpm) 394 ea 394 ea 394 ea 394 ea
Horsepower 7.5 ea 7.5 ea 7.5 ea 7.5 ea
Chlorine Contact Tanks
Number of Basins 1 1 1 1
Design Side Water Depth (ft) 7 7 7 7
Freeboard at Design Depth (ft) 3 3 3 3
Volume (gal) 45000 45000 45000 45000
Storage Tank
Number of Basins 0 1 1 1Design Side Water Depth (ft) NA 12 12 12
Freeboard at Design Depth (ft) NA 3 3 3
Volume (gal) NA 800,000 800,000 800,000
Reuse Field
Number of Basins 1 1 1 duty + 1 stby 1 duty + 1 stby
Design Side Water Depth (ft) 4 4 4 4
Freeboard at Design Depth (ft) 3 3 3 3
Infiltration rate (gpd / sf) 8 8 8 8
Area (acres) 2.85 2.85 5.7 5.7
a. Quantities for subsequent phases are total numbers for the plant at each phase.
b. One membrane rack has a design capacity of 0.25 mgd.
c. Design data for ancillary systems such as the chemical feed system, sludge wasting, stormwater system, etc., are
determined in later phases of design as the details of the main processes are developed.
EVALUATION OF WASTEWATER TREATMENT PLANT LOCATIONS
Locations Considered
Several general locations were considered for the proposed wastewater treatment plant and effluent reuse
area. These candidate locations were presented to the Jefferson County Board of County Commissionerson June 22, 2006 along with the alternatives for collection, treatment and discharge/reuse. Figure 8-1
shows the candidate locations in relation to the wastewater service area.
The candidate locations presented are as follows:
• South of Service Area/Adjacent to Sheriff’s Facilities – This location is south of the service
area near the intersection of Chimacum Road and Pomwell Road. There are several parcels
which would be suitable for development as a wastewater treatment plant.
8-5

8/14/2019 Port Hadlock Sewer Facility Plan 0908
http://slidepdf.com/reader/full/port-hadlock-sewer-facility-plan-0908 154/387
Port Hadlock UGA Sewer Facility Plan…
F i g u r e 8 - 1 .
A l t e r n a t i v e T r e a t m e n t P l a n t & E f f l u e n t R e u s e L o c a t i o n s
8-6

8/14/2019 Port Hadlock Sewer Facility Plan 0908
http://slidepdf.com/reader/full/port-hadlock-sewer-facility-plan-0908 155/387
8. RECOMMENDED ALTERNATIVE AND IMPLEMENTATION
8-7
• H.J. Carroll Park Vicinity – This location would be in the vicinity east and north of H.J.
Carroll Park. These properties would likely be accessed from Chimacum Road.
• Central Service Area – This location would be situated centrally within the service area near
the intersection of Mason Street and Cedar Street. This would be at the Pt. Hadlock Airstrip
site or immediately west.
• Airport – This location would be adjacent to the Jefferson County International Airport northof the service area approximate 3 miles. The site would be acquired from a property owner or
from the Port of Port Townsend through a purchase or lease.
• Chimacum High School Vicinity – This location would be south of the service area
approximately 1.5 miles south of the service area in the vicinity of Chimacum High School
(South of Wades Loop Road and West Valley Road). This would be land purchased from the
school district or an adjacent property owner.
Evaluation Criteria
The following criteria were used when comparing the candidate locations.
Adjacent Land Use
What is the adjacent land use to the candidate site? Are there factors which may make siting wastewater
treatment facilities less desirable?
Opportunities for Reuse
Does the candidate location lend itself to opportunities for reuse of the reclaimed water? Is the candidate
treatment site adjacent to the candidate reuse site? Does the location of the candidate reuse site present
one or more potential beneficial opportunities for reuse of the reclaimed water?
Life Cycle Costs
What are the 20-year life cycle costs for the alternative location? This includes consideration for landcost, pumping costs, capital costs, and operation and maintenance costs. In all alternatives, it was assumed
the wastewater would be collected at a central influent pump station at the intersection of Ness’ CornerRoad and Shotwell Road. The wastewater would then be pumped to the selected wastewater treatment
plant site. Since the cost for treatment facilities would be equivalent in all alternatives, they are not
included in the comparative lifecycle costs. The lifecycle costs will include pumping, pipeline, land cost,
and operation and maintenance costs since these costs will vary between the location alternatives.
Summary of Treatment Plant Location Evaluation
The alternative treatment plants locations were evaluated against the above-described criteria. Table 8-2 is
a summary of the evaluation of the alternatives against the criteria.
Recommended Treatment Plant Location
Based upon the results of the alternative analysis and feedback from the stakeholder workshop, a
treatment plant located in the south service area is recommended. A specific parcel has not been identified
at this time, but a parcel in the vicinity of the Sheriff’s facility or the adjacent gravel pit/cement plant is
recommended.

8/14/2019 Port Hadlock Sewer Facility Plan 0908
http://slidepdf.com/reader/full/port-hadlock-sewer-facility-plan-0908 156/387
P o r t H a d l o c k U G A S e w e r F a c i l i t y P l a n …
T A B L E 8 - 2 .
S U M M A R Y O F W A S T E W
A T E R T R E A T M E N T P L A N T S I T E E V A L U A T I O N
A l t e r n a t i v e
E v a l u a t i o n C r i t e r i a
S o . o f S e r v i c e A r e a
H . J . C a r r o l l P a r k
C e n t r a l S e r v i c e A r e a
A i r p o r t
C h i m
a c u m H i g h s c h o o l
A d j a c e n t L a n d U s e
- S h e r i f f ’ s f a c i l i t y ,
b a l l p a r k , g r a v e l p i t ,
a n d l o w d e n s i t y
r e s i d e n t i a l l a n d .
- U n d e v e l o p e d l a n d a n d
l o w d e n s i t y
r e s i d e n t i a l
l a n d .
- A i r f i e l d , r e s i d e n t i a
l
t r a i l e r p a r k , s i n g l e
f a m i l y r e s i d e n t i a l ,
l i b r a r y , g r a d e s c h o o l ,
a n d c o m m e r c i a l .
- A i r p o r t , a n d l o w
d e n s i t y r e s i d e n t i a l
l a n d .
- H i g h
s c h o o l b u i l d i n g s
a n d a t h l e t i c f i e l d s ,
a g r i c u
l t u r a l l a n d , a n d
s i n g l e
f a m i l y r e s i d e n t i a l
l a n d .
O p p o r t u n i t i e s f o r
B e n e f i c i a l R e u s e
- I r r i g a t i o n f o r b a l l
f i e l d s , p o s s i b l e f l o w
a u g m e n t a t i o n f o r
C h i m a c u m C r e e k ,
P o s s i b l e f u t u r e
c o m m e r c i a l / i n d u s t r i a l
c u s t o m e r s .
- I r r i g a t i o n
f o r p a r k
f i e l d s , a n d p o s s i b l e
f l o w a u g m e n t a t i o n f o r
C h i m a c u m
C r e e k .
- I r r i g a t i o n f o r s c h o o
l
f i e l d s , a n d p o s s i b l e
f l o w a u g m e n t a t i o n f o
r
C h i m a c u m C r e e k .
- P o s s i b l e f u t u r e
c o m m e r c i a l / i n d u s t r i a l
c u s t o m e r s .
- I r r i g a t i o n f o r s c h o o l
f i e l d s
a n d i r r i g a t i o n f o r
a g r i c u
l t u r a l l a n d s .
C o m p a r a t i v e 2 0 - y e a r
L i f e C y c l e C o s t s
C a p i t a l
$ 2 , 6 8 4 , 3 0 0
$ 3 , 8 8 0 , 4 0 0
$ 1 , 9 6 1 , 5 0 0
$ 4 , 1 6 1 , 4 0 0
$ 3 , 5 4 3 , 1 0 0
2 0 - Y r . O & M
$ 1 , 2 2 8 , 0 0 0
$ 1 , 6 7 9 , 0 0 0
$ 1 , 0 6 2 , 0 0 0
$ 1 , 7 4 4 , 0 0 0
$ 1 , 6 0 2 , 0 0 0
T o t a l 2 0 - y e a r L i f e
C y c l e C o s t
$ 3 , 9
1 2 , 0
0 0
$ 5 , 5
5 9 , 0
0 0
$ 3 , 0
2 3 , 5 0 0
$ 5 , 9
0 5 , 4
0 0
$ 5 , 1
4 5 , 1
0 0
8 - 8
8/14/2019 Port Hadlock Sewer Facility Plan 0908
http://slidepdf.com/reader/full/port-hadlock-sewer-facility-plan-0908 157/387
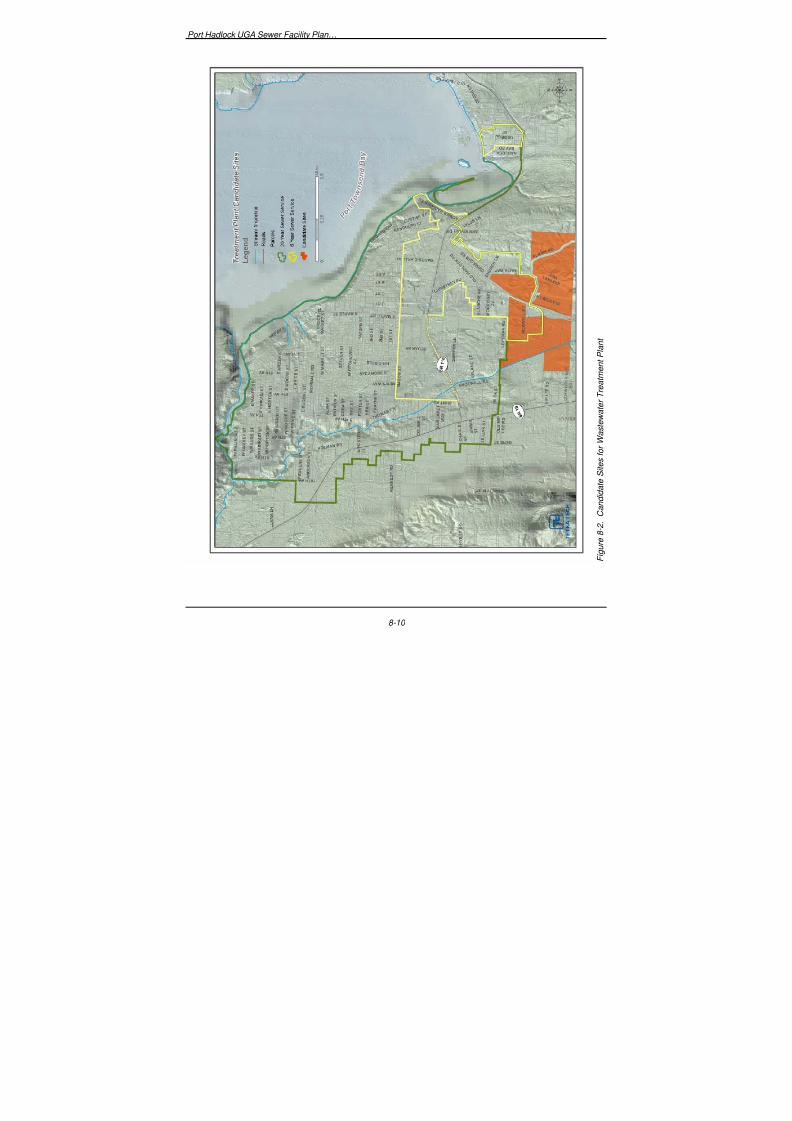
8/14/2019 Port Hadlock Sewer Facility Plan 0908
http://slidepdf.com/reader/full/port-hadlock-sewer-facility-plan-0908 158/387
Port Hadlock UGA Sewer Facility Plan…
F i g u r e 8 - 2 .
C a n d i d a t e S i t e s f o r W a s t e w a t e r T r e a t m e n t P l a n t
8-10

8/14/2019 Port Hadlock Sewer Facility Plan 0908
http://slidepdf.com/reader/full/port-hadlock-sewer-facility-plan-0908 159/387
…8. RECOMMENDED ALTERNATIVE
F i g u r e 8 - 3 .
P r o c e s s F
l o w D i a g r a m
8-11

8/14/2019 Port Hadlock Sewer Facility Plan 0908
http://slidepdf.com/reader/full/port-hadlock-sewer-facility-plan-0908 160/387
Port Hadlock UGA Sewer Facility Plan…
F i g u r e 8 - 4 .
S i t e D e v e l o
p m e n t P l a n .
8-12
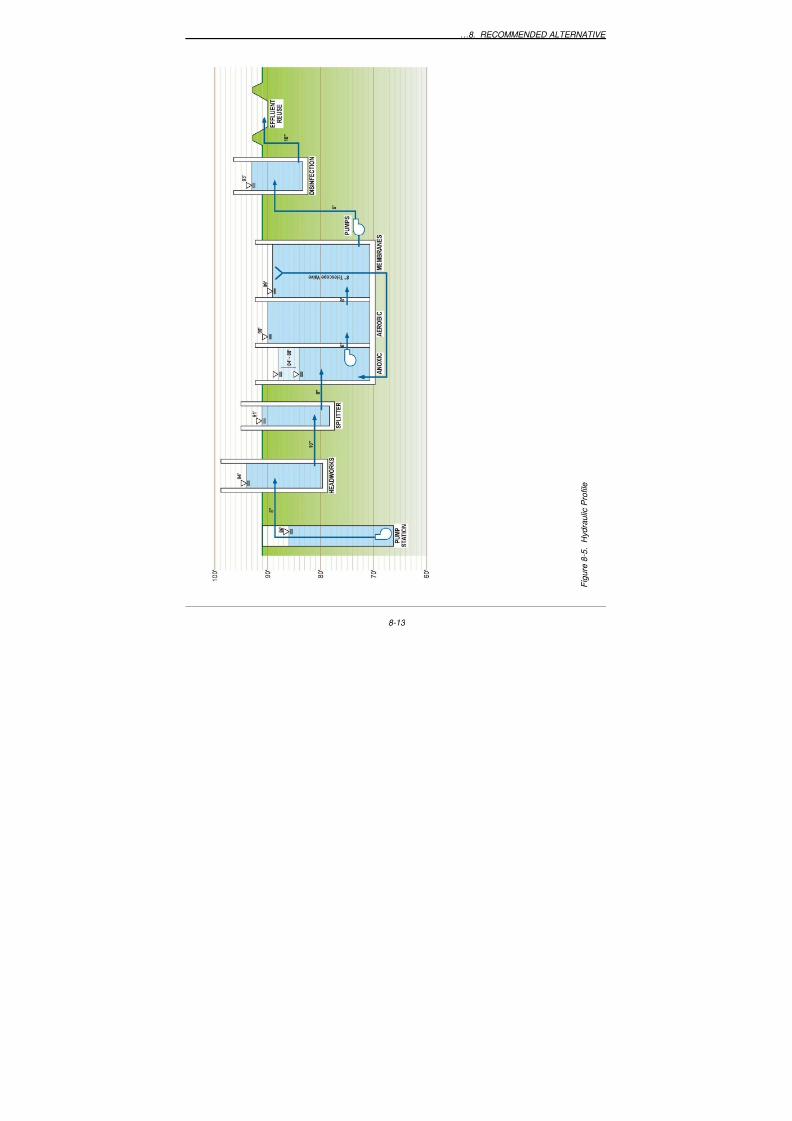
8/14/2019 Port Hadlock Sewer Facility Plan 0908
http://slidepdf.com/reader/full/port-hadlock-sewer-facility-plan-0908 161/387
…8. RECOMMENDED ALTERNATIVE
F i g u r e 8 - 5 .
H y d r a u l i c P r o f i l e
8-13

8/14/2019 Port Hadlock Sewer Facility Plan 0908
http://slidepdf.com/reader/full/port-hadlock-sewer-facility-plan-0908 162/387
Port Hadlock UGA Sewer Facility Plan…
Land Need Estimates for Recommended Treatment & Reuse System
Table 8-2 provides a summary breakdown of the land needs estimated for reclamation plant, reuse area,
and influent pump station site.
TABLE 8-2.ESTIMATED LAND AREAS FOR WASTEWATER FACILITIES
Description Estimated Land Area (acres)
Wastewater Treatment Plant:
2030 Treatment Plant Footprint 3 acres
Area for Future Expansion 2 acres
Buffer/Setback 1 acre
Total, Wastewater Treatment Plant 6 acres
Effluent Reuse Area:
Infiltration Basin (Sized for 2030 Flow) 3 acres
Reserve/Redundancy 3 acres
Buffers 3 acres
Total, Effluent Reuse Area 9 acres
Influent Pump Station:
Pump Station Site 1 acre
Total Estimated Land Need 16 acres
SUMMARY OF ESTIMATED COSTS
Planning Level Costs vs. Life Cycle CostsThis section presents the planning level costs for the recommended wastewater collection and treatment
system. These are estimated planning level costs which are different than life cycle costs used for
comparison of alternatives. Key differences between the planning level costs presented in this section and
life cycle costs used for comparison of alternatives are as follows:
• The planning level costs do not include full replacement of all equipment and capital.
Replacement is scheduled as needed.
• The planning level costs represent forecasted cash flow to pay for capital and operations and
maintenance on a year by year basis from 2010 to 2030. The forecasts include consideration
for system expansion and opportunities to shift costs into the future when advantageous.
• The 20-year life cycle costs are a summation of all capital costs over the 20-year period plus
an equivalent net-present worth for 20 years of estimated operation and maintenance costs.This method is convenient for comparing alternatives but does not necessarily provide a
planning level cash flow forecast for a selected alternative.
Planning Level Cost Summary
Table 8-3 (at end of chapter) shows the forecasted costs estimated for the recommended wastewater
system. These costs are presented in 2009 dollars which represent the planned midpoint of construction.
8-14

8/14/2019 Port Hadlock Sewer Facility Plan 0908
http://slidepdf.com/reader/full/port-hadlock-sewer-facility-plan-0908 163/387
…8. RECOMMENDED ALTERNATIVE
8-15
These costs, and the forecasted years in which they occur, are the basis for the analysis presented in
Chapter 9 – Cost and Financing.
The costs are presented as capital costs which will be spent for constructing facilities, annual costs which
include operation and maintenance, and replacement costs which is a set-aside allowance to build up a
cash reserve for full replacement of all structures, capital and equipment. Replacement of membranes, for
example, is included as a maintenance item.
A detailed breakdown of the estimated costs is presented in Appendix D.
Staff Requirements
Estimated staffing requirements for the initial phase of the project are approximately one and one-half full
time equivalent (1.5 FTE). This includes operations and maintenance activities at the plant, pump station
checks, lines flushing, and laboratory work. In the year 2030, 2.5 FTE would be required. Initially, some
part-time staff may be hired from other local utility agencies to defray costs.
Operators must have experience with operation of a water reclamation facility, which requires another
level of expertise over and above that required for wastewater treatment facilities not designed forbeneficial reuse.
IMPLEMENTATION SCHEDULE
Table 8-4 shows the estimated schedule for the wastewater facilities implementation. Phasing of
implementation is the most significant driver for the schedule. The schedule is subject to change and will
be revised throughout the course of the project.
TABLE 8-4.IMPLEMENTATION SCHEDULE
Item/Activity Estimated Date of Completion
Wastewater Facility Plan Approval (Dept. of Ecology & Dept.
of Health)
October 2008
Complete Site Procurement Finalize Environmental Review July 2009
Agency Planning for Implementation September 2009
Wastewater Facilities Implementation
Permitting September 2009
Detailed Hydrogeological Analysis June 2009
DOE Approval of Plans and Specs; Application for DOE
grant/loan fundinga
October 2009
Phase I Construction October 2009 - December 2010
a. Plans and Specs must be approved by DOE by October 31 in order to apply for DOE funding at the same
time, with funds to be available the following June or later in the year.

8/14/2019 Port Hadlock Sewer Facility Plan 0908
http://slidepdf.com/reader/full/port-hadlock-sewer-facility-plan-0908 164/387
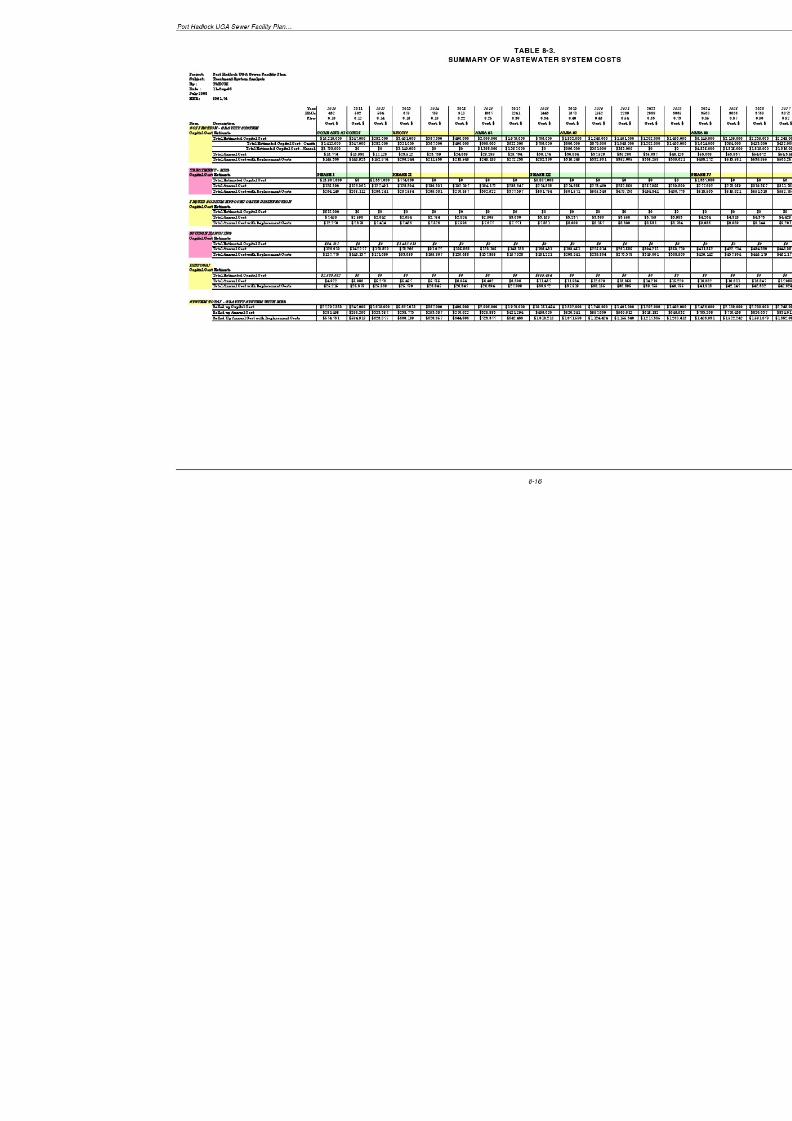
8/14/2019 Port Hadlock Sewer Facility Plan 0908
http://slidepdf.com/reader/full/port-hadlock-sewer-facility-plan-0908 165/387

8/14/2019 Port Hadlock Sewer Facility Plan 0908
http://slidepdf.com/reader/full/port-hadlock-sewer-facility-plan-0908 166/387

8/14/2019 Port Hadlock Sewer Facility Plan 0908
http://slidepdf.com/reader/full/port-hadlock-sewer-facility-plan-0908 167/387
CHAPTER 9.COST AND FINANCING
FINANCIAL PROGRAMThis financial program was developed to provide options on sources of funding for the construction of thesewer system, develop strategies for repayment by users, and indicate what the resulting impact would beon customers. In addition, a series of policies are noted for discussion as the County moves forwardtoward implementation. These policies relate to funding decisions and the financing package.
SOURCES OF CAPITAL FUNDING
There are a variety of funding sources that are available to finance the construction of the sewer system.These include federal, state and local programs of grants, loans or some type of bonds.
In the past, it has been possible to receive a federal grant for a new sewer system that would provide the
majority of the funds and would not need to be repaid. In current times, this is no longer possible.Instead, it is common to attempt to receive grants for the largest amount possible, matched withcompanion loans at low-interest rates, and the remainder put together from another low-interest loan or byselling bonds.
Each funding program was developed to provide assistance for different reasons and as such, eachprogram comes with a series of requirements that can be technical, financial, policy-related orprogrammatic. It is understood that this sewer system will require substantial investment to construct thetreatment facilities, the collection system and the on-site improvements required to connect the users tothe public system. In order to be successful, new customers must join the system and help with the debtrepayment and the on-going operations and maintenance. Funding agencies will not provide the necessarycapital without assurance that they will be repaid and will also set requirements to help ensure that the
sewer system will be successful for years to come.
TYPES OF CAPITAL FUNDING SOURCES
The primary types of capital funding sources include grants, loans, bonds, other sources, and users.
Grants
Grants do not require repayment and are very popular. Unfortunately, grants are quite limited and aretypically targeted to making sewer systems more affordable for residential customers. The programs arecompetitive and a thoughtful application that addresses the program’s target is important. Often, grantsare matched with companion loans.
In addition to the programs that are targeted to making the residential sewer costs more affordable, thereare a variety of programs that are geared toward economic development, business and job development.Typically, the economic development-type programs require a commitment of specific jobs that willresult from the investment.
Department of Ecology (DOE) (grant/loan)
The Washington State Department of Ecology has several water quality grant and loan programs availablefor wastewater treatment systems. Typical DOE programs have a combined annual application cycle with
9-1
8/14/2019 Port Hadlock Sewer Facility Plan 0908
http://slidepdf.com/reader/full/port-hadlock-sewer-facility-plan-0908 168/387
Port Hadlock UGA Sewer Facility Plan…
applications due in October of each year. The draft offer list is published in January, with the final offerlist being published the following June. Successful recipients must have signed agreements within sixmonths. Actual work must begin within 16 months of the final offer list and be completed within fiveyears. The key for DOE is to identify which water quality problems are being addressed. Recently, DOEredefined hardship to include systems where the sewer rate (capital and O&M) is greater than 2 percent of median household income (MHI), up from 1.5 percent. In hardship cases, grants may be available along
with reduced interest rates on loans to help make sewer more affordable for residential customers. Anygrant would likely be matched with a companion loan at a low interest rate – currently 2.9 percent for a20-year repayment, but could be as low as 0.0 percent for severe hardship. The maximum grant would be$5 million according to this year’s program.
Appendix H of the DOE application package includes the MHI table. For use with Fiscal Year 2010-2011, the MHI for the Port Hadlock/Irondale Census Designated Place (CDP) was $32,202 for the 2000census. DOE estimated the 2009 MHI to be $41,664. To qualify for hardship, 2.0 percent of the MHIwould be $833, or $69.44 per month. Sewer rates between 3 and 5 percent of the MHI would qualify asElevated Hardship and result in potential 75 percent grant and/or a loan at 20 percent of the marketinterest rate. The Port Hadlock sewer project would clearly qualify for hardship and likely fall into theElevated Hardship category.
DOE Reclaimed Water Program (grant/loan)
DOE had a one-time round of Reclaimed Water grants that was authorized by the legislature. JeffersonCounty submitted an application and was successful in securing grant funding for this project in theamount of $197,000 in 2008. This Pt. Hadlock UGA sewer project was on the funding cut-off line andadditional funding may be available if not used by other projects. Jefferson County will be workingthrough appropriate channels to request that the legislature continue funding this program.
US Department of Agriculture-Rural Development (USDA-RD) (grant/loan)
The United States Department of Agriculture has several programs under the Rural Development section.One is available to assist communities make the cost of a new sewer system more affordable to residential
customers. This program has an open-cycle where applications can be accepted year-round. Up to amaximum of 45 percent grant would be available and it would be matched with a low-interest loan,currently about 4 percent interest. The national program is targeting 75 percent loans and 25 percentgrants as an overall goal and will consider each project on its own merits and the economics of thecommunity being served. The terms of the loan could be stretched up to 40 years to bring down theannual debt service. This program requires assurance that the funds would be benefiting residentialcustomers and this often means requiring mandatory connection in order to satisfy. Another RuralDevelopment – Housing program is available to individuals to assist in paying the connection charges.This would be applied for by individuals based on income levels.
US Economic Development Administration (USEDA)
The United States Department of Commerce Economic Development Administration has a Public Worksand Economic Development Program to help support public infrastructure that is necessary to generate orretain private sector jobs and investments, attract private sector capital and promote regionalcompetitiveness.
State of Washington Community Trade & Economic Development (CTED)
State of Washington Community Trade & Economic Development manages several programs targetedtoward infrastructure along with community, economic and job development. These include theCommunity Economic Revitalization Board (CERB) programs to assist in attracting and retaining private
9-2
8/14/2019 Port Hadlock Sewer Facility Plan 0908
http://slidepdf.com/reader/full/port-hadlock-sewer-facility-plan-0908 169/387
…9. COST AND FINANCING
investment and resulting in jobs and increased tax revenue to the community. These may be a portiongrant combined with a loan.
Community Development Block Grant (CDBG)
Community Development Block Grant (CDBG) involves federal funds that have been allotted to the State
of Washington. This program is housed within the Community Trade & Economic DevelopmentDivision at the State. Smaller grants may be available on an annual cycle for a planning study, incomesurvey and other tasks that may be required to apply or comply with funding assistance from otherprograms.
Low-Interest Loans
Most grant programs mentioned above will combine funding packages with a low-interest loan. Thisensures that the funds repaid will be available to loan out to future projects. In addition, there are threekey programs that are focused on loans.
State of Washington Public Works Trust Fund (PWTF) Construction Program
State of Washington Public Works Trust Fund (PWTF) Construction Program is operated by the PublicWorks Board within Community Trade and Economic Development. The PWTF includes several loanprograms: planning, emergency, pre-construction and construction. The construction loans are offered onan annual competitive cycle with applications due in May and the funds available the following year. Themaximum for a jurisdiction is $10 million per biennium (two-year period), and the interest rates currentlyrange from 0.5 percent for a 15 percent local match, up to 2 percent for a 5 percent local match to berepaid over 20 years. The first year of each biennium is the largest construction cycle, with 2009applications being the next large cycle.
PWTF Pre-Construction Program
PWTF Pre-Construction Program is also operated by the Public Works Board. The Pre-Constructionprogram accepts applications year-round for a maximum of $1 million per jurisdiction per biennium. The
interest rates are the same as the construction program and the loans are to be repaid over five years, andextended to 20 years with construction financing. These funds are available for activities prior toconstruction including engineering, design, permitting, etc.
State of Washington Department of Ecology Clean Water State Revolving Fund (SRF)
This competitive loan program shares the application cycle with DOE’s grant program mentioned above.If a grant is awarded due to hardship, it will be matched with a low-interest loan from this program.Stand-alone loans are also possible with this source.
Bonds
Bonds are a financing mechanism that allows a jurisdiction to obtain construction financing in exchangefor promises of repayment backed by a variety of sources. The sale of bonds typically requirespreparation of an official statement and participation of bond counsel and an underwriter. However,bonds can be sold at any time of year to meet the project schedule with funds obtained at a certain dateinstead of the following year.
9-3

8/14/2019 Port Hadlock Sewer Facility Plan 0908
http://slidepdf.com/reader/full/port-hadlock-sewer-facility-plan-0908 170/387
Port Hadlock UGA Sewer Facility Plan…
General Obligation Bonds (GO Bonds)
Jefferson County has the authority to sell general obligation bonds that are backed by taxes and generalrevenue. “Backed” means that the County promises taxes and general revenue to repay the debt, althoughother sources can be used such as connection charges from new sewer connections.
Revenue Bonds – Future It is common to use Revenue Bonds to support sewer improvements, however this requires a specificstream of rate revenue to “back” the bonds. Because this is a new sewer system, there are no sewercustomers with history to “back” the bonds. This type of bond can perhaps be used in later years after thesewer rate history can be documented. While revenue bonds are a traditional funding source for sewerimprovements, it is typically less costly to borrow from subsidized state loan programs.
Other Sources
State and Tribal Assistance Grants (STAG)
Assistance from this grant program is requested directly from the federal congressperson representing thearea of the project. Applications or requests are due by April of each year. This requires communicatingwith your congressperson prior to submitting a request. They have to balance all requests from theirdistrict and sponsor the request to go forward. Successful STAG grants are administered by DOE.
Congressional or State Budget Line Items
This alternative refers to discussing the project with both state and federal representatives andcongresspersons to gain their support and perhaps have them submit a line item budget request specific toyour project. This is expected to be an important element in funding the Port Hadlock Sewer project.
Jefferson County Health Septic Tank Replacement Program
Jefferson County Health Department has been successful in receiving a grant from Washington StateDepartment of Ecology to provide financial assistance to residents to encourage the replacement of failingseptic tanks. This program operates like a revolving loan fund where the residents make repayment overa period of time and it is available to loan out to the next round. These funds are intended to be usedcounty-wide and are not specified for the Port Hadlock Sewer project. It is likely that this program couldbe coordinated with the sewer project to provide an additional source of funding. Additional funds couldalso be applied for to assist with conversion from septic to sewer for owners of property within thisproject.
Jefferson County Public Infrastructure Fund (PIF)
The County has a Public Infrastructure Fund that is used for priority infrastructure projects that encouragenew jobs by stimulating private investment around the County. The PIF Advisory Board includesrepresentatives from the county, city, PUD, port and two citizens. This Advisory Board reviews
applications and makes recommendations to the Jefferson County Board of Commissioners. The use of the PIF is ultimately determined by the Board of Commissioners. Currently, 50 percent of the PIF fundsare set aside for this priority Pt. Hadlock Sewer project. Each year, jurisdictions can apply for use of thefund. The total is a couple of hundred thousand dollars so it will not pay for this project. A specificprogram would have to be designed and submitted for consideration. One example would be to develop asewer incentive revolving loan program where small business owners or perhaps low to moderate incomehomeowners could borrow the funds for connection to the sewer (connection charges only, or, couldinclude on-site costs). The loans would be repaid over a specific number of years back into the fund thatcould be loaned out for more sewer connections. It should be noted that public funds can be used for on-
9-4

8/14/2019 Port Hadlock Sewer Facility Plan 0908
http://slidepdf.com/reader/full/port-hadlock-sewer-facility-plan-0908 171/387
…9. COST AND FINANCING
site costs but require repayment from the property owner. Jefferson County established this PIF in 2005in order to retain a portion of sales and use tax to increase their rural economy.
Local Infrastructure Financing Tool (LIFT)
A pilot program was established in 2006 by the State legislature with a competitive process through 2008.
Applicants would apply to the State to retain a portion of the increased sales tax. Jefferson County wasnot eligible in 2008, the last year of the pilot program. There may be some legislative activity to extendor enhance the program in coming legislative sessions.
Jefferson County Housing Authority
It is unclear whether the Housing Authority could be helpful in obtaining other funds to assist low-incomehousing in connecting to the sewer system. This would likely be some kind of loan and would requirepromises to ensure that the property remained serving low-income residents for a specific period of time.
Users
Utility Local Improvement Districts (ULID/LID)
Local or Utility Local Improvement Districts are authorized by State statute. These mechanisms allowproperties within a specific boundary to finance the cost of sewer facilities that benefit the properties.This is a fairly common method of financing the extension or expansion of collection system. Aboundary would be set by Jefferson County Commissioners, either by petition of the property owners orby resolution. An appropriate share of the cost of the facilities would be assessed to each property, not toexceed the benefit received. Bonds are sold to finance the construction and the properties repay theirassessment over a number of years (10 to 20) plus interest. These bonds are “backed” by the property andimprovements.
Connection Charges
Connection charges are one-time fees paid by new connections to the sewer system that represent their
fair-share of the cost of the facilities in place to serve them. Connection charges are typically paid uponconnection to the system. The use of connection charges is very common. As costs of sewer systemshave increased, some jurisdictions allow customers to pay the connection charges over several years bysigning an installment agreement. Payment over time is more practical for a utility that already hascustomers in place with a healthy financial condition (stable stream of revenue sufficient to meet theutilities needs and commitments).
Developer Extensions
Some jurisdictions use developer extensions as a method of expanding the collection system. This meansthat a developer finances and installs the system necessary to serve his/her property. Upon completion,the facilities are transferred to utility ownership. If, in the future, another property connects to that stretchof sewer line, a latecomer’s agreement allows the utility to collect the fair-share (defined in the
agreement) and send it to the original developer that financed and installed the line. This method wouldnot be practical for the initial core sewer system but may be available in the future as developers maywish to connect prior to the phased implementation schedule.
Debt Repayment with Monthly Rates
It is common for monthly sewer rates to include debt repayment for construction of major facilities. Thisworks well when you have a customer base to support the debt, along with operation and maintenance
9-5
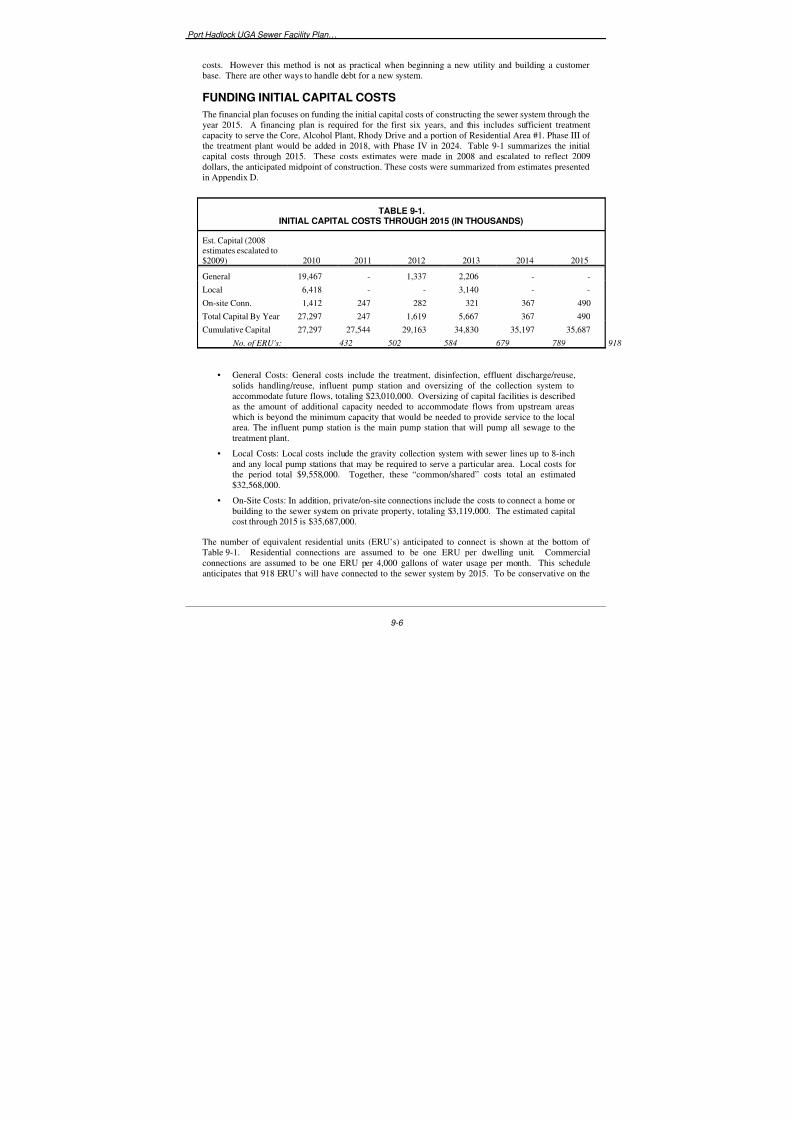
8/14/2019 Port Hadlock Sewer Facility Plan 0908
http://slidepdf.com/reader/full/port-hadlock-sewer-facility-plan-0908 172/387
Port Hadlock UGA Sewer Facility Plan…
costs. However this method is not as practical when beginning a new utility and building a customerbase. There are other ways to handle debt for a new system.
FUNDING INITIAL CAPITAL COSTS
The financial plan focuses on funding the initial capital costs of constructing the sewer system through the
year 2015. A financing plan is required for the first six years, and this includes sufficient treatmentcapacity to serve the Core, Alcohol Plant, Rhody Drive and a portion of Residential Area #1. Phase III of the treatment plant would be added in 2018, with Phase IV in 2024. Table 9-1 summarizes the initialcapital costs through 2015. These costs estimates were made in 2008 and escalated to reflect 2009dollars, the anticipated midpoint of construction. These costs were summarized from estimates presentedin Appendix D.
TABLE 9-1.INITIAL CAPITAL COSTS THROUGH 2015 (IN THOUSANDS)
Est. Capital (2008
estimates escalated to$2009) 2010 2011 2012 2013 2014 2015
General 19,467 - 1,337 2,206 - -
Local 6,418 - - 3,140 - -
On-site Conn. 1,412 247 282 321 367 490
Total Capital By Year 27,297 247 1,619 5,667 367 490
Cumulative Capital 27,297 27,544 29,163 34,830 35,197 35,687
No. of ERU's: 432 502 584 679 789 918
• General Costs: General costs include the treatment, disinfection, effluent discharge/reuse,solids handling/reuse, influent pump station and oversizing of the collection system toaccommodate future flows, totaling $23,010,000. Oversizing of capital facilities is describedas the amount of additional capacity needed to accommodate flows from upstream areaswhich is beyond the minimum capacity that would be needed to provide service to the localarea. The influent pump station is the main pump station that will pump all sewage to thetreatment plant.
• Local Costs: Local costs include the gravity collection system with sewer lines up to 8-inchand any local pump stations that may be required to serve a particular area. Local costs forthe period total $9,558,000. Together, these “common/shared” costs total an estimated$32,568,000.
• On-Site Costs: In addition, private/on-site connections include the costs to connect a home orbuilding to the sewer system on private property, totaling $3,119,000. The estimated capitalcost through 2015 is $35,687,000.
The number of equivalent residential units (ERU’s) anticipated to connect is shown at the bottom of Table 9-1. Residential connections are assumed to be one ERU per dwelling unit. Commercialconnections are assumed to be one ERU per 4,000 gallons of water usage per month. This scheduleanticipates that 918 ERU’s will have connected to the sewer system by 2015. To be conservative on the
9-6

8/14/2019 Port Hadlock Sewer Facility Plan 0908
http://slidepdf.com/reader/full/port-hadlock-sewer-facility-plan-0908 173/387
…9. COST AND FINANCING
9-7
financing side, this schedule assumes that connection of existing homes/businesses will not be mandatory.New construction would be required to connect to the sewer system when it is available.
Table 9-2 summarizes the costs by category. The general and local costs (collectively called“common/shared costs”) total an estimated $32.6 million. The on-site connection costs (also called“private/on-site costs”) total $3.1 million. The total estimated capital cost through 2015 is $35.7 million.
This cost estimate is current as of July 2008.
TABLE 9-2.INITIAL CAPITAL COST THROUGH 2015
GENERAL 23,010,196
LOCAL 9,558,200
Subtotal 32,568,396
PRIVATE/ON-SITE 3,119,000
Total Estimated Cost 35,687,396
General costs are treatment-related that should be shared by all sewer customers. Table 9-3 shows theelements and the timing of the improvements anticipated. The improvements in 2010 will providetreatment capacity of 1,000 ERU’s. Additional membranes will be added in 2012 and storage will beadded in 2013 as the Phase II expansion increases the capacity by another 1,000 ERU’s. Solids handlingis assumed to begin with contract haul/reuse to delay capital expenditure on this aspect until morecustomers are connected to the sewer system. This is currently shown in 2013 and may be delayeddepending on the economics at the time. This analysis also includes oversizing of collection lines in the
general costs. An estimated 10 percent of collection lines will be sized over the standard 8-inch line.
The local collection system is assumed to be installed in the Core and Alcohol Plant areas in 2010 andpresumed to be in place in the Rhody Drive area within a few years after system startup. This wouldinclude any local pump stations. Expansion of sewer service into the 20-year residential areas isanticipated to begin in the year 2016 and continue to expand as shown in the capital facilities plan throughthe year 2024 when sewer service will be available through the entire sewer service area. The capitalfacilities plan shows development of the collection system to continue within the sewer service area andbe completed by the year 2030..
A review of the common/shared costs indicates that financing in 2010 will require $26 million. Anadditional $1.3 million will be needed in 2012, and $5.3 million in 2013. This financing plan focuses on
the general and local costs and assumes that the new connections would pay the private/on-site costs ontheir own property as they connect.

8/14/2019 Port Hadlock Sewer Facility Plan 0908
http://slidepdf.com/reader/full/port-hadlock-sewer-facility-plan-0908 174/387
Port Hadlock UGA Sewer Facility Plan…
TABLE 9-3.FINANCING COMMON/SHARED COSTS
(GENERAL AND LOCAL) THROUGH 2015
Common/Shared Costs 2010 2012 2013
General CostsTreatment – MBR 13,907,000 1,337,000 774,000
Disinfection 512,000 -
Solids Handling 84,701 - 1,432,013
Disposal 2,583,682 -
Oversizing Collection - 10% 879,800
Influent Pump Station 1,500,000
Subtotal General 19,467,183 1,337,000 2,206,013
Local Collection Costs
Core + Alcohol Plant 6,418,200
Rhody Drive 3,140,000
Total General & Local 25,885,383 1,337,000 5,346,013
Capacity ERU's 1,000 Add membranes Phase 2, 2,000
Note: There are no additional general or local costs planned for 2014-2015.
Depending on the final financing package, it may be possible to include financing for the private/on-sitecosts of those connecting when the sewer is available in their neighborhood. If so, these costs would haveto be repaid by the property owners but it could be a method of encouraging early connection to the sewersystem.
FUNDING EXAMPLE – SHARED CAPITAL COSTS
With common/shared capital costs of $26 million to initiate the sewer system, a common approach is toattempt to receive grants for the largest amount possible. These grants are often matched with companionloans at low-interest rates. The remainder would be generated from another low-interest loan or byselling bonds. Jefferson County would be the jurisdiction making application and promising repayment.The sewer utility would be the department within the County to account for, manage and repay any debt.If sufficient funds were not available, a loan or contribution would be required from the County to thesewer utility to make the payment.
Combination grant/loan packages are possible with both the Department of Ecology (DOE) and US
Department of Agriculture-Rural Development (USDA-RD). DOE has an annual application cycle inOctober of each year, with funds available the following July. The Port Hadlock UGA Sewer FacilityPlan must be approved by DOE prior to application and plans/specs must be approved by DOE prior toapplication for construction funding. There is new state focus on the clean-up of Puget Sound that mayresult in increased funding or higher prioritization for projects of this type. With Jefferson County beingone of the Puget Sound counties, the legislative activity and DOE programs should be monitored closelywith this in mind.
9-8

8/14/2019 Port Hadlock Sewer Facility Plan 0908
http://slidepdf.com/reader/full/port-hadlock-sewer-facility-plan-0908 175/387
…9. COST AND FINANCING
The USDA-RD program has an open application cycle. USDA Program Specialists work with the jurisdictions to ensure all criteria are being met and accept applications throughout the year. USDA AreaDirectors attempt to spread the available funding for the known projects so it is important to work closelywith the Program Specialists to remain on the radar screen. It is possible for the Area Directors to requestadditional assistance from the national program for certain hardship projects. The current interest rate forthe loan portion is approximately 4.5 percent and is adjusted quarterly.
For additional loans to complete the 2010 capital funding package, both Public Works Trust Fund(PWTF) and DOE State Revolving Fund (SRF) have low-interest loan programs. Both programs haveannual application cycles with PWTF in May and SRF in October of each year. Both programs wouldhave funds available the following year – PWTF around May and SRF after June. The maximum PWTFloan per biennium per jurisdiction is currently $10 million, with interest rates varying from 0.5 percent to2.0 percent depending on the amount of local match. The current interest rate for the SRF program is3 percent. For this funding example, an interest rate of 2.5 percent was used for the additional loan.
Table 9-4 provides an example of mixing funding sources as described above. It is assumed that60 percent of the customers are residential, as reflected in the PUD water account summary (see Chapter
4, Population, Flows and Loads, Commercial Population Projection). It is further assumed that USDA-
RD awards the maximum grant of 45 percent for hardship in this project and matches with a companionloan for the rest of the residential amount. The remainder would come from a low-interest loan fromeither PWTF or DOE SRF. The annual debt service on this package is shown to be approximately$1.3 million for 20 years. Jefferson County would have to guarantee to the funding agencies that thiswould be met.
The funding amounts shown in Table 9-4 are large compared to the resources currently available withinthe funding programs. While the $10.3 million is just over the current PWTF limit, the other programsmay be pressed to commit such large amounts to a single project. Three other potential sources wouldincrease the viability of the project – a federal State and Tribal Assistance Grant (STAG) toward theUSDA-RD portion shown would help ensure the full project could be funded, potential additional fundsor new programs within the State focused on the cleanup of Puget Sound, or possibly a state or federallegislative line item appropriation would leverage the project to viability.
Another approach would be to separate the funding of the treatment portion from the collection system byforming Local Improvement Districts or Utility Local Improvement Districts (LID/ULID) for thecollection system. In this method, the County would apply for funds to complete the general treatmentportion and LID/ULIDs would be formed by area to finance the local collection systems. This isdiscussed in more detail later.
Another approach would be for the County to sell general obligation bonds for the portion of the projectthat is not funded with grants and low-interest loans.
Table 9-5 tests an estimated stream of revenue that would be generated from connection charges to makethe annual debt payments on the above example. The annual debt service would begin at $1,322,000.
The test is to ensure that the sewer capital investment would be self-supporting and the ending balancedoes not drop below zero. In each year, the debt payments and future capital improvements are deductedfrom the connection charge revenue. Additional borrowing is necessary to keep the balance above zerofor future capital improvements with $2 million in 2013 and $8 million in 2018 as shown in Table 9-5Part 1 below.
9-9

8/14/2019 Port Hadlock Sewer Facility Plan 0908
http://slidepdf.com/reader/full/port-hadlock-sewer-facility-plan-0908 176/387
Port Hadlock UGA Sewer Facility Plan…
9-10
TABLE 9-4.EXAMPLE OF MIXING FUNDING SOURCES
Grant/Loan from USDA-RD + Loanfrom PWTF or DOE 2010 Capital
PROJECT COSTGeneral / Treatment 19,467,183
Collection Core + Al 6,418,200
Subtotal Project 25,885,383
FUNDING SOURCES
Grant: USDA-RDa 6,990,000
Loan: USDA-RDb 8,540,000
Loan: PWTF / DOEc 10,360,000
Annual Debt (4.5%, 20 yrs) 657,000
Annual Debt (2.5%, 20 yrs) 665,000
Est. Annual Debt 1,322,000
a. Grant assumes 60% of customers are residential and maximum45% grant is offered.
b. USDA-RD loan assumes companion to grant for rest of residentialat 4.5% interest for 20 years. These loans may be spread up to 40years.
c. Remainder of project funded by a low-interest loan from eitherPWTF or DOE at an assumed interest rate of 2.5% for 20 years.
TABLE 9-5 PART 1.ESTIMATED REPAYMENT STREAM THROUGH 2018
Est. RepaymentStream 2010 2011 2012 2013 2014 2015 2016 2017 2018
New ConnectionERU's 432 70 82 95 111 129 149 174 202
Connection ChargeRevenue 6,519,428 1,061,457 1,234,278 1,435,236 1,668,914 1,940,637 2,256,601 2,624,008 3,051,234
AdditionalBorrowing 2,000,000 8,000,000
Annual DebtPayments:
USDA-RD 20 yrs 657,000
PWTF/DOE 20 yrs 665 ,000 $128,294 $513,177
Total DebtPayments 1,322,000 1,322,000 1,322,000 1,322,000 1,450,294 1,450,
1,450,294 1,450,294 1,450,294294
Future Capital1,337,000 5,346,013 1,398,000 1,357,000 9,445,454Improvements - - -
Ending Balance 5,197,428 4,936,885 3,512,163 27 49
98 396,655 213,368 368,8549,386 8,006 8,348

8/14/2019 Port Hadlock Sewer Facility Plan 0908
http://slidepdf.com/reader/full/port-hadlock-sewer-facility-plan-0908 177/387
…9. COST AND FINANCING
Table 9-5 Part 2 continues the test results through 2024, with a column for 2025-2030.
This test was carried out for the 20-year sewer planning period and showed that the debt service paymentscould be met, and future capital improvements made with additional borrowing of $500,000 in the finalyear, 2030., The ending balance in 2030 is estimated to be approximately $300,000 that would beprogrammed to buy down outstanding debt, make annual debt payments or set aside for capital reserves.
TABLE 9-5 PART 2.ESTIMATED REPAYMENT STREAM THROUGH 2024 AND 2025-2030
Est. RepaymentStream 2019 2020 2021 2022 2023 2024 2025-2030
New ConnectionERU's 235 273 318 369 430 500 633
Connection ChargeRevenue 3,548,019 4,125,688 4,797,410 5,578,498 6,486,758 7,542,897 9,552,787
AdditionalBorrowing 500,000
Annual DebtPayments: -
USDA-RD 20 yrs -
PWTF/DOE 20 yrs 32,074
Total DebtPayments 1,963,471 1,963,471 1,963,471 1,963,471 1,963,471 1,963,471 11,780,828
Future CapitalImprovements 996,000 361,000 353,000 - - 5,872,000 11,073,000
Ending Balance 957,402 2,758,619 5,239,558 8,854,58513,377,87
213,085,29
7 284,256
STRATEGIES FOR RECOVERING CAPITAL COST FROM USERS
The next piece of the financing puzzle is to develop a strategy for recovering the capital costs from theusers of the new sewer system. Three strategies for repayment are described below and includeconnection charges per connection and usage of the system, formation of a ULID to spread the costsbased on benefit, and Assessed Value of property to spread the costs based on property value.
Strategy 1. Connection Charges for General and Local
Connection charges are paid one time by the property owner in exchange for permission to connect to thesewer system. Under this method, the general and local share would be paid when the customer connectsto the sewer system. Property owners can select their own method of payment; for example, home equityloan, second mortgage, savings, or credit card.
As is shown in Table 9-5, it appears that, as long as connections come in at the anticipated pace, the sewerutility would have sufficient funds to make the debt payments. The risk would be seen if connections didnot keep pace as anticipated and the County would need to loan funds to make the debt payment.
9-11

8/14/2019 Port Hadlock Sewer Facility Plan 0908
http://slidepdf.com/reader/full/port-hadlock-sewer-facility-plan-0908 178/387
Port Hadlock UGA Sewer Facility Plan…
Strategy 2. Utility Local Improvement District (ULID) for Local + Connection Charges for General
ULID assessments are paid over a number of years when sewer lines come to your neighborhood +connection charges are paid for general costs when connecting to the sewer system. This method spreadsthe local collection system costs among the properties to be served and the general treatment-related costs
will be paid upon connection to the sewer system. This recognizes that the ULID method allows theproperty owners to finance the cost of neighborhood sewer lines over a number of years and still pay thegeneral treatment portion only when connecting. This strategy shares the financial risk between theCounty, the properties served by the sewer system and those connecting to the system.
A ULID would be formed with a boundary drawn around the properties to be served by the localcollection system. All properties would participate and receive an assessment which would be paid over aset period (typically between 10 to 20 years). The assessments cannot exceed the benefit. Bonds can besold for the ULID costs, or could possibly be funded by grants or loans, and the assessments would bestrictly designated for repayment of the bonds.
Strategy 3. Assessed Value (AV) for General and Local
This third method spreads the general and local costs of constructing the sewer system over the value of the property to be served. The property owners would pay annually based on the property value assignedby the Jefferson County Assessor for real estate tax purposes. Undeveloped property would pay muchless than developed property. This method would allow the County to sell bonds backed by the propertyassessments collected specifically to fund the debt repayment.
Jefferson County used this method when establishing the Port Ludlow Drainage District. It is not ascommon to use for sewer systems but could be used to spread the costs across the entire 20-year area if desired. The assessment would be set as a rate per $1,000 of assessed value per year.
COST IMPLICATIONS OF USER RECOVERY STRATEGIES
All three strategies are possibilities for the Irondale/Port Hadlock sewer system. The first two are moretypical for sewer applications. These are compared and described more fully in Table 9-6.
TABLE 9-6.COMPARE USER RECOVERY STRATEGIES
Pay Upon ConnectionWithoutGrant
With Grant(Residential)
1. CONN CHG for GENERAL & LOCAL
Connection Charge per ERU $17,400 $9,570
+ Average On-Site $3,500 $3,500
Est. New Connection $20,900 $13,070
Pay Local thru ULID & General thruConnection charge
WithoutGrant
With Grant(Residential)
2. ULID FOR LOCAL + CONN CHG FOR GENERAL
Connection Charge per ERU $9,300 $5,115
+ ULID Assessment per ERU $8,100 $4,455
+ Average On-Site $3,500 $3,500
Est. New Connection $20,900 $13,070
9-12
8/14/2019 Port Hadlock Sewer Facility Plan 0908
http://slidepdf.com/reader/full/port-hadlock-sewer-facility-plan-0908 179/387
…9. COST AND FINANCING
The examples show the anticipated costs without and with a potential grant. The potential grant isdescribed earlier in the funding example where a maximum 45 percent grant would apply to residentialcustomers. There is no guarantee that this level of grant would be achieved, however USDA-RD willwant to be assured that the grant is benefiting residential customers to make the cost more affordable.
Residential customers are assumed to be 1 ERU per dwelling unit. For commercial customers, the
number of ERU’s is determined by the monthly water usage, where one ERU is equal to 4,000 gallons of water per month.
The first example above with connection charges for general and local results in a connection charge of $17,400 per ERU + average on-site cost of $3,500 for a total estimate of $20,900 without any grantassistance. The $17,400 is calculated to reflect the 20-year general and local costs divided by4,201 ERU’s (the total number of ERU’s forecasted to be connected to the sewer system at the end of the20-year period). Approximately 15 percent was added to reflect the potential cost of financing androunded to the nearest thousand dollars.
If the maximum grant were received from USDA-RD, it is assumed it would apply to the connection feeand likely not to the average on-site cost. The average on-site cost is estimated to be $3,500 per
connection for the gravity system. This will be higher for properties where the house is set farther back from the street, have mature landscaping or paving/walkways that must be disturbed and replaced. Whilea commercial customer may be equal to 3 ERU’s for water and sewer, the on-site cost will not necessarilybe 3 times the average cost.
In the second example above, the general and local costs are separated and spread in different manners,either by connection charge or by ULID assessment. The average on-site cost also applies. The totals arethe same but the timing of payment is very different for the two examples.
WHEN TO PAY FOR SEWER
A major difference between the two strategies has to do with when the customers pay for sewer. Theconnection charges are paid only when connecting to sewer. ULID assessments are filed on all propertiesserved when the sewer lines come to the neighborhood and can be paid annually over a number of years.Table 9-7 illustrates the differences.
Residents or businesses that have recently installed a septic system may prefer the first option of payingonly when connecting to the sewer system. Others may prefer the second alternative because it allows theproperty owner to finance a good portion of their obligation over 10-20 years. The ULID assessment willbe paid in annual installments and filed as a lien on the property, to be paid off when the property is sold.Customers will also have an opportunity to pre-pay the assessment to avoid any interest or financingcosts. The County and community will have detailed discussions of the policy implications of thefinancing alternatives and sewer ordinance prior to making application for grants and loans.
9-13

8/14/2019 Port Hadlock Sewer Facility Plan 0908
http://slidepdf.com/reader/full/port-hadlock-sewer-facility-plan-0908 180/387
Port Hadlock UGA Sewer Facility Plan…
9-14
TABLE 9-7.COMPARE ALTERNATIVES – WHEN TO PAY FOR SEWER
Residential Commercial
When To Pay For Sewer
Assessed WhenULID Comes toNeighborhood
+ Pay WhenConnect
Assessed WhenULID Comes toNeighborhood
+ Pay WhenConnect
1. Conn. Chg. for GENERAL & LOCAL
Pay GENERAL & LOCAL When Connect $9,570 $17,400
+ On-site to connect $3,500 $3,500
Est. New Connection $13,070 $20,900
2. ULID for LOCAL + Conn. Chg. for GENERAL
Pay LOCAL When ULID Comes to Neighborhood $4,455 $8,100
+ Pay GENERAL upon connection $5,115 $9,300
+ On-site to connect $3,500 $3,500
Est. New Connection $4,455 $8,615 $8,100 $12,800
* Assumes 45% Grant for Residential
CURRENT SEWER EXPANSION EXAMPLES
For those new to sewer systems, these costs likely feel high. For those of us working in the industry, thecosts per connection are reasonable compared to other current examples. Table 9-8 shows three othercurrent examples. As costs for sewer have risen, and as a tool to encourage early connection, some jurisdictions have invited customers to jointly finance on-site costs if connecting early. Thus, in
Table 9-8, there are two columns to the right – comparing General and Local costs or also including on-site costs.
TABLE 9-8.CURRENT SEWER EXPANSION EXAMPLES
Est. Cost to Connect to SewerGeneral +
LocalGeneral + Local
+ On-Site
Pt. Hadlock/Irondale
With Grant (Residential) $9,350 $12,850
Without Grant $17,000 $20,500
Langley $15,558
Ronald WW District $33,000
Bainbridge Island $30,000

8/14/2019 Port Hadlock Sewer Facility Plan 0908
http://slidepdf.com/reader/full/port-hadlock-sewer-facility-plan-0908 181/387
…9. COST AND FINANCING
9-15
The City of Langley recently decided to fund expansion of the collection system to encourage homes toconnect to the sewer system and increase the ratepayer base supporting the treatment plant. Previously,the collection lines were expanded only by developer extension without sufficient activity. Theconnection charges were increased substantially to reflect this change in policy.
Ronald Wastewater District in King County recently constructed sewer lines for several neighborhoods
with existing homes. An established district, Ronald allows customers to sign installment agreements tofinance their connection fees over time. The District obtained a PWTF low-interest loan and allowed thecustomers to include the on-site costs in the financing if connecting right away.
Bainbridge Island recently filed the final assessments for the South Island Sewer LID. The fundingsource was PWTF low-interest loans. The treatment plant is operated by another jurisdiction thatdeveloped a latecomer agreement to allow the new customers to connect and fund the necessaryimprovements. The assessments ranged from a low of $8,000 for customers not connecting at this time,up to $30,000 for one neighborhood.
As you can see, each project is unique in the details of who owns and operates the treatment plant,collection lines and how the new customers participate and finance the construction. The Port
Hadlock/Irondale sewer project, with its own arrangement of details, will hopefully be able to attract thenecessary financing. These estimates have attempted to average and spread the costs over the 20-yearplanning horizon and anticipated number of connections.
Some may ask why the Port Hadlock/Irondale estimates are so much lower than the other examples? Isthis because we have selected the highest examples? The answer is no, we have selected currentexamples that we have been involved with in a variety of capacities over the past year.
OPERATIONS AND MAINTENANCE COST – MONTHLY RATES
The engineering cost estimates included ongoing operations and maintenance costs by year to match thephasing of the treatment plant and collection system, and anticipated usage. These estimates were madeon an annual basis. Additional costs were added in this financing portion to reflect the costs of billingand collection, state tax and administration of the sewer utility. Table 9-9 shows the estimated O&MCosts per ERU.
TABLE 9-9.ESTIMATED MONTHLY SEWER RATE
Estimated Monthly Rate For O&M/Admin Costs
O&M per ERU per Mo $50.00
Add Billing/Collection/State Tax/ Administration $10.00
= Estimated Monthly Sewer Rate $60.00
This is the estimated beginning monthly rate for the first several years, to be evaluated for customergrowth, meeting the O&M needs and building a replacement reserve. It is difficult to recommend a sewerrate including full depreciation or full replacement funding on a new system with only a few customers.It is more practical to set the beginning rate to ensure that operating costs can be met with the anticipatedcustomers. As more connections come in those first years, a replacement reserve will begin building.

8/14/2019 Port Hadlock Sewer Facility Plan 0908
http://slidepdf.com/reader/full/port-hadlock-sewer-facility-plan-0908 182/387
Port Hadlock UGA Sewer Facility Plan…
After five years, a review of the financial plan and rates should be done to ensure the rate is sufficient.This review should include further developing the replacement funding strategy.
DOE’s measure of hardship at 2.0 percent of median household income is $69.44 per month. The test of hardship, however, also includes the capital costs that would be in addition to the monthly rate. The PortHadlock Sewer project would clearly exceed the measure of hardship and make it eligible for potential
grant funding and lower interest rates on loans for the Department of Ecology programs.
WHAT DOES IT MEAN?
This sewer system will be expensive and financial assistance will be required to help bring the costs downto a more affordable level for the low to moderate income residents of the area, as well as the small localbusinesses. Overall the sewer system should benefit the area by enhancing the local commercialenvironment and protecting the water quality in Chimacum Creek and the shellfish beds in PortTownsend Bay. Additionally, the community has voiced its interest in replacing and potentiallyaugmenting any flows to Chimacum Creek with a high quality reclaimed water source as the area’s septictanks are replaced with sewer pipes.
The “art” of financing will be an important element of implementation of the sewer system. This refers tothe ability to attract financial assistance in a manner that will further the system on behalf of the citizensof the area. The current capital cost estimate is $20,900 per ERU without any grants. This would bereduced to an estimated $13,070 if the maximum 45 percent grant were achieved for residentialcustomers through the USDA-RD grant program. With additional financial assistance, it is hoped thatthis could be further reduced, or certainly for low to moderate income residents and small businesses.There are no guarantees with the “art” of financing.
This capital cost would be in addition to the $60.00 per month per ERU for operations and maintenance.
HOW TO CONTINUE TO MOVE FORWARD AND REDUCE COSTS
The current cost estimates are not set in stone. As the engineering side moves toward design, further
refinement will result in adjustment to the costs. It is the intention of the estimators in this Sewer FacilityPlan to be reasonably conservative to help ensure that the project can be implemented within the costsoutlined. Upon completion of the Sewer Facility Plan, the County can begin the process of applying forfinancial assistance. Toward this goal, County staff and consultants will:
• Continue to meet with funding program administrators about this project. This work needs tocontinue to ensure that the hoops and trade-offs of the funding programs are recognized.
• Become more familiar with programs and develop alternatives for low-income assistancethrough the USDA-Housing program, the Health Department septic replacement loanprogram and seek to create specific assistance with grant funding.
• Find out more about legislators and opportunities to meet and discuss projects and progress.
Let your federal and state legislators know about the project and how much additional grantassistance would mean to implementing the sewer system.
• Pay attention to the state legislature and DOE programs related to the clean up of PugetSound. Specifically let state legislators know about the timing of this project as an examplefor future funding.
• Discuss and finalize financial policies and methods of distributing costs. Exploreopportunities for O&M savings.
9-16

8/14/2019 Port Hadlock Sewer Facility Plan 0908
http://slidepdf.com/reader/full/port-hadlock-sewer-facility-plan-0908 183/387
…9. COST AND FINANCING
9-17
• Continue to seek ways to provide incentive and maximize initial participation in the sewersystem.
The implementation phase of the Irondale/Port Hadlock Sewer Project begins with DOE approval of theSewer Facility Plan. Financial assistance and County implementation policies will be significantcomponents of the implementation phase.
POLICY ISSUES FOR FUTURE DISCUSSION
Following are a number of key policy decisions that must be made in the implementation phase of developing the sewer system and ensuring its financial viability. The policies should be discussed anddecisions made prior to applying for funding. These will consider the impact on customers, financialrisks involved for the County and the funding agencies as well.
• Will connection be mandatory when sewer lines come to the neighborhood? This policy isimportant to ensure financial viability of the long-term sewer system and is often preferred byUSDA-RD and potentially other funding agencies.
• Can on-site costs be included in the financing package for those connecting in the first several
months? Depending on the funding scenario, this may or may not be allowable or practicalbut the approach would be to encourage more connections early by allowing the costs to befinanced over time.
• Will customers be allowed to pay connection fees over time? Perhaps this option is held forlow to moderate income property owners that cannot qualify for connection charge assistancewith the USDA-housing program. This would encourage and assist property owners toconnect that may have trouble raising the necessary funds. This is a good example of developing a program to be funded by the Jefferson County Infrastructure Fund.
• How will future capital cost escalation be reflected in the connection charges? There are avariety of ways this can be achieved. One method would be to increase the amount by theinterest rate paid for each year after the loan or bonds are obtained. This policy is anothermethod of encouraging early connection to the system.
• Will multi-family connections be treated any different than single family connections whereeach dwelling unit is equal to 1 ERU? This can be different for connection fees and formonthly rates. Any reductions in one class of customer would be spread among the otherusers.
• Will there be reductions for the monthly rates of senior low-income customers? Anyreductions in one class of customer would be spread among the other users unless there wereto be a contribution from other County funds.

8/14/2019 Port Hadlock Sewer Facility Plan 0908
http://slidepdf.com/reader/full/port-hadlock-sewer-facility-plan-0908 184/387
8/14/2019 Port Hadlock Sewer Facility Plan 0908
http://slidepdf.com/reader/full/port-hadlock-sewer-facility-plan-0908 185/387
CHAPTER 10.
PUBLIC INVOLVEMENT AND OUTREACH
The goal of public involvement and outreach is to inform interested citizens about the project and toprovide opportunities for meaningful involvement in the sewer planning process.
STAKEHOLDER WORKSHOP PROCESS
To facilitate local input, four focused stakeholder workshops were held to advise the development of the
sewer facility plan. Jefferson County Commissioners, County staff, local agency staff, and several
community leaders and other interested parties were invited to the workshops. The County identifiedlocal agencies whose facilities might be sewered and/or whose activities might be affected by the
installation or operation of a sewer. The County also identified representatives of business and
community organizations and citizens who had been active previously in the process to establish a UGA.
These parties were contacted by mail. A notice of each workshop was available on the project website,
on Jefferson County’s website, and in the County’s paper of record, the Port Townsend & JeffersonCounty Leader. The workshops were open to the public.
Over the course of the first three stakeholder workshops on March 16, May 25, and June 22, 2006,
workshop participants and the consultant team reviewed and evaluated a comprehensive array of sewer
system alternatives. The workshop participants identified their preferences for each component of the
sewer system, including wastewater collection, treatment, effluent disinfection, effluent discharge/reuse,
and solids handling/reuse. The consultant team used those preferences to help develop the technical
recommendation.
At the fourth workshop on October 10, 2006, the consultant team presented the project cost estimate,
potential financing strategies, and developments and design refinements to the preferred sewer system
alternative. The consultant team took questions and comments and used stakeholder input to identify
concerns to be addressed as development of the sewer facility plan moved forward.
Jefferson County anticipates hosting a fifth stakeholder workshop in Fall 2008 to present the completedsewer facility plan and to discuss next steps in the sewer planning process.
Written summaries of each stakeholder workshop, including questions, comments, and responses, were
made available on the project website and in a project notebook at the Jefferson County Library in Port
Hadlock. Copies of these summaries are included in Appendix B.
PUBLIC MEETINGS
Jefferson County hosted two public meetings (and plans to host a third public meeting in Fall 2008) to
provide information about the development of the sewer facility plan and to facilitate active publicparticipation in the sewer planning process. Informational meeting notices were mailed to property
owners in the sewer planning area, people who had joined the project mailing list, and representatives of
business and community organizations and citizens who had been active previously in the process to
establish a UGA. Notices of public meetings were posted at community locations in the project area
(QFC, Hadlock Building Supply, the Grange, Tri Area Community Center, WSU Extension, and
Jefferson County Library). Notices of public meetings were available on the project website, the
County’s website, and in the County’s paper of record, the Port Townsend & Jefferson County Leader.
10-1
8/14/2019 Port Hadlock Sewer Facility Plan 0908
http://slidepdf.com/reader/full/port-hadlock-sewer-facility-plan-0908 186/387
Port Hadlock UGA Sewer Facility Plan…
Each public meeting began with an informal open house period. Large boards were posted around the
room with information about the sewer planning process. Public meeting attendees were encouraged to
view the information and talk with members of the consultant team and County representatives. The open
house period was followed by a presentation by the consultant team and a question and answer period.
Input from the public was used to identify concerns to be addressed as sewer planning moved forward.
At the first public meeting on July 19, 2006, the consultant team presented and responded to questionsabout the alternatives for sewer system components and the rationale, from a technical standpoint, for the
recommended alternative. The consultant team described next steps in the decision-making process and
opportunities for public involvement.
At the second public meeting on October 25, 2006, the consultant team presented information on and
responded to questions about the cost estimate, potential financing strategies, and progress on preliminary
design for the preferred sewer system alternative. The consultant team described next steps in the
decision-making process and opportunities for public involvement.
At a third public meeting to be held in Fall 2008, the consultant team will provide an overview of the final
sewer facility plan and present information about next steps in the sewer planning process. The
consultant team and County representatives will respond to questions and comments from the public.
Written summaries of each public meeting and of public comment and response were made available on
the project website and in a project notebook at the Jefferson County Public Library. Copies of these
summaries are included in Appendix B.
At the request of the Port Hadlock – Tri Area Chamber of Commerce, County representatives and
members of the consultant team provided informational briefings to the Chamber during its regular
meetings on September 26, 2007 and June 25, 2008.
PROJECT WEBSITE
A project website, www.porthadlocksewer.org, was established to make information on the development
of the sewer facility plan available to the public. The website was announced in a June 2006 mailing to
people who had joined the project mailing list and representatives of business and community
organizations and citizens who had been active previously in the process to establish a UGA. The website
was announced in public meeting notices and stakeholder workshop invitations. A link to the project
website was available on the home page and the Irondale & Port Hadlock UGA page of Jefferson
County’s website.
Notices of all public meetings and stakeholder workshops were posted on the website. Written
summaries of each public meeting and stakeholder workshop were available on the project website, as
were PowerPoint presentations used at those meetings. Interested parties were able to sign up for the
project mailing list and submit comments via the website.
A hard copy notebook reflecting current information on the website was available for public review at theJefferson County Library in Port Hadlock.
PROJECT MAILINGS
In addition to the June 2006 mailing that announced the sewer facility plan project and the July 2006 and
October 2006 mailings that announced public meetings, notices were sent in March 2007, June 2007, and
June 2008 to all Irondale/Port Hadlock mailing addresses and other interested parties to report on the
10-2

8/14/2019 Port Hadlock Sewer Facility Plan 0908
http://slidepdf.com/reader/full/port-hadlock-sewer-facility-plan-0908 187/387
…10. PUBLIC INVOLVEMENT AND OUTREACH
10-3
status of sewer facility plan development and on next steps in the sewer planning process. E-mail notices
were sent to interested parties who had provided e-mail addresses.
Additional notices will be sent to announce the third public meeting and approval of the final sewer
facility plan.
COMMENT TRACKING AND RESPONSE PROCESS
Members of the public submitted comments in a variety of ways. Stakeholders and members of the
public were invited to ask questions and provide comments at all of the stakeholder workshops and public
meetings. The consultant team and representatives of Jefferson County responded to comments and
questions during those meetings. A summary of public comment and response from each public meeting
was posted on the Frequently Asked Questions page of the project website. Summaries of stakeholder
comment and response were included in the stakeholder workshop summaries, which were available on
the project website.
The consultant team received the comments that were submitted via the website. The consultant team
saved all comments for reference and forwarded the comments to County staff for their records. Some
comments were intended to inform the sewer planning process and did not require a response. Forquestions and comments that did require a response, the consultant team responded by e-mail to simple,
logistical questions. For more substantive comments, members of the project team typically discussed
and agreed upon a response before a County staff member responded by e-mail.
All comments and questions from the public were referenced during sewer facility plan development and
were used to help develop public presentations that were responsive to community concerns.

8/14/2019 Port Hadlock Sewer Facility Plan 0908
http://slidepdf.com/reader/full/port-hadlock-sewer-facility-plan-0908 188/387

8/14/2019 Port Hadlock Sewer Facility Plan 0908
http://slidepdf.com/reader/full/port-hadlock-sewer-facility-plan-0908 189/387
Jefferson County Department of Public Works
Port Hadlock UGA Sewer Facility Plan
APPENDIX A.
HYDROGEOLOGICAL EVALUATION REPORT
September 2008

8/14/2019 Port Hadlock Sewer Facility Plan 0908
http://slidepdf.com/reader/full/port-hadlock-sewer-facility-plan-0908 190/387

8/14/2019 Port Hadlock Sewer Facility Plan 0908
http://slidepdf.com/reader/full/port-hadlock-sewer-facility-plan-0908 191/387

8/14/2019 Port Hadlock Sewer Facility Plan 0908
http://slidepdf.com/reader/full/port-hadlock-sewer-facility-plan-0908 192/387

8/14/2019 Port Hadlock Sewer Facility Plan 0908
http://slidepdf.com/reader/full/port-hadlock-sewer-facility-plan-0908 193/387

8/14/2019 Port Hadlock Sewer Facility Plan 0908
http://slidepdf.com/reader/full/port-hadlock-sewer-facility-plan-0908 194/387

8/14/2019 Port Hadlock Sewer Facility Plan 0908
http://slidepdf.com/reader/full/port-hadlock-sewer-facility-plan-0908 195/387
8/14/2019 Port Hadlock Sewer Facility Plan 0908
http://slidepdf.com/reader/full/port-hadlock-sewer-facility-plan-0908 196/387

8/14/2019 Port Hadlock Sewer Facility Plan 0908
http://slidepdf.com/reader/full/port-hadlock-sewer-facility-plan-0908 197/387

8/14/2019 Port Hadlock Sewer Facility Plan 0908
http://slidepdf.com/reader/full/port-hadlock-sewer-facility-plan-0908 198/387

8/14/2019 Port Hadlock Sewer Facility Plan 0908
http://slidepdf.com/reader/full/port-hadlock-sewer-facility-plan-0908 199/387

8/14/2019 Port Hadlock Sewer Facility Plan 0908
http://slidepdf.com/reader/full/port-hadlock-sewer-facility-plan-0908 200/387

8/14/2019 Port Hadlock Sewer Facility Plan 0908
http://slidepdf.com/reader/full/port-hadlock-sewer-facility-plan-0908 201/387

8/14/2019 Port Hadlock Sewer Facility Plan 0908
http://slidepdf.com/reader/full/port-hadlock-sewer-facility-plan-0908 202/387

8/14/2019 Port Hadlock Sewer Facility Plan 0908
http://slidepdf.com/reader/full/port-hadlock-sewer-facility-plan-0908 203/387

8/14/2019 Port Hadlock Sewer Facility Plan 0908
http://slidepdf.com/reader/full/port-hadlock-sewer-facility-plan-0908 204/387

8/14/2019 Port Hadlock Sewer Facility Plan 0908
http://slidepdf.com/reader/full/port-hadlock-sewer-facility-plan-0908 205/387
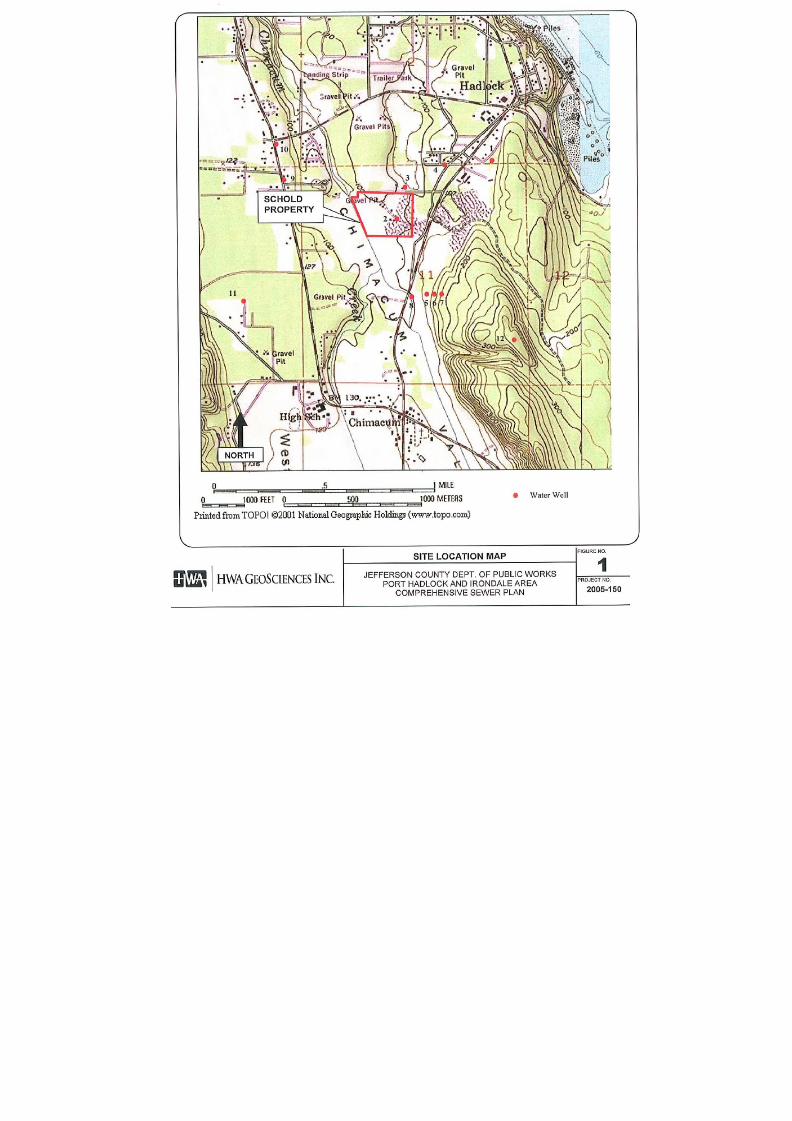
8/14/2019 Port Hadlock Sewer Facility Plan 0908
http://slidepdf.com/reader/full/port-hadlock-sewer-facility-plan-0908 206/387

8/14/2019 Port Hadlock Sewer Facility Plan 0908
http://slidepdf.com/reader/full/port-hadlock-sewer-facility-plan-0908 207/387

8/14/2019 Port Hadlock Sewer Facility Plan 0908
http://slidepdf.com/reader/full/port-hadlock-sewer-facility-plan-0908 208/387

8/14/2019 Port Hadlock Sewer Facility Plan 0908
http://slidepdf.com/reader/full/port-hadlock-sewer-facility-plan-0908 209/387

8/14/2019 Port Hadlock Sewer Facility Plan 0908
http://slidepdf.com/reader/full/port-hadlock-sewer-facility-plan-0908 210/387
8/14/2019 Port Hadlock Sewer Facility Plan 0908
http://slidepdf.com/reader/full/port-hadlock-sewer-facility-plan-0908 211/387

8/14/2019 Port Hadlock Sewer Facility Plan 0908
http://slidepdf.com/reader/full/port-hadlock-sewer-facility-plan-0908 212/387

8/14/2019 Port Hadlock Sewer Facility Plan 0908
http://slidepdf.com/reader/full/port-hadlock-sewer-facility-plan-0908 213/387

8/14/2019 Port Hadlock Sewer Facility Plan 0908
http://slidepdf.com/reader/full/port-hadlock-sewer-facility-plan-0908 214/387

8/14/2019 Port Hadlock Sewer Facility Plan 0908
http://slidepdf.com/reader/full/port-hadlock-sewer-facility-plan-0908 215/387

8/14/2019 Port Hadlock Sewer Facility Plan 0908
http://slidepdf.com/reader/full/port-hadlock-sewer-facility-plan-0908 216/387

8/14/2019 Port Hadlock Sewer Facility Plan 0908
http://slidepdf.com/reader/full/port-hadlock-sewer-facility-plan-0908 217/387

8/14/2019 Port Hadlock Sewer Facility Plan 0908
http://slidepdf.com/reader/full/port-hadlock-sewer-facility-plan-0908 218/387

8/14/2019 Port Hadlock Sewer Facility Plan 0908
http://slidepdf.com/reader/full/port-hadlock-sewer-facility-plan-0908 219/387

8/14/2019 Port Hadlock Sewer Facility Plan 0908
http://slidepdf.com/reader/full/port-hadlock-sewer-facility-plan-0908 220/387

8/14/2019 Port Hadlock Sewer Facility Plan 0908
http://slidepdf.com/reader/full/port-hadlock-sewer-facility-plan-0908 221/387

8/14/2019 Port Hadlock Sewer Facility Plan 0908
http://slidepdf.com/reader/full/port-hadlock-sewer-facility-plan-0908 222/387
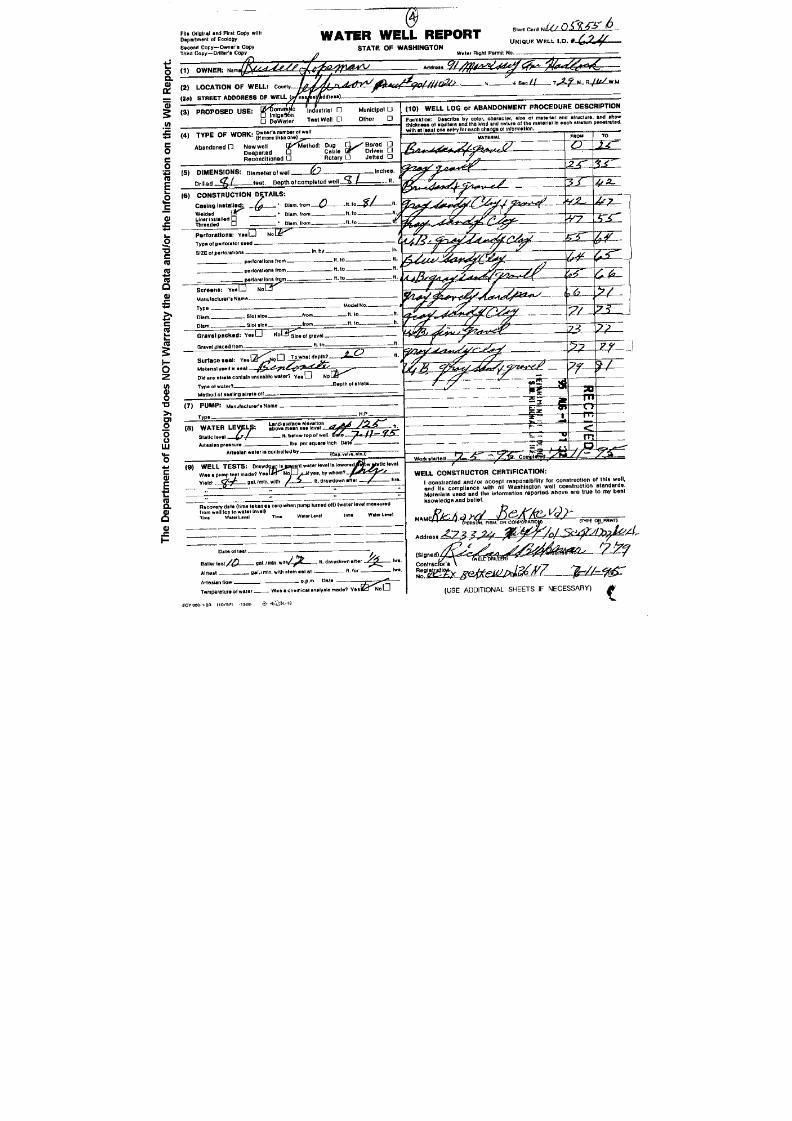
8/14/2019 Port Hadlock Sewer Facility Plan 0908
http://slidepdf.com/reader/full/port-hadlock-sewer-facility-plan-0908 223/387

8/14/2019 Port Hadlock Sewer Facility Plan 0908
http://slidepdf.com/reader/full/port-hadlock-sewer-facility-plan-0908 224/387

8/14/2019 Port Hadlock Sewer Facility Plan 0908
http://slidepdf.com/reader/full/port-hadlock-sewer-facility-plan-0908 225/387

8/14/2019 Port Hadlock Sewer Facility Plan 0908
http://slidepdf.com/reader/full/port-hadlock-sewer-facility-plan-0908 226/387

8/14/2019 Port Hadlock Sewer Facility Plan 0908
http://slidepdf.com/reader/full/port-hadlock-sewer-facility-plan-0908 227/387

8/14/2019 Port Hadlock Sewer Facility Plan 0908
http://slidepdf.com/reader/full/port-hadlock-sewer-facility-plan-0908 228/387
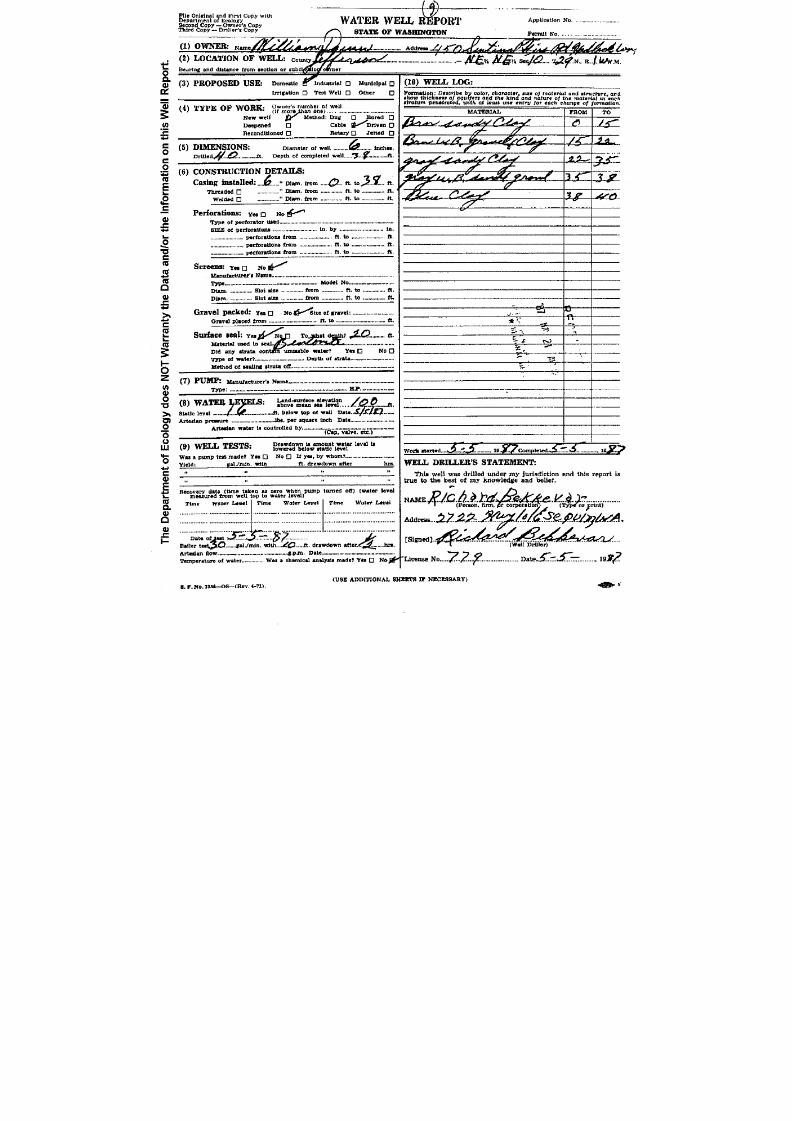
8/14/2019 Port Hadlock Sewer Facility Plan 0908
http://slidepdf.com/reader/full/port-hadlock-sewer-facility-plan-0908 229/387
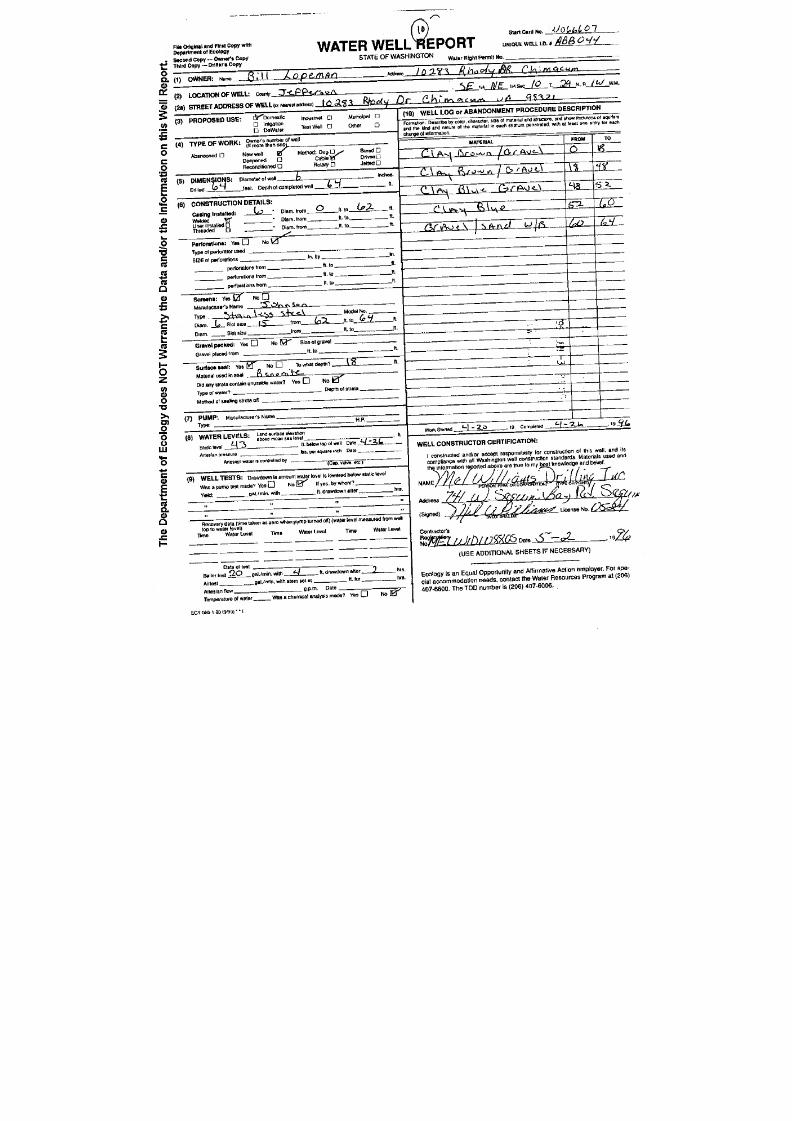
8/14/2019 Port Hadlock Sewer Facility Plan 0908
http://slidepdf.com/reader/full/port-hadlock-sewer-facility-plan-0908 230/387

8/14/2019 Port Hadlock Sewer Facility Plan 0908
http://slidepdf.com/reader/full/port-hadlock-sewer-facility-plan-0908 231/387

8/14/2019 Port Hadlock Sewer Facility Plan 0908
http://slidepdf.com/reader/full/port-hadlock-sewer-facility-plan-0908 232/387

8/14/2019 Port Hadlock Sewer Facility Plan 0908
http://slidepdf.com/reader/full/port-hadlock-sewer-facility-plan-0908 233/387

8/14/2019 Port Hadlock Sewer Facility Plan 0908
http://slidepdf.com/reader/full/port-hadlock-sewer-facility-plan-0908 234/387

8/14/2019 Port Hadlock Sewer Facility Plan 0908
http://slidepdf.com/reader/full/port-hadlock-sewer-facility-plan-0908 235/387

8/14/2019 Port Hadlock Sewer Facility Plan 0908
http://slidepdf.com/reader/full/port-hadlock-sewer-facility-plan-0908 236/387

8/14/2019 Port Hadlock Sewer Facility Plan 0908
http://slidepdf.com/reader/full/port-hadlock-sewer-facility-plan-0908 237/387

8/14/2019 Port Hadlock Sewer Facility Plan 0908
http://slidepdf.com/reader/full/port-hadlock-sewer-facility-plan-0908 238/387

8/14/2019 Port Hadlock Sewer Facility Plan 0908
http://slidepdf.com/reader/full/port-hadlock-sewer-facility-plan-0908 239/387

8/14/2019 Port Hadlock Sewer Facility Plan 0908
http://slidepdf.com/reader/full/port-hadlock-sewer-facility-plan-0908 240/387

8/14/2019 Port Hadlock Sewer Facility Plan 0908
http://slidepdf.com/reader/full/port-hadlock-sewer-facility-plan-0908 241/387
Jefferson County Department of Public Works
Port Hadlock UGA Sewer Facility Plan
APPENDIX B.
PUBLIC OUTREACH – MEETING SUMMARIES
September 2008

8/14/2019 Port Hadlock Sewer Facility Plan 0908
http://slidepdf.com/reader/full/port-hadlock-sewer-facility-plan-0908 242/387

8/14/2019 Port Hadlock Sewer Facility Plan 0908
http://slidepdf.com/reader/full/port-hadlock-sewer-facility-plan-0908 243/387
Port Hadlock UGA – Sewer Facility Plan
SUMMARYStakeholder Workshop on Collection System Alternatives
(Stakeholder Workshop #1)
March 16, 2006, 10 AM – 12 PM1820 Jefferson Street
Port Townsend, WA 98368-0920
In response to the 1990 Growth Management Act (GMA), Jefferson County pursued the
designation of an Urban Growth Area (UGA) in the Irondale/Port Hadlock area. As part of the
requirements for establishing a UGA, Jefferson County is conducting a study of alternatives for developing a sewer system. There are currently no sewer facilities in the area, and existing
residences and businesses are served by on-site treatment and disposal (septic) systems.
The sewer study will enable the County to identify 1) the final preferred alternative or method of
collection, treatment, and disposal of wastewater, 2) the service area, 3) the phasing of
implementation of sewers throughout the service area, 4) the cost for individual connections tosewer, and 5) revenue sources. The goal of the study is to produce a comprehensive sewer planthat will help the County plan for growth in the area over the next 20 years; that will satisfy
RCW 36.94 concerning County’s sewerage, water, and drainage system responsibilities; and that
will be approved by the Department of Ecology.
Workshop Summary
A stakeholder workshop was held at the Jefferson County Courthouse on Thursday, March 16
from 10:00 am to 12:00 pm. The workshop was open to the public.
The purpose of the workshop was to:
• Present collection system alternatives
• Review advantages and drawbacks of each alternative
• Take questions and comments
• Identify preferences for a collection system
Jefferson County Commissioners, County staff, local agency staff, and several key members of
the public were invited to the workshop. The County had identified local agencies whose
facilities might be sewered and/or whose activities might be affected by the installation or operation of a sewer. The County also identified representatives of business and community
organizations and citizens who had been active previously in the process to establish a UGA.
These parties were contacted by telephone. A notice of the workshop was available on the
County’s website and in the Port Townsend Leader.
County Commissioner David Sullivan (District 2) and County Commissioner Pat Rodgers
(District 3) attended the workshop. The consultants to the County were represented by Kevin

8/14/2019 Port Hadlock Sewer Facility Plan 0908
http://slidepdf.com/reader/full/port-hadlock-sewer-facility-plan-0908 244/387
Port Hadlock UGA – Sewer Facility Plan
2
Dour and Jim Santroch of TetraTech/KCM and Bob Wheeler and Ellen Blair of Triangle
Associates. A complete list of workshop participants is attached to this summary.
Introductions & Workshop Overview
Mr. Wheeler, workshop facilitator, opened the meeting at 10:10 am. He led introductions and
explained the purpose of the workshop. He noted that the sewer study had just begun and that itwas typical to start by identifying a collection system, because the collection system would help
determine the appropriate treatment approach. He explained that sewer planning is a step-wise
process, stressing that the project team understands that the cost component, which will be
developed over the next few months, will be crucial to the community. He noted that the presentation on collection system alternatives would show general cost figures, but that detailed
costs for each Equivalent Residential Unit (ERU) had not yet been developed.
Mr. Wheeler reviewed the agenda and requested that the County Commissioner have the first
opportunity to ask questions or comment during the discussion portion of the workshop. Hereviewed the steps that will lead to the selection of a complete sewer system, including publicinvolvement opportunities, technical work, and the development of costs and funding options.
Mr. Wheeler explained that the project team had recently interviewed several local citizens andrepresentatives of local agencies and community organizations to better understand what kind of
public involvement was needed and what kind of information people wanted. He noted that a
key theme that had been repeated in the interviews was that people did not want to participate in
a lot of public process until new, substantive information, especially cost information, wasavailable. People were interested in getting involved once the technical and financial
information started to come together and they could tell how they might be impacted personally.
Mr. Wheeler said that this message led the project team to plan to hold public open houses later
in the sewer study process, but he noted that the stakeholder workshops were intended as a way
to get early input from the community to ensure that the resulting sewer plan would meet thecommunity’s needs.
Collection System Alternatives
Mr. Dour, consultant team project manager, presented the collection system alternatives,reviewed the advantages and drawbacks of each alternative, and identified the short-list of
alternatives still under consideration. His PowerPoint presentation is attached to this summary.Key points of the presentation are summarized below.
Mr. Dour began by reviewing the purpose of sewer planning for the Irondale and Port Hadlock
area. The two main reasons are 1) to plan for expected growth in the area, and 2) to support
economic vitality in the area. Mr. Dour explained that the County is preparing a sewer FacilityPlan, as opposed to any other type of plan, for the following reasons:
• It is required by WAC 173-240 for constructing or modifying wastewater facilities,
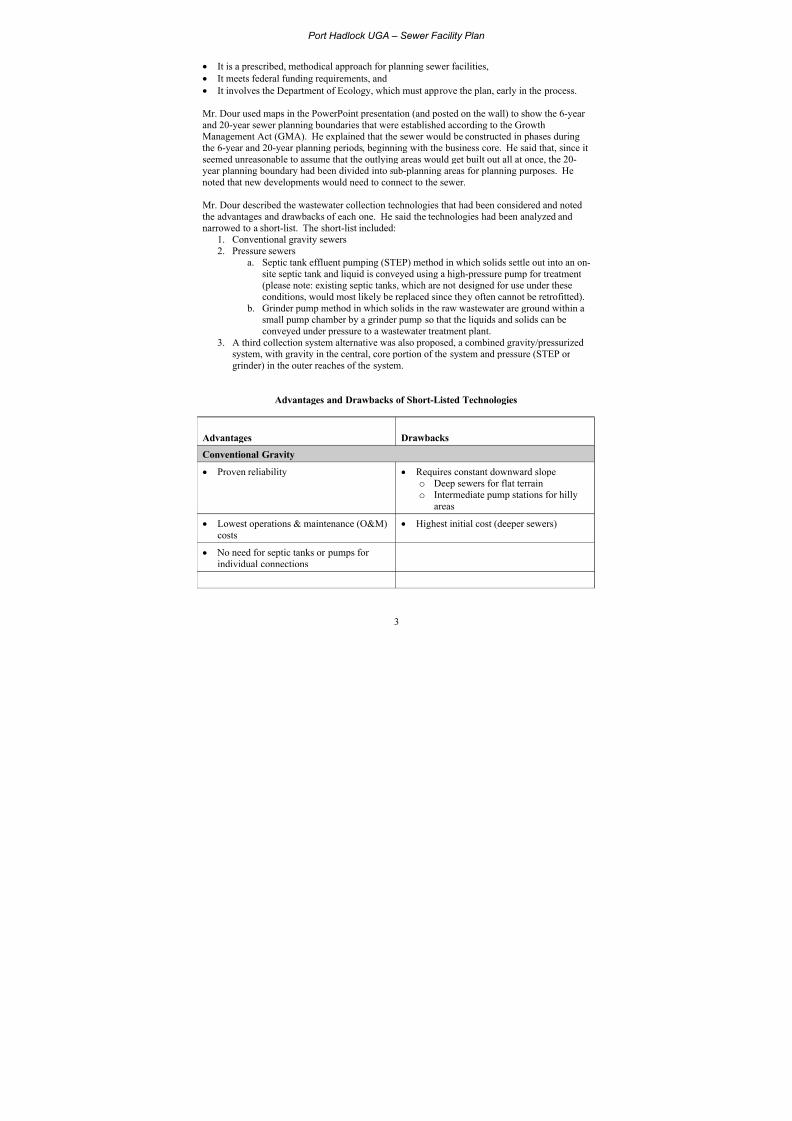
8/14/2019 Port Hadlock Sewer Facility Plan 0908
http://slidepdf.com/reader/full/port-hadlock-sewer-facility-plan-0908 245/387
Port Hadlock UGA – Sewer Facility Plan
3
• It is a prescribed, methodical approach for planning sewer facilities,
• It meets federal funding requirements, and
• It involves the Department of Ecology, which must approve the plan, early in the process.
Mr. Dour used maps in the PowerPoint presentation (and posted on the wall) to show the 6-year
and 20-year sewer planning boundaries that were established according to the GrowthManagement Act (GMA). He explained that the sewer would be constructed in phases during
the 6-year and 20-year planning periods, beginning with the business core. He said that, since it
seemed unreasonable to assume that the outlying areas would get built out all at once, the 20-year planning boundary had been divided into sub-planning areas for planning purposes. He
noted that new developments would need to connect to the sewer.
Mr. Dour described the wastewater collection technologies that had been considered and noted
the advantages and drawbacks of each one. He said the technologies had been analyzed and
narrowed to a short-list. The short-list included:1. Conventional gravity sewers
2. Pressure sewersa. Septic tank effluent pumping (STEP) method in which solids settle out into an on-
site septic tank and liquid is conveyed using a high-pressure pump for treatment(please note: existing septic tanks, which are not designed for use under these
conditions, would most likely be replaced since they often cannot be retrofitted).
b. Grinder pump method in which solids in the raw wastewater are ground within asmall pump chamber by a grinder pump so that the liquids and solids can be
conveyed under pressure to a wastewater treatment plant.
3. A third collection system alternative was also proposed, a combined gravity/pressurizedsystem, with gravity in the central, core portion of the system and pressure (STEP or
grinder) in the outer reaches of the system.
Advantages and Drawbacks of Short-Listed Technologies
Advantages Drawbacks
Conventional Gravity
• Proven reliability • Requires constant downward slope
o Deep sewers for flat terrain
o Intermediate pump stations for hilly
areas
• Lowest operations & maintenance (O&M)
costs
• Highest initial cost (deeper sewers)
• No need for septic tanks or pumps for
individual connections

8/14/2019 Port Hadlock Sewer Facility Plan 0908
http://slidepdf.com/reader/full/port-hadlock-sewer-facility-plan-0908 246/387
Port Hadlock UGA – Sewer Facility Plan
4
Pressure – STEP
• Low initial cost • Septic tank O&M (ownership agreements
• Smaller sewers that can follow terrain • Pump requirements (electrical connection)
Pressure - Grinder
• Used when terrain doesn’t allow gravity
sewers and septic tanks aren’t desired• Pump requirements (electrical connection,
O&M)
• Pump must pass solids
o More difficult than passing liquid only
o Additional maintenance required
Mr. Dour presented qualitative comparisons of the short-listed collection system technologies.
Qualitative Comparisons of Collection System Technologies
Conventional Gravity Pressure (STEP or Grinder)
Well-suited for high density housing (> 3
houses per acre)Well-suited for low density housing ( 3≤
houses per acre)
Higher up-front cost Lower up-front cost
Lower O&M cost and lower cost for future
connections
Higher O&M cost and higher cost for future
connectionsMore convenient: No tank or pump on private
property
Less convenient: Septic tank and pump on
private property
• Requires dedicated space
• O&M, access for pumping
Greater flexibility: if install gravity in
commercial core, later can install either gravityor pressure sewer in outer areas
Less flexibility: if install pressure sewer in
commercial core, later must install pressuresewer in outer areas
Higher total cost over 20-year planning period Lower total cost over 20-year planning period
System tends to last longer, up to 50 years Systems tend to last for less time; some major system components would likely be replaced
after 20 years
Higher percentage of total cost would be
eligible for grant funding. Gravity has higher up-front capital costs, which are often eligible
for grants.
Lower percentage of total cost would be
eligible for grant funding. Pressure involvescosts for septic tanks and pumps on private
property, which are generally not eligible for
grants.

8/14/2019 Port Hadlock Sewer Facility Plan 0908
http://slidepdf.com/reader/full/port-hadlock-sewer-facility-plan-0908 247/387
Port Hadlock UGA – Sewer Facility Plan
5
Mr. Dour concluded by presenting planning level estimates for the implementation costs, both by
total cost and by cost per ERU, for a gravity sewer collection system, a pressure sewer collection
system, and a combined sewer system. The costs were broken down by sub-planning area.
Questions & Comments
Workshop participants commented and asked questions during the presentation and during the
discussion period at the end of the workshop. Their comments and questions, as well as the
project team’s responses, are grouped by topic.
Conventional Gravity Sewer Details
Question: What is the actual slope for a gravity sewer?Response (Dour): The slope depends on the diameter of pipe, but a typical minimum slope for an 8 inch sewer is 0.004 feet per foot. When larger pipes are used, the slope can be a little less,
but there is a substantial drop if the pipeline is very long. Of course, it is rare to have a natural
downward slope for the whole course of the sewer.
Question: Generally, what is the topography of the service area?
Response (Dour): Coming south through Irondale, it goes from a high point to a low point with
a change of about 30 or 40 feet. But way at the north end there are low points, although we probably wouldn’t develop a sewer right by Chimacum Creek, where there is a 100 foot drop.
Pressure Sewer Details
Question: I assume at high densities, where it looks like a gravity sewer makes more sense thana pressure sewer, in part because of the number of septic tanks or grinder pumps that would be
required, that you would explore catching the wastewater for multiple homes in one tank or
pump.
Response (Dour): Yes, perhaps.
Question: Maximizing the use of available land is an important part of expanding. Compared
to current septic systems, could more land be used with a pressure system that has a septic tank
or a grinder pump? What would be the impact on a commercial parking lot?Response (Dour): If there is a septic tank in place now, the new septic tank or the grinder pump
could be placed in the same space. The drainage field would no longer need to be protected, sothat land could be used. Also, a parking lot could go over top of an extra strong septic tank
(designed for vehicle loading) or grinder pump system (if installed in a vault).
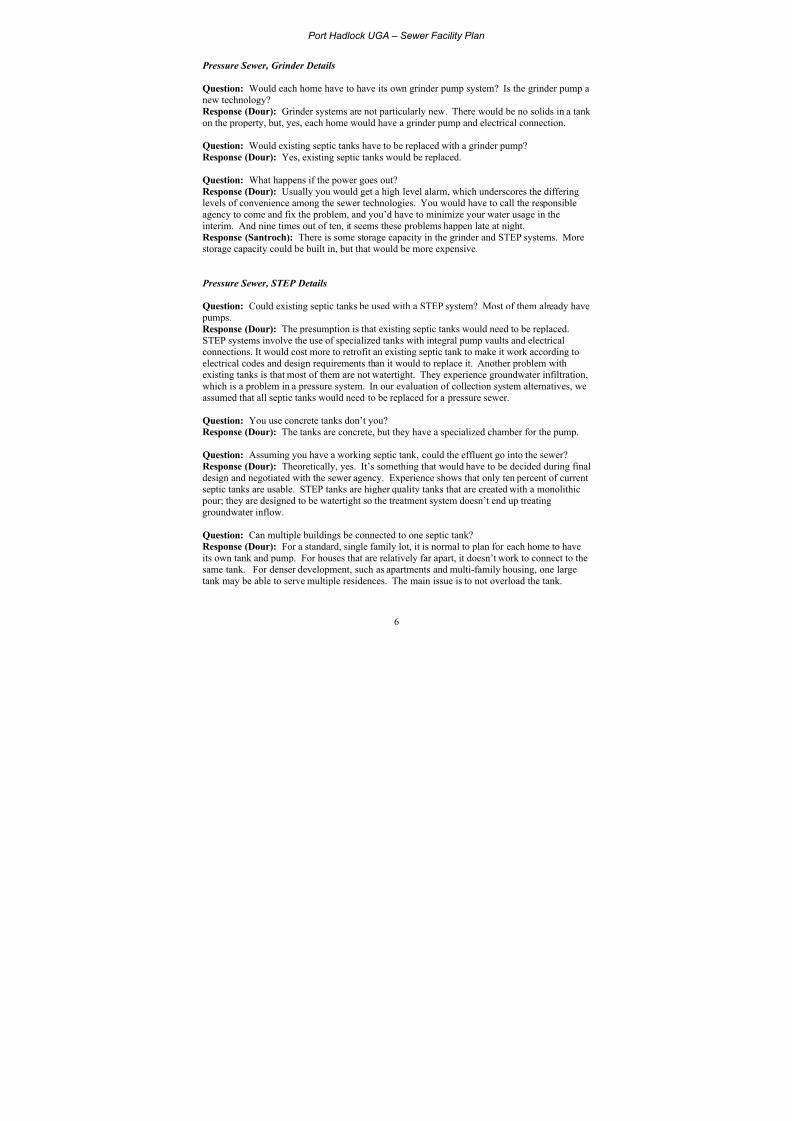
8/14/2019 Port Hadlock Sewer Facility Plan 0908
http://slidepdf.com/reader/full/port-hadlock-sewer-facility-plan-0908 248/387
Port Hadlock UGA – Sewer Facility Plan
6
Pressure Sewer, Grinder Details
Question: Would each home have to have its own grinder pump system? Is the grinder pump a
new technology?
Response (Dour): Grinder systems are not particularly new. There would be no solids in a tank
on the property, but, yes, each home would have a grinder pump and electrical connection.
Question: Would existing septic tanks have to be replaced with a grinder pump?
Response (Dour): Yes, existing septic tanks would be replaced.
Question: What happens if the power goes out?
Response (Dour): Usually you would get a high level alarm, which underscores the differinglevels of convenience among the sewer technologies. You would have to call the responsible
agency to come and fix the problem, and you’d have to minimize your water usage in the
interim. And nine times out of ten, it seems these problems happen late at night.
Response (Santroch): There is some storage capacity in the grinder and STEP systems. More
storage capacity could be built in, but that would be more expensive.
Pressure Sewer, STEP Details
Question: Could existing septic tanks be used with a STEP system? Most of them already have pumps.
Response (Dour): The presumption is that existing septic tanks would need to be replaced.
STEP systems involve the use of specialized tanks with integral pump vaults and electricalconnections. It would cost more to retrofit an existing septic tank to make it work according to
electrical codes and design requirements than it would to replace it. Another problem withexisting tanks is that most of them are not watertight. They experience groundwater infiltration,
which is a problem in a pressure system. In our evaluation of collection system alternatives, we
assumed that all septic tanks would need to be replaced for a pressure sewer.
Question: You use concrete tanks don’t you?
Response (Dour): The tanks are concrete, but they have a specialized chamber for the pump.
Question: Assuming you have a working septic tank, could the effluent go into the sewer?
Response (Dour): Theoretically, yes. It’s something that would have to be decided during final
design and negotiated with the sewer agency. Experience shows that only ten percent of currentseptic tanks are usable. STEP tanks are higher quality tanks that are created with a monolithic
pour; they are designed to be watertight so the treatment system doesn’t end up treating
groundwater inflow.
Question: Can multiple buildings be connected to one septic tank?
Response (Dour): For a standard, single family lot, it is normal to plan for each home to have
its own tank and pump. For houses that are relatively far apart, it doesn’t work to connect to thesame tank. For denser development, such as apartments and multi-family housing, one large
tank may be able to serve multiple residences. The main issue is to not overload the tank.

8/14/2019 Port Hadlock Sewer Facility Plan 0908
http://slidepdf.com/reader/full/port-hadlock-sewer-facility-plan-0908 249/387
Port Hadlock UGA – Sewer Facility Plan
7
If a STEP pressure sewer were implemented, we would look in detail at how buildings would beconnected. Looking at existing STEP pressure sewers, for example in Yelm and Montesano, the
rule of thumb is that single family homes have their own tank.
Sewer System Costs & Funding
Comment: From a property owner standpoint, once the sewer system is in, the value of your home goes up significantly when you’re ready to sell.
Question: Are your cost projections just for collection or do they include treatment also?Would there be a cost savings for treatment when using a STEP system?
Response (Dour): The cost projections are for collection only. Whether or not there is a cost
savings for treatment when using a STEP system depends on the situation. STEP involves lesssolids handling at the treatment plant, but there is decentralized solids handling. I can’t say what
the answer is in a general sense. An answer to this question will be discovered further into thestudy once we have developed an integrated collection, treatment, and disposal system.
Comment: Let people be aware that with a pressure system, property owners have to pay for the
electricity for the pump.
Comment: As a homeowner, I think that whatever system is put in, if people find out that it will
cost them several thousand dollars, they will fear that that the money has to be paid all up front.
I assume the costs will actually be amortized over time.
Response (Wheeler): Correct, and we will analyze what rates would actually be over time.
Question: I assume there may be some grant money available to build a sewer system. Are
there different funding levels based on the different sewer system alternatives?
Response (Wheeler): There are a number of grant sources that we’ll investigate. The member of our team who will research funding options is on the Washington State Public Works Board,
which is a source of low-interest loans. Each different grant source, such as the Centennial
Clean Water Fund, has different criteria. However, usually grants can be applied to public
portions of the sewer, but not for components on private property, such as septic tanks or grinder pumps. So in that regard, there may be some preference for a gravity sewer, which has more of
its costs tied up in public portions of the sewer. However, we still have to do more investigation.
Question: Are the costs of responding to maintenance calls borne by the whole system or by the
individual?
Response (Dour): The Department of Ecology says that it’s all part of the system, so thosecosts go into the rates.
Question: You broke implementation costs down by ERU. For those of us who are businesses
or agencies that use high volumes of water, are there other ways to do the breakdown so we canget a general idea of our potential costs?

8/14/2019 Port Hadlock Sewer Facility Plan 0908
http://slidepdf.com/reader/full/port-hadlock-sewer-facility-plan-0908 250/387

8/14/2019 Port Hadlock Sewer Facility Plan 0908
http://slidepdf.com/reader/full/port-hadlock-sewer-facility-plan-0908 251/387
Port Hadlock UGA – Sewer Facility Plan
9
Cost Methodology
Comment: If you find the total cost, and then use the discount rate to come up with a
discounted number, you’ll have the absolute present value.
Response (Dour): Yes, that’s what we did.
Comment: Earlier you identified that the gravity sewer system is a lot longer-lived than a
pressure system. In comparing the implementation costs of the three alternatives, it appears you
are assuming the same overall service life of each of the three alternatives. It bothers me in away, that it will mislead people into thinking that these systems will last only 20 years.
Response (Dour): That is a good point. Gravity could probably last 50 years. This analysis
looks at a 20 year time span for comparison purposes, because of the 20-year planning boundaryand because septics and pumps have to be replaced after about 20 years.
Pressure sewers can be viewed as a “starter kit” for a sewer system: after 20 years when the areais more densely populated and there are more people to pay, the system can be replaced with a
gravity sewer. It is good to be aware that gravity lasts longer, but pressure may be all that acommunity can afford today. Pressure will work, but people must be aware that it’s a pay-as-
you-go system and it is less convenient because of ongoing maintenance.
Question: If you did a 30- or 40-year timeline, would the STEP lines (implementation costs) be
a lot taller?
Response (Dour): Basically yes. It still comes down to an ability to launch or not.
Environmental Considerations
Comment: I’d like to remind everyone that much effort has gone into caring for Chimacum
Creek over the years. There is a lot of groundwater recharge from septic systems that seems to
be somewhat indicative of a high return flow to the creek. If we are looking at a sewer systemthat will, in effect, take groundwater recharge away, there will be consequences for the creek.
In this vicinity, there seem to be at least two stacked aquifers. The PUD’s belief from testing
over time and working two wells is that very little, if any, of the recharge from septic reaches thelower aquifer, but it’s highly likely, although I’m not a hydrogeologist, that some of the recharge
gets to the upper aquifer. I’m not saying we should use one system over another, but it tells you
that there is an ecological advantage to having septic systems here.
Response (Dour): We do have a geologist on the consultant team, and we are looking at how to
dispose of treated wastewater. Disposal will probably not be an outfall into the bay, and it may be some kind of distribution system, so the sewer system may not necessarily remove the
recharge to groundwater. However, our analysis of disposal options is very preliminary and our
options may change.

8/14/2019 Port Hadlock Sewer Facility Plan 0908
http://slidepdf.com/reader/full/port-hadlock-sewer-facility-plan-0908 252/387
Port Hadlock UGA – Sewer Facility Plan
10
Water Reuse
Question: Have you thought about separating gray water and wastewater? The state PUD
association is working on that.
Response (Dour): It’s a big topic at the Washington Association of Water and Sewer Districts.
This is not something we have considered at this point in the analysis. We will take a preliminarylook at this option to see if there is any viability.
Question: Does either pressure or gravity have an advantage in separating gray water andwastewater?
Response (Dour): You would have to replumb the house to separate black and gray water. For
pressure, black water would go into the septic tank or grinder, so a pump vault and control panelwould still be necessary. It might mean a smaller septic tank on the property, but in the grand
scheme, with all of the components involved, I don’t see a major cost shift.
For gravity, it could change the ability to convey solids, so it may affect the level of
infrastructure needed. If you were just doing gray water recharge, and there were no costconsiderations, a pressure system would be better.
Question: Is it easier to separate black water from gray water in new construction?
Response (Dour): Yes.
Comment: We need to consider that at this stage, we have the chance to do things from scratch.
In 50 years, plain water will be a precious thing. If we don’t plan to reuse water now, our
descendants will wonder why we didn’t do it right the first time, when the ecological cost of doing things over is high.
Comment: I don’t think gray water is that clean to begin with: we can’t guarantee what’s going
down the gray water system. If we’re doing treatment, we might as well treat gray water, too,
and then let it infiltrate.
Comment: I agree, but reclamation has to be part of the plan from the beginning.
Response (Santroch): To be honest, disposal via an outfall seems unlikely, so we will be
looking at alternative methods of disposing of treated water, such as infiltration.
Implementation of Sewer Plan
Question: I have a 25-year old septic system, and many other people are similar. What is its
life expectancy?
Response (Dour): It is probably in its golden years.
Question: If you live in an outlying area and your septic fails next year, what should you do?
Response (Dour): You would need to replace the septic system. But this is getting ahead of where we are, down to how a sewer system would be implemented. There are policies that
would need to be in place. For example, maybe if the sewer line is adjacent to your home, you

8/14/2019 Port Hadlock Sewer Facility Plan 0908
http://slidepdf.com/reader/full/port-hadlock-sewer-facility-plan-0908 253/387

8/14/2019 Port Hadlock Sewer Facility Plan 0908
http://slidepdf.com/reader/full/port-hadlock-sewer-facility-plan-0908 254/387
Port Hadlock UGA – Sewer Facility Plan
12
Comment: The Olympia example demonstrates that gravity provides more flexibility than
STEP. STEP is affecting Olympia’s ability to grow.
Comment: I, Mike Regan, representing Irondale Community Action Neighbors, would like to
say that the gravity system seems preferable by far, even without seeing the 50-year cost
projection. This discussion seems to say for many reasons that gravity has more advantages.One important thing is that with gravity the cost to the individual of putting in tanks, pumps, etc.
is smaller, especially since those are costs that grants won’t cover.
Comment: I would like to courteously disagree that a combined system is best. It is a case of
pay me now for gravity, or pay me twice for pressure, and the next time comes soon. I would
also reinforce the comments about reuse or gray water reuse. I would hope a good part of theconsultants’ analysis is on reuse. There seems to be a growing consensus for ecology and health
that we need reuse. There is a big, untapped Saudi Arabia of water in once-used water. Now
may not be the best time, because the consensus may not be strong enough yet, but theconsultants need to keep alert to that movement.
Comment: Since the PUD may very well operate the sewer system, we need to try to think hard
about the total out-of-pocket cost each month, including power costs, considering our public.The locality doesn’t have control over outside power coming in.
Action Item
Several workshop participants urged the consultant to prepare a 50-year cost estimate for thethree collection system alternatives, noting that it would show that gravity was a better value in
the long term. The consultant agreed to do so.
Next Steps and Wrap Up
Mr. Wheeler encouraged all of the workshop participants to sign the sign-in sheet and to indicate
whether they wanted to receive periodic project updates. He noted that another stakeholder
workshop would be held in about two months. In response to a request, Mr. Dour agreed to sendthe PowerPoint presentation to Frank Gifford, the Jefferson County Director of Public Works,
who would distribute it to interested parties. Commissioner David Sullivan thanked the participants for attending, noting that their perspectives were helpful.
Mr. Wheeler adjourned the workshop at 12:10 pm.
ACTION ITEM: The consultant will prepare a 50-year cost projection to compare
the three collection system alternatives.

8/14/2019 Port Hadlock Sewer Facility Plan 0908
http://slidepdf.com/reader/full/port-hadlock-sewer-facility-plan-0908 255/387

8/14/2019 Port Hadlock Sewer Facility Plan 0908
http://slidepdf.com/reader/full/port-hadlock-sewer-facility-plan-0908 256/387

8/14/2019 Port Hadlock Sewer Facility Plan 0908
http://slidepdf.com/reader/full/port-hadlock-sewer-facility-plan-0908 257/387
Port Hadlock UGA – Sewer Facility Plan
SUMMARYStakeholder Workshop on Treatment and Discharge
(Stakeholder Workshop #2)
May 25, 2006, 1 PM – 3 PM1820 Jefferson Street
Port Townsend, WA 98368-0920
In response to the 1990 Growth Management Act (GMA), Jefferson County pursued thedesignation of an Urban Growth Area (UGA) in the Irondale/Port Hadlock area. As part of therequirements for establishing a UGA, Jefferson County is conducting a study of alternatives for developing a sewer system. There are currently no sewer facilities in the area, and existingresidences and businesses are served by on-site treatment and disposal (septic) systems.
The sewer study will enable the County to identify 1) the final preferred alternative or method of collection, treatment, and disposal of wastewater, 2) the service area, 3) the phasing of
implementation of sewers throughout the service area, 4) the cost for individual connections tosewer, and 5) revenue sources. The goal of the study is to produce a comprehensive sewer planthat will help the County plan for growth in the area over the next 20 years; that will satisfyRCW 36.94 concerning County’s sewerage, water, and drainage system responsibilities; and thatwill be approved by the Department of Ecology.
Workshop Summary
A stakeholder workshop was held at the Jefferson County Courthouse on Thursday, May 25from 1:00 pm to 3:00 pm. The workshop was open to the public.
The purpose of the workshop was to:
• Present discharge and treatment alternatives
• Review advantages and drawbacks of each alternative
• Take questions and comments
• Identify preferences for a discharge system and a treatment system
Jefferson County Commissioners, County staff, local agency staff, and several communityleaders were invited to the workshop. The County had identified local agencies whose facilitiesmight be sewered and/or whose activities might be affected by the installation or operation of asewer. The County also identified representatives of business and community organizations andcitizens who had been active previously in the process to establish a UGA. These parties werecontacted by mail. A notice of the workshop was available on the project website(www.porthadlocksewer.org), the County’s website, and in the Port Townsend Leader.
County Commissioner David Sullivan (District 2) attended the workshop. The consultants to theCounty were represented by Kevin Dour, P.E. and Jim Santroch, P.E. of TetraTech/KCM and

8/14/2019 Port Hadlock Sewer Facility Plan 0908
http://slidepdf.com/reader/full/port-hadlock-sewer-facility-plan-0908 258/387

8/14/2019 Port Hadlock Sewer Facility Plan 0908
http://slidepdf.com/reader/full/port-hadlock-sewer-facility-plan-0908 259/387
Port Hadlock UGA – Sewer Facility Plan
3
Attendees had asked about the feasibility of separating gray water out before it entered the sewer system. Mr. Dour reported that key points on gray water separation included:
• Less water in the sewer system impacts system design parameters. For example, mostgravity collection systems are designed for a certain amount of water to wash solids down
the pipes. Removing gray water might generate a need to build steeper gravity collection pipes in order to keep solids moving, which would need to be constructed deeper and thuscost more.
• Plumbing retrofits would be required in existing homes in order to separate gray water from black water systems (water from toilets).
• Sending gray water to a wastewater treatment plant for treatment could help prevent graywater from possibly degrading groundwater supplies.
• A septic tank and drainfield would need to be maintained for gray water separation.
• Gray water separation as a means to recharge groundwater may be redundant if land-baseddisposal is selected for the treated plant effluent.
Discharge Alternatives
Mr. Dour presented the discharge alternatives for the Port Hadlock UGA sewer system, reviewedthe advantages and drawbacks of each alternative, and identified the short-list of alternatives thatwere still under consideration. Key points of the presentation are summarized below.
Mr. Dour explained that there were two basic types of discharge: marine outfall and land-basedapplication. He reiterated that the discharge method would determine the level of wastewater treatment required. He said that for a marine outfall, secondary wastewater treatment wassometimes acceptable, although regulators could require advanced (tertiary) treatment depending
on the circumstances. He said advanced treatment was almost always required for land-baseddisposal.
Mr. Dour described the discharge alternatives that had been considered and noted the advantagesand drawbacks of each one. He said the alternatives had been reviewed and narrowed to aninitial short-list for further evaluation. He noted that a key consideration for land-based disposaloptions was the rate at which effluent could be applied, and therefore the amount of landrequired. He also explained that each option may require a certain amount of wastewater storagecapacity as a precaution for wet weather storage, depending upon the acceptance rate of the soil.The short-list of alternatives included:
1. Marine outfall2. Irrigation at agronomic rates
a. Irrigation at agronomic rates entails applying a level of effluent such that the plantcover can use all of the water and metabolize all of the nutrients.
3. Groundwater recharge: slow-rate infiltrationa. Not an agronomic rate – the ground is used as a means of disposal b. Effluent is applied at a rate that allows it to percolate through the soil lens before
entering groundwater

8/14/2019 Port Hadlock Sewer Facility Plan 0908
http://slidepdf.com/reader/full/port-hadlock-sewer-facility-plan-0908 260/387
Port Hadlock UGA – Sewer Facility Plan
4
c. Effluent can be applied at the surface or subsurface. Subsurface application may be considered due to site considerations such as ponding potential, therebyminimizing potential for human contact. If effluent is applied subsurface, for example six inches underground, a higher level of treatment is required.
4. Groundwater recharge: rapid-rate infiltration
a.
Effluent disposal in leaky bottom ponds similar to stormwater ponds. b. Effluent is applied at a rate that allows it to percolate through the soil lens beforeentering groundwater
5. Constructed wetlandsa. Plants use nitrogen as effluent moves through wetland b. Water used for habitatc. Outflow can go into rapid infiltration ponds or straight into a stream or other
water bodyd. This method often used for polishing rather than treatment
Advantages and Drawbacks of Short-Listed Discharge Alternatives
Advantages Drawbacks
Marine Outfall
• Less storage required
• Reliability during wet season
• Less land required
• Creates shellfish closure zone/mightimpact use of public beaches
• Habitat impacts to marine environment
• Additional studies would be required
• Regulatory requirements may become
stricter over time/getting permit isuncertain
• Public acceptance
Irrigation at Agronomic Rates
• Fewest regulatory issues
• Range of uses (forests, grasses, crops)
• Can be implemented in or near sewer planning area
• Largest land area required
• Effluent must be stored during wet months
• Largest storage area required
• Potential for human contact with effluent
Slow-Rate Infiltration
• Minimizes potential for human contactwith effluent
• Provides groundwater recharge
• Relatively large land area required• Regulatory considerations (sub-surface
spreading vs. surface spreading, aquifer protection)
Rapid Infiltration
• Least land area required for land-based • Regulatory considerations (aquifer
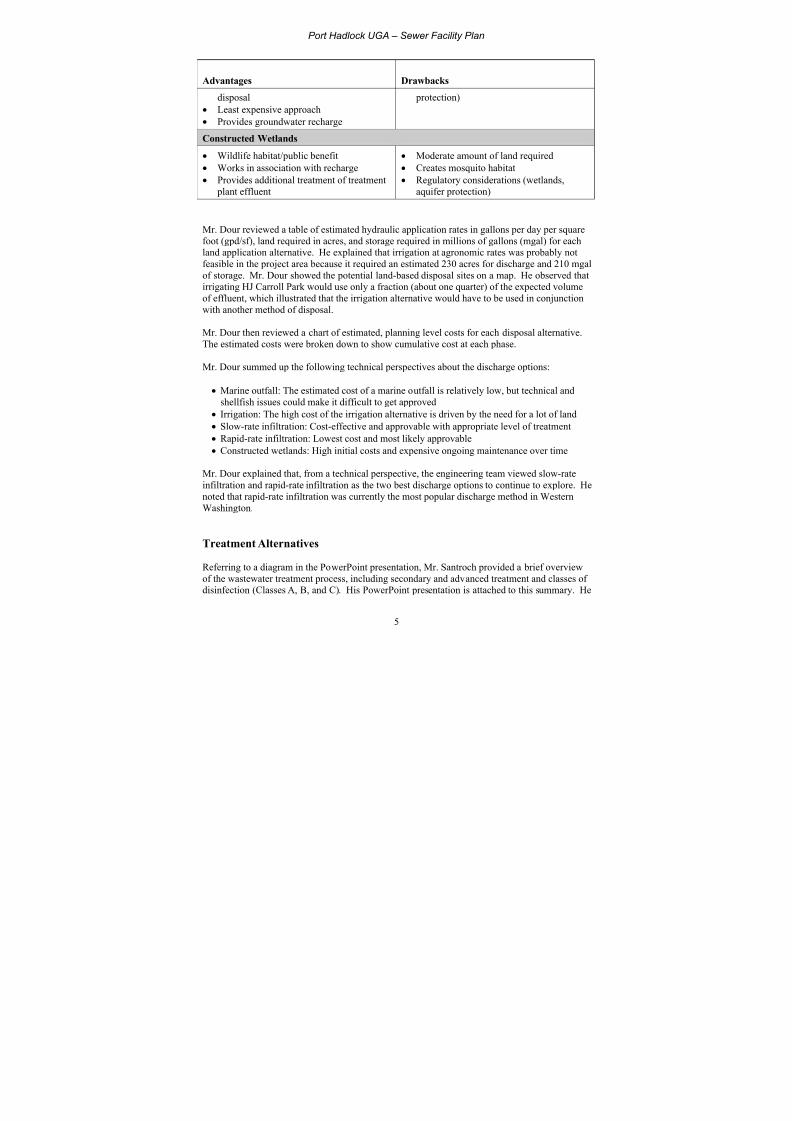
8/14/2019 Port Hadlock Sewer Facility Plan 0908
http://slidepdf.com/reader/full/port-hadlock-sewer-facility-plan-0908 261/387
Port Hadlock UGA – Sewer Facility Plan
5
Advantages Drawbacks
disposal
• Least expensive approach
• Provides groundwater recharge
protection)
Constructed Wetlands
• Wildlife habitat/public benefit
• Works in association with recharge
• Provides additional treatment of treatment plant effluent
• Moderate amount of land required
• Creates mosquito habitat
• Regulatory considerations (wetlands,aquifer protection)
Mr. Dour reviewed a table of estimated hydraulic application rates in gallons per day per squarefoot (gpd/sf), land required in acres, and storage required in millions of gallons (mgal) for each
land application alternative. He explained that irrigation at agronomic rates was probably notfeasible in the project area because it required an estimated 230 acres for discharge and 210 mgalof storage. Mr. Dour showed the potential land-based disposal sites on a map. He observed thatirrigating HJ Carroll Park would use only a fraction (about one quarter) of the expected volumeof effluent, which illustrated that the irrigation alternative would have to be used in conjunctionwith another method of disposal.
Mr. Dour then reviewed a chart of estimated, planning level costs for each disposal alternative.The estimated costs were broken down to show cumulative cost at each phase.
Mr. Dour summed up the following technical perspectives about the discharge options:
• Marine outfall: The estimated cost of a marine outfall is relatively low, but technical andshellfish issues could make it difficult to get approved
• Irrigation: The high cost of the irrigation alternative is driven by the need for a lot of land
• Slow-rate infiltration: Cost-effective and approvable with appropriate level of treatment
• Rapid-rate infiltration: Lowest cost and most likely approvable
• Constructed wetlands: High initial costs and expensive ongoing maintenance over time
Mr. Dour explained that, from a technical perspective, the engineering team viewed slow-rateinfiltration and rapid-rate infiltration as the two best discharge options to continue to explore. Henoted that rapid-rate infiltration was currently the most popular discharge method in Western
Washington.
Treatment Alternatives
Referring to a diagram in the PowerPoint presentation, Mr. Santroch provided a brief overviewof the wastewater treatment process, including secondary and advanced treatment and classes of disinfection (Classes A, B, and C). His PowerPoint presentation is attached to this summary. He

8/14/2019 Port Hadlock Sewer Facility Plan 0908
http://slidepdf.com/reader/full/port-hadlock-sewer-facility-plan-0908 262/387
Port Hadlock UGA – Sewer Facility Plan
6
noted that advanced treatment did not produce effluent of drinking water quality. He said thatwhere water shortages existed, such as in California and Arizona, treatment plant effluent fromadvanced processes was stored for a year and then applied to groundwater before it was pulledout for consumption. He said that advanced effluent with Class A disinfection was, however,designated as public contact water and could be used on golf courses and in swimming lakes.
Mr. Santroch reiterated the point that the discharge method selected would determine the level of treatment required. He reviewed a table that correlated the discharge options that had been presented with the level of treatment that each required, either secondary or advanced.Advanced treatment was required for both of the discharge alternatives that the engineering teamthought were viable, slow-rate infiltration and rapid-rate infiltration. Mr. Santroch noted thatadvanced treatment would likely be required by the permitting agencies for a marine outfall aswell, because of shellfish issues.
Mr. Santroch described the treatment alternatives that had been considered and noted theadvantages and drawbacks of each one. He said a key consideration was the ability to build the
treatment system in phases, since the system would be expanded as demand grew over time. Hesaid the alternatives had been reviewed and narrowed to an initial short-list for further evaluation. The short-list consisted of advanced treatment options and included:
1. Oxidation ditch & filter 2. Sequencing batch reactor & filter (SBR)3. Membrane treatment (the newest technology)
Advantages and Drawbacks of Short-Listed Discharge Alternatives
Advantages Drawbacks
Oxidation Ditch & Filter
• Tried and true
• Moderate cost
• More difficult to phase
• High initial costs
• Good, but not best, effluent quality
Sequencing Batch Reactor & Filter
• Moderate cost
• Relatively easy to phase
• Good, but not best, effluent quality
Membrane Treatment
• Best effluent qualityo Removes trace organic materialo Thought to be best at removing
pharmaceuticals
• Easiest to phase
• Higher cost

8/14/2019 Port Hadlock Sewer Facility Plan 0908
http://slidepdf.com/reader/full/port-hadlock-sewer-facility-plan-0908 263/387

8/14/2019 Port Hadlock Sewer Facility Plan 0908
http://slidepdf.com/reader/full/port-hadlock-sewer-facility-plan-0908 264/387
Port Hadlock UGA – Sewer Facility Plan
8
Membrane treatment
• Comparable to SBR – can build 1/4 or 1/8 of 2030 capacity at start
• System is composed of basic boxes that are always useful at a treatment plant
• Question is how small to build the initial modules so that it makes sense to add on later
Cost Estimates
Mr. Santroch reviewed a chart of estimated costs for the three treatment technologies. The costswere broken down to show cumulative cost at each phase. He pointed out that the oxidationditch and filter technology could be cost effective if much of the long-term capacity needed were built upfront. However, he said it could be difficult to launch when starting with no sewer system in place because of the high upfront costs.
The estimated costs for the membrane system were the highest. Mr. Santroch noted that sincethe technology was new, the industry had not settled out yet, so the actual costs could be a bithigher than shown. He explained that the membranes have to be replaced every 7-10 years and
that the technology uses 50% more energy than the other options because of the energy to cleanthe membranes.
Technical Perspectives
Mr. Santroch reviewed a table of criteria including qualitative and cost differences used tocompare the three wastewater treatment technologies. He highlighted the inherent uncertaintyabout whether regulators would require effluent quality studies for any of the technologies andabout which technologies could win regulatory approval. He said that one challenge of sewer planning was to balance effluent quality, regulatory requirements, and costs. He said that the project team would meet with a representative of the Department of Ecology in June to learn
more about the treatment technologies considered appropriate for the Port Hadlock area.
Mr. Santroch summed up the following technical perspectives about the treatment options:
• Oxidation ditch & filter: Good effluent quality but difficult to phase and high initial costs
• Sequencing batch reactor & filter: Good effluent quality and easy to phase
• Membrane treatment: Best effluent quality, easy to phase, but potentially high cost
Mr. Santroch explained that, from a technical perspective, the engineering team viewedmembrane treatment as the most viable alternative based on its excellent effluent quality andease of phasing. He said that the less costly sequencing batch reaction & filter alternative was
considered potentially viable, but that the team would need to investigate whether its effluentquality was acceptable to regulators and the community. He said that the oxidation ditch & filter alternative would be very difficult to launch unless a source of funding could be found for theupfront cost.

8/14/2019 Port Hadlock Sewer Facility Plan 0908
http://slidepdf.com/reader/full/port-hadlock-sewer-facility-plan-0908 265/387
Port Hadlock UGA – Sewer Facility Plan
9
Disinfection
Mr. Santroch briefly described the alternative methods for disinfecting wastewater effluent, arequired element of the advanced treatment process. The two short-listed alternatives under consideration were:
• Liquid sodium hypochlorite (chlorine)
• Ultraviolet (UV) disinfection
Mr. Santroch said that UV disinfection was required for marine outfall disposal but not for landapplication. He said that the engineering team favored the less costly liquid sodium hypochloritealternative. Additionally, a chlorine residual would be required should treatment plant effluent be used for beneficial reuse such as irrigation.
Solids Disposal
Mr. Santroch provided a brief overview of the options for solids disposal and said the topicwould be addressed in more detail at the next workshop. He said that the Port TownsendBiosolids/Composting Facility seemed to be a good candidate site for disposing of solids. Other options included hauling solids to sites in Mason County, Kitsap County, or King County, or applying the solids to forestland.
Treatment Plant Siting Considerations
Mr. Santroch described the considerations that went into siting a treatment plant. These includedodors, aesthetics, costs, and space for buffer zones. He said that siting was sometimes acontentious process and that the project team was carefully considering ways to minimize the
impact of a treatment system to the community. He explained that odors and noise could becontrolled and the facility’s appearance could be integrated with the surrounding area, but thatodor and aesthetic mitigation could add 20% to 100% to the cost of the treatment plant. Henoted that sites closer to developed areas required more mitigation. He explained that theultimate decision about odor and aesthetic mitigation would be determined by community preference and cost.
Questions & Comments
Workshop participants commented and asked questions during the presentation and during the
discussion period at the end of the workshop. Their comments and questions, as well as the project team’s responses, are grouped by topic below.
Disposal Alternatives
Question: Did you consider using the Indian Island marine outfall for disposal?

8/14/2019 Port Hadlock Sewer Facility Plan 0908
http://slidepdf.com/reader/full/port-hadlock-sewer-facility-plan-0908 266/387
Port Hadlock UGA – Sewer Facility Plan
10
Response (Dour): We did not look closely at that option because of the extremely high cost to pump effluent to Indian Island. Also, the Indian Island outfall is permitted for a certain volumeof effluent, and it might need to be re-permitted to accommodate additional flow from PortHadlock. Alternatively, the permit might limit the amount of effluent that the Port Hadlock UGA sewer facility would be able to produce.
Question: Did you consider the impact of the Indian Island outfall on the ability to site a newmarine outfall?Response (Dour): It would be necessary to conduct many studies to determine the potentialimpact of the Indian Island outfall. In particular, the existing fecal coliform count in PortTownsend bay attributable to the Indian Island outfall might impact the size of the shellfishclosure zone required for a new Port Hadlock outfall.
Question: Are these fecal coliform exposure levels a problem for the shellfish or for the peoplewho consume the shellfish?Response (Dour): My understanding is that the risk is to humans who consume shellfish. If the
contaminant is removed from the environment, the shellfish will eventually metabolize thecontaminants that remain in their bodies.
Question: How recently has an outfall been permitted in Puget Sound?Response (Santroch): I’m not certain, but the regulatory community has been raising the bar for approval of small systems like this one. It was very difficult for Vashon Island to get permission to extend an existing outfall, and Island County chose not to explore a marine outfallfor its new treatment plant because it considered approval extremely unlikely. However, theregulatory community has been less strict about siting new marine outfalls in south Puget Sound.
Question: If tertiary treatment were used, would a marine outfall still cause shellfish issues?Response (Dour): Yes, although as shown on the map, the shellfish closure zone would presumably be smaller with tertiary rather than secondary treatment. Permitting could still be achallenge even with tertiary treatment.
Question: Will tertiary treatment be necessary regardless of the disposal option selected?Response (Dour): We believe that is the case.
Comment: I would like to see further consideration of the marine outfall disposal option. Itseems like a potentially viable, lower cost alternative.Response (Dour): If there is interest, we will look into it further.Response (Santroch): I would caution that, although a marine outfall is the traditionaldischarge method, the engineering team thinks it is an unlikely option for this project because of the need for a shellfish closure zone. A Department of Health official indicated to us that amarine outfall could potentially be permitted, but that with the most advanced membranetreatment plant a shellfish closure zone with a minimum radius of 900 feet would be required andthat extensive studies would be required to determine the impacts.

8/14/2019 Port Hadlock Sewer Facility Plan 0908
http://slidepdf.com/reader/full/port-hadlock-sewer-facility-plan-0908 267/387
Port Hadlock UGA – Sewer Facility Plan
11
Question: Have you looked at combinations of disposal options, such as slow-rate infiltrationcombined with constructed wetlands? Wetlands are of strategic importance to the EPA, soincluding wetlands may open up some federal funding.Response (Dour): We have not considered that, although it might be possible. We will haveour financial specialist look into that kind of funding.
Disposal – Recharge/Reuse Issues
Question: Have you looked at the direction of groundwater flow?Response (Santroch): We will look at that more closely as we move forward.
Comment: If disposal were at the site near the elementary school and airstrip, the effluentwould flow away from Chimacum Creek rather than providing recharge.Response (Wheeler): As we understand it, discharge from that site would flow in the directionof the creek. If that site were selected, we would investigate the issue further.
Comment: Recharge is very important. We need to put as much clean water back in the groundas possible. A study by the U.S. Geological Survey showed groundwater flow from the east sideof Chimacum Creek towards the bay, so I am very concerned that discharge east of the creek would not recharge the creek.Response (Dour): We will investigate that further.
Comment: The potential disposal site near Cotton Redi-Mix is only a few feet higher than thecreek and the wetlands adjacent to the creek. The selection of a disposal site will depend on theresults of specific hydrogeological studies.
Question: How do areas with gravel lenses that accept water very quickly influence the level of treatment that is required? Do some areas accept water so quickly that they cannot be used for discharge?Response (Dour): Either those areas cannot be used or the effluent must be treated to a veryadvanced degree.Response (Santroch): The question of how quickly to allow effluent into the ground isimportant. It will be addressed at our meeting with the Department of Ecology in June. Water reuse is still relatively new in Washington. It was approved in 1997 and there have been roughly6-10 projects in the state. The regulations are still evolving, so there is a lot of room for negotiation with regulators. We recently did a disposal study for Island County where the soil istight, glacial till that accepts water slowly. In that instance, rapid-rate infiltration was notfeasible, but slow-rate infiltration was a good option. Here in the Irondale/Port Hadlock area,rapid-rate infiltration is being considered because of the high acceptance rate of the soil, but theregulatory community will ultimately determine what is acceptable.
Question: Can you discharge membrane-treated effluent to a lake?Response (Santroch): Discharging to a lake is possible with very advanced treatmentrequirements, but such an approach is unlikely due to environmental, regulatory, and costconcerns.

8/14/2019 Port Hadlock Sewer Facility Plan 0908
http://slidepdf.com/reader/full/port-hadlock-sewer-facility-plan-0908 268/387
Port Hadlock UGA – Sewer Facility Plan
12
Question: Could the County buy a lake, like Peterson Lake at the headwaters of ChimacumCreek, and discharge to the lake to recharge the creek?Response (Santroch): Peterson Lake is uphill and far from the sewer planning area, so the costof the sewer system would increase. Discharging effluent would promote eutrophication of thelake, because some amount of nitrogen and phosphorous will be present. It is possible to remove
all of those nutrients, but it is expensive.
Comment: For disposal siting, it may be important to take existing and potential future wellsinto account.
Comment: If there are levels of toxics that are not detectable, but can still be harmful, maybe its best to move discharge away from drinking water sources. Perhaps a marine outfall is a better option.Response (Dour): Right now, the septic tanks in the area discharging out of drainfields togroundwater. The treatment technologies proposed here would remove more toxics than areremoved now.
Comment: Even if more toxics are removed, the speed at which infiltration would occur is animportant factor to consider.
Comment: John Cambalik at the Puget Sound Action Team has some data about the effect of septage on water quality in Port Hadlock.Response (Dour): That kind of information could improve our ability to get funding. We willtry to get it from him.
Treatment Alternatives
Question: Does membrane treatment technology produce drinking water?Response (Santroch): The kind of membrane technology used for sewage treatment does not produce drinking water-quality effluent. Membrane technology is used in drinking water treatment, but nobody goes straight from wastewater treatment to drinking water, as far as Iknow.
Question: What kind of treatment removes pharmaceuticals from wastewater?Response (Santroch): That is a cutting edge question. There are no definitive answers yet, butmembrane technology is thought to do a better job of removing pharmaceuticals than other technologies. Membrane technology is very much in favor with regulatory agencies because itremoves trace organic material and pathogenic bacteria.
Question: You said that the oxidation ditch & filter alternative worked well for small treatmentsystems. Can you quantify small?Response (Santroch): That technology can handle an upper limit of about 5 million gallons per day (MGD).
Question: Where has phased construction of a treatment plant been done successfully? Wherehas a treatment plant started small and expanded to a target size?

8/14/2019 Port Hadlock Sewer Facility Plan 0908
http://slidepdf.com/reader/full/port-hadlock-sewer-facility-plan-0908 269/387
Port Hadlock UGA – Sewer Facility Plan
13
Response (Santroch): The engineer has to design the system to be easy to expand. Existingtreatment plants that can be expanded are between 10 and 15 years old, so they haven’t had toexpand yet. Kingston has a system that is similar to the kind proposed here. Also, in a UGAsimilar to the one here, Thurston County put in a single oxidation ditch and two clarifiers. TheCounty fronted the cost for the excess capacity, which is being paid off by latecomers. In
another location, two ditches and two clarifiers were installed, but the regulatory community paid for the redundant set because they were nervous about the risks of having only onetreatment path. I don’t know of any SBR systems that have had to expand yet.
Question: If we started with SBR, and the membrane technology became preferred over time,could we mix and match the technologies?Response (Santroch): Yes. The deep square tanks that are used with SBR and membranetechnologies are always useful in a treatment plant setting.
Question: Would it be feasible to start with a small membrane system with a cost of $5-6million?
Response (Santroch): Yes, absolutely. It’s just a matter of how large the tanks are and howmany you will need in the end. The largest standard membrane tank size handles 100,000gallons per day. Some tanks are steel, and the bigger ones are concrete. If you wanted, youcould build a treatment facility over time with many small steel tanks that would need to bereplaced in 20 years.
Question: Is ozone an option for disinfection?Response (Santroch): Ozone was used around 1980, but it did not work well. The energy costsare high, and ozone is an unstable, reactive, and dangerous substance.Response (Wheeler): Ozone disinfection is used in potable water systems and fish hatcheries.The costs and practicalities simply have not worked well with sewage treatment.
Question: Does membrane treatment control odor better?Response (Santroch): The risk of odor is equivalent for all three technologies.
Population & Flow Rate Projections
Question: What percentage rate did the County use for its population projections?Response (Santroch): I’m not sure exactly, but it’s a couple of percent. It’s the County’s GMA projection figure.
Question: Why do you expect groundwater to leak into the sewer pipes?Response (Santroch): Infiltration is a common phenomenon. Pipe joints, manhole lids, andother components leak. Pipes underneath people’s houses leak.Response (Wheeler): We have assumed some level of infiltration and inflow. Inflow can befrom illegal hook-ups from roof drains, for example, or from a maintenance hole that is too low.As good as the engineering standards are these days, infiltration and inflow still happens.
Question: What happens in an area that doesn’t have a stormwater system?

8/14/2019 Port Hadlock Sewer Facility Plan 0908
http://slidepdf.com/reader/full/port-hadlock-sewer-facility-plan-0908 270/387
Port Hadlock UGA – Sewer Facility Plan
14
Response (Wheeler): Inspectors don’t know what happens on private property sometimes.Some people will have stormwater problems, and they may dump in the sewer.Response (Santroch): The good news is that current water use in the core planning area isapproximately 50,000 gallons per day and we wouldn’t expect to see 95,000 gallons per day because of infiltration and inflow during the first rainy season. Sewers deteriorate over time. If
your system is tight, you might need a smaller treatment facility. In addition, our numbers are based on the assumption that the sewer lines are in the groundwater area. But our hydrogeologistsaid that the water table here is relatively low, so our flow estimates may be too conservative.There is a fair chance that the flow would not reach the high end of our estimates, but if we makethat assumption, there is a risk of building the treatment plant too small. It is also uncertain howquickly this community will grow.
Question: Who is your hydrogeologist?Response (Santroch): Arnie Sugar with HWA is on our team.
Question: Many municipalities have problems with combined sewer overflows. How will that
be dealt with here?Response (Santroch): This is not a combined system; it does not include stormwater.Question: What about the influence of infiltration and inflow?Response (Santroch): We have increased our estimates of treatment plant capacity by a factor of about two to account for infiltration and inflow. In a combined system, that could be a factor of four or five. This will be a sanitary system in Port Hadlock.Response (Wheeler): Although a few people will probably put stormwater into the sewer illegally, it will not happen throughout the whole system. Usually this kind of a system does notexperience combined system overflows. Over time, however, infiltration and inflow problemsmight develop.
Comment: The Port Hadlock UGA stormwater plan is based on a minimal need to managestormwater because the soils absorb so well. That is not to say that problem areas don’t exist or that they won’t increase as impervious surface area increases.
Comment: I’m concerned about creating a surface water problem because water is being lost tothe sewer pipes.Response (Santroch): The amount of water that infiltrates is a tiny fraction; it’s to about thefourth decimal place.
Question: Is there a risk of wastewater leaking out of pressurized pipes into the ground?Response (Santroch): Yes, that is a risk. It should be noted that public pipes tend to leak muchless than pipes on private property.
Next Steps and Wrap Up
Mr. Wheeler stated that the attendees seemed to prefer the two infiltration options for disposal,with some interest in a marine outfall. He said that the attendees also seemed to agree that themembrane technology was of interest for treatment, but that the sequencing batch reactor & filter

8/14/2019 Port Hadlock Sewer Facility Plan 0908
http://slidepdf.com/reader/full/port-hadlock-sewer-facility-plan-0908 271/387
Port Hadlock UGA – Sewer Facility Plan
15
alternative should be further explored. The attendees agreed that these were their preferences.One participant said that the oxidation ditch & filter treatment alternative would be of interest if someone would front the cost.
Mr. Wheeler noted that the next stakeholder workshop that would focus on combined
alternatives of wastewater collection, treatment, and disposal would be held on June 22.
The meeting was adjourned at 3:10 pm.
Workshop Attendance
The stakeholder workshop was attended by County Commissioner David Sullivan (District 2).Additional attendees are listed below.
Name Affiliation
Nancy Dorgan CitizenCraig Durgan CitizenJohn Fischbach Jefferson County, County Administrator Frank Gifford Jefferson County, Public WorksAlan Goodwin Citizens for the UGA/Community United Methodist ChurchElaine Goodwin Citizens for the UGA/Community United Methodist ChurchPaula Mackrow North Olympic Salmon CoalitionJim Parker Jefferson PUD #1Jim Pivarnik Port of Port TownsendMike Regan Irondale Community Action NeighborsRay Serebrin Jefferson County Library
Jim Strong Hadlock Building SupplyTroy Summerill Inn at Port Hadlock
Consultant Team Staff in Attendance
TetraTech/KCM
Kevin Dour, Project Manager; Jim Santroch, Senior Project Engineer – Treatment
Triangle Associates, Inc.
Bob Wheeler, Facilitator; Ellen Blair, Public Involvement Support

8/14/2019 Port Hadlock Sewer Facility Plan 0908
http://slidepdf.com/reader/full/port-hadlock-sewer-facility-plan-0908 272/387

8/14/2019 Port Hadlock Sewer Facility Plan 0908
http://slidepdf.com/reader/full/port-hadlock-sewer-facility-plan-0908 273/387
Port Hadlock UGA – Sewer Facility Plan
SUMMARYPublic Workshop on Alternatives Review
(Public Workshop #3)
June 22, 2006, 1 PM – 3 PMPort Townsend Fire Station
701 Harrison StreetPort Townsend, WA 98368-6519
In response to the 1990 Growth Management Act (GMA), Jefferson County pursued thedesignation of an Urban Growth Area (UGA) in the Irondale/Port Hadlock area. As part of therequirements for establishing a UGA, Jefferson County is conducting a study of alternatives for developing a sewer system. There are currently no sewer facilities in the area, and existingresidences and businesses are served by on-site treatment and disposal (septic) systems.
The sewer study will enable the County to identify 1) the final preferred alternative or method of
collection, treatment, and disposal/reuse of wastewater, 2) the service area, 3) the phasing andimplementation of sewers throughout the service area, 4) the anticipated cost for individualconnections to sewer, and 5) revenue sources. The goal of the study is to produce a sewer facilities plan that will help the County plan for growth in the area over the next 20 years; thatwill satisfy RCW 36.94 concerning County’s sewerage, water, and drainage systemresponsibilities; and that will be approved by the Department of Ecology.
Workshop Summary
A public workshop was held at the Port Townsend Fire Station on Thursday, June 22 from 1:00 pm to 3:00 pm. The workshop was open to the public.
The purpose of the workshop was to:
• Present combined system alternatives
• Review advantages and drawbacks of each alternative
• Present technical recommendations
• Take questions and comments
• Decide preferred alternative
Jefferson County Commissioners, County staff, local agency staff, and several community
leaders and other interested parties were invited to the workshop. The County had identifiedlocal agencies whose facilities might be sewered and/or whose activities might be affected by theinstallation or operation of a sewer. The County also identified representatives of business andcommunity organizations and citizens who had been active previously in the process to establisha UGA. These parties were contacted by mail. A notice of the workshop was available on the project website (www.porthadlocksewer.org), the County’s website, and in the Port TownsendLeader.

8/14/2019 Port Hadlock Sewer Facility Plan 0908
http://slidepdf.com/reader/full/port-hadlock-sewer-facility-plan-0908 274/387
Port Hadlock UGA – Sewer Facility Plan
2
County Commissioner David Sullivan (District 2) and County Commissioner Pat Rodgers(District 3) attended the workshop. The consultants to the County were represented by KevinDour, P.E. and Jim Santroch, P.E. of TetraTech/KCM and Bob Wheeler and Ellen Blair of Triangle Associates. A complete list of workshop participants is attached to this summary.
Introductions & Workshop Overview
Mr. Wheeler, workshop facilitator, opened the meeting at 1:10 pm. He led introductions andexplained the purpose of the workshop. He reviewed the workshop agenda and the steps thatwould lead to selection of a complete sewer system, including public involvement opportunities,technical work, and the development of cost estimates and funding options.
Mr. Wheeler announced that project information could be found and comments could besubmitted at the project website, www.porthadlocksewer.org.
Overview of Recent Developments
Mr. Dour, consultant team project manager, indicated the sewer service area boundaries on amap, including the 6-year planning area, or core area, and the 20-year planning area. HisPowerPoint presentation is attached to this summary. He then reported on new developments for issues that were raised at the previous public workshop on May 25.
• Hydrogeology – Groundwater & Creek Flows
Mr. Dour reviewed a question about the potential contribution of land-based effluentdisposal/reuse to the recharge of Chimacum Creek. The consultant team had done a rough
calculation with available data to estimate the order of magnitude of creek recharge. Theteam found that with the estimated number of initial sewer participants in 2010, land-baseddisposal/reuse might contribute 0.5% of the creek’s flow on average, and up to 1% duringlow flows. In 2030, assuming full participating in the sewer system, land-baseddisposal/reuse could contribute 10% of creek flow on average, and up to 20% during thelowest flows.
• Ecology Meeting – Marine Outfall & Project Teaming
As announced at the previous public workshop on May 25, the project team met with arepresentative of the Department of Ecology on June 13. Mr. Dour reported that the projectteam had learned that Department of Ecology policy stipulates that no marine outfall may be
permitted if a reasonably viable alternative exists for disposal of treated effluent. Mr. Dour said that since viable land-based disposal/reuse methods existed, a marine outfall was nolonger under consideration. He said the project team and the Department of Ecologyrepresentative had identified methods of coordination to ensure the most efficient andsuccessful development of the sewer facilities plan.
• Phasing – Initial Treatment Systems

8/14/2019 Port Hadlock Sewer Facility Plan 0908
http://slidepdf.com/reader/full/port-hadlock-sewer-facility-plan-0908 275/387
Port Hadlock UGA – Sewer Facility Plan
3
Mr. Dour said that in response to stakeholder interest in using small, skid-mounted starter treatment plants to minimize sewer start-up costs, further investigation had been done and ithad shown that such starter treatment plants would provide adequate capacity for only two or three years. The consultant team thought it more prudent to build a permanent facility of adequate size at the outset that would be of service longer and can be expanded to
accommodate future phases of sewer system development.
• Treatment Cost – Refinements
Mr. Dour said that further investigation, research, and detailed cost estimating had shownthat membrane bioreactor (MBR) treatment likely would be no more than 20% more costlythat sequencing batch reactor & filter (SBR) treatment, in contrast to the 20 – 100% rangethat had been reported at the May 25 workshop.
• Solids Disposal Costs – Contract Disposal
Mr. Dour reported that the Port Townsend composting facility had been posited as the most promising option for solids disposal at the May 25 workshop. He said that further
investigation had shown that contract disposal with a company called Biorecycle appeared to be the most economical option, and, at least at the onset, substantially less costly than thePort Townsend composting facility option.
Development of Recommended Alternative from Technical Perspective
Mr. Dour reviewed the technical perspectives on collection and discharge that had been presented at the previous public workshop. He explained that, from a technical perspective, theconsultant team now preferred the gravity collection system to the pressure collection system, atleast at the outset in the core area. He said that while gravity entailed somewhat higher start-up
costs, the total cost of a pressure system would be more after eight to ten years (including capitalcosts, on-site costs, and operations & maintenance costs). He noted that by starting with gravity,the community would have flexibility in choosing between gravity and pressure in the outlyingareas.
Mr. Dour said that the consultant team now recommended rapid-rate infiltration for effluentdischarge, as opposed to a marine outfall or slow-rate infiltration. He reiterated the Departmentof Ecology’s policy restricting the approval of marine outfalls, and he noted that rapid-rateinfiltration would require a smaller footprint on the land and cost less than slow-rate infiltration.
Mr. Santroch reviewed the technical perspectives on wastewater treatment that had been
presented at the May 25 workshop. He said that these perspectives had remained unchanged. Hesaid that MBR was still the recommended treatment alternative because of its superior effluentquality, but that SBR remained a viable alternative that had a lower estimated cost. Mr. Santrochexplained that chemical compounds from pharmaceuticals and personal care products (PPCPs)were being detected in effluent from wastewater treatment plants, and that stories of thesecompounds causing water quality problems in streams, despite concentrations almost too low todetect, were on the rise. He noted that MBR was the most effective treatment technology for removing PPCPs and that the consultant team thought MBR was worth pursuing since the treated
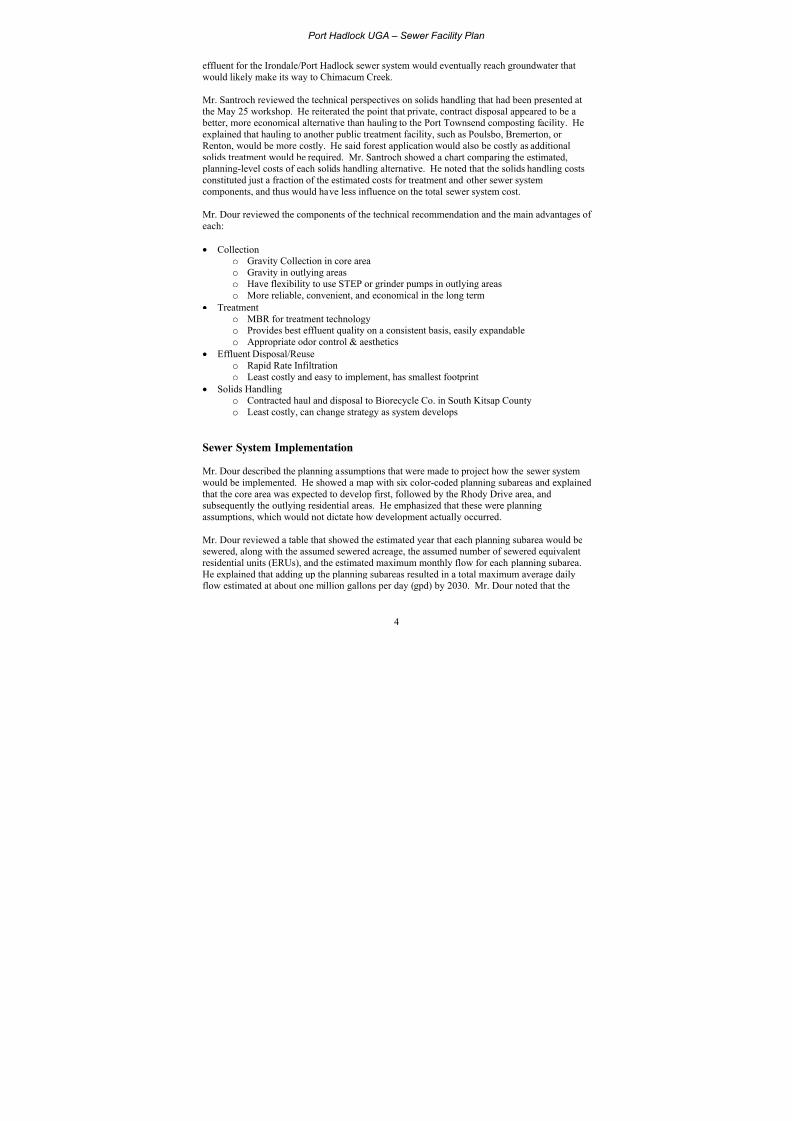
8/14/2019 Port Hadlock Sewer Facility Plan 0908
http://slidepdf.com/reader/full/port-hadlock-sewer-facility-plan-0908 276/387
Port Hadlock UGA – Sewer Facility Plan
4
effluent for the Irondale/Port Hadlock sewer system would eventually reach groundwater thatwould likely make its way to Chimacum Creek.
Mr. Santroch reviewed the technical perspectives on solids handling that had been presented atthe May 25 workshop. He reiterated the point that private, contract disposal appeared to be a
better, more economical alternative than hauling to the Port Townsend composting facility. Heexplained that hauling to another public treatment facility, such as Poulsbo, Bremerton, or Renton, would be more costly. He said forest application would also be costly as additionalsolids treatment would be required. Mr. Santroch showed a chart comparing the estimated, planning-level costs of each solids handling alternative. He noted that the solids handling costsconstituted just a fraction of the estimated costs for treatment and other sewer systemcomponents, and thus would have less influence on the total sewer system cost.
Mr. Dour reviewed the components of the technical recommendation and the main advantages of each:
• Collection
o Gravity Collection in core areao Gravity in outlying areaso Have flexibility to use STEP or grinder pumps in outlying areaso More reliable, convenient, and economical in the long term
• Treatmento MBR for treatment technologyo Provides best effluent quality on a consistent basis, easily expandableo Appropriate odor control & aesthetics
• Effluent Disposal/Reuseo Rapid Rate Infiltrationo
Least costly and easy to implement, has smallest footprint• Solids Handling
o Contracted haul and disposal to Biorecycle Co. in South Kitsap Countyo Least costly, can change strategy as system develops
Sewer System Implementation
Mr. Dour described the planning assumptions that were made to project how the sewer systemwould be implemented. He showed a map with six color-coded planning subareas and explainedthat the core area was expected to develop first, followed by the Rhody Drive area, and
subsequently the outlying residential areas. He emphasized that these were planningassumptions, which would not dictate how development actually occurred.
Mr. Dour reviewed a table that showed the estimated year that each planning subarea would besewered, along with the assumed sewered acreage, the assumed number of sewered equivalentresidential units (ERUs), and the estimated maximum monthly flow for each planning subarea.He explained that adding up the planning subareas resulted in a total maximum average dailyflow estimated at about one million gallons per day (gpd) by 2030. Mr. Dour noted that the

8/14/2019 Port Hadlock Sewer Facility Plan 0908
http://slidepdf.com/reader/full/port-hadlock-sewer-facility-plan-0908 277/387
Port Hadlock UGA – Sewer Facility Plan
5
estimated schedule might be more aggressive than actual development, but that the GMArequired the sewer facilities plan to show how sewer system would be implemented over 20years.
Mr. Dour used a graph to illustrate the rates at which the project team anticipated the local
population would connect to the sewer system. This graph was developed using populationforecast data provided by the Jefferson County Planning Department. The graph showed severallines representing different data in support of the team’s assumptions and analysis. The graphshowed a line representing the residential population forecast in the Port Hadlock area from theCounty planning numbers. The graph also showed a line representing an anticipated equivalent population from commercial growth in the area in relation to the residential population forecast.Finally, the graph showed a line representing the population anticipated to be connected tosewers starting in the year 2010, through 2030 (the 20-year planning horizon), and on to area buildout. The line representing the population anticipated to be connected to sewers wasdeveloped using a compound rate of growth, rather than a linear rate, which was standard for most planning efforts and was in agreement with the method used by Jefferson County Planning
to forecast the residential population in the area.
Sewer System Costs
Mr. Dour presented a series of charts that showed estimated, planning level, 20-year life cyclecosts for each collection alternative, treatment alternative, and disposal/reuse alternative. Theestimated costs were broken down to show cumulative cost at each phase of implementation.Mr. Santroch explained that the plan was to build two treatment trains at Phase 1, 20-day storageat Phase 2, and two additional treatment trains at Phase 3. He said that with further research heexpected to be able to reduce the estimated, planning level cost for wastewater treatment.
Mr. Santroch pointed out the relative magnitude of the total estimated costs, noting that thecollection technology was on the order of $100 million for all phases over 20 years, treatmentwas on the order of $30 million for all phases over 20 years, and the disposal/reuse options wereon the order of less than $5 million for all phases over 20 years. He explained that choosingdifferent alternatives for collection or treatment would have far more impact on total system costthan choosing different disposal/reuse options.
Mr. Santroch then showed a chart that compared the total estimated, planning level, 20-year lifecycle costs for the following four sewer system alternatives (all systems were assumed to userapid infiltration disposal/reuse, sodium hypochlorite disinfection, and private contract solids
handling):
• Gravity system/MBR treatment
• STEP system/MBR treatment
• Gravity system/SBR treatment
• STEP system/MBR treatment

8/14/2019 Port Hadlock Sewer Facility Plan 0908
http://slidepdf.com/reader/full/port-hadlock-sewer-facility-plan-0908 278/387
Port Hadlock UGA – Sewer Facility Plan
6
The costs were broken down by sewer system component: collection, treatment, disinfection,effluent disposal/reuse, and solids handling. Mr. Santroch pointed out that the estimated, planning level, Phase 1 20-year life cycle cost of the least expensive alternative, STEPsystem/SBR treatment, was $26 million, while the estimated, planning level, Phase 1 20-year lifecycle cost of the recommended and most costly alternative, gravity system/MBR treatment, was
$34 million.
For the gravity collection/MBR treatment alternative, Mr. Dour used a chart to show thecumulative system-wide cost at different points over 20 years. A second chart showed the cost per ERU at different points over 20 years. Mr. Dour demonstrated that as more users wereconnected to the sewer system, the lower the estimated cost per ERU was. He explained that agoal for the financing plan was to make the cost per ERU for the early sewer customersequivalent to what the cost per ERU would be after 20 years when many more customers would be connected.
Sewer Facility Siting
Mr. Dour showed a map of potential sites for wastewater treatment facilities and/or effluentdisposal/reuse facilities. He said that the treatment facility and the disposal/reuse facility could be sited at the same or separate locations. The five potential sites were at or near the followinglocations:
• Sheriff’s Facility
• H.J. Carroll Park Vicinity
• Central Port Hadlock (near Mason St. and Cedar Ave.)
• Jefferson County Airport
• Chimacum High School
Mr. Dour reviewed a slide of the advantages and drawbacks of each potential location. He saidthat based on cost considerations, the suitability based on surrounding land uses, and mitigationrequirements, the consultant team was currently focused on the Sheriff’s facility as the bestalternative, with the H.J. Carroll Park vicinity as a potential back-up. He said that more analysiswould be done to better understand the sites’ suitability for treatment and/or disposal/reusefacilities. Mr. Wheeler noted that an area near H.J. Carroll Park, not the park itself, was beingconsidered as a treatment facility site. He said the project team was aware that wetlands in thearea could potentially impact facility siting.
Questions & Comments
Workshop participants commented and asked questions during the presentation and during thediscussion period at the end of the workshop. Their comments and questions, as well as the project team’s responses, are grouped by topic below.

8/14/2019 Port Hadlock Sewer Facility Plan 0908
http://slidepdf.com/reader/full/port-hadlock-sewer-facility-plan-0908 279/387
Port Hadlock UGA – Sewer Facility Plan
7
Sewer System Costs
Comment: Although a gravity collection system would cost less than pressure in the long-run, itwould mean higher initial costs.
Question: Would homeowners be responsible for onsite operation and maintenance (O&M)costs associated with STEP systems?Response (Dour): We assumed that homeowners would not be individually responsible for those costs, and we included those O&M costs in our sewer system cost estimates. Myexperience has been that STEP tanks are considered part of the treatment system that ismaintained by the sewer authority.
Comment: While certain sewer system components may be less expensive in the long run or they may be technologically superior, we have to face what can be financed up front. Thathurdle may dictate some of the components that we choose in the end.
Question: On the graph of treatment cost estimates, do you add the bars together to get the totalcost, or are the bars cumulative over time?Response (Santroch): These are cumulative, present-worth costs, not additive costs.
Collection System Considerations
Question: Don’t STEP and gravity systems both require pump stations?Response (Dour): With a STEP system, there is actually a little pump on every customer’s property. With STEP, those pumps could probably generate enough pressure so that a largeinfluent pump station would be unnecessary. That might be the case for a grinder system aswell, but we would have to look at the hydraulics. With gravity, all of the wastewater flowsdownhill to a low point and is then pumped uphill at a pump station, so a gravity system would probably require a few larger pump stations.
Comment: It can be difficult to access private property. It would be a problem if the sewer authority were responsible for maintenance of STEP or grinder equipment on private property.Also, if property owners are not responsible for the equipment on their own property, they will be less vigilant about preventing problems. Maybe there is space in the street right of way soequipment wouldn’t have to be on private property.
Wastewater Treatment Considerations
Question: Is there any difference in reliability between the MBR and SBR treatment systems?For example, does one perform better during power outages?Response (Santroch): Both federal and state regulatory agencies have standards and guidelinesto ensure reliable service. Treatment plants are required to have a back-up generator to ensurethat plant operation is continuous. The treatment system for the Irondale/Port Hadlock area will be subject to other requirements as well, since the effluent will be discharged to land andtherefore to groundwater. To build redundancy into the treatment system, it is necessary to

8/14/2019 Port Hadlock Sewer Facility Plan 0908
http://slidepdf.com/reader/full/port-hadlock-sewer-facility-plan-0908 280/387
Port Hadlock UGA – Sewer Facility Plan
8
construct either a storage pond to hold untreated wastewater or an additional treatment train beyond the facility’s intended capacity to be used in the event of a treatment system malfunction.Whether to use “n plus one” treatment trains or storage is a design judgment.
That said, past experience has shown that during treatment process disruptions, such as power
outages, MBR systems may provide greater protection of effluent quality than SBR systems provide. At this point in the planning process, the consultant team has not looked in detail at potential differences in reliability. As system design moves forward, I will further investigatethe factors involved in keeping the treatment system running smoothly.
Question: Have you considered using a biomembrane system? In this system, there is a biological film on the surface of the membrane, so a biological reaction and the straining actionhappen simultaneously.Response (Santroch): I am not familiar with that technology, but I would be interested intalking with you about it after the workshop.
Question: Is there a significant difference in energy costs between SBR and MBR?Response (Santroch): Vendors currently tell us that MBR has 50% higher energy costs. A fewyears ago they said it was 100% higher.
Question: When biosolids are shipped out, do they still have germs or are they clean?Response (Santroch): The biosolids would be partially stabilized before they are shipped away, but they would not be dewatered or disinfected at that point. We have found that there would bea tremendous initial capital investment required to do additional dewatering and stabilization.The design team has made a strategic call that it makes financial sense to contract out the haulingand reuse of the facility’s biosolids. One identified contractor, Kitsap Biorecycle, mixes the biosolids with lime to produce an “artificial soil.” This soil is then applied to fields andimmediately plowed under to minimize the potential for odors and pests.
Question: The location of the treatment facility has not been determined yet, but wouldn’t thesite affect the phasing plan?Response (Dour): Not necessarily. Wastewater will be collected to a given point, and then thequestion will just be whether it has to be pumped a short distance or a long distance. I wouldnote that it takes a lot of energy to pump water.
Question: Why did you assume that the ratio of residential to commercial development would be 60:40?Response (Dour): That is the current breakdown in the Irondale/Port Hadlock area. We alsolooked at the current zoning of the sewer planning area and the water usage trends for those landuses and came up with an estimated 60:40 ratio for future growth. We also looked at Winslow,which is a UGA similar in size and character to the UGA proposed in the Irondale/Port Hadlock area, and the ratio there is 60:40.
Question: Why are you planning a single treatment plant? Why not multiple smaller treatmentfacilities?

8/14/2019 Port Hadlock Sewer Facility Plan 0908
http://slidepdf.com/reader/full/port-hadlock-sewer-facility-plan-0908 281/387
Port Hadlock UGA – Sewer Facility Plan
9
Response (Santroch): There are some regulations that relate to that question. If a systemhandles more than 15,000 gallons per day, it is regulated by the Department of Ecology, and theDepartment of Ecology tends to avoid having multiple facilities. There is also some economy of scale to building a single, large facility versus several smaller facilities. A treatment facility isvery expensive relative to each connection when there are only a few customers, but it gets
relatively cheaper per connection when there are more customers. For example, a singletreatment facility can be quadrupled in size over time for double the original price.
Comment: Some other states have started to use multiple smaller treatment facilities and it hasworked well for them.Response (Santroch): I have read about such facilities at Cape Cod, although the authority thatmanaged them had mixed results. If the Irondale/Port Hadlock community wants to go thatroute, the regulatory community would probably approve it since it’s the community’s money. If Jefferson County is interested in multiple, smaller treatment facilities, we would certainlyinvestigate them.
Question: Is there an advantage to building an extra treatment train instead of a storage pond, inthat you can shut down one train for maintenance and use the extra train in the interim?Response (Santroch): Yes, absolutely.
Question: The treatment facility in Bremerton smelled very bad. How would this treatmentfacility be different?Response (Santroch): The Bremerton facility had a “trickling filter” through which air was blown. That is a system prone to odor problems. The technology we are recommending wouldnot have the same level of air/water contact which causes odor. Although the treatmenttechnologies would be different, we are using the Port Townsend wastewater treatment facility asa model for aesthetic and odor mitigation planning.
Solids Handling Considerations
Question: Are there multiple providers for contract hauling? You have to go out to bid, andthere should be competitors. Also, the provider being considered now might go out of business.Response (Santroch): Yes there are five other independent providers. Olympus Terrace Sewer District went out to bid they received five bids.
Effluent Disposal/Reuse Considerations
Question: Are there any health risks associated with rapid rate infiltration?Response (Dour): The effluent will be disinfected prior to being discharged.
Siting Considerations
Question: Are the potential locations you’re showing for treatment or discharge?Response (Dour): The potential locations could be for treatment or discharge or both. Nothinghas been decided at this point. Treatment and discharge can happen at the same site or atseparate sites, it’s just a matter of moving wastewater from place to place.

8/14/2019 Port Hadlock Sewer Facility Plan 0908
http://slidepdf.com/reader/full/port-hadlock-sewer-facility-plan-0908 282/387
Port Hadlock UGA – Sewer Facility Plan
10
Question: How big a footprint is required at the treatment and/or disposal/reuse site?Response (Santroch): If you decide to build storage, which can take up to about 8 acres, thetotal acreage could be about 16 acres. Without storage, the footprint would be smaller.
Comment: We have a dearth of developable land inside of the proposed urban growth area. Myconcern is that the “Central Site,” one of the potential locations for treatment and/or disposal/reuse, is an area that needs to be available for development. Development would bringin more sewer users who would help pay for the sewer system. It would not be a good locationfor sewer facilities.
Comment: A good thing about the Sheriff’s facility site is that the nearby ballfields provide anopportunity for water reuse. The ballfields use a lot of water. It would be important to let peopleknow that the treated water is clean enough for reuse.
Question: Are you looking at public land for the potential site near the Sheriff’s facility?
Response (Dour): That is the ideal.Comment: There are some private properties there, too.
Comment: Kivley Well is near the Sheriff’s facility. You would have to careful to not impactthe well.Response (Dour): Yes, we would look carefully at the hydrology of the area. Also, there areregulations and required setbacks to protect wells.
Question: Have buffers for wetlands been considered already for the potential sites?Response (Santroch): Yes.
Comment: I know the focus is currently on the Sheriff’s facility alternative with the H.J. CarrollPark vicinity as a potential back-up. Since it’s hard to ensure that a proposed site will actually beacquired, maybe we should rank our priorities for the rest of the potential sites.
Comment: I think the Jefferson County Airport is a good alternative. There may be someadvantage to working out an arrangement with the Port of Port Townsend. The Port is interestedin getting sewer service and they might be willing to host the wastewater facilities in exchange.Comment: I have experience working with the Port, and I would be very concerned about FAAand waterfowl issues at the Jefferson County Airport.Comment: Perhaps a storage pond would not be allowed at the airport site, but the tanks could be covered.Comment: Think carefully about whether to use the airport site, because that site could be beneficial for development in the county in the long run.
Comment: I oppose the Central Port Hadlock site, because the community has expressedinterest through visioning processes in commercial and multi-family development in that area.

8/14/2019 Port Hadlock Sewer Facility Plan 0908
http://slidepdf.com/reader/full/port-hadlock-sewer-facility-plan-0908 283/387
Port Hadlock UGA – Sewer Facility Plan
11
Comment: If either the Chimacum High School site or Jefferson County Airport site were used,there would be very strong community concern about development expanding down RhodyDrive.
Comment: At the Chimacum High School Site, there’s a setback for the creek that may limit
the amount of space available for a wastewater facility.
Question: Some time ago there was a discussion about the mill tying into the sewer system andsharing its treatment and marine outfall capacity. Is that still under consideration?Response (Wheeler): The mill is between five and eight miles away and over a hill from thesewer planning area. Pumping wastewater that far and over a hill is a huge cost. It would likely be a challenge to permit additional discharge via the marine outfall, especially because the milldoes not currently process wastewater so sharing facilities would introduce shellfish protectionissues.
Comment: Jefferson PUD #1 is planning to conduct a groundwater study, including modeling
and field observations, for the Chimacum Creek Basin. The sewer project team should contactBill Graham to coordinate on what information is need.
Sewer System Planning
Comment: Looking at your graph of growth of residential and non-residential ERUs, I think thecommercial areas would be sewered faster than you show because there is a lot of pent updemand. However, I think the residential areas would be sewered more slowly than you show,since people will not be required to connect to sewer if they have a functioning septic system.Growth in sewer system connections could be more of a step function.Response (Dour): Yes, we have made many assumptions in estimating how the sewer systemwill grow. We have made certain assumptions about how quickly people will hook up to thesewer system, but it may be that one or more of the treatment system expansions create adequatecapacity for longer than we show here.
Comment: I think commercial and multi-family residential development will grow faster thanshown here.Response (Dour): That is certainly possible. The way we developed the 12.4% growth curve of the number of sewered ERUs was to look at the estimated number of initial users and theestimated number of users at the end of the 20-year planning period and basically connect thosetwo dots. We assumed a compound growth rate to get the curve you see here.
Next Steps and Wrap Up
Mr. Wheeler thanked the attendees for their input and said that it would help the consultant teamto refine the recommended sewer system alternative to present at a public open house in July.Mr. Wheeler asked if, based on the regulations governing marine outfall, it was appropriate todrop marine outfall from consideration for effluent disposal and focus on rapid-rate infiltration.The attendees agreed that it was. The attendees also agreed that it was appropriate to focus on

8/14/2019 Port Hadlock Sewer Facility Plan 0908
http://slidepdf.com/reader/full/port-hadlock-sewer-facility-plan-0908 284/387
Port Hadlock UGA – Sewer Facility Plan
12
gravity as the recommended collection technology in the core area, with a focus on gravity in theoutlying areas but the possibility of using a pressure system instead
The meeting was adjourned at 3:20 pm.
Workshop Attendance
The public workshop was attended by County Commissioner David Sullivan (District 2) andCounty Commissioner Pat Rodgers (District 3). Additional attendees are listed below.
Name Affiliation
Vanessa Brower Citizens for the UGAJohn Fischbach Jefferson County, County Administrator Linda Germeau Kitsap Bank Frank Gifford Jefferson County, Public Works
Syd Lipton CitizenJim Parker Jefferson PUD #1Dana Roberts Jefferson PUD #1Allen Sartin Jefferson County, Central ServicesRay Serebrin Jefferson County LibraryTroy Summerill Inn at Port Hadlock
Consultant Team Staff in Attendance
TetraTech/KCM Kevin Dour, Project Manager; Jim Santroch, Senior Project Engineer – Treatment
Triangle Associates, Inc.Bob Wheeler, Facilitator; Ellen Blair, Public Involvement Support

8/14/2019 Port Hadlock Sewer Facility Plan 0908
http://slidepdf.com/reader/full/port-hadlock-sewer-facility-plan-0908 285/387
Port Hadlock UGA – Sewer Facility Plan
SUMMARYStakeholder Workshop on Cost and Financing
(Stakeholder Workshop #4)
October 10, 2006, 1 PM – 3 PMJefferson County Courthouse
1820 Jefferson StreetPort Townsend, WA 98368-0920
In response to the 1990 Growth Management Act (GMA), Jefferson County pursued thedesignation of an Urban Growth Area (UGA) in the Irondale/Port Hadlock area. As part of therequirements for establishing a UGA, Jefferson County is conducting a study of alternatives for developing a sewer system. There are currently no sewer facilities in the area, and existingresidences and businesses are served by on-site treatment and disposal (septic) systems.
The sewer study will enable the County to identify 1) the final preferred alternative or method of
collection, treatment, and disposal/reuse of wastewater, 2) the sewer service area, 3) the phasingand implementation of sewers throughout the service area, 4) the anticipated cost for individualconnections to sewer, and 5) potential revenue and funding sources. The goal of the study is to produce a sewer facility plan that will help the County plan for growth in the area over the next20 years; that will satisfy RCW 36.94 concerning Counties’ sewerage, water, and drainagesystem responsibilities; and that will be approved by the Department of Ecology.
Workshop Summary
A public workshop was held at the Jefferson County Courthouse on Tuesday, October 10 from1:00 pm to 3:00 pm. The workshop was open to the public.
The purpose of the workshop was to:
• Present developments & design refinements to the preferred sewer system alternative
• Present the cost estimate
• Provide information on financing strategies
• Take questions and comments
Jefferson County Commissioners, County staff, local agency staff, and several communityleaders and other interested parties were invited to the workshop. The County had identifiedlocal agencies whose facilities might be sewered and/or whose activities might be affected by theinstallation or operation of a sewer. The County also identified representatives of business andcommunity organizations and citizens who had been active previously in the process to establisha UGA. These parties were contacted by mail. A notice of the workshop was available on the project website (www.porthadlocksewer.org), the County’s website, and in the Port TownsendLeader.

8/14/2019 Port Hadlock Sewer Facility Plan 0908
http://slidepdf.com/reader/full/port-hadlock-sewer-facility-plan-0908 286/387
Port Hadlock UGA – Sewer Facility Plan
2
County Commissioner Phil Johnson (District 1), County Commissioner David Sullivan (District2), and County Commissioner Pat Rodgers (District 3) attended the workshop. The consultantsto the County were represented by Kevin Dour, P.E. and Jim Santroch, P.E. of TetraTech/KCM,Katy Isaksen of Katy Isaksen & Associates, and Bob Wheeler, P.E. and Ellen Blair of TriangleAssociates. A complete list of workshop participants is attached to this summary.
Introductions & Workshop Overview
Mr. Wheeler, workshop facilitator, opened the meeting at 1:00 pm. He led introductions andexplained the purpose of the workshop. He reviewed the workshop agenda and outlined thesteps that would lead to the completed sewer facility plan, including public involvementopportunities, technical work, and the development of cost estimates and funding options. Hedistributed a handout that defined acronyms and abbreviations used in the presentation.
Mr. Wheeler announced that project information could be found and comments could be
submitted at the project website, www.porthadlocksewer.org.
Mr. Wheeler thanked the participants for their on-going participation in the sewer facility plan process. He said that the valuable input the County and the consultant team had received hadhelped them to identify and refine the preferred sewer system alternative.
Mr. Wheeler summarized the purpose of planning a sewer system for the Port Hadlock UGA.He highlighted the following reasons:
• Responsible, proactive planning for population growth under the auspices of the GrowthManagement Act
• Environmental protectiono
Chimacum Creek o Shellfish beds
• Allows denser development in designated areaso Development to planned densities
To preface the cost estimate and financing strategy presentation, Mr. Wheeler said it wasimportant to recognize that brand new sewer systems were inherently expensive. He noted thatthe substantial capital cost of building a whole new sewer system was incurred in the beginningwhen the fewest customers were participating and sharing the cost, which made it challenging tostart a new system.
Mr. Wheeler explained that sewer planning to date had produced some of the “facts” about whata sewer system might cost and what financing strategies would be available. He emphasized thatthe critical next step after developing the “facts” would be to investigate innovative financingstrategies and to apply for funding, in other words to do the “artwork.” He explained that anapproved sewer facility plan would make the project eligible for a variety of funding programs.He mentioned the following four types of funding assistance as examples:
• Grants• Congressional/legislative line items
8/14/2019 Port Hadlock Sewer Facility Plan 0908
http://slidepdf.com/reader/full/port-hadlock-sewer-facility-plan-0908 287/387
Port Hadlock UGA – Sewer Facility Plan
3
• Low interest loans• Low income assistance
Mr. Wheeler noted that the cost estimates to be presented could change in the future as the work of detailed final design, obtaining funding, and deciding on financing strategies proceeded.
Recent Developments & Design Refinements to Preferred Alternative
Mr. Dour, consultant team project manager, briefly described the components of the preferredsewer system alternative and the reasons for their selection. The PowerPoint workshop presentation is attached to this summary. Mr. Dour reported that potential locations for thewastewater treatment plant had been narrowed to the southern portion of the UGA, in the vicinityof the Sheriff’s Facility. He said that a site for the influent pump station, the station that would pump the wastewater collected from the entire system to the treatment plant, had been identifiednear Ness’ Corner Road and Shotwell Rd. Mr. Dour displayed two maps that showed the area of
the potential treatment plant locations and the approximate site of the influent pump station.
To optimize financing and development of the sewer system, Mr. Dour said that the consultantteam had estimated the wastewater treatment plant costs year by year and had shifted the timingof costs further into the future whenever possible. This strategy was to attempt to lower theinitial cost of the system in the earlier years when fewer participants would be connected. Hesaid that the consultant team’s hydrogeologist was continuing to work to ensure that the selecteddisposal method would direct the treated, Class A treatment plant effluent to a beneficial use. Hesaid that the intent was to recharge groundwater that flowed to Chimacum Creek, thusaugmenting creek flow.
System Financing & Planning Process
Mr. Dour gave an overview of the plan to phase implementation of sewer service into the UGA,with the initial service area to be centered around the Port Hadlock commercial core. Hedescribed the requirement that sewer facility plan contain identified funding sources andfinancing strategies.
Mr. Dour said that the County and the community would have the opportunity to decide whether or not to move forward with implementation once the sewer facility plan was approved.
Updated Capital Cost through 2018
Mr. Dour presented the updated estimate for the capital cost of sewer facilities through 2018.The facilities would serve the core commercial area and Rhody Drive during this initial phase.There would be some additional treatment facility capacity available for future residential areas.The estimate was approximately $33.5 million.
8/14/2019 Port Hadlock Sewer Facility Plan 0908
http://slidepdf.com/reader/full/port-hadlock-sewer-facility-plan-0908 288/387
Port Hadlock UGA – Sewer Facility Plan
4
Funding Strategies
Ms. Isaksen, financial analyst, said her intent was to identify a mix of funding that wouldminimize the cost of the sewer system.
Ms. Isaksen explained that sewer costs were divided into two basic types, with implications as tohow they are funded:
• Capital costso One-time costs to build the physical facilitieso Mix of capital funding sources typically used to pay for capital costs
• Operation and maintenance (O&M) costso On-going costs to operate and maintain the facilitieso Distributed to users by monthly sewer rates
Ms. Isaksen said that capital costs must be paid up front, with funding typically obtained from a
mix of grants, loans, bond proceeds, and/or other methods. She noted that grants were the bestsource of funding because they did not require repayment. Later in the presentation, Ms. Isaksendetailed the ways that sewer customers could repay funding from the other sources.
Ms. Isaksen listed several types of funding opportunities and indicated whether each one wasavailable to pay for capital costs, O&M costs, or both. She showed that many more sources of funding were available to pay for capital costs than for on-going O&M costs. She describedspecific examples of capital funding sources, such as Department of Ecology and USDA RuralDevelopment grants and low-interest loans.
Considerations for Funding Initial Capital Costs through 2018
Ms. Isaksen then explained in more detail the options for funding the estimated capital costthrough 2018 of a sewer system in the Port Hadlock UGA. She said that, from a financial perspective, capital costs were divided into the following two categories:
• Common/shared costso Costs for facilities that benefit multiple sewer customerso Typically eligible for grants, loans, bonds, and other outside funding sources
• Private/on-site costso Costs for the sewer line and other equipment on private property that connect the
property to the sewer system
o Typically paid by property owner
Ms. Isaksen said that common/shared costs were further broken down into General costs andLocal costs. General costs are for facilities that benefit all of the sewer system’s customers. For example, the wastewater treatment facility serves all of the sewer system’s customers. Localcosts are for facilities that benefit a subset of the sewer system’s customers. For example, asewer line through a neighborhood street serves only the customers in that neighborhood.
8/14/2019 Port Hadlock Sewer Facility Plan 0908
http://slidepdf.com/reader/full/port-hadlock-sewer-facility-plan-0908 289/387
Port Hadlock UGA – Sewer Facility Plan
5
Common/Shared Capital Costs
General• Wastewater treatment facility• Disinfection system• Solids handling• Disposal• Influent pump station• Oversizing collection pipelines (greater
than 8” in diameter)
Local• Gravity collection pipelines up to 8” in
diameter
Ms. Isaksen said that General costs were higher because they included the relatively costlywastewater treatment facility. The estimate for each component of capital cost through 2018 wasas follows:
• Common/Shared Costo General: $21,074,114
o Local: $8,934,800
• Private/On-Site Costo On-Site: $3,455,000
Ms. Isaksen presented a timeline (2010 to 2018) that illustrated that the majority of thecommon/shared costs would be incurred in 2010, with relatively smaller costs incurred in 2012,2015, and 2018 to expand the collection and treatment systems.
Ms. Isaksen said that she had focused her analysis on how to fund the upfront costs in 2010, because new customers connecting to the sewer system could help to defray the smaller costs in2012, 2015, and 2018.
She gave an example (see PowerPoint presentation) of a mix of funding sources that could beused for the 2010 shared/common costs. She said that while multiple funding sources wereusually necessary to amass enough money, it was important to recognize the level of effort aswell as the administrative and other requirements in selecting which and how many funding programs to pursue.
Strategies for Recovering Capital Costs from Users
Ms. Isaksen presented three methods for sewer customers to repay the upfront capital costs:connection charges, a Utility Local Improvement District (ULID), and assessments based upon property value.
She explained that ULIDs were defined in statute, and that to form a ULID, essentially a boundary was drawn around the properties benefiting from a project, and all of the properties

8/14/2019 Port Hadlock Sewer Facility Plan 0908
http://slidepdf.com/reader/full/port-hadlock-sewer-facility-plan-0908 290/387
Port Hadlock UGA – Sewer Facility Plan
6
within the boundary were assessed a share of the capital costs based on the benefits theyreceived. She pointed out that a sewer ULID assessment against a property was prohibited bylaw from exceeding the benefit received from the availability of sewer service, in other words thedollar value of the assessment could not exceed the increase in value to the property. She saidcustomers were typically allowed to pay off the assessment on an annual basis over 10 to 20
years.
Ms. Isaksen said that a single ULID could be formed to encompass the entire sewer service area but that it was more likely that multiple ULIDs would be established for individualneighborhoods within the service area. These ULIDs could be established over time as thecollection system developed and expanded. Ms. Isaksen said that a ULID could be formed oneof two ways: either the property owners within a proposed ULID boundary would petition theresponsible governing entity (county) or the County Commissioners would adopt a resolution.
Ms. Isaksen presented three scenarios which would likely be used to recover capital costs. Theseare summarized below.
Strategy Description
Connection Charges for General and Local
Costs
Customer pays a fee when connects to sewer
Connection Charges for General Costs and aULID for Local Costs
ULID Assessment is paid off annually oncesewer lines come to the neighborhood,customer pays connection charge whenconnects to sewer
Assessed Value for General and Local Costs When sewer lines come to the neighborhood,
property owners pay annually based on valueof their property; undeveloped property paysmuch less than developed property
Ms. Isaksen noted that it is typical for monthly rates to be used to pay off long-term debt, but thatthis was not a likely option for a new sewer system because there are no existing sewer customers to pay monthly rates.
Ms. Isaksen said that some jurisdictions allowed sewer customers to pay connection charges off over time. Thus, both connection charges and/or Utility Local Improvement District (ULID)
assessments are mechanisms available that may enable customers to spread their payments over time, rather than pay a single, large, lump sum. Ms. Isaksen said that if customers were permitted to spread their connection charges over time, some entity, for example the County,would need to guarantee that the debt service would be paid and may need to bridge thedifference for a period of time before the customers can provide full repayment.
Ms. Isaksen noted that the assessed value method is used much less commonly than connectioncharges or ULIDs. Each property’s assessment under this method would be based on that

8/14/2019 Port Hadlock Sewer Facility Plan 0908
http://slidepdf.com/reader/full/port-hadlock-sewer-facility-plan-0908 291/387
Port Hadlock UGA – Sewer Facility Plan
7
property’s assessed value for real estate tax purposes. Thus an undeveloped property would payless than a developed property of the same size.
Estimates of Capital Costs per Equivalent Residential Unit (ERU)*
Ms. Isaksen presented the estimated capital cost per ERU for commercial property and for residential property. For the residential property estimate, she assumed that a grant would cover 45% of the shared/common costs. She based her assumption on the maximum grant availablefrom the USDA Rural Development program.
Ms. Isaksen displayed two tables that illustrated how customer payments for common/sharedcosts could be concentrated or spread over time, depending on the financing strategy used.Using a connection charge method, the customer would pay common/shared costs as well as the private/on-site cost at the time of connection. Using a combination strategy of a connectioncharge plus a ULID, the customer could begin paying Local costs when the ULID comes to the
neighborhood, and could pay the General and private costs at the time of sewer hook-up.
Ms. Isaksen explained that the consultant team had tried to develop realistic, but conservative,cost estimates to ensure that the actual costs would be within the estimates and to enable theCounty and community to make realistic plans. Ms. Isaksen said the cost estimates had been based on recent bid results on other projects and that standard estimating procedures had beenused. To be conservative, a 30% contingency was included in the capital costs, which Ms.Isaksen said was customary for planning level estimates. Ms. Isaksen said she had also includeda 15% financing cost and had applied a conservative interest rate when calculating the estimateddebt service payments for low interest loans.
Ms. Isaksen stressed that funding agencies looked favorably on projects with realistic costestimates. She compared the capital cost estimates for a Port Hadlock UGA sewer system tothree recent sewer system expansions in Western Washington to demonstrate the Port Hadlock UGA cost estimates were comparable with actual projects.
Operations & Maintenance Cost Estimate
Ms. Isaksen presented a planning level estimate of $60/month per residence for on-going O&Mcosts, which included billing, administration, and state taxes. Some assistance may be availablefor low income customers. Commercial properties would be charged according to their water
usage where one equivalent residential unit (ERU) would be equal to 4,500 gallons per month.
How to Continue to Reduce Costs
* One ERU is 4,500 gallons of wastewater produced per month for the purposes of this analysis. A business mayrepresent multiple ERUs depending on the amount of wastewater produced. A single-family residence is typicallyconsidered one ERU, regardless of the amount of wastewater produced.

8/14/2019 Port Hadlock Sewer Facility Plan 0908
http://slidepdf.com/reader/full/port-hadlock-sewer-facility-plan-0908 292/387
Port Hadlock UGA – Sewer Facility Plan
8
Ms. Isaksen concluded by stressing that the “art” of reducing the cost to sewer customers wasonly beginning. She encouraged the County and the community to prepare for approval of thesewer facility plan by exploring funding and financing options as soon as possible. Sherecommended approaching Congressional and legislative representatives, observing that
Jefferson County had successfully obtained a federal line item to renovate the clock tower at theCounty Courthouse. Ms. Isaksen said that Jefferson County staff would be meeting with severalfunding program administrators at the IACC (Infrastructure Assistance Coordinating Council)Conference in Wenatchee at the end of October to get advice on how best to position the PortHadlock UGA sewer project with funding agencies.
Ms. Isaksen highlighted the importance of seeking low-income assistance, such as USDA RuralDevelopment and/or health department loans. She said that one option was to use grant fundingto create a low-income assistance program.
Ms. Isaksen also encouraged the County and the community to explore opportunities for O&M
cost savings during the implementation phase.
Finally, Ms. Isaksen said that maximizing the number of customers who participated in the first phase of sewer implementation would make it easier to distribute sewer system start-up costs.
Questions & Comments
Workshop participants commented and asked questions during the discussion period at the endof the workshop. Their comments and questions, as well as the project team’s responses, aresummarized and grouped by topic below.
Cost Estimates
Comment: Although a business might constitute more than one ERU, the total capital cost tothe business may not equal the estimated capital cost per ERU multiplied by the number of ERUs. This is because the estimated capital cost per ERU includes the private, on-site cost of connecting to sewer. If a business constitutes multiple ERUs, there would still be only one hook-up on the property. While that hook-up may be more expensive than a hook-up to a residence because of the size of the equipment, it may still be less than multiplying the estimated private,on-site cost per ERU by the number of ERUs.Response (Isaksen): That is true.
Question: Is the 30% contingency factor built into the on-site, Local, and General costs? Is thattypical? Do the actual costs usually come in that high?Response (Dour): The contingency factor is built into the on-site, Local, and General costs.This is standard planning procedure. It is good planning, in part, to include a contingency factor in the estimate capital costs because, at the current planning level, the preliminary design doesnot account for details which will be discovered in final design. For example, the collectionsystem was developed using an aerial contour map with 10 foot contour intervals, which is

8/14/2019 Port Hadlock Sewer Facility Plan 0908
http://slidepdf.com/reader/full/port-hadlock-sewer-facility-plan-0908 293/387
Port Hadlock UGA – Sewer Facility Plan
9
acceptable for planning but is a coarse scale for final design. At the planning level, we made best guesses as to where maintenance holes would be located, but perhaps in the final design phase it will turn out that there need to be 10% more maintenance holes than we haveanticipated. Also, we cannot predict how prices for materials like steel, concrete, or petroleumwill change by the time construction could begin.
Question: Can you tell us more about why you included a 15% financing cost in the costestimates?Response (Isaksen): This is a conservative estimate of the cost of financing. Say you had to borrow money during construction and you had to pay interim interest on the construction fundsuntil the permanent financing was complete. I have assumed this may be up to 2.5% of theamount financed. If you went to the open bond market, it might be another 2.5% for theunderwriter and bond counsel, along with another 10% to borrow the required reserve.However, if you are organized and well-prepared, it is typically less expensive to obtain fundingthrough grants and low-interest loan programs.
Question: Is the 15% financing cost included in the common/shared capital cost estimates,which are about $21 million for General costs and about $9 million for Local costs?Response (Isaksen): I tried not to mix the calculation of the estimated costs per ERU with thetotal capital cost estimates that the engineers developed. The engineers provided cost estimatesthat included a 30% contingency factor. None of their total capital cost estimates included the15% financing cost. In my financing work, I added the 15% financing cost only to the estimatedcost per ERU .
Question: Did you break the estimated capital costs down as monthly costs per ERU?Response (Isaksen): I avoid presenting capital costs on a monthly basis because I don’t want toset the County up to have to accept payments on a monthly basis. However, if you assume acapital cost of $12,850 for a residence, and that you would be paying it back over 20 years withan interest rate of 3.5 %, this would be approximately $75 per month for the capital portion.Added to the estimated $60 per month for on-going O&M and administration, it could be $135 per month.
Question: You’ve presented a variety of financial approaches, but are you recommending themost expensive sewer system technology?Response (Isaksen): The preferred alternative has the highest initial capital costs among thetechnologies that the engineers evaluated. However, the life cycle costs of the preferredalternative are lower because on-site and operation and maintenance costs of the other technologies tend to increase the life cycle costs over time.
When the preferred alternative type of system is built, you don’t have to redo it, and you get ahigher level of treatment that anticipates future regulations. From a financial perspective, theaverage cost per ERU over 20 years is about $1,500 more than the least expensive technologiesof a STEP collection system with an SBR treatment plant.
Question: Are the cost estimates per ERU based on the 20-year planning boundary or the six-year planning boundary?

8/14/2019 Port Hadlock Sewer Facility Plan 0908
http://slidepdf.com/reader/full/port-hadlock-sewer-facility-plan-0908 294/387
Port Hadlock UGA – Sewer Facility Plan
10
Response (Isaksen): The cost estimates per ERU were based on the average of the 20-year planning area. If the estimates were calculated only up to the year 2018, the cost per ERU would be about $5,000 higher because there would be fewer connections to share in the cost of treatment plant. There are cost savings associated with bringing residential customers on to thesystem in the latter decade of the 20-year planning period.
Question: You assumed that solids handling would be contracted to a private hauler. Are theremultiple companies doing this work: is there competition? We don’t want to be stuck with onecompany if their prices rise.Response (Santroch): There are multiple private haulers, and there are also public haulers likethe City of Port Angeles. We based our cost estimates on one, stable private hauler. Also, if prices for hauling rise, the cost-effectiveness of investing in solids handling facilities in PortHadlock could be revisited.
Question: Did you build expected growth into your per ERU cost estimates for the core area?Response (Dour): Yes, we made planning level assumptions about growth. We used
population forecasts from the Jefferson County Comprehensive Plan, and we used the land usemap for the Irondale/Port Hadlock area, which defines densities for residential and commercialdevelopment. We checked the ratio of commercial to residential development against the ratioof commercial to residential water usage and against the ratio of development in similar communities to backcheck the ratio used in our projections.
If the sewer system is built, a comprehensive sewer plan will be developed, which must beregularly updated. The comprehensive sewer plan would contain updates to the growth projections as the area develops and the County’s Comprehensive Plan changes.
Financing Strategies
Question: What political entity will pursue financing strategies, such as establishing a ULID,for the sewer system?Response (John Fischbach, Jefferson County Administrator): It is ultimately the County’sresponsibility to pursue these strategies.
Question: How many years in advance of sewer availability may a ULID be established?Response (Wheeler): That is a legal question, and we don’t know for sure.
Funding Availability
Question: Why did you assume a 45% grant for residences? Would we get that grant?Response (Isaksen): I assumed a 45% grant for residential ERUs from the USDA RuralDevelopment, which is the maximum amount available from that program. These grants areavailable for hardship situations, which are defined as cases where sewer services cost more than1.5% of monthly income. Based on the median household income of the Irondale/Port Hadlock census area, this project would clearly qualify for the maximum grant funding from the USDARural Development program. Grant funding is available up to a maximum of 45% of capitalcosts to help bring the sewer service costs down towards 1.5% of monthly income.

8/14/2019 Port Hadlock Sewer Facility Plan 0908
http://slidepdf.com/reader/full/port-hadlock-sewer-facility-plan-0908 295/387
Port Hadlock UGA – Sewer Facility Plan
11
Please note that being qualified does not guarantee a grant or an amount; it is necessary to applyfor the grant.
Question: Are there other grant sources for connection fees if the Housing Authority owns a
residential property that is connected to the sewer system? Is there a waiver for such properties?Response (Isaksen): A representative of the USDA Rural Development sewer system grants program mentioned to me other housing grants that are available from other administrators. As Iunderstand it, there are other funding sources for low income residences. I don’t know if onlyresidents are eligible, or if non-resident property owners are eligible.
Question: Is there enough sewer grant funding in the current federal budget for all of thequalified applicants?Response (Isaksen): There almost certainly is not. It is important to have a good application toget to the top of the list.
Preliminary Design
Question: Are there any land uses that are incompatible with being adjacent to a wastewater treatment plant? Are there innovative land uses adjacent to wastewater treatment plants?Response (Santroch): People often oppose having a wastewater treatment plant nearby, but weare including provisions in the cost estimates to make this wastewater treatment plant a goodneighbor. We are using the Port Townsend wastewater treatment facility, which is adjacent tohomes, as a comparable model of how to be a good neighbor.
Question: You’ve talked about doing odor control and visual screening at the wastewater treatment facility. Are there noise issues as well?Response (Santroch): Treatment plants can be noisy. However, noise control methods aretypically used to limit the noise levels to 40 decibels, which is quieter than my speaking voiceright now.Response (Wheeler): An acceptable level of noise for a Port Hadlock treatment plant would bedetermined through the State Environmental Policy Act, but it is fairly easy to mitigate noise for the type of treatment facility being proposed. I would encourage anyone to visit the PortTownsend wastewater treatment plan for reference.
Question: You are proposing a pump station in the vicinity of the library. Would there also beone to pump wastewater up from the alcohol plant?Response (Dour): Yes, there would be a few local pump stations. In terms of estimating theGeneral costs, we planned for one large, influent pump station in the vicinity of the library because the overall collection system as laid out in this plan tends to drain towards this area.Smaller, local pump stations were included in the Local cost estimates.
Question: Do the trucks pick sludge up from the treatment facility or from the pump station?Response (Dour): Sludge is picked up at the treatment facility.

8/14/2019 Port Hadlock Sewer Facility Plan 0908
http://slidepdf.com/reader/full/port-hadlock-sewer-facility-plan-0908 296/387
Port Hadlock UGA – Sewer Facility Plan
12
Question: With contract hauling for solids handling, how many trucks would be traveling to andfrom the wastewater treatment facility?Response (Santroch): In the early years, probably one truck a week. If contract disposal werecontinued as the sewer system expanded, you could get up to one truck per day.
Question: There have been several sewage spill accidents in the news recently. While the proposed wastewater treatment facility would be cleaner than other options, the potential sites for the facility are very close to drinking water sources. Why are you suggesting sites so close todrinking water? Is it just cheaper?Response (Santroch): It is important to note that, by law, wastewater treatment and disposalfacilities must be located a prescribed distance away from drinking water wells. One of the maindrivers of the evaluation of potential disposal sites was local interest in recharging ChimacumCreek. We pursued options that would recharge the creek further upstream to be more beneficial.Response (Wheeler): The consultant team is also studying the hydrology of the area to ensurethat disposed effluent would flow towards the creek and not towards a well. That is part of our
job.
Next Steps and Wrap Up
Mr. Wheeler thanked the attendees for their input. He outlined the next steps in the developmentof the sewer facility plan, which included a public meeting on October 25, the completion of thedraft sewer facility plan by the end of 2006, a public meeting to be scheduled in February 2007,and Department of Ecology approval of the sewer facility plan in March of 2007.
The meeting was adjourned at 3:00 p.m.
Workshop Attendance
The public workshop was attended by County Commissioner Phil Johnson (District 1), CountyCommissioner David Sullivan (District 2) and County Commissioner Pat Rodgers (District 3).Additional attendees are listed below.
Name Affiliation
Robert Bates CitizenMike Blair Chimacum School District
Bill Brock Northwest School of Wooden BoatbuildingBrent Butler Jefferson CountyEvan Cael Peninsula Daily NewsPhil Flynn CitizenAlan Goodwin Community United Methodist ChurchElaine Goodwin Community United Methodist ChurchLaurie Gore CitizenSandy Hershelman Jefferson County Home Builders Association

8/14/2019 Port Hadlock Sewer Facility Plan 0908
http://slidepdf.com/reader/full/port-hadlock-sewer-facility-plan-0908 297/387
Port Hadlock UGA – Sewer Facility Plan
13
Name Affiliation
Sandra Hill CitizenDouglas Joyce CitizenMaureen Joyce CitizenElizabeth Lammers Citizen
Garrett Larsen CitizenRebecca Lopeman CitizenKimberly Macintosh CitizenBill Mahler Northwest School of Wooden BoatbuildingBob Matheson CitizenMargaret Matheson CitizenKathy McKenna Jefferson County Housing AuthorityWilliam Miller Jefferson County Planning CommissionJim Parker Jefferson PUD #1Frances Rawski Citizens for the UGADana Roberts Jefferson PUD #1
H.C. Rogers CitizenChuck Russell Valley TavernCraig C. Smith Peninsula VideoBonnetta Starlin Citizen
Consultant Team Staff in Attendance
TetraTech/KCM
Kevin Dour, Project Manager; Jim Santroch, Senior Project Engineer – Treatment
Katy Isaksen & AssociatesKaty Isaksen, Financial Analyst
Triangle Associates, Inc.Bob Wheeler, Facilitator; Ellen Blair, Public Involvement Support

8/14/2019 Port Hadlock Sewer Facility Plan 0908
http://slidepdf.com/reader/full/port-hadlock-sewer-facility-plan-0908 298/387

8/14/2019 Port Hadlock Sewer Facility Plan 0908
http://slidepdf.com/reader/full/port-hadlock-sewer-facility-plan-0908 299/387
Pub lic Meeting, October 25, 2006
Citizens & Pro ject Team Discuss Prelim inary Design, Cost Estimate &
Financing Strategies
On Wednesday, October 25, 2006, Jefferson County hosted a public meeting at the
WSU Extension to provide information and take public comment on a sewer studybeing conducted in the Irondale/Port Hadlock area. The goal of the sewer study is toprepare a comprehensive sewer facility plan that will help the County plan for growth
in the Irondale/Port Hadlock area through the year 2030. Approximately 50 members
of the community attended the public meeting.
During an informal open house period from 5:30 p.m. to 6:00 p.m., there were large
boards posted around the room with information about the sewer planning process,the preferred sewer system alternative, and potential locations for wastewater
facilities. Public meeting attendees were encouraged to view the information and talk
with members of the project team.
The consultant team that the County hired to conduct the Irondale/Port Hadlocksewer study gave a presentation and responded to questions about the cost
estimate, potential financing strategies, and progress on preliminary design for thepreferred sewer system alternative. The consultant team described next steps in the
decision-making process and opportunities for public involvement. Members of theconsultant team included project manager Kevin Dour, TetraTech/KCM; Jim
Santroch, TetraTech/KCM; Katy Isaksen, Katy Isaksen and Associates; and BobWheeler, Triangle Associates. The PowerPoint presentation is attached.
Mr. Wheeler said that having a sewer facility plan approved by the Department of
Ecology would make the sewer project eligible for a variety of state and federalfunding programs. Ms. Isaksen explained that while developing realistic cost
estimates and financing strategies was a required component of the sewer facilityplan, it was also important as a way to identify the best financing sources available
to launch the sewer system. She said that the consultant team had used
conservative assumptions to develop the cost estimates to make sure that theproject could be done within the estimated budgets.
During the meeting, many questions from the public related to the decision-making
process for the sewer, the results of preliminary design, and the cost estimate andfinancing strategies. The consultant team, County staff, and County Commissioner
David Sullivan (District 2) provided responses based on available information.
Ms. Isaksen emphasized that more work would be done during the implementation
phase, after the sewer facility plan was approved, to reduce project costs, securefunding assistance, and finalize the method of distributing costs. Mr. Wheeler
reviewed the schedule for completing the sewer facility plan and noted that another
public meeting would be scheduled before the plan was finalized.

8/14/2019 Port Hadlock Sewer Facility Plan 0908
http://slidepdf.com/reader/full/port-hadlock-sewer-facility-plan-0908 300/387
Public Meeting, July 19, 2006
Citizens & Project Team Discuss Recommended Sewer System
Alternative
On Wednesday, July 19, 2006, Jefferson County hosted a public meeting at the
Jefferson County Library to provide information and take public comment on a sewerstudy being conducted in the Irondale/Port Hadlock area. The goal of the sewerstudy is to prepare a comprehensive sewer facility plan that will help the County plan
for growth in the Irondale/Port Hadlock area through the year 2030. Approximately
50 members of the community attended the public meeting.
During an informal open house period from 5:00 p.m. to 6:15 p.m., information was
posted on large boards about the sewer planning process, the sewer systemalternatives that were considered, potential locations for wastewater facilities, and
preliminary cost estimates. Public meeting attendees were encouraged to view the
information and talk with members of the project team.
Kevin Dour and Jim Santroch of TetraTech/KCM, the consultant team hired by theCounty to conduct the sewer study, presented and responded to questions about the
alternatives for the sewer system and the rationale, from a technical standpoint, forthe recommended alternative. The consultant described next steps in the decision-
making process and opportunities for public involvement.
Many questions from the public related to the cost of a sewer system, how effluentdisposal/reuse would affect groundwater, and where wastewater facilities would be
located. The consultant provided responses based on the preliminary informationthat was available.
The consultant explained that more detailed information about siting, impacts on
hydrology, and cost estimates and financing options would be developed after theselection of a preferred sewer system alternative. They said the focus of the
financing options would be on community affordability. They explained that theBoard of Jefferson County Commissioners would review the consultant team's
technical recommendation at an August 8 workshop and would then make a decisionon the preferred alternative.
The consultant team's recommendation is based on engineering feasibility,
responsiveness to community concerns, compliance with regulatory requirements,preliminary cost estimates, and environmental considerations.
To provide local input, public workshops were held to advise the sewer studyprocess. Workshop participants included County Commissioners, local agency
representatives, community leaders, and other interested parties. Over the course of
three workshops, workshop participants and the consultant team reviewed andevaluated a comprehensive array of sewer system alternatives. The workshop
participants identified their preferences for each component of the sewer system,including wastewater collection, treatment, effluent disinfection, effluent
disposal/reuse, and solids handling. The consultant team used those preferences tohelp develop the technical recommendation that was presented at the public
meeting. The workshops were advertised in advance and were open to the public.

8/14/2019 Port Hadlock Sewer Facility Plan 0908
http://slidepdf.com/reader/full/port-hadlock-sewer-facility-plan-0908 301/387
FREQUENTLY ASKED QUESTIONS
Public Meeting on P reliminary Design, Cost Estimate &
Financing Strategies
The following is a summary of public comment that the project team received at theOctober 25, 2006 public meeting. Brief responses to each topic are presented.
Preliminary Design
How much property is needed for wastew ater treatment and effluent
disposal facilities?
• The minimum footprint for the treatment facility is three acres. The
assumption is that rapid infiltration would require about three acres as well.For purposes of the sewer facility plan, it was assumed that six acres would
be needed for the treatment facility and six acres for the rapid infiltration
facility, in case buffers are needed, solids handling facilities are built, and/orredundant facilities are needed.
There have been recent sewage spills in Pou lsbo, Bremerton, and PortAngeles. The damage and cost of a sewage spill here should be considered.
• This system would be more advanced than the systems where spills have
occurred.
• Federal and state regulatory agencies have standards and guidelines to
ensure reliable wastewater treatment service. Treatment plants are requiredto have a back-up generator to ensure that plant operation is continuous. The
treatment system for the Irondale/Port Hadlock area will be subject to
additional requirements as well, since the treated effluent will be dischargedto land, and thus to groundwater.
• To build the required redundancy into the treatment system, it is necessary toconstruct either a storage pond to hold untreated wastewater or an additional
treatment train beyond the facility's intended capacity, to be used in theevent of a treatment system malfunction.
• Whether to use storage or "n plus one" treatment trains is a design judgment.The preferred sewer system alternative includes a more conservative
approach than what is required. The level of redundancy in the preferred
alternative could be scaled back if necessary.
• Pump stations are built with a duplicate pumping system and a back-up
electrical system. They are also designed so that a portable pump can beused if needed.
Are there membrane bioreactor (MBR) treatment facilities in other rural
areas in Wash ington?
• Indian tribes have done it the most in Washington State. They have built ten
MBR facilities. Alderwood Water & Wastewater District is building an MBR
facility. The oldest MBR facility in Washington is about three years old.• MBR systems have been used in Japan for over 15 years to treat toilet water.

8/14/2019 Port Hadlock Sewer Facility Plan 0908
http://slidepdf.com/reader/full/port-hadlock-sewer-facility-plan-0908 302/387
• The Department of Ecology has become interested in MBR facilities and has
offered encouragement for their use. MBR systems are becoming more
common.
• King County is building a 30 million gallon per day MBR facility at Brightwater.
The County has done a lot of research into the best type of treatment system.
Can a septic system clean to the level of Class A effluent?
• There are advanced septic systems that will treat individual home wastes to a
similar level. However, for a UGA, a proliferation of individual septic systemsis not considered an urban service.
• Septic systems that clean to this level are very expensive.
Wil l biosolids be processed by a digester before they are hauled away fromthe wastew ater treatment plant?
• The proposed method is to collect the solids in a tank and pay for a private
entity or city to process and dispose of the solids in compliance with
regulations. The consultant team considered the option of building a digesterat the Port Hadlock wastewater treatment facility, but found it would cost lessto pay someone else to handle the solids.
• This is also a way to delay the capital investment decision about building asolids handling facility until more ratepayers are connected.
• It is recommended that the solids handling method be revisited after fiveyears to reevaluate the cost comparisons when there are more customers to
share costs.
Some companies buy solid w aste for chemical or fertilizer use. Has revenuegeneration for processing biosolids been considered?
• Revenue generation would require a huge initial investment to process thesolid waste. The economy of scale does not appear to work here, although itdoes work elsewhere.
• The goal was to propose something more affordable to launch theIrondale/Port Hadlock sewer system.
• The type of system currently proposed would not preclude the community
from later pursuing revenue generation or other options.
Decision-Making Process
Who decides whether sewer customers pay a connection fee or join a UtilityLocal Improvement District (ULID)?
• This would be a decision for the County Commissioners. The Commissioners
have the ability to put the decision to a public vote, but ultimately theCommissioners would decide.
Have Washington Department of Fish and Wildlife (WDFW) and the NorthOlympic Salmon Coalition (NOSC) been consulted?

8/14/2019 Port Hadlock Sewer Facility Plan 0908
http://slidepdf.com/reader/full/port-hadlock-sewer-facility-plan-0908 303/387
• The Executive Director of NOSC has been involved in the stakeholder
workshops.
• There will be an environmental assessment and probably a StateEnvironmental Policy Act review of the preferred alternative.
• The proposed wastewater treatment system would produce clean, Class Aeffluent, removing nutrients to a greater extent than septic systems do. As far
as the project team is aware, WDFW would prefer a sewer system to septicsystems.
Are there communities that have made people connect to sewer?
• The proposed sewer project is still at the planning level. There are manypolicies still to be determined, such as who will connect and when, with many
opportunities for public input.
• Major investments have to be made in septic systems from time to time. In
some communities, people wait until they need to make a major investmentin their septic system and then connect to sewer instead.
• There are communities that have required people to connect to sewer to
increase the financial viability of the system.
At what point does the community get to vote on the project?
• That has not been decided.
Is there a mechanism to rescind the UGA designation?
• It could turn out that a sewer system is too expensive. The sewer facility planwill help provide that answer.
• It is important to remember that the population in the area will grow, and the
County's job is to manage that growth in a way that the community finds
desirable.
Cost & Financing
At what point will w e find out about grants and get hard financial facts to
help with decision-making?
• The County is beginning to explore the "art" of securing funding for theproject. A completed sewer facility plan will make the project eligible for
financial assistance, and the County will be able to apply for grants and low-interest loans. Talking to legislators about ways to support the project is also
a good idea.
• In terms of certainty, it could take from six months to two years to know howthe financing will come together.
• As with any capital project, the actual cost will not be known until the projectis completed.
Is the cost of the property needed for the treatment and disposal facilitiesincluded in the cost estimate for 2010 capi tal costs?
• Yes.
8/14/2019 Port Hadlock Sewer Facility Plan 0908
http://slidepdf.com/reader/full/port-hadlock-sewer-facility-plan-0908 304/387
Who are the competitors for grants?
• The competitors for available state and federal grants are other jurisdictions
in the State of Washington.
How can a project best be positioned to get grant funding?
• There are different qualifications for each funding program. Richard Johnson,
Jefferson County's Wastewater Manager, and members of the consultant teamwill meet with several funding program administrators at the IACC
(Infrastructure Assistance Coordinating Council) Conference in Wenatchee atthe end of October to get advice on how best to position the Port Hadlock
UGA sewer project with the funding agencies.
How can repayment of financing, other than grants, be guaranteed if notw ith compulsory participation in the sewer system?
• Specific financing policies will be determined during the implementation
phase, after the sewer facility plan is approved.• The implementation phase will proceed step-by-step, as the sewer study has,
with many opportunities for public comment and questions.
Does the cost estimate assume that the sewer system will be built now ?What will it cost if we take another ten years to come to agreement?
• The cost was estimated assuming construction in 2009 and 2010. Beyondthat, the cost would probably increase, since the price of land and other
construction costs will probably continue to rise.
Sewer Study Assumptions
The cost estimate for an Equivalent Residential Unit (ERU) includes an
assumption about the number of ERUs that would exist. Where did theassumption come from and was built-out assumed?
• The Jefferson County Planning Department provided current population
numbers as well as population estimates for 2024. Using that estimated rateof growth, the consultant team extrapolated the estimated population to the
year 2030, which is the sewer planning horizon. There will be an estimated3900 ERUs by 2030.
• Build-out is projected to occur some time after 2050, although depending onland use decisions, it may never actually occur on the ground.
Did the County's population estimates, especially for commercial grow th,
look right?
• Although the consultant team was not asked to do a full population analysis,
they did use multiple methods to backcheck the 60:40 ratio of residential to
commercial development that was used in their projections. They looked atthe current zoning of the sewer planning area, checked the ratio of

8/14/2019 Port Hadlock Sewer Facility Plan 0908
http://slidepdf.com/reader/full/port-hadlock-sewer-facility-plan-0908 305/387
commercial to residential water usage, and checked the ratio of development
in similar communities.
Public Meeting on Combined System Alternatives
The following is a summary of public comment that the project team received at the
July 19, 2006 public meeting. Brief responses to each topic are presented.
Collection System
Whether or not it makes sense to pay a higher initial investment for gravity
collection
• Gravity collection systems can last up to 50 years. Pressure sewer systemshave a shorter service life because key components (septic tanks and pumps)
have to be replaced after about 20 years. This analysis looks at a 20-yeartime span for comparison purposes, because of the 20-year planning period
required by the Growth Management Act and because pressure sewers have ashorter service life. Pressure sewers are often thought of as an inexpensive
"starter kit" for a sewer system with planned replacement after 20 years with
a gravity sewer when the area is more densely populated and there are morepeople to pay. Although this approach is more expensive in the long run, it
may be the only way a community can afford to get started. Pressure systemswill work, but people must be aware that it's a "pay-as-you-go" system and it
is less convenient because of ongoing maintenance.
• After 20 years, the total estimated system cost for gravity is lower than the
total estimated system cost for a pressure system.
Separating gray water from the wastewater stream
• A separate gray water system would likely have greater costs because of theneed for two separate systems on each property - gray water and "black"(toilet) water systems.
• Plumbing retrofits would be required within existing homes in order to
separate gray water from black water.
• Separating gray water at the home would reduce the total amount of water
conveyed within the wastewater collection system. Less water in the sewersystem would impact pipeline design parameters. For example, most gravity
collection systems are designed for a certain amount of water to wash solidsdown the pipes. Removing gray water might generate a need to build steeper
gravity collection pipes in order to keep solids moving, which would need to
be constructed deeper and thus cost more. Also, more frequent line flushing
may be required in order to dislodge solids deposited in pipelines.• Sending gray water to a wastewater treatment plant for treatment could help
prevent gray water from possibly degrading groundwater supplies.
• A septic tank and drainfield would need to be maintained for gray waterseparation. A second tank and pump would be needed if a pressurized sewer
system were installed.
• The design team acknowledges the Port Hadlock community's mandate topursue reuse options for the communities treated wastewater. Although gray
water separation can be a viable reuse option, it is viewed by the design team
8/14/2019 Port Hadlock Sewer Facility Plan 0908
http://slidepdf.com/reader/full/port-hadlock-sewer-facility-plan-0908 306/387
as less effective, more costly and less reliable than the proposed land-based
disposal/reuse option using a rapid rate infiltration system.
Treatment Alternatives
How costs compare between the membrane bioreactor (MBR) and the
sequencing batch reactor & filter (SBR)
• The total cost for MBR over 20 years could be up to 20% more than the totalcost for SBR. Since the 20 year costs associated with a MBR system account
for approximately 37% of the total costs of the sewer system, this wouldresult in an overall cost increase of around 7%.
How odor management compares among the treatment alternatives
• Although the project team has used the Port Townsend wastewater treatmentfacility as a reference for appropriate odor control and aesthetics, the City of
Port Townsend uses an oxidation ditch treatment technology and the
proposed treatment technology for Port Hadlock is an MBR. Some commentsfrom the public have indicated that a higher level of odor control may be
necessary. The County is budgeting for a wastewater treatment facility that isa good neighbor.
• There is some difference in the effort necessary to provide odor controlamong the three treatment technologies. Since SBR and MBR have smaller
areas of exposed water surface than oxidation ditches, it is less expensive tocover them and control odor for them. MBR or SBR treatment systems would
provide a better level of odor control as compared to the oxidation ditchsystem at the Port Townsend facility.
Building a storage pond vs. an additional treatment train
• There are Ecology requirement for providing redundancy so that the
treatment process has a certain level of reliability. There are two options forincluding redundancy: one is to build a single treatment train and a storage
pond, and the other is to build two treatment trains. The assumption in ourphasing plans is that two treatment trains will be built initially, storage will be
built at the first expansion, and two more treatment trains will be built at the
second expansion
Effluent Disposal/ Reuse A lternatives
Health impacts of effluent disposal
• We are planning to treat wastewater to Class A effluent levels, which is safefor reuse. It is the best quality of effluent. For Class A treatment, solids and
dissolved organics are removed, and the effluent it denitrified to a level of 1part per million and disinfected. Drinking water is allowed to have up to 10
parts per million of nitrogen.
Possibility of water reuse

8/14/2019 Port Hadlock Sewer Facility Plan 0908
http://slidepdf.com/reader/full/port-hadlock-sewer-facility-plan-0908 307/387
• The wastewater will be treated to reuse standards allowing the Port Hadlock
sewer facility to explore future reuse opportunities. For example, treated
effluent may be used to irrigate ballfields.
Solids Handling Alternatives
Whether to dewater biosolids before they are hauled away
• The biosolids would be partially stabilized before they are shipped away, butthey would not be dewatered or disinfected at that point. We have found that
there would be a tremendous initial capital investment required to doadditional dewatering and stabilization. The design team has made a strategic
call that it makes financial sense to contract out the hauling and reuse of thefacility's biosolids. This would allow the County flexibility to continue with a
contractor in the future if it remains financially viable or to later invest in
solids handling equipment when more users are connected to the wastewatersystem.
Health impacts of biosolids disposal
• One identified contractor, Kitsap Biorecycle, mixes the biosolids with lime toproduce an "artificial soil." This soil is then applied to fields and immediately
plowed under to minimize the potential for odors and pests.
Facility Siting
Potential locations of treatment and disposal/ reuse facilities
• The project team will take into consideration public concern about using the"Central Site" for wastewater treatment and/or disposal/reuse. There has
been interest expressed in keeping that property, which is near thecommercial core of Port Hadlock, available for development.
• The location of the treatment and/or effluent disposal/reuse facilities will
influence the total cost of the sewer system. Cost considerations will also betaken into account.
Effluent disposal/ reuse being used to recharge Chimacum Creek
• The project team will look carefully at the hydrology of the area to determine,among other things, whether effluent disposal/reuse would provide recharge
to Chimacum Creek
Proximity of potential disposal/ reuse sites to w ells
• and whether effluent disposal/reuse would impact any wells, such as Kivley
Well or other private wells. Also, there are regulations and required setbacksto protect wells.
Cost & Financing

8/14/2019 Port Hadlock Sewer Facility Plan 0908
http://slidepdf.com/reader/full/port-hadlock-sewer-facility-plan-0908 308/387
The schedule for developing cost estimates and financing options.
What the sewer system might cost?
How financing might work?
• Jefferson County has emphasized that constructing a sewer system in the
Irondale/Port Hadlock area must be affordable for the community. As part of
the sewer study, preliminary 20-year life cycle cost estimates have beenprepared as a way to compare sewer system alternatives. Once the Countyhas identified a preferred sewer system alternative, the consultant team will
use the preferred alternative to develop a detailed cost estimate as well as
financing options. A preferred sewer system alternative will be selected afterthe Board of County Commissioners workshop on August 8. The status of the
cost estimate and financing options will be presented at a public workshop onpreliminary design, cost, and financing options and at a public meeting in
October.
The length of time available for financing the sewer system
• The Growth Management Act requires a plan to implement the sewer systemwith a near term (6-year) and long term (20 year) plan.
What is included in the 20-year life cycle cost estimates
• The 20-year life cycle cost estimates for the sewer system include capital costfor sewers, on-site costs for connection to the sewers, wastewater treatment
(including treatment plant, disinfection, effluent disposal, and solidshandling), and the present value costs for operations and maintenance of all
facilities over 20 years.
How costs would be divided among sewer customers
• Although the cost of the sewer system per user decreases the more users
there are, the idea is to work out a financing plan whereby all users end uppaying the lower cost that would be attained with all forecasted customers
hooked up at the end of the 20-year planning period.
Sewer Planning Process
Whether the sewer planning boundary can be changed
• Making any changes to the 20-year sewer planning boundary would be apolicy decision for the community and the County. From a technical
standpoint, it is possible to alter the area that would be served by the sewersystem.
• The 6-year planning boundary is useful for planning purposes, but the actual
order in which properties connect to the sewer will be determined duringimplementation.
Whether the sewer planning boundary w ill become the urban growth areaboundary

8/14/2019 Port Hadlock Sewer Facility Plan 0908
http://slidepdf.com/reader/full/port-hadlock-sewer-facility-plan-0908 309/387
• It is presumed that the sewer planning boundary will coincide with the urban
growth area boundary. This is because urban services must be provided
within an urban growth boundary and sanitary sewers are considered a keyurban service.
How long a sewer system is anticipated to last
• Although individual components of the sewer system may have a longer or
shorter lifetime, the entire sewer system is assumed to have a 20-year life for
this comparison.
Whether everyone w ill have to connect to the sewer
• The Sewer Facility Plan must demonstrate that it will be possible for everyone
to connect to the sewer system by the end of the 20-year planning period.However, the way in which customers would be required to connect to the
sewer system will be a policy decision for the community and the County.

8/14/2019 Port Hadlock Sewer Facility Plan 0908
http://slidepdf.com/reader/full/port-hadlock-sewer-facility-plan-0908 310/387

8/14/2019 Port Hadlock Sewer Facility Plan 0908
http://slidepdf.com/reader/full/port-hadlock-sewer-facility-plan-0908 311/387
Jefferson County Department of Public Works
Port Hadlock UGA Sewer Facility Plan
APPENDIX C.
COMPARATIVE LIFE CYCLE COST ESTIMATES
September 2008

8/14/2019 Port Hadlock Sewer Facility Plan 0908
http://slidepdf.com/reader/full/port-hadlock-sewer-facility-plan-0908 312/387

8/14/2019 Port Hadlock Sewer Facility Plan 0908
http://slidepdf.com/reader/full/port-hadlock-sewer-facility-plan-0908 313/387

8/14/2019 Port Hadlock Sewer Facility Plan 0908
http://slidepdf.com/reader/full/port-hadlock-sewer-facility-plan-0908 314/387

8/14/2019 Port Hadlock Sewer Facility Plan 0908
http://slidepdf.com/reader/full/port-hadlock-sewer-facility-plan-0908 315/387

8/14/2019 Port Hadlock Sewer Facility Plan 0908
http://slidepdf.com/reader/full/port-hadlock-sewer-facility-plan-0908 316/387
Project: Port Hadlock UGA Sewer Facility Plan
Subject: Treatment System Analysis
By : Tt
Date : 11-Aug-08 Updated Unit Costs
July 2008
ENR: 8361.74
ERUs 432 ERUs 502 ERUs 584
Flow (mgd) 0.10 Flow (mgd) 0.12 Flow (mgd) 0.14
Item Description Unit cost, $ Unit Quantity Cost, $ Quantity Cost, $ Quantity Cost, $
CORE PLUS ALCOHOL
2010 2011 2012
COLLECTION - STEP SYSTEM
Operations and Maintenance Cost Estimate (per year)
Item Description
Labor $40 hr 483.8181818 $19,353 554.1244358 $22,165 635.8775661 $25,435
Septic tank pumping $300 ea 86 $25,909 100 $30,127 117 dieselDiesel oil $4.50 gal 0 $0 0 $0 0 $0
Power $0.08 kWh 117532 $8,815 136668 $10,250 158920 $11,919
Chemicals $0.00 ls 0 $0 0 $0 0 $0
Hypochlorite $0.60 lb 0 $0 0 $0 0 $0
Sodium Bisulfite $0.20 gal 0 $0 0 $0 0 $0
Polymer $3.00 lb 0 $0 0 $0 0 $0
Misc expenses allowance 0 $0 0 $0 0 $0
Total Annual Cost $54,077 $62,543 $37,354
Structural Maintenance 2% $33,143 2% $35,753 2% $38,765
Equipment replacement 4% $98,909 4% $112,361 4% $127,759
Total Annual Cost with Replacement Costs $186,128 $210,657 $203,878
= on site costs
Tetra Tech Seattle, WA

8/14/2019 Port Hadlock Sewer Facility Plan 0908
http://slidepdf.com/reader/full/port-hadlock-sewer-facility-plan-0908 317/387
Project: Port Hadlock UGA Sewer Facility Plan
Subject: Treatment System Analysis
By : Tt
Date : 11-Aug-08
July 2008
ENR: 8361.74
Item Description
COLLECTION - STEP SYSTEM
Operations and Maintenance Cost Estimate (per year)
Item Description
Labor
Septic tank pumpingDiesel oil
Power
Chemicals
Hypochlorite
Sodium Bisulfite
Polymer
Misc expenses
Total Annual Cost
Structural Maintenance
Equipment replacement
Total Annual Cost with Replacement Costs
ERUs 1067 ERUs 1241 ERUs 1443 E
Flow (mgd) 0.25 Flow (mgd) 0.30 Flow (mgd) 0.34 Flow
Quantity Cost, $ Quantity Cost, $ Quantity Cost, $ Qua
RESIDENTIAL #1 RES
2016 2017 2018
1119.489269 $44,780 1293.291982 $51,732 1495.392294 $59,816 1730
213 $64,049 248 $74,478 289 $86,604 30 $0 0 $0 0 $0
290550 $21,791 337855 $25,339 392863 $29,465 45
0 $0 0 $0 0 $0
0 $0 0 $0 0 $0
0 $0 0 $0 0 $0
0 $0 0 $0 0 $0
0 $0 0 $0 0 $0
$130,620 $151,548 $175,884
2% $72,785 2% $82,124 2% $89,608
4% $225,373 4% $259,020 4% $297,477
$428,778 $492,692 $562,968
Tetra Tech Seattle, WA

8/14/2019 Port Hadlock Sewer Facility Plan 0908
http://slidepdf.com/reader/full/port-hadlock-sewer-facility-plan-0908 318/387
Project: Port Hadlock UGA Sewer Facility Plan
Subject: Treatment System Analysis
By : Tt
Date : 11-Aug-08
July 2008
ENR: 8361.74
Item Description
COLLECTION - STEP SYSTEM
Operations and Maintenance Cost Estimate (per year)
Item Description
Labor
Septic tank pumpingDiesel oil
Power
Chemicals
Hypochlorite
Sodium Bisulfite
Polymer
Misc expenses
Total Annual Cost
Structural Maintenance
Equipment replacement
Total Annual Cost with Replacement Costs
ERUs 3069 ERUs 3568 ERUs 3666 ERUs 3768
Flow (mgd) 0.73 Flow (mgd) 0.85 Flow (mgd) 0.87 Flow (mgd) 0.90
Quantity Cost, $ Quantity Unit Cost, $ Cost, $ Quantity Cost, $ Quantity Cost, $
RESIDENTIAL AREA #3
2023 2024 2025 2026
3120.573596 $124,823 3620.181819 $144,807 3718.441072 $148,738 3819.598133 $152,784
614 $184,114 714 $214,091 733 $219,986 754 $226,0560 $0 0 $0 0 $0 0 $0
835206 $62,640 971190 $72,839 997934 $74,845 1025467 $76,910
0 $0 0 $0 0 $0 0 $0
0 $0 0 $0 0 $0 0 $0
0 $0 0 $0 0 $0 0 $0
0 $0 0 $0 0 $0 0 $0
0 $0 0 $0 0 $0 0 $0
$371,578 $431,737 $443,569 $455,750
2% $155,033 2% $180,582 2% $187,247 2% $195,364
4% $595,558 4% $687,491 4% $706,595 4% $728,592
$1,122,168 $1,299,810 $1,337,411 $1,379,70
Tetra Tech Seattle, WA

8/14/2019 Port Hadlock Sewer Facility Plan 0908
http://slidepdf.com/reader/full/port-hadlock-sewer-facility-plan-0908 319/387

8/14/2019 Port Hadlock Sewer Facility Plan 0908
http://slidepdf.com/reader/full/port-hadlock-sewer-facility-plan-0908 320/387

8/14/2019 Port Hadlock Sewer Facility Plan 0908
http://slidepdf.com/reader/full/port-hadlock-sewer-facility-plan-0908 321/387

8/14/2019 Port Hadlock Sewer Facility Plan 0908
http://slidepdf.com/reader/full/port-hadlock-sewer-facility-plan-0908 322/387
Project: Port Hadlock UGA Sewer Facility Plan
Subject: Treatment System Analysis
By : Tt
Date : 11-Aug-08 Updated Unit Costs
July 2008
ENR: 8361.74
ERUs 432 ERUs 502 ERUs 584
Flow (mgd) 0.10 Flow (mgd) 0.12 Flow (mgd) 0.14
Item Description Unit cost, $ Unit Quantity Cost, $ Quantity Cost, $ Quantity Cost, $
CORE PLUS ALCOHOL
2010 2011 2012
COLLECTION - GRAVITY SYSTEM
Operations and Maintenance Cost Estimate (per year)
Item Description
Labor $40 hr 188 $7,520 188 $7,520 188 $7,520
Septic tank pumping $300 ea $0 $0 $0Diesel oil $4.50 gal $0 $0 $0
Power $0.08 kWh 123390 $9,254 125571 $9,418 128109 $9,608
Structural Maintenance 2% $0 2% $0 2% $0
Equipment replacement 4% $0 4% $0 4% $0
Chemicals $0.00 $0 $0 $0
Hypochlorite $0.60 lb 0 $0 0 $0 0 $0
Sodium Bisulfite $0.20 gal 0 $0 0 $0 0 $0
Polymer $3.00 lb $0 $0 $0
Misc expenses allowance $0 $0 $0
Total Annual Cost $16,774 $16,938 $17,128
Structural Maintenance 2% $86,992 2% $90,385 2% $94,246
Equipment replacement 4% $41,600 4% $41,600 4% $41,600
Total Annual Cost with Replacement Costs $145,366 $148,923 $152,974
Tetra Tech Seattle, WA

8/14/2019 Port Hadlock Sewer Facility Plan 0908
http://slidepdf.com/reader/full/port-hadlock-sewer-facility-plan-0908 323/387
Project: Port Hadlock UGA Sewer Facility Plan
Subject: Treatment System Analysis
By : Tt
Date : 11-Aug-08
July 2008
ENR: 8361.74
Item Description
COLLECTION - GRAVITY SYSTEM
Operations and Maintenance Cost Estimate (per year)
Item Description
Labor
Septic tank pumpingDiesel oil
Power
Structural Maintenance
Equipment replacement
Chemicals
Hypochlorite
Sodium Bisulfite
Polymer
Misc expenses
Total Annual Cost
Structural Maintenance
Equipment replacement
Total Annual Cost with Replacement Costs
ERUs 1067 ERUs 1241 ERUs 1443 E
Flow (mgd) 0.25 Flow (mgd) 0.30 Flow (mgd) 0.34 Flow
Quantity Cost, $ Quantity Cost, $ Quantity Cost, $ Qua
RESIDENTIAL #1 RES
2016 2017 2018
260 $10,400 260 $10,400 260 $10,400 3
$0 $0 $0$0 $0 $0
251990 $18,899 257384 $19,304 263656 $19,774 32
2% $0 2% $0 2% $0
4% $0 4% $0 4% $0
$0 $0 $0
0 $0 0 $0 0 $0
0 $0 0 $0 0 $0
$0 $0 $0
$0 $0 $0
$29,299 $29,704 $30,174
2% $161,289 2% $184,934 2% $194,615
4% $57,600 4% $57,600 4% $57,600
$248,188 $272,238 $282,390
Tetra Tech Seattle, WA

8/14/2019 Port Hadlock Sewer Facility Plan 0908
http://slidepdf.com/reader/full/port-hadlock-sewer-facility-plan-0908 324/387
Project: Port Hadlock UGA Sewer Facility Plan
Subject: Treatment System Analysis
By : Tt
Date : 11-Aug-08
July 2008
ENR: 8361.74
Item Description
COLLECTION - GRAVITY SYSTEM
Operations and Maintenance Cost Estimate (per year)
Item Description
Labor
Septic tank pumpingDiesel oil
Power
Structural Maintenance
Equipment replacement
Chemicals
Hypochlorite
Sodium Bisulfite
Polymer
Misc expenses
Total Annual Cost
Structural Maintenance
Equipment replacement
Total Annual Cost with Replacement Costs
ERUs 3069 ERUs 3568 ERUs 3666 ERUs 3768
Flow (mgd) 0.73 Flow (mgd) 0.85 Flow (mgd) 0.87 Flow (mgd) 0.90
Quantity Cost, $ Quantity Unit Cost, $ Cost, $ Quantity Cost, $ Quantity Cost, $
RESIDENTIAL AREA #3
2023 2024 2025 2026
312 $12,480 416 $16,640 416 $16,640 416 $16,640
$0 $0 $0 $0$0 $0 $0 $0
368529 $27,640 492906 $36,968 495956 $37,197 499095 $37,432
2% $0 2% $0 2% $0 2% $0
4% $0 4% $0 4% $0 4% $0
$0 $0 $0 $0
0 $0 0 $0 0 $0 0 $0
0 $0 0 $0 0 $0 0 $0
$0 $0 $0 $0
$0 $0 $0 $0
$40,120 $53,608 $53,837 $54,072
2% $281,901 2% $342,064 2% $367,145 2% $393,183
4% $67,600 4% $92,600 4% $92,600 4% $92,600
$389,621 $488,272 $513,581 $539,855
Tetra Tech Seattle, WA

8/14/2019 Port Hadlock Sewer Facility Plan 0908
http://slidepdf.com/reader/full/port-hadlock-sewer-facility-plan-0908 325/387
D
e
8S
0
T H E S E C A L C U L A T I O N S U S E $ 2 5 k / A C R E
A N D A S S U M E D I S P O S A L A R E A I S O U T
S I D E T H E U G A
O
onP
I
2
HgFow1m
I
g
onaA
nmcR
eo01
g
sSoa
o5mnh
C
aC
E
m
e
Iem
D
pon
Q
y
U
U
c
$
C
$
S i t e P r o c e s s P i p i n g a n d V
5 0 0
L F
$ 6 5
$ 3 2 , 5 0 0
R S M e a n s
I n f i l t r a t i o n R a t e
g p d / s f
L a n d P u r c h a s e : S t o r a g e / 8
8 1
A c r e s
$ 2 5 , 0 0 0
$ 2 , 0 1 3 , 8 2 5
7 m o n t h s s t o r a g e
2
2 9 . 9 2 4
L a n d P u r c h a s e : D i s p o s a l /
4 5 9
A c r e s
$ 2 5 , 0 0 0
$ 1 1 , 4 7 8
, 4 2 1
U s e d 8 g p d / s f , D o u b l e d l a n d a r e a f o r
f u l l r e d u n d a n c y
0 . 1 S h o
w n i n A l e x ' S l i d e
L a n d P u r c h a s e : B u f f e r s
1 3 5
A c r e s
$ 2 5 , 0 0 0
$ 3 , 3 7 3 , 0 6 1
S t o r a g e B a s i n s - S i t e w o r
9 0 9 , 7 1 2
C Y
$ 8
$ 7 , 2 7 7 , 6 9 6
7 f e e t d e e p b a s i n , B e r m e d t o p .
S i t e P r o c e s s P i p i n g a n d V
1
L S
$ 2 5 , 0 0 0
$ 2 5 , 0 0 0
5 m o n t h s
a t 1 , 0 0 0 , 0 0 0 g p d a t 7 f e e t d e e p
E l e c t r i c a l C o n d u i t , S i t e w
1
L S
$ 1 0 , 0 0 0
$ 1 0 , 0 0 0
M o n i t o r i n g W e l l s
3
E A
$ 1 0 , 0 0 0
$ 3 0 , 0 0 0
S u b t o t a l S t r u c t u r a l
$ 2 4 , 2 4 0 , 5 0 3
W / O L a n d
M a i n P u m p S t a t i o n ( 2 . 1
0
E A
$ 5 0 0 , 0 0 0
$ 0
$ 7 , 3 7 5 , 1 9 6
M e d i u m P u m p S t a t i o n
1
E A
$ 3 7 5 , 0 0 0
$ 3 7 5 , 0
0 0
S m a l l P u m p S t a t i o n ( 0 . 0 3
0
E A
$ 2 5 0 , 0 0 0
$ 0
D i s t r i b u t i o n P i p i n g & E q
1
E A
$ 1 0 , 0 0 0
$ 1 0 , 0 0 0
S u b t o t a l E q u i p m e n t
$ 3 8 5 , 0
0 0
L a n d C o s t
T o t a l e s t i m a t e d c u r r e n t c o n s t r u c t i o n c o s t
$ 2 4 , 6 2 5 , 5 0 3
$ 1 6 , 8 6 5 , 3 0 7
E s c a l a t i o n t o t i m e o f c o n s
2 . 6 0 %
$ 6 4 0 , 2
6 3
$ 7 , 7 6 0 , 1 9 6
$ 4 3 8 , 4 9 8
T o t a l e s t i m a t e d c o n s t r u c t i o n c o s t
$ 2 5 , 2 6 5
, 7 6 7
$ 2 0 1 , 7 6 5
$ 1 7 , 3 0 3 , 8 0 5
C o n t i n g e n c y
3 0 %
$ 7 , 5 7 9 , 7 3 0
$ 7 , 9 6 1 , 9 6 1
$ 5 , 1 9 1 , 1 4 2
E n g i n e e r i n g D e s i g n
1 5 %
$ 2 , 3 3 1 , 2 5 4
L a n d C o s t s n o t i n c l u d e d
$ 0
S t o r a g e
1 5 %
$ 3 , 3 5 7 , 5 5 0 . 2 2
C o n s t r u c t i o n M a n a g e m e
1 0 %
$ 2 , 0 5 0 , 4 6 6
L a n d C o s t s n o t i n c l u d e d
D i s p o s a l
8 5 %
$ 1 9 , 1 3 7 , 3 9 6 . 6 9
S a l e s T a x
8 . 8 %
$ 1 , 8 0 4 , 4 1 0
L a n d C o s t s n o t i n c l u d e d
T o t a l E s t i m a t e d C a p i t a l C o s t
$ 3 9 , 0 3 1 , 6 2 7
$ 2 2 , 4 9 4 , 9 4 7
O
aon
a
M
nen
C
E
m
ep
y
Iem
D
pon
Q
y
U
U
C
A
C
L a b o r
1 0 4
h r
$ 3 0
$ 3 , 1 2
0
2 h r s / w e e k m a i n t e n a n c e o n p u m p s t a t i o n
P o w e r
3 2 6 6 1 7
k W h
$ 0 . 0 7
$ 2 2 , 8 6 3
1 2 h r / d a y r u n t i m e , 1 0 0 h p p u m p s t a t i o
n
S t r u c t u r a l M a i n t e n a n c e
2 %
$ 1 5 1 , 3
3 9
E q u i p m e n t r e p l a c e m e n t
4 %
$ 1 5 , 8 0 0
M i s c e x p e n s e s
a l l o w a n c e
$ 0
T o t a l A n n u a l C o s t
$ 1 9 3 , 1
2 3
P r e s e n t W o r t h F a c t o r
1 4 . 6 0 6 1
2 0 y e a r p e r i o d , 3 . 2 % d i s c o u n t f a c t o r
P r e s e n t W o r t h C o s t
$ 2 , 8 2 1 , 0 0 0
T
aP
nWo
hP
e
C
E
m
e
C a p i t a l
$ 3 9 , 0 3 1
, 6 2 7
O p e r a t i o n s a n d M a i n t e n a
n c e
$ 2 , 8 2 1 , 0 0 0
T o t a l P r e s e n t W o r t h
$ 4 1 , 8 5 2
, 6 0 0
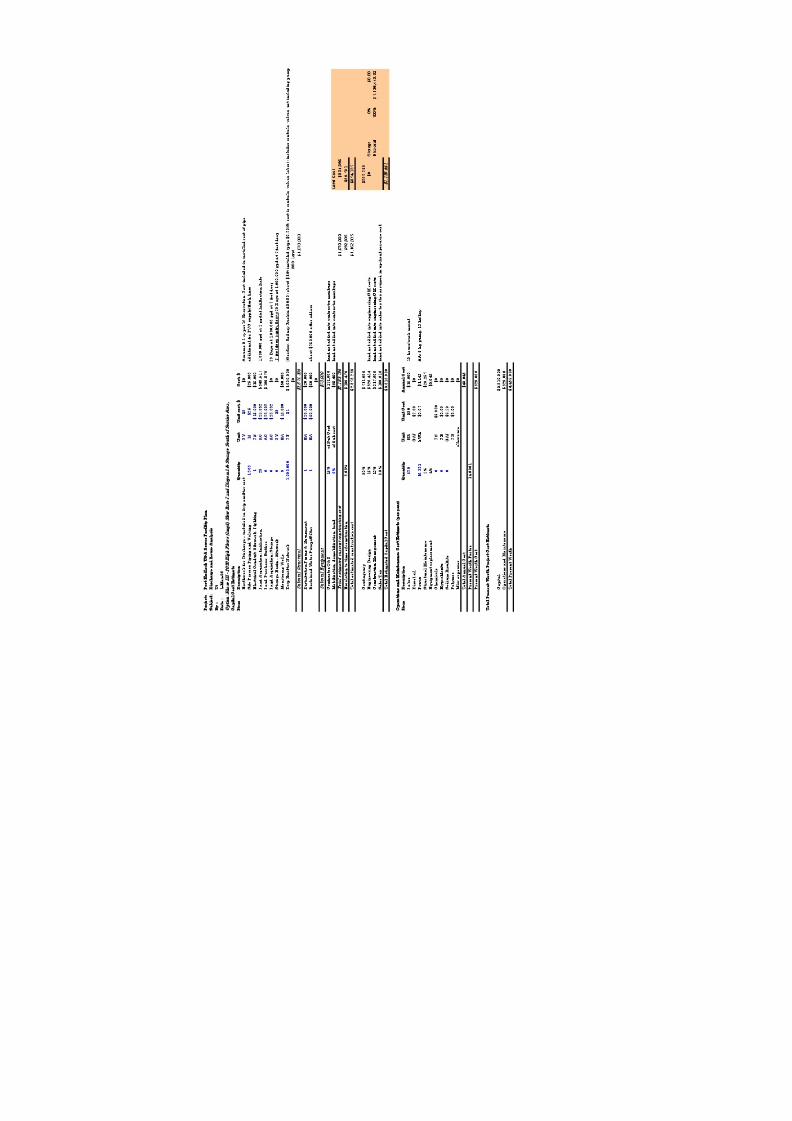
8/14/2019 Port Hadlock Sewer Facility Plan 0908
http://slidepdf.com/reader/full/port-hadlock-sewer-facility-plan-0908 326/387

8/14/2019 Port Hadlock Sewer Facility Plan 0908
http://slidepdf.com/reader/full/port-hadlock-sewer-facility-plan-0908 327/387
D
8S
0
O
o
P
I
2
HgFow1m
R
dR
L
Ds
&S
S
hoS
cA
C
aC
E
m
Im
D
po
Q
y
U
U
c
$
C
$
S i t e P r o c e s s P i p i n g a n d V a l v i n g
5 0 0
L F
$ 6 5
$ 3 2 , 5 0 0
R S M e a n s
I n f i l t r a t i o n R a t e ( i n / h r )
g p d / s f
L a n d P u r c h a s e : S t o r a g e / 8 ' D i k e / 2 0 d a y s / B u i d o u t M M F l o w s
0
A c r e s
$ 2
8 , 0 3 2
$ 0
2
2 9 . 9 2 4
L a n d P u r c h a s e : D i s p o s a l / B u i d o u t M M F
l o w s
5 . 7
A c r e s
$ 2
8 , 0 3 2
$ 1 6 0 , 8 7 9
U s e d 8 g p d / s f , D o u b l e d l a n d a r e a f o r f u l l r e d u n d a n c y
8 S h o w n i n A l e x ' S l i d e
L a n d P u r c h a s e : B u f f e r s
1
A c r e s
$ 2
8 , 0 3 2
$ 4 0 , 2 2 0
R a p i d I n f i l t r a t i o n B a s i n s - S i t e w o r k
3 7 , 0 3 7
C Y
$ 8
$ 2 9 6 , 2 9 6
S t o r a g e B a s i n s - S i t e w o r k
0
C Y
$ 8
$ 0
4 f e e t d e e p b a s i n .
S i t e P r o c e s s P i p i n g a n d V a l v i n g
1
L S
$ 2
5 , 0 0 0
$ 2 5 , 0 0 0
7 f e e t d e e p b a s i n , B e r m e d t o p
. 2 0 D a y s a t 1 , 0 0 0 , 0 0 0 g p d a t 7 f e e t d e e p
E l e c t r i c a l C o n d u i t , S i t e w o r k , L i g h t i n g
1
L S
$ 1
0 , 0 0 0
$ 1 0 , 0 0 0
M o n i t o r i n g W e l l s
3
E A
$ 1
0 , 0 0 0
$ 3 0 , 0 0 0
S u b t o t a l S t r u c t u r a l
$ 5 9 4 , 8 9
W / O L a n d
M a i n P u m p S t a t i o n ( 2 . 1 m g d )
0
E A
$ 5 0
0 , 0 0 0
$ 0
$ 3 9 3 , 7 9 6
M e d i u m P u m p S t a t i o n
1
E A
$ 3 7
5 , 0 0 0
$ 3 7 5 , 0 0 0
S m a l l P u m p S t a t i o n ( 0 . 0 3 6 m g d )
0
E A
$ 2 5
0 , 0 0 0
$ 0
D i s t r i b u t i o n P i p i n g & E q u i p m e n t
1
E A
$ 1
0 , 0 0 0
$ 1 0 , 0 0 0
S u b t o t a l E q u i p m e n t
$ 3 8 5 , 0 0 0
L a n d C o s t
T o t a l e s t i m a t e d c u r r e n t c o n s t r u c t i o n c o s t
$ 9 7 9 , 8 9
$ 2 0 1 , 0 9 9
E s c a l a t i o n t o t i m e o f c o n s t r u c t i o n
2 . 6 0 %
$ 2 5 , 4 7 7
$ 7 7 8 , 7 9 6
$ 5 , 2 2 9
T o t a l e s t i m a t e d c o n s t r u c t i o n c o s t
$ 1 , 0 0 5 , 3 7 3
$ 2 0 , 2 4 9
$ 2 0 6 , 3 2 8
C o n t i n g e n c y
3 0 %
$ 3 0 1 , 6 1 2
$ 7 9 9 , 0 4 5
$ 6 1 , 8 9 8
E n g i n e e r i n g D e s i g n
1 5 %
$ 1 6 5 , 0 9 9
$ 0
S t o r a g e
0 %
$ 0 . 0 0
C o n s t r u c t i o n M a n a g e m e n t
1 0 %
$ 1 1 0 , 0 6 6
L a n d C o s t s n o t i n c l u d e d
D i s p o s a l
1 0 0 %
$ 2 6 8 , 2 2 5 . 9 9
S a l e s T a x
8 . 8 %
$ 9 6 , 8 5 8
L a n d C o s t s n o t i n c l u d e d
T o t a l E s t i m a t e d C a p i t a l C o s t
$ 1 , 6 7 9 , 0 0 6
L a n d C o s t s n o t i n c l u d e d
$ 2 6 8 , 2 2 6
O
o
a
M
n
C
E
m
p
y
Im
D
po
Q
y
U
U
C
A
C
L a b o r
1 0 4
h r
$ 3 0
$ 3 , 1 2 0
P o w e r
3 2 6 6 1 7
k W h
$
0 . 0 7
$ 2 2 , 8 6 3
2 h r s / w e e k m a i n t e n a n c e o n p u m
p s t a t i o n
S t r u c t u r a l M a i n t e n a n c e
2 %
$ 8 , 0 8 1
1 2 h r / d a y r u n t i m e , 1 0 0 h p p u m p
s t a t i o n
E q u i p m e n t r e p l a c e m e n t
4 %
$ 1 5 , 8 0 0
M i s c e x p e n s e s
a l l o w a n c e
$ 0
T o t a l A n n u a l C o s t
$ 4 9 , 8 6 4
P r e s e n t W o r t h F a c t o r
1 4 . 6 0 6 1
P r e s e n t W o r t h C o s t
$ 7 2 8 , 0 0 0
2 0 y e a r p e r i o d , 3 . 2 % d i s c o u n t f a c t o r
T
aP
Wo
hP
e
C
E
m
C a p i t a l
$ 1 , 6 7 9 , 0 0 6
O p e r a t i o n s a n d M a i n t e n a n c e
$ 7 2 8 , 0 0 0
T o t a l P r e s e n t W o r t h
$ 2 , 4 0 7 , 0 0 0

8/14/2019 Port Hadlock Sewer Facility Plan 0908
http://slidepdf.com/reader/full/port-hadlock-sewer-facility-plan-0908 328/387
D
e
8S
0
O
onP
I
2
HgFow1m
Cn
ueW
a
2d
soa
12g
sdsp
C
aC
E
m
e
Iem
D
p
on
Q
y
U
U
c
$
C
$
S i t e P r o c e s s P i p i n g a n d V a l v i n g
5 0 0
L F
$
6 5
$ 3 2 , 5 0 0
R S M e a n s
I n f i l t r a t i o n R a t g p d / s f
L a n d P u r c h a s e : S t o r a g e / 8 ' D i k
e / 2 0 d a y s / B u i d o u t M
3
A c r e s
$ 2 5 , 0 0 0
$ 6 2 , 5 0 0
2
2 9 . 9 2 4
L a n d P u r c h a s e : W e t l a n d D i s p
o s a l / B u i d o u t M M F l o
3 8
A c r e s
$ 2 5 , 0 0 0
$ 9 5 6 , 5 3 5
U s e d 1 . 2 g p d / s f
1
. 2 S h o w n i n A l e x ' S l i d e
L a n d P u r c h a s e : B u f f e r s
1 0
A c r e s
$ 2 5 , 0 0 0
$ 2 5 4 , 7 5 9
W e t l a n d s - S i t e w o r k
1 , 6 6 6 , 6 6 7
S F
$
1 5
$ 2 5 , 0 0 0 , 0 0 0
S t o r a g e B a s i n s - S i t e w o r k
2 8 , 2 3 3
C Y
$ 8
$ 2 2 5 , 8 6 7
7 f e e t d e e p b a s i n , B e r m
e d t o p .
S i t e P r o c e s s P i p i n g a n d V a l v i n g
1
L S
$ 2 5 , 0 0 0
$ 2 5 , 0 0 0
2 0 D a y s a t 1 , 0 0 0 , 0 0 0 g p d a t 7 f e e t d e e p
E l e c t r i c a l C o n d u i t , S i t e w o r k , L i g h t i n g
1
L S
$ 1 0 , 0 0 0
$ 1 0 , 0 0 0
M o n i t o r i n g W e l l s
3
E A
$ 1 0 , 0 0 0
$ 3 0 , 0 0 0
S u b t o t a l S t r u c t u r a l
$ 2 6 , 5 9 7 , 1 6 0
W / O L a n d
M a i n P u m p S t a t i o n ( 2 . 1 m g d )
0
E A
$ 5 0
0 , 0 0 0
$ 0
$ 2 5 , 3 2 3 , 3 6 7
M e d i u m P u m p S t a t i o n
1
E A
$ 3 7
5 , 0 0 0
$ 3 7 5 , 0 0 0
S m a l l P u m p S t a t i o n ( 0 . 0 3 6 m g d )
0
E A
$ 2 5
0 , 0 0 0
$ 0
D i s t r i b u t i o n P i p i n g & E q u i p m
e n t
1
E A
$ 1 0 , 0 0 0
$ 1 0 , 0 0 0
S u b t o t a l E q u i p m e n t
$ 3 8 5 , 0 0 0
L a n d C o s t
T o t a l e s t i m a t e d c u r r e n t c o n s t r u c t i o n c o s t
$ 2 6 , 9 8 2 , 1 6 0
$ 1 , 2 7 3 , 7 9 4
E s c a l a t i o n t o t i m e o f c o n s t r u c t i o n
2 . 6 0 %
$ 7 0 1 , 5 3 6
$ 2 5 , 7 0 8 , 3 6 7
$ 3 3 , 1 1 9
T o t a l e s t i m a t e d c o n s t r u c t i o n c
o s t
$ 2 7 , 6 8 3 , 6 9 7
$ 6 6 8 , 4 1 8
$ 1 , 3 0 6 , 9 1 2
C o n t i n g e n c y
3 0 %
$ 8 , 9 2 1 , 0 7 3
$ 2 6 , 3 7 6 , 7 8 4
$ 3 9 2 , 0 7 4
E n g i n e e r i n g D e s i g n
1 5 %
$ 5 , 3 6 6 , 5 8 8
L a n d C o s t s n o t i n c l u d e d
$ 0
S t o r a g e
6 %
$ 1 0 4 , 2 0 3 . 1 3
C o n s t r u c t i o n M a n a g e m e n t
1 0 %
$ 3 , 5 7 7 , 7 2 5
L a n d C o s t s n o t i n c l u d e d
D i s p o s a l
9 4 %
$ 1 , 5 9 4 , 7 8 3 . 0 6
S a l e s T a x
8 . 8 %
$ 3 , 1 4 8 , 3 9 8
L a n d C o s t s n o t i n c l u d e d
T o t a l E s t i m a t e d C a p i t a l C o s t
$ 4 8 , 6 9 7 , 4 8 1
$ 1 , 6 9 8 , 9 8 6
O
aon
a
M
nen
C
E
m
ep
y
Iem
D
p
on
Q
y
U
U
C
A
C
L a b o r
1 0 4
h r
$
3 0
$ 3 , 1 2 0
2 h r s / w e e k m a i n t e n a n c e o n p u m p s t a t i o n
P o w e r
3 2 6 6 1 7
k W h
$ 0 . 0 7
$ 2 2 , 8 6 3
1 2 h r / d a y r u n t i m e , 1 0 0 h p
p u m p s t a t i o n
S t r u c t u r a l M a i n t e n a n c e
2 %
$ 5 1 9 , 6 3 5
E q u i p m e n t r e p l a c e m e n t
4 %
$ 1 5 , 8 0 0
M i s c e x p e n s e s
a l l o w a n c e
$ 0
T o t a l A n n u a l C o s t
$ 5 6 1 , 4 1 9
P r e s e n t W o r t h F a c t o r
1 4 . 6 0 6 1
2 0 y e a r p e r i o d , 3 . 2 % d i s c
o u n t f a c t o r
P r e s e n t W o r t h C o s t
$ 8 , 2 0 0 , 0 0 0
T
aP
n
Wo
hP
e
C
E
m
e
C a p i t a l
$ 4 8 , 6 9 7 , 4 8 1
O p e r a t i o n s a n d M a i n t e n a n c e
$ 8 , 2 0 0 , 0 0 0
T o t a l P r e s e n t W o r t h
$ 5 6 , 8 9 7 , 5 0 0
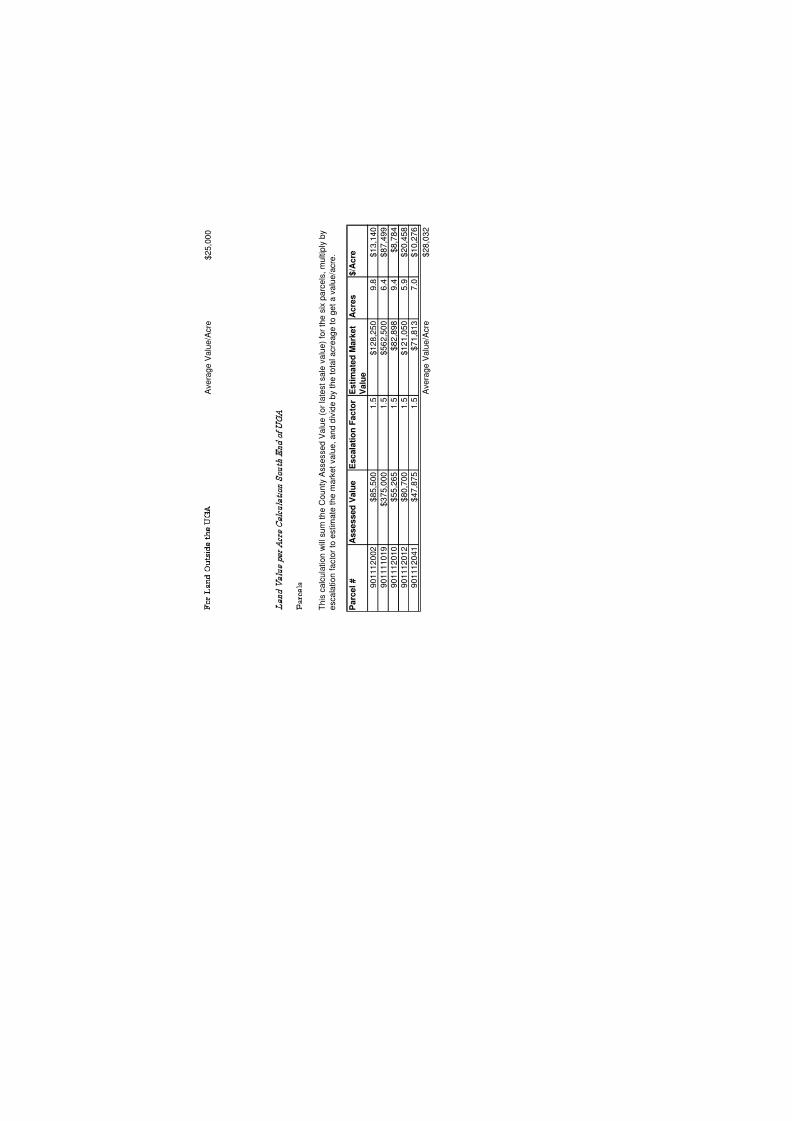
8/14/2019 Port Hadlock Sewer Facility Plan 0908
http://slidepdf.com/reader/full/port-hadlock-sewer-facility-plan-0908 329/387
F
L
O
sd
th
U
A v e r a g e V a l u e / A c r e
$ 2
5 , 0 0 0
L
V
up
A
C
cuaonSuhE
oU
P
s
P a r c e l #
A s s e s s e d
V a l u e
E s c a l a t i o n F a c t o r
E s t i m a t e d M a r k e t
A c r e s
$ / A c r e
V a l u
e
9 0 1 1 1 2 0 0 2
$ 8 5 , 5 0 0
1 . 5
$ 1 2 8 , 2 5 0
9 . 8
$ 1 3 , 1 4 0
9 0 1 1 1 1 0 1 9
$ 3 7 5 , 0 0 0
1 . 5
$ 5 6 2 , 5 0 0
6 . 4
$ 8 7 , 4 9 9
9 0 1 1 1 2 0 1 0
$ 5 5 , 2 6 5
1 . 5
$ 8 2 , 8 9 8
9 . 4
$ 8 , 7 8 4
9 0 1 1 1 2 0 1 2
$ 8 0 , 7 0 0
1 . 5
$ 1 2 1 , 0 5 0
5 . 9
$ 2 0 , 4 5 8
9 0 1 1 1 2 0 4 1
$ 4 7 , 8 7 5
1 . 5
$ 7 1 , 8 1 3
7 . 0
$ 1 0 , 2 7 6
A v e r a g e V a l u e / A c r e
$ 2 8 , 0 3 2
T h i s c a l c u l a t i o n w i l l s u m t h e C o u n t y A s s e s s e d V a l u e ( o r l a t e s t s
a l e v a l u e ) f o r t h e s i x p a r c e l s , m u l t i p l y b y
e s c a l a t i o n f a c t o r t o e s t i m a t e t h e m a r k e t v a l u e , a n d d i v i d e b y t h e
t o t a l a c r e a g e t o g e t a v a l u e / a c r e .

8/14/2019 Port Hadlock Sewer Facility Plan 0908
http://slidepdf.com/reader/full/port-hadlock-sewer-facility-plan-0908 330/387
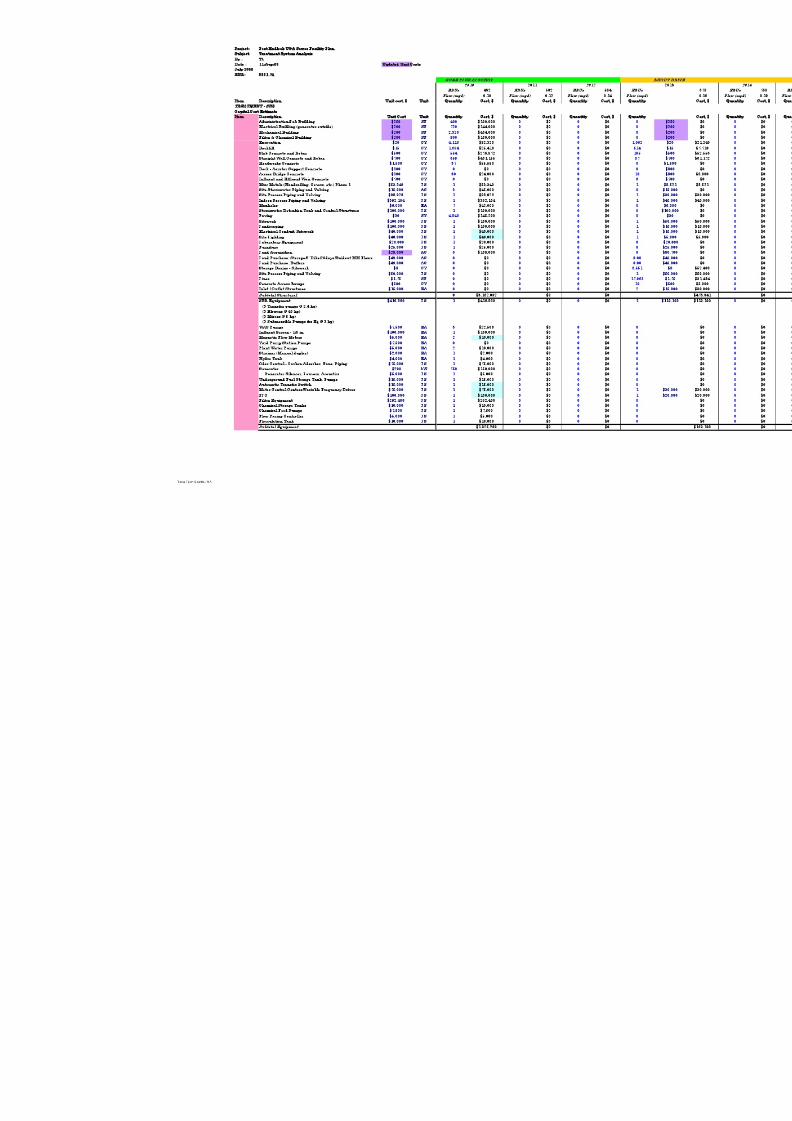
8/14/2019 Port Hadlock Sewer Facility Plan 0908
http://slidepdf.com/reader/full/port-hadlock-sewer-facility-plan-0908 331/387
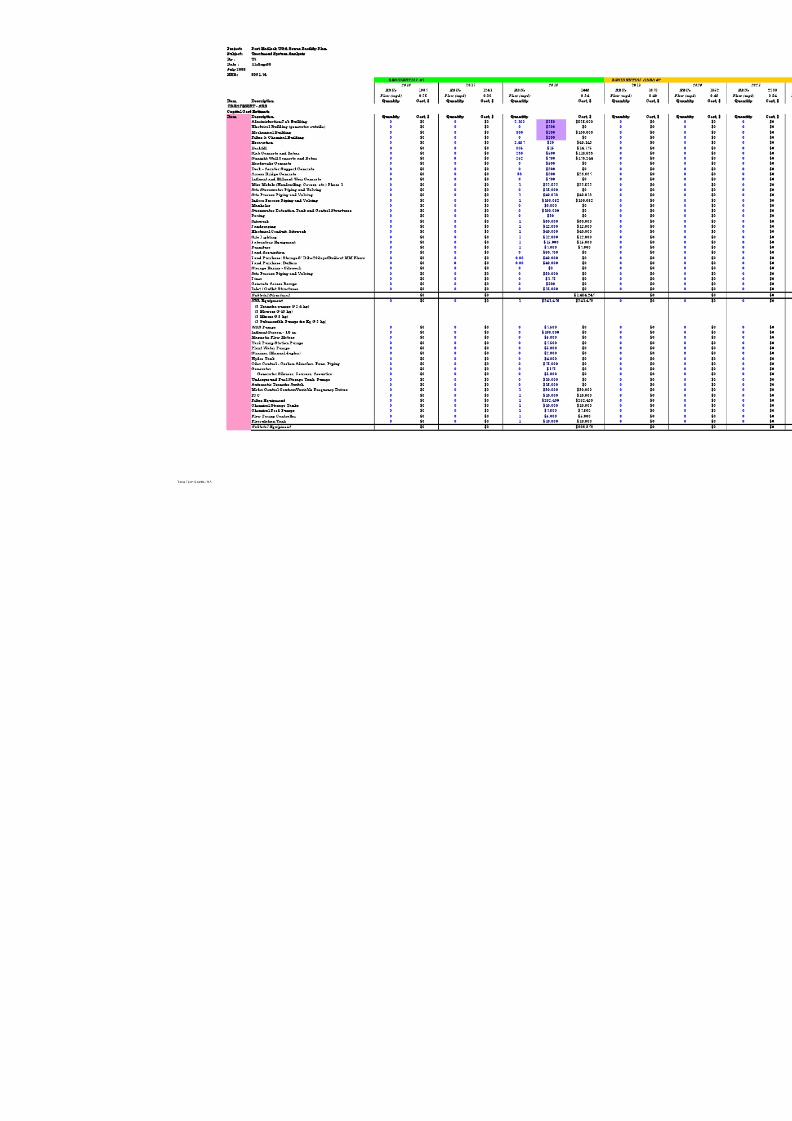
8/14/2019 Port Hadlock Sewer Facility Plan 0908
http://slidepdf.com/reader/full/port-hadlock-sewer-facility-plan-0908 332/387

8/14/2019 Port Hadlock Sewer Facility Plan 0908
http://slidepdf.com/reader/full/port-hadlock-sewer-facility-plan-0908 333/387

8/14/2019 Port Hadlock Sewer Facility Plan 0908
http://slidepdf.com/reader/full/port-hadlock-sewer-facility-plan-0908 334/387

8/14/2019 Port Hadlock Sewer Facility Plan 0908
http://slidepdf.com/reader/full/port-hadlock-sewer-facility-plan-0908 335/387

8/14/2019 Port Hadlock Sewer Facility Plan 0908
http://slidepdf.com/reader/full/port-hadlock-sewer-facility-plan-0908 336/387

8/14/2019 Port Hadlock Sewer Facility Plan 0908
http://slidepdf.com/reader/full/port-hadlock-sewer-facility-plan-0908 337/387

8/14/2019 Port Hadlock Sewer Facility Plan 0908
http://slidepdf.com/reader/full/port-hadlock-sewer-facility-plan-0908 338/387

8/14/2019 Port Hadlock Sewer Facility Plan 0908
http://slidepdf.com/reader/full/port-hadlock-sewer-facility-plan-0908 339/387
Project: Port Hadlock UGA Sewer Facility Plan
Subject: Treatment System Analysis
By : Tt
Date : 11-Aug-08
July 2008
ENR: 8361.74
Item Description
TREATMENT - MBR
Capital Cost Estimate
Structural
Administration/Lab Building
Electrical Building (generator outside)Mechanical Building
Excavation
Backfill
Headworks Concrete
Slab Concrete and Rebar
Straight Wall Concrete and Rebar
Access Bridge Concrete
Effluent Weir Concrete
Misc Metals (Handrailing, Covers, etc.)
Site Stormwater Piping and Valving
Site Process Piping and Valving
Indoor Process Piping and Valving
Membrane Bioreactor Piping and Valving
Manholes
Stormwater Detention Tank and Control Structures
Paving
Sitework
Landscaping
Electrical Conduit, Sitework
Site Lighting
Laboratory Equipment
Furniture
Land Acquisition
Land Purchase: Storage/8' Dike/20days/Buidout MM FlowsLand Purchase: Buffers
Storage Basins - Sitework
Electrical Conduit, Sitework, Lighting
Liner
Concrete Access Ramps
Inlet / Outlet Structures
Subtotal Structural
Equipment
Biological air blowers (@ 40 hp)
Blower piping
Biological air diffuser systems
Anoxic Mixers (@ 2.5 hp)
Influent Screen - 1/8 in.
Transfer Pump from Membrane to Anoxic Basin
Washer Compactor
Permeate Pumps
Redundant Influent Screen
WAS Pumps
Magnetic Flow Meters
Yard Pump Station Pumps
Plant Water Pumps
Strainer (Manual duplex)
Overhead Crane
Hydro TankOdor Control - Carbon Adsorber, Fans, Piping
Generator
Generator Silencer, Louvers, Acoustics
Underground Fuel Storage Tank, Pumps
Automatic Transfer Switch
Motor Control Centers/Variable Frequency Drives
PLC
Main Pump Station (2.1 mgd)
Medium Pump Station
Small Pump Station (0.036 mgd)
Distribution Piping & Equipment
Aspirating Aerator
Subtotal Equipment
ERUs 3069 ERUs 3568 ERUs 3666 ERUs 3768
Flow (mgd) 0.73 Flow (mgd) 0.85 Flow (mgd) 0.87 Flow (mgd) 0.90
Quantity Cost, $ Quantity Unit Cost, $ Cost, $ Quantity Cost, $ Quantity Cost, $
RESIDENTIAL AREA #3
2023 2024 2025 2026
$0 $0 $0 $0
1 $351,895 $351,895
$0 $351,895 $0 $0
Tetra Tech Seattle, WA

8/14/2019 Port Hadlock Sewer Facility Plan 0908
http://slidepdf.com/reader/full/port-hadlock-sewer-facility-plan-0908 340/387
Project: Port Hadlock UGA Sewer Facility Plan
Subject: Treatment System Analysis
By : Tt
Date : 11-Aug-08 Updated Unit Costs
July 2008
ENR: 8361.74
ERUs 432 ERUs 502 ERUs 584
Flow (mgd) 0.10 Flow (mgd) 0.12 Flow (mgd) 0.14
Item Description Unit cost, $ Unit Quantity Cost, $ Quantity Cost, $ Quantity Cost, $
CORE PLUS ALCOHOL
2010 2011 2012
Installation, Miscellaneous Mechanical of Equip 40% $854,604 $0 $140,758
Electrical of Equip 20% $427,302 $0 $70,379
Instrumentation and Control of Equip 15% $320,477 $0 $52,784
Subtotal Structural, Mechanical, Elect, I&C $6,403,375 $0 $615,816
Contractor O&P of Sub Cost 15% $960,506 $0 $92,372
Mobilization, demobilization, bond of Sub cost 6% $384,202 $0 $36,949
Total estimated current construction cost $7,748,083 $0 $745,138
Escalation to time of construction 3.50% $271,183 $0 $26,080
Total estimated construction cost $8,019,266 $0 $771,217
Contingency 30% $2,405,780 $0 $231,365
Engineering Design 15% $1,563,757 $0 $150,387
Construction Management 10% $1,042,505 $0 $100,258
Sales Tax 8.4% $875,704 $0 $84,217
Total Estimated Capital Cost $13,907,000 $0 $1,337,000
Operations and Maintenance Cost Estimate (per year)
Item Description Unit Cost Unit Quantity Annual Cost
Labor $40 HR 2,080 $83,200 2,080 $83,200 2,080 $83,200
Membrane Replacement $75 panel 0 $0 0 $0 0 $0
Diesel oil $4.50 GAL 0 $0 0 $0 0 $0
Power $0.075 kWh 173,736 $13,030 186,686 $14,001 201,745 $15,131
Other utilities (water, garbage, etc.) $1,000 month 12 $12,000 12 $12,000 12 $12,000
Chemicals - membrane cleaning $3,380 LS 2 $6,760 2 $6,760 2 $6,760
Hypochlorite $1.50 LB 0 $0 0 $0 0 $0
Laboratory Testing at Port Townsend $25.00 Test 416 $10,400 416 $10,400 416 $10,400
Polymer $3.00 LB 0 $0 0 $0 0 $0
Misc expenses allowance 0 $0 0 $0 0 $0Total Annual Cost $125,390 $126,361 $127,491
Structural Replacement 2% $53,290 2% $53,290 2% $53,290
Capital Replacement 4% $85,460 4% $85,460 4% $85,460
Total Annual Cost with Replacement Costs $264,140 $265,112 $266,241
"overhead " horsepower = 9
"overhead" power with expansion = 16
Tetra Tech Seattle, WA
TREATMENT - MBR

8/14/2019 Port Hadlock Sewer Facility Plan 0908
http://slidepdf.com/reader/full/port-hadlock-sewer-facility-plan-0908 341/387
Project: Port Hadlock UGA Sewer Facility Plan
Subject: Treatment System Analysis
By : Tt
Date : 11-Aug-08
July 2008
ENR: 8361.74
Item Description
Installation, Miscellaneous Mechanical
Electrical
Instrumentation and Control
Subtotal Structural, Mechanical, Elect, I&C
Contractor O&P
Mobilization, demobilization, bond
Total estimated current construction cost
Escalation to time of construction
Total estimated construction cost
Contingency
Engineering Design
Construction Management
Sales Tax
Total Estimated Capital Cost
Operations and Maintenance Cost Estimate (per year)
Item Description
Labor
Membrane Replacement
Diesel oil
Power
Other utilities (water, garbage, etc.)
Chemicals - membrane cleaning
Hypochlorite
Laboratory Testing at Port Townsend
Polymer
Misc expensesTotal Annual Cost
Structural Replacement
Capital Replacement
Total Annual Cost with Replacement Costs
"overhead" horsepower =
"overhead" power with expansion =
ERUs 1067 ERUs 1241 ERUs 1443 E
Flow (mgd) 0.25 Flow (mgd) 0.30 Flow (mgd) 0.34 Flow
Quantity Cost, $ Quantity Cost, $ Quantity Cost, $ Qua
RESIDENTIAL #1 RES
2016 2017 2018
$0 $0 $503,757
$0 $0 $251,878
$0 $0 $188,909
$0 $0 $4,091,946
$0 $0 $613,792
$0 $0 $245,517
$0 $0 $4,951,255
$0 $0 $173,294
$0 $0 $5,124,549
$0 $0 $1,537,365
$0 $0 $999,287
$0 $0 $666,191
$0 $0 $559,601
$0 $0 $8,887,000
2,080 $83,200 3,796 $151,840 3,796 $151,840 3
400 $30,000 400 $30,000 800 $60,000 8
0 $0 0 $0 0 $0
290,825 $21,812 323,555 $24,267 406,508 $30,488 40
12 $12,000 12 $12,000 12 $12,000
2 $6,760 3 $10,140 3 $10,140
0 $0 0 $0 0 $0
416 $10,400 416 $10,400 416 $10,400 4
0 $0 0 $0 0 $0
0 $0 0 $0 0 $0$164,172 $238,647 $274,868
2% $53,290 2% $53,290 2% $91,050
4% $85,460 4% $85,460 4% $135,836
$302,922 $377,397 $501,754
Tetra Tech Seattle, WA
TREATMENT - MBR

8/14/2019 Port Hadlock Sewer Facility Plan 0908
http://slidepdf.com/reader/full/port-hadlock-sewer-facility-plan-0908 342/387

8/14/2019 Port Hadlock Sewer Facility Plan 0908
http://slidepdf.com/reader/full/port-hadlock-sewer-facility-plan-0908 343/387
Project: Port Hadlock Facilities Plan
Subject: Disinfection Analysis
By : Tt
Date : 7-Apr-03
Ultraviolet Disinfection + Liquid Hypochlorite for Residual
Capital Cost Estimate
Item Description Quantity Unit Unit cost, $ Cost, $Building enclosure for equipment 100 SF $100 $10,000
Slab Concrete and Rebar 22 CY $300 $6,667 10*30 dual channels
Straight Wall Concrete and Rebar 36 CY $400 $14,222
Misc Metals (Handrailing, Covers, etc.) 1 LS $5,000 $5,000
Misc Concrete (NaOCl secondary containment) 5 CY $500 $2,500
Site Process Piping and Valving 1 LS $20,000 $20,000
Sitework 1 LS $10,000 $10,000
Electrical Conduit, Sitework 1 LS $10,000 $10,000
Site Lighting 1 LS $20,000 $20,000
Jib Crane for UV Unit 1 LS $5,000 $5,000
$0
Subtotal Structural $103,389
Lamps and Equipment with installation 1 ea $100,000 $100,000
Additional Generator Capacity - for UV and add. 65 kW $200 $12,948
Storage Tank (3-55 gal drums) 3 ea $200 $600
Pumps w/ installation (hypo) 2 ea $2,500 $5,000
Tank Mixers 1 ea $1,000 $1,000
Feed Pacing Controller 1 ea $2,500 $2,500
Chemical Flow Meter 1 ea $2,000 $2,000
$0
Subtotal Equipment $124,048 Installation, Miscellaneous Mechanical 40% of Equip $49,619
Electrical 20% of Equip $24,810
Instrumentation and Control 15% of Equip $18,607
Subtotal Structural, Mechanical, Elect, I&C $320,474
Contractor O&P 15% of Sub Cost $48,071
Mobilization, demobilization, bond 6% of Sub cost $19,228
Total estimated current construction cost $387,773
Escalation to time of construction 2.60% $10,082
Total estimated construction cost $397,855
Dollars per gallon $0.80
Costs for 1 MGD $795,710
Escalated ENR to 8500 $845,971
Contingency 30% $253,791
Engineering Design 15% $164,964
Construction Management 10% $109,976
Sales Tax 8.3% $91,280
Total Estimated Capital Cost $1,466,000
Operations and Maintenance Cost Estimate (per year)
Item Description Quantity Unit Unit Cost Annual Cost
Labor 208 hr $30 $6,240 2 hours / week to clean. Double for 1 MG
Septic tank pumping 0 ea $300 $60
Diesel oil gal $2.00 $0
Power 30417 kWh $0.07 $2,129 0.5 mgd, 40 gpm/lamp, 200 watts/lamp, 24 hrs/day. D ouble for
Structural Maintenance 2% $2,122
Equipment replacement 4% $5,091
Chemicals $0.00 $0
Hypochlorite 1522 lb $0.60 $913 0.5 mgd, 0.5 mg/l dose. Double for 1 MG
Sodium Bisulfite 0 gal $0.20 $0
Polymer lb $3.00 $0
Structural Replacement 2% $2,068
Equipment replacement 4% $4,962
Misc expenses allowance $0
Total Annual Cost $23,585
Present Worth Factor 14.6061
Present Worth Cost $344,000
Total Present Worth Project Cost Estimate
Capital $1,466,000
Operations and Maintenance $344,000
Total Present Worth $1,810,000
Tetra Tech Seattle, WA

8/14/2019 Port Hadlock Sewer Facility Plan 0908
http://slidepdf.com/reader/full/port-hadlock-sewer-facility-plan-0908 344/387
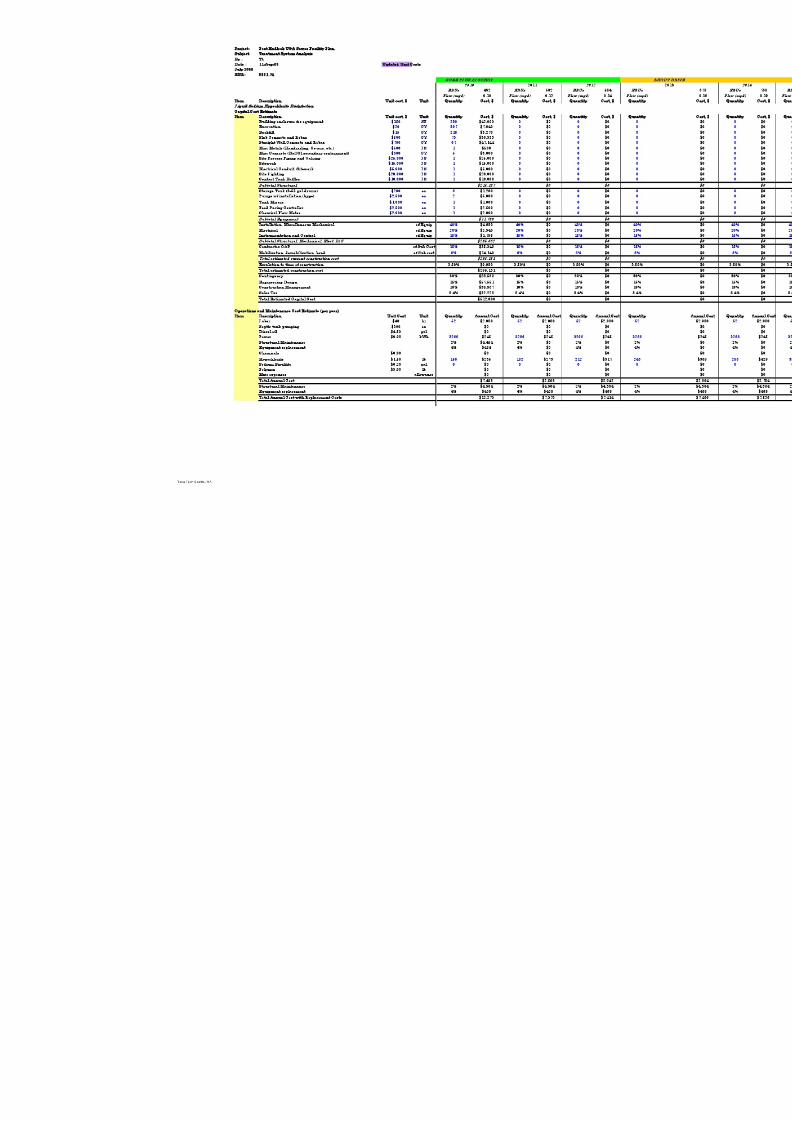
8/14/2019 Port Hadlock Sewer Facility Plan 0908
http://slidepdf.com/reader/full/port-hadlock-sewer-facility-plan-0908 345/387

8/14/2019 Port Hadlock Sewer Facility Plan 0908
http://slidepdf.com/reader/full/port-hadlock-sewer-facility-plan-0908 346/387

8/14/2019 Port Hadlock Sewer Facility Plan 0908
http://slidepdf.com/reader/full/port-hadlock-sewer-facility-plan-0908 347/387

8/14/2019 Port Hadlock Sewer Facility Plan 0908
http://slidepdf.com/reader/full/port-hadlock-sewer-facility-plan-0908 348/387

8/14/2019 Port Hadlock Sewer Facility Plan 0908
http://slidepdf.com/reader/full/port-hadlock-sewer-facility-plan-0908 349/387
Project: Port Hadlock Facilities Plan
Subject: Solids Handling Analysis
By : Tt
Date : 29-Aug-08
Membrane Bioreactors with raw sludge wasting
Capital Cost Estimate
Item Description Quantity Unit Unit cost, $ Cost, $
Site Process Piping and Valving 1 LS $4,000 $4,000
Sitework 1 LS $10,000 $10,000
Landscaping 1 LS $0
Subtotal Structural $14,000
Sludge storage
Steel 10k gallon sludge holding tank 1 EA $20,000 $20,000
Subtotal Equipment $20,000
Installation, Miscellaneous Mechanical 40% of Equip $8,000Electrical 25% of Equip $5,000
Instrumentation and Control 15% of Equip $3,000
Subtotal Structural, Mechanical, Elect, I&C $50,000
Contractor O&P 15% of Sub Cost $7,500
Mobilization, demobilization, bond 6% of Sub cost $3,000
Total estimated current construction cost $60,500
Escalation to time of construction 3.50% $2,118
Total estimated construction cost $62,618
Contingency 30% $18,785
Engineering Design 15% $12,210
Construction Management 10% $8,140
Sales Tax 8.3% $6,756
Total Estimated Capital Cost $109,000
Operations and Maintenance Cost Estimate (per year)
Item Description Quantity Unit Unit Cost Annual Cost
Labor 183 HR $40 $7,300
Membrane Replacement 0 panel $75 $0
Diesel oil GAL $2.50 $0
Power 0 kWh $0.075 $0
Structural Maintenance 2% $290
Equipment replacement 4% $828
Misc expenses allowance $0
Sludge hauling and disposal 1,770,615 GAL $0.12 $212,474
Total Annual Cost $220,892
20 year P/A Factor 20.00Present Worth Cost $4,418,000
Total Present Worth Project Cost Estimate
Capital $109,000
Operations and Maintenance $4,418,000
Total Present Worth $4,527,000
Tetra Tech Seattle, WA

8/14/2019 Port Hadlock Sewer Facility Plan 0908
http://slidepdf.com/reader/full/port-hadlock-sewer-facility-plan-0908 350/387
Project: Port Hadlock Facilities Plan
Subject: Solids Handling Analysis
By : Tt
Date : 29-Aug-08
Membrane Bioreactors With Dewatering
Capital Cost Estimate
Item Description Quantity Unit Unit cost, $ Cost, $
Administration/Lab Building 0 SF $200 $0
Electrical Building (generator outside) 0 SF $150 $0
Mechanical Building 150 SF $150 $22,500
Dewatering and sludge truck loading building 1,000 SF $150 $150,000
Sludge Truck Loading Roofed Area 600 SF $50 $30,000
Slab Concrete and Rebar 24 CY $500 $11,963
Straight Wall Concrete and Rebar 48 CY $700 $33,496
excavation 676 CY $20 $13,520
backfill 601 CY $15 $9,020
Site Process Piping and Valving 1 LS $30,761 $30,761
Indoor Process Piping and Valving 1 LS $51,269 $51,269
Sitework 1 LS $120,000 $120,000
Landscaping 1 LS $0
Subtotal Structural $492,529
WAS holding tank
Blower 2 EA $10,000 $20,000
Diffusser with piping 2 EA $10,000 $20,000
Decant pump 0 EA $10,000
Thickener Facilities
Belt Filter Press, w/control panel 1 EA $250,000 $250,000
Compressor, water boaster pump 1 EA $5,000 $5,000
Dewatering Sludge Conveyor 32 LF $1,000 $32,000
Odor Control Scrubber 1 EA $52,800 $52,800
Sludge Pump 2 EA $9,105 $18,210
Polymer Feed System 1 EA $12,140 $12,140
HVAC for buildings $0
Subtotal Equipment $410,150
Installation, Miscellaneous Mechanical 40% of Equip $164,060
Electrical 25% of Equip $102,538
Instrumentation and Control 15% of Equip $61,523
Subtotal Structural, Mechanical, Elect, I&C $1,230,799
Contractor O&P 15% of Sub Cost $184,620
Mobilization, demobilization, bond 6% of Sub cost $73,848
Total estimated current construction cost $1,489,267
Escalation to time of construction 3.50% $52,124
Total estimated construction cost $1,541,391
Contingency 30% $462,417
Engineering Design 15% $300,571
Construction Management 10% $200,381
Sales Tax 8.3% $166,316
Total Estimated Capital Cost $2,671,000
Operations and Maintenance Cost Estimate (per year)
Item Description Quantity Unit Unit Cost Annual Cost
Labor 590 HR $40 $23,608
Diesel oil GAL $2.50 $0
Power 22,133 kWh $0.075 $1,660
Structural Maintenance 2% $10,195
Equipment replacement 4% $16,980
Chemicals - membrane cleaning 0 LS $2,000 $0
Hypochlorite 0 LB $0.60 $0
Sodium Bisulfite 0 GAL $0.20 $0
Polymer 2,215 LB $3.00 $6,645
Misc expenses allowance $0
Sludge hauling and disposal 165,995 GAL $0.25 $41,499
Total Annual Cost $100,588
20 year P/A Factor 20.00
Present Worth Cost $2,012,000
Total Present Worth Project Cost Estimate
Capital $2,671,000
Operations and Maintenance $2,012,000
Total Present Worth $4,683,000
Tetra Tech Seattle, WA

8/14/2019 Port Hadlock Sewer Facility Plan 0908
http://slidepdf.com/reader/full/port-hadlock-sewer-facility-plan-0908 351/387
Project: Port Hadlock Facilities Plan
Subject: Solids Handling Analysis
By : Tt
Date : 29-Aug-08
Membrane Bioreactors With Thickener
Capital Cost EstimateItem Description Quantity Unit Unit cost, $ Cost, $
Administration/Lab Building 0 SF $200 $0
Electrical Building (generator outside) 0 SF $150 $0
Mechanical Building 150 SF $150 $22,500
Filter & Chemical Building 650 SF $150 $97,500
Slab Concrete and Rebar 24 CY $500 $11,963
Straight Wall Concrete and Rebar 48 CY $700 $33,496
excavation 676 CY $20 $13,520
backfill 601 CY $15 $9,020
Site Process Piping and Valving 1 LS $13,926 $13,926
Indoor Process Piping and Valving 1 LS $23,210 $23,210
Sitework 1 LS $60,000 $60,000
Landscaping 1 LS $0
Subtotal Structural $305,135
WAS holding tank
Blower 1 EA $20,000 $10,000
Diffuser with piping 1 EA $20,000 $10,000
Decant pump 0 EA $10,000
Thickener Facilities
Screw Press Thickerner 1 EA $54,630 $54,630
Odor Control Scrubber 1 EA $60,700 $60,700
Sludge Pump 2 EA $9,105 $18,210
Polymer Feed System 1 EA $12,140 $12,140
HVAC for buildings $0
Thickened sludge storage
Steel 10k gallon sludge holding tank 1 EA $20,000 $20,000
Subtotal Equipment $185,680
Installation, Miscellaneous Mechanical 40% of Equip $74,272
Electrical 25% of Equip $46,420
Instrumentation and Control 15% of Equip $27,852
Subtotal Structural, Mechanical, Elect, I&C $639,359
Contractor O&P 15% of Sub Cost $95,904
Mobilization, demobilization, bond 6% of Sub cost $38,362
Total estimated current construction cost $773,625
Escalation to time of construction 3.50% $27,077
Total estimated construction cost $800,702
Contingency 30% $240,210
Engineering Design 15% $156,137
Construction Management 10% $104,091
Sales Tax 8.3% $86,396
Total Estimated Capital Cost $1,388,000
Operations and Maintenance Cost Estimate (per year)
Item Description Quantity Unit Unit Cost Annual Cost
Labor 590 HR $40 $23,608
Diesel oil GAL $2.50 $0
Power 17,706 kWh $0.075 $1,328
Structural Maintenance 2% $6,316
Equipment replacement 4% $7,687
Hypochlorite 0 LB $0.60 $0
Sodium Bisulfite 0 GAL $0.20 $0
Polymer 1,108 LB $3.00 $3,323
Misc expenses allowance $0Sludge hauling and disposal 663,981 GAL $0.20 $132,796
Total Annual Cost $175,058
20 year P/A Factor 20.00
Present Worth Cost $3,501,000
Total Present Worth Project Cost Estimate
Capital $1,388,000
Operations and Maintenance $3,501,000
Total Present Worth $4,889,000
Tetra Tech Seattle, WA

8/14/2019 Port Hadlock Sewer Facility Plan 0908
http://slidepdf.com/reader/full/port-hadlock-sewer-facility-plan-0908 352/387
Alternative 1 Alternative 2 Alternative 3 Alternative 4 Alternative 5
Unthickened sludge to PortTownsend
Unthickened sludge toBiocycle
Unthickened sludgeto Port Angeles
Thickening and to PortTownsand
Thickening anddigested to PortTownsand
Capital $147,649 $147,649 $147,649 $801,649Annual O&M $150,295 $50,098 $91,847 $64,710
PW O&MTotal PW
WAS gpd ppd Alternative 1 Alternative 2 Alternative 3
2010 1,144 191 tipping and hauling $0.36 $0.12 $0.222020 3,681 6142030 11,849 1,976
TANK
tank volume (ft3) 1337 dimension 18 19 20 under ground 12wall concrete (cy) 95 cost $37,956slab concrete (cy) 34 cost $10,267excavation (cy) 1199 cost $17,982
disposal (cy) 205 cost $3,080backfill (cy) 993 cost $29,804diffusers 2 cost $48,560 unit cost from coupeville $20,000blowers 2 cost unit cost from coupeville $20,000Total $147,649
THICKENER
total cost $654,000 coupeville alternative 1screw press capacit(gpm) 50 coupeville
2010
Alternative 1 Alternative 2 Alternative 3 Alternative 4 Alternative 510k gal holding tank $147,649 $147,649 $147,649 $147,649 $147,649
thickener $654,000total capital cost $147,649 $147,649 $147,649 $801,649hauling and tipping fee $150,295 $50,098 $91,847 $56,361labor (included in fee) $8,350power (included in fee)equipment replacement (included in fee)
chemicals (included in fee)total O&M cost $150,295 $50,098 $91,847 $64,71020-yr. O&M Cost $3,005,903 $1,001,968 $1,836,941 $866,359 $0
20-year Life CycleCost $3,153,551.69 $1,149,616.49 $1,984,589.49
Tetra Tech Seattle, WA

8/14/2019 Port Hadlock Sewer Facility Plan 0908
http://slidepdf.com/reader/full/port-hadlock-sewer-facility-plan-0908 353/387
Date : 8-Sep-08
Capital Cost Estimate
Item Description Quantity Unit Unit cost, $ Cost, $
12" DIP Force Main Overland (10' to 12' deep) 9,000 LF $65 $585,000 RS MeansDewatering 1 LS $50,000 $50,000
Aphalt Surface Restoration 2,583 SY $30 $77,500 RS Means Assumes 3-foot trench restorationGravel Surface Restoration 1,667 SY $10 $16,667 RS Means Assumes 3-foot trench restorationLand Purchase: Disposal/Buidout MM Flows 5.7 Acres $28,032 $160,879
Land Purchase: Treatment 4.0 Acres $28,032 $112,126
Land Purchase: Buffers 2 Acres $28,032 $68,251
Site Process Piping and Valving 1 LS $25,000 $25,000
Electrical Conduit, Sitework, Lighting 1 LS $10,000 $10,000
Monitoring Wells 3 EA $10,000 $30,000
Subtotal Structural $1,135,424 W/O Land
Main Pump Station (2.1 mgd) 0 EA $500,000 $0 $794,167Medium Pump Station 1 EA $375,000 $375,000
Small Pump Station (0.036 mgd) 0 EA $250,000 $0
Distribution Piping & Equipment 1 EA $10,000 $10,000
Reclaimed Water Pumps/Filter 1 EA $50,000 $50,000
Subtotal Equipment $435,000
Total estimated current construction cost $1,570,424
Escalation to time of construction 2.60% $40,831 $1,229,167
Total estimated construction cost $1,611,255 $31,958
Contingency 30% $483,376 $1,261,125Engineering Design 15% $261,675
Construction Management 10% $174,450 Land Costs not included
Sales Tax 8.8% $153,516 Land Costs not includedTotal Estimated Capital Cost $2,684,273 Land Costs not included
Operations and Maintenance Cost Estimate (per year)
Item Description Quantity Unit Unit Cost Annual Cost
Labor 104 hr $30 $3,120 2hrs/week maintenance on pump stationPower 244962 kWh $0.07 $17,147 12hr/day run time, 75hp pump stationStructural Maintenance 2% $23,299
Equipment replacement 4% $17,852
Misc expenses allowance $0
Total Annual Cost $61,419
Present Worth Factor 20.0000 20year period, 3.2% discount factor
Present Worth Cost $1,228,000
Total Present Worth Project Cost Estimate
Capital $2,684,273
Operations and Maintenance $1,228,000
Total Present Worth $3,912,300
Option: Rapid Rate Surface Percolation Land App lication at East Jefferson Little League/Sheriff's Ballfields, Pump from N ess'
Corner Rd. and Shotwell Rd., 1.77 mgd MM Buildout Flows

8/14/2019 Port Hadlock Sewer Facility Plan 0908
http://slidepdf.com/reader/full/port-hadlock-sewer-facility-plan-0908 354/387
Date : 8-Sep-08
Capital Cost Estimate
Item Description Quantity Unit Unit cost, $ Cost, $
12" DIP Force Main Overland (10' to 12' deep) 11,000 LF $65 $715,000 RS Means
Dewatering 1 LS $50,000 $50,000
Aphalt Surface Restoration 13,000 SY $30 $390,000 RS Means Assumes Full 12-foot restoratio
Gravel Surface Restoration 1,667 SY $10 $16,667 RS MeansLand Purchase: Storage/15' Dike/20days/Buidout MM 11 Acres $25,000 $275,000 Assumes Tigher Soils
Land Purchase: Treatment 4 Acres $25,000 $100,000
Land Purchase: Buffers 4 Acres $25,000 $93,750
Site Process Piping and Valving 1 LS $25,000 $25,000
Electrical Conduit, Sitework, Lighting 1 LS $10,000 $10,000
Monitoring Wells 3 EA $10,000 $30,000
Subtotal Structural $1,705,417 W/O Land
Main Pump Station (2.1 mgd) 1 EA $500,000 $500,000 $1,236,667
Medium Pump Station 0 EA $375,000 $0
Small Pump Station (0.036 mgd) 0 EA $250,000 $0
Distribution Piping & Equipment 1 EA $10,000 $10,000
Reclaimed Water Pumps/Filter 1 EA $50,000 $50,000
Subtotal Equipment $560,000
Total estimated current construction cost $2,265,417
Escalation to time of construction 2.60% $58,901 $1,796,667
Total estimated construction cost $2,324,318 $46,713
Contingency 30% $697,295 $1,843,380
Engineering Design 15% $381,101
Construction Management 10% $254,068 Land Costs not includedSales Tax 8.8% $223,579 Land Costs not included
Total Estimated Capital Cost $3,880,361 Land Costs not included
Operations and Maintenance Cost Estimate (per year)
Item Description Quantity Unit Unit Cost Annual Cost
Labor 104 hr $30 $3,120 20year period, 3.2% discount factor
Power 326617 kWh $0.07 $22,863 12hr/day run time, 75hp pump stationStructural Maintenance 2% $34,995
Equipment replacement 4% $22,982
Misc expenses allowance $0
Total Annual Cost $83,961
Present Worth Factor 20.0000
Present Worth Cost $1,679,000
Total Present Worth Project Cost Estimate
Capital $3,880,361
Operations and Maintenance $1,679,000
Total Present Worth $5,559,400
Option: Rapid Rate Surface Percolation Land Application adjacent to H.J. Carroll Park, Pump from Ness' Corner Rd.
and Shotwell Rd., 1.77 mgd MM Buildout Flows

8/14/2019 Port Hadlock Sewer Facility Plan 0908
http://slidepdf.com/reader/full/port-hadlock-sewer-facility-plan-0908 355/387
Capital Cost Estimate
Item Description Quantity Unit Unit cost, $ Cost, $
12" DIP Force Main Overland (10' to 12' deep) 3,600 LF $65 $234,000 RS MeansDewatering 1 LS $50,000 $50,000
Aphalt Surface Restoration 783 SY $30 $23,500 RS Means Assumes 3-foot trench restorationGravel Surface Restoration 1,667 SY $10 $16,667 RS Means Assumes 3-foot trench restorationLand Purchase: Disposal/Buidout MM Flows 5.7 Acres $28,032 $160,879
Land Purchase: Treatment 4.0 Acres $28,032 $112,126
Land Purchase: Buffers 2 Acres $28,032 $68,251
Site Process Piping and Valving 1 LS $25,000 $25,000
Electrical Conduit, Sitework, Lighting 1 LS $10,000 $10,000
Monitoring Wells 3 EA $10,000 $30,000
Subtotal Structural $730,424 W/O Land
Main Pump Station (2.1 mgd) 0 EA $500,000 $0 $389,167Medium Pump Station 1 EA $375,000 $375,000
Small Pump Station (0.036 mgd) 0 EA $250,000 $0
Distribution Piping & Equipment 1 EA $10,000 $10,000
Reclaimed Water Pumps/Filter 1 EA $50,000 $50,000
Subtotal Equipment $435,000
Total estimated current construction cost $1,165,424
Escalation to time of construction 2.60% $30,301 $824,167
Total estimated construction cost $1,195,725 $21,428
Contingency 30% $358,717 $845,595Engineering Design 15% $180,647
Construction Management 10% $120,431 Land Costs not includedSales Tax 8.8% $105,979 Land Costs not included
Total Estimated Capital Cost $1,961,500 Land Costs not included
Operations and Maintenance Cost Estimate (per year)
Item Description Quantity Unit Unit Cost Annual Cost
Labor 104 hr $30 $3,120 2hrs/week maintenance on pump stationPower 244962 kWh $0.07 $17,147 12hr/day run time, 75hp pump stationStructural Maintenance 2% $14,988
Equipment replacement 4% $17,852
Misc expenses allowance $0
Total Annual Cost $53,108
Present Worth Factor 20.0000 20year period, 3.2% discount factor
Present Worth Cost $1,062,000
Total Present Worth Project Cost Estimate
Capital $1,961,500
Operations and Maintenance $1,062,000
Total Present Worth $3,023,500
Option: Rapid Rate Surface Percolation Land Application at Central Site near Hunt/Mason Rds., Pump from Ness' Corner Rd.
and Shotwell Rd., 1.77 mgd MM Buildout Flows

8/14/2019 Port Hadlock Sewer Facility Plan 0908
http://slidepdf.com/reader/full/port-hadlock-sewer-facility-plan-0908 356/387
Date : 8-Sep-08
Capital Cost Estimate
Item Description Quantity Unit Unit cost, $ Cost, $
12" DIP Force Main Overland (10' to 12' deep) 12,500 LF $65 $812,500 RS Means
Dewatering 1 LS $50,000 $50,000
Aphalt Surface Restoration 15,000 SY $30 $450,000 RS Means Assumes Full 12-foot restoration along Rhody DriveGravel Surface Restoration 1,667 SY $10 $16,667 RS Means
Land Purchase: Storage/15' Dike/20days/Buidout MM Fl ows 11 Acres $25,000 $275,000 Assumes Tigher soils
Land Purchase: Treatment 4 Acres $25,000 $100,000
Land Purchase: Buffers 4 Acres $25,000 $93,750
Site Process Piping and Valving 1 LS $25,000 $25,000
Electrical Conduit, Sitework, Lighting 1 LS $10,000 $10,000
Monitoring Wells 3 EA $10,000 $30,000
Subtotal Structural $1,862,917 W/O Land
Main Pump Station (2.1 mgd) 1 EA $500,000 $500,000 $1,394,167Medium Pump Station 0 EA $375,000 $0
Small Pump Station (0.036 mgd) 0 EA $250,000 $0
Distribution Piping & Equipment 1 EA $10,000 $10,000
Reclaimed Water Pumps/Filter 1 EA $50,000 $50,000
Subtotal Equipment $560,000
Total estimated current construction cost $2,422,917
Escalation to time of construction 2.60% $62,996 $1,954,167
Total estimated construction cost $2,485,913 $50,808
Contingency 30% $745,774 $2,004,975Engineering Design 15% $412,612
Construction Management 10% $275,075 Land Costs not includedSales Tax 8.8% $242,066 Land Costs not included
Total Estimated Capital Cost $4,161,439 Land Costs not included
Operations and Maintenance Cost Estimate (per year)
Item Description Quantity Unit Unit Cost Annual Cost
Labor 104 hr $30 $3,120 20year period, 3.2% discount factor
Power 326617 kWh $0.07 $22,863 12hr/day run time, 100hp pump station
Structural Maintenance 2% $38,227
Equipment replacement 4% $22,982
Misc expenses allowance $0
Total Annual Cost $87,193
Present Worth Factor 20.0000
Present Worth Cost $1,744,000
Total Present Worth Project Cost Estimate
Capital $4,161,439
Operations and Maintenance $1,744,000
Total Present Worth $5,905,400
Option: Rapid Rate Surface Percolation Land Application at Port of Pt. Towsend Airport, Pump from Ness' C orner Rd. and
Shotwell Rd., 1.77 mgd MM B uildout Flows

8/14/2019 Port Hadlock Sewer Facility Plan 0908
http://slidepdf.com/reader/full/port-hadlock-sewer-facility-plan-0908 357/387
Date : 8-Sep-08
Capital Cost Estimate
Item Description Quantity Unit Unit cost, $ Cost, $
12" DIP Force Main Overland (10' to 12' deep) 9,200 LF $65 $598,000 RS Means
Dewatering 1 LS $50,000 $50,000
Aphalt Surface Restoration 10,600 SY $30 $318,000 RS Means Assumes Full 12-foot restoration along Rhody DriveGravel Surface Restoration 1,667 SY $10 $16,667 RS Means
Land Purchase: Storage/15' Dike/20days/Buidout MM Fl ows 11 Acres $25,000 $275,000 Assumes Tigher soils
Land Purchase: Treatment 4 Acres $25,000 $100,000
Land Purchase: Buffers 4 Acres $25,000 $93,750
Site Process Piping and Valving 1 LS $25,000 $25,000
Electrical Conduit, Sitework, Lighting 1 LS $10,000 $10,000
Monitoring Wells 3 EA $10,000 $30,000
Subtotal Structural $1,516,417 W/O Land
Main Pump Station (2.1 mgd) 1 EA $500,000 $500,000 $1,047,667Medium Pump Station 0 EA $375,000 $0
Small Pump Station (0.036 mgd) 0 EA $250,000 $0
Distribution Piping & Equipment 1 EA $10,000 $10,000
Reclaimed Water Pumps/Filter 1 EA $50,000 $50,000
Subtotal Equipment $560,000
Total estimated current construction cost $2,076,417
Escalation to time of construction 2.60% $53,987 $1,607,667
Total estimated construction cost $2,130,404 $41,799
Contingency 30% $639,121 $1,649,466Engineering Design 15% $343,288
Construction Management 10% $228,859 Land Costs not includedSales Tax 8.8% $201,396 Land Costs not included
Total Estimated Capital Cost $3,543,067 Land Costs not included
Operations and Maintenance Cost Estimate (per year)
Item Description Quantity Unit Unit Cost Annual Cost
Labor 104 hr $30 $3,120 20year period, 3.2% discount factor
Power 326617 kWh $0.07 $22,863 12hr/day run time, 100hp pump station
Structural Maintenance 2% $31,117
Equipment replacement 4% $22,982
Misc expenses allowance $0
Total Annual Cost $80,082
Present Worth Factor 20.0000
Present Worth Cost $1,602,000
Total Present Worth Project Cost Estimate
Capital $3,543,067
Operations and Maintenance $1,602,000
Total Present Worth $5,145,100
Option: Rapid Rate Surface Percolation Land Application adjacent to Chimacum H.S, Pump from Ness' Corner Rd. and
Shotwell Rd., 1.77 mgd MM B uildout Flows

8/14/2019 Port Hadlock Sewer Facility Plan 0908
http://slidepdf.com/reader/full/port-hadlock-sewer-facility-plan-0908 358/387

8/14/2019 Port Hadlock Sewer Facility Plan 0908
http://slidepdf.com/reader/full/port-hadlock-sewer-facility-plan-0908 359/387
Jefferson County Department of Public Works
Port Hadlock UGA Sewer Facility Plan
APPENDIX D.
PLANNING LEVEL COST ESTIMATES FOR RECOMMENDED
ALTERNATIVE
September 2008

8/14/2019 Port Hadlock Sewer Facility Plan 0908
http://slidepdf.com/reader/full/port-hadlock-sewer-facility-plan-0908 360/387

8/14/2019 Port Hadlock Sewer Facility Plan 0908
http://slidepdf.com/reader/full/port-hadlock-sewer-facility-plan-0908 361/387

8/14/2019 Port Hadlock Sewer Facility Plan 0908
http://slidepdf.com/reader/full/port-hadlock-sewer-facility-plan-0908 362/387

8/14/2019 Port Hadlock Sewer Facility Plan 0908
http://slidepdf.com/reader/full/port-hadlock-sewer-facility-plan-0908 363/387

8/14/2019 Port Hadlock Sewer Facility Plan 0908
http://slidepdf.com/reader/full/port-hadlock-sewer-facility-plan-0908 364/387
Project: Port Hadlock UGA Sewer Facility Plan
Subject: Treatment System Analysis
By : Tt
Date : 11-Aug-08 Updated Unit Costs
July 2008
ENR: 8361.74
ERUs 432 ERUs 502 ERUs 584
Flow (mgd) 0.10 Flow (mgd) 0.12 Flow (mgd) 0.14
Item Description Unit cost, $ Unit Quantity Cost, $ Quantity Cost, $ Quantity Cost, $
CORE PLUS ALCOHOL
2010 2011 2012
COLLECTION - GRAVITY SYSTEM
Operations and Maintenance Cost Estimate (per year)
Item Description
Labor $40 hr 188 $7,520 188 $7,520 188 $7,520
Septic tank pumping $300 ea $0 $0 $0Diesel oil $4.50 gal $0 $0 $0
Power $0.08 kWh 123390 $9,254 125571 $9,418 128109 $9,608
Structural Maintenance 2% $0 2% $0 2% $0
Equipment replacement 4% $0 4% $0 4% $0
Chemicals $0.00 $0 $0 $0
Hypochlorite $0.60 lb 0 $0 0 $0 0 $0
Sodium Bisulfite $0.20 gal 0 $0 0 $0 0 $0
Polymer $3.00 lb $0 $0 $0
Misc expenses allowance $0 $0 $0
Total Annual Cost $16,774 $16,938 $17,128
Structural Maintenance 2% $86,992 2% $90,385 2% $94,246
Equipment replacement 4% $41,600 4% $41,600 4% $41,600
Total Annual Cost with Replacement Costs $145,366 $148,923 $152,974
Tetra Tech Seattle, WA

8/14/2019 Port Hadlock Sewer Facility Plan 0908
http://slidepdf.com/reader/full/port-hadlock-sewer-facility-plan-0908 365/387
Project: Port Hadlock UGA Sewer Facility Plan
Subject: Treatment System Analysis
By : Tt
Date : 11-Aug-08
July 2008
ENR: 8361.74
Item Description
COLLECTION - GRAVITY SYSTEM
Operations and Maintenance Cost Estimate (per year)
Item Description
Labor
Septic tank pumpingDiesel oil
Power
Structural Maintenance
Equipment replacement
Chemicals
Hypochlorite
Sodium Bisulfite
Polymer
Misc expenses
Total Annual Cost
Structural Maintenance
Equipment replacement
Total Annual Cost with Replacement Costs
ERUs 1067 ERUs 1241 ERUs 1443 E
Flow (mgd) 0.25 Flow (mgd) 0.30 Flow (mgd) 0.34 Flow
Quantity Cost, $ Quantity Cost, $ Quantity Cost, $ Qua
RESIDENTIAL #1 RES
2016 2017 2018
260 $10,400 260 $10,400 260 $10,400 3
$0 $0 $0$0 $0 $0
251990 $18,899 257384 $19,304 263656 $19,774 32
2% $0 2% $0 2% $0
4% $0 4% $0 4% $0
$0 $0 $0
0 $0 0 $0 0 $0
0 $0 0 $0 0 $0
$0 $0 $0
$0 $0 $0
$29,299 $29,704 $30,174
2% $161,289 2% $184,934 2% $194,615
4% $57,600 4% $57,600 4% $57,600
$248,188 $272,238 $282,390
Tetra Tech Seattle, WA

8/14/2019 Port Hadlock Sewer Facility Plan 0908
http://slidepdf.com/reader/full/port-hadlock-sewer-facility-plan-0908 366/387
Project: Port Hadlock UGA Sewer Facility Plan
Subject: Treatment System Analysis
By : Tt
Date : 11-Aug-08
July 2008
ENR: 8361.74
Item Description
COLLECTION - GRAVITY SYSTEM
Operations and Maintenance Cost Estimate (per year)
Item Description
Labor
Septic tank pumpingDiesel oil
Power
Structural Maintenance
Equipment replacement
Chemicals
Hypochlorite
Sodium Bisulfite
Polymer
Misc expenses
Total Annual Cost
Structural Maintenance
Equipment replacement
Total Annual Cost with Replacement Costs
ERUs 3069 ERUs 3568 ERUs 3666 ERUs 3768
Flow (mgd) 0.73 Flow (mgd) 0.85 Flow (mgd) 0.87 Flow (mgd) 0.90
Quantity Cost, $ Quantity Unit Cost, $ Cost, $ Quantity Cost, $ Quantity Cost, $
RESIDENTIAL AREA #3
2023 2024 2025 2026
312 $12,480 416 $16,640 416 $16,640 416 $16,640
$0 $0 $0 $0$0 $0 $0 $0
368529 $27,640 492906 $36,968 495956 $37,197 499095 $37,432
2% $0 2% $0 2% $0 2% $0
4% $0 4% $0 4% $0 4% $0
$0 $0 $0 $0
0 $0 0 $0 0 $0 0 $0
0 $0 0 $0 0 $0 0 $0
$0 $0 $0 $0
$0 $0 $0 $0
$40,120 $53,608 $53,837 $54,072
2% $281,901 2% $342,064 2% $367,145 2% $393,183
4% $67,600 4% $92,600 4% $92,600 4% $92,600
$389,621 $488,272 $513,581 $539,855
Tetra Tech Seattle, WA

8/14/2019 Port Hadlock Sewer Facility Plan 0908
http://slidepdf.com/reader/full/port-hadlock-sewer-facility-plan-0908 367/387
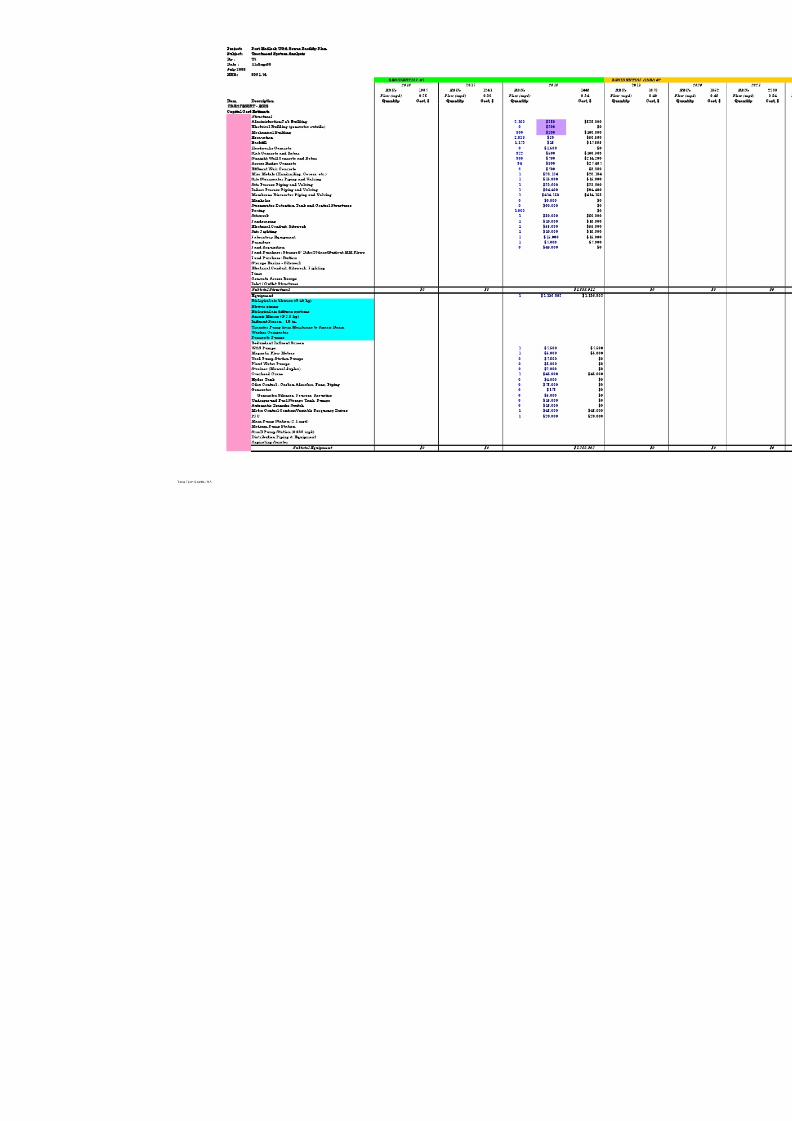
8/14/2019 Port Hadlock Sewer Facility Plan 0908
http://slidepdf.com/reader/full/port-hadlock-sewer-facility-plan-0908 368/387

8/14/2019 Port Hadlock Sewer Facility Plan 0908
http://slidepdf.com/reader/full/port-hadlock-sewer-facility-plan-0908 369/387
Project: Port Hadlock UGA Sewer Facility Plan
Subject: Treatment System Analysis
By : Tt
Date : 11-Aug-08
July 2008
ENR: 8361.74
Item Description
TREATMENT - MBR
Capital Cost Estimate
Structural
Administration/Lab Building
Electrical Building (generator outside)Mechanical Building
Excavation
Backfill
Headworks Concrete
Slab Concrete and Rebar
Straight Wall Concrete and Rebar
Access Bridge Concrete
Effluent Weir Concrete
Misc Metals (Handrailing, Covers, etc.)
Site Stormwater Piping and Valving
Site Process Piping and Valving
Indoor Process Piping and Valving
Membrane Bioreactor Piping and Valving
Manholes
Stormwater Detention Tank and Control Structures
Paving
Sitework
Landscaping
Electrical Conduit, Sitework
Site Lighting
Laboratory Equipment
Furniture
Land Acquisition
Land Purchase: Storage/8' Dike/20days/Buidout MM FlowsLand Purchase: Buffers
Storage Basins - Sitework
Electrical Conduit, Sitework, Lighting
Liner
Concrete Access Ramps
Inlet / Outlet Structures
Subtotal Structural
Equipment
Biological air blowers (@ 40 hp)
Blower piping
Biological air diffuser systems
Anoxic Mixers (@ 2.5 hp)
Influent Screen - 1/8 in.
Transfer Pump from Membrane to Anoxic Basin
Washer Compactor
Permeate Pumps
Redundant Influent Screen
WAS Pumps
Magnetic Flow Meters
Yard Pump Station Pumps
Plant Water Pumps
Strainer (Manual duplex)
Overhead Crane
Hydro TankOdor Control - Carbon Adsorber, Fans, Piping
Generator
Generator Silencer, Louvers, Acoustics
Underground Fuel Storage Tank, Pumps
Automatic Transfer Switch
Motor Control Centers/Variable Frequency Drives
PLC
Main Pump Station (2.1 mgd)
Medium Pump Station
Small Pump Station (0.036 mgd)
Distribution Piping & Equipment
Aspirating Aerator
Subtotal Equipment
ERUs 3069 ERUs 3568 ERUs 3666 ERUs 3768
Flow (mgd) 0.73 Flow (mgd) 0.85 Flow (mgd) 0.87 Flow (mgd) 0.90
Quantity Cost, $ Quantity Unit Cost, $ Cost, $ Quantity Cost, $ Quantity Cost, $
RESIDENTIAL AREA #3
2023 2024 2025 2026
$0 $0 $0 $0
1 $351,895 $351,895
$0 $351,895 $0 $0
Tetra Tech Seattle, WA

8/14/2019 Port Hadlock Sewer Facility Plan 0908
http://slidepdf.com/reader/full/port-hadlock-sewer-facility-plan-0908 370/387
Project: Port Hadlock UGA Sewer Facility Plan
Subject: Treatment System Analysis
By : Tt
Date : 11-Aug-08 Updated Unit Costs
July 2008
ENR: 8361.74
ERUs 432 ERUs 502 ERUs 584
Flow (mgd) 0.10 Flow (mgd) 0.12 Flow (mgd) 0.14
Item Description Unit cost, $ Unit Quantity Cost, $ Quantity Cost, $ Quantity Cost, $
CORE PLUS ALCOHOL
2010 2011 2012
Installation, Miscellaneous Mechanical of Equip 40% $854,604 $0 $140,758
Electrical of Equip 20% $427,302 $0 $70,379
Instrumentation and Control of Equip 15% $320,477 $0 $52,784
Subtotal Structural, Mechanical, Elect, I&C $6,403,375 $0 $615,816
Contractor O&P of Sub Cost 15% $960,506 $0 $92,372
Mobilization, demobilization, bond of Sub cost 6% $384,202 $0 $36,949
Total estimated current construction cost $7,748,083 $0 $745,138
Escalation to time of construction 3.50% $271,183 $0 $26,080
Total estimated construction cost $8,019,266 $0 $771,217
Contingency 30% $2,405,780 $0 $231,365
Engineering Design 15% $1,563,757 $0 $150,387
Construction Management 10% $1,042,505 $0 $100,258
Sales Tax 8.4% $875,704 $0 $84,217
Total Estimated Capital Cost $13,907,000 $0 $1,337,000
Operations and Maintenance Cost Estimate (per year)
Item Description Unit Cost Unit Quantity Annual Cost
Labor $40 HR 2,080 $83,200 2,080 $83,200 2,080 $83,200
Membrane Replacement $75 panel 0 $0 0 $0 0 $0
Diesel oil $4.50 GAL 0 $0 0 $0 0 $0
Power $0.075 kWh 173,736 $13,030 186,686 $14,001 201,745 $15,131
Other utilities (water, garbage, etc.) $1,000 month 12 $12,000 12 $12,000 12 $12,000
Chemicals - membrane cleaning $3,380 LS 2 $6,760 2 $6,760 2 $6,760
Hypochlorite $1.50 LB 0 $0 0 $0 0 $0
Laboratory Testing at Port Townsend $25.00 Test 416 $10,400 416 $10,400 416 $10,400
Polymer $3.00 LB 0 $0 0 $0 0 $0
Misc expenses allowance 0 $0 0 $0 0 $0Total Annual Cost $125,390 $126,361 $127,491
Structural Replacement 2% $53,290 2% $53,290 2% $53,290
Capital Replacement 4% $85,460 4% $85,460 4% $85,460
Total Annual Cost with Replacement Costs $264,140 $265,112 $266,241
"overhead " horsepower = 9
"overhead" power with expansion = 16
Tetra Tech Seattle, WA
TREATMENT - MBR

8/14/2019 Port Hadlock Sewer Facility Plan 0908
http://slidepdf.com/reader/full/port-hadlock-sewer-facility-plan-0908 371/387
Project: Port Hadlock UGA Sewer Facility Plan
Subject: Treatment System Analysis
By : Tt
Date : 11-Aug-08
July 2008
ENR: 8361.74
Item Description
Installation, Miscellaneous Mechanical
Electrical
Instrumentation and Control
Subtotal Structural, Mechanical, Elect, I&C
Contractor O&P
Mobilization, demobilization, bond
Total estimated current construction cost
Escalation to time of construction
Total estimated construction cost
Contingency
Engineering Design
Construction Management
Sales Tax
Total Estimated Capital Cost
Operations and Maintenance Cost Estimate (per year)
Item Description
Labor
Membrane Replacement
Diesel oil
Power
Other utilities (water, garbage, etc.)
Chemicals - membrane cleaning
Hypochlorite
Laboratory Testing at Port Townsend
Polymer
Misc expensesTotal Annual Cost
Structural Replacement
Capital Replacement
Total Annual Cost with Replacement Costs
"overhead" horsepower =
"overhead" power with expansion =
ERUs 1067 ERUs 1241 ERUs 1443 E
Flow (mgd) 0.25 Flow (mgd) 0.30 Flow (mgd) 0.34 Flow
Quantity Cost, $ Quantity Cost, $ Quantity Cost, $ Qua
RESIDENTIAL #1 RES
2016 2017 2018
$0 $0 $503,757
$0 $0 $251,878
$0 $0 $188,909
$0 $0 $4,091,946
$0 $0 $613,792
$0 $0 $245,517
$0 $0 $4,951,255
$0 $0 $173,294
$0 $0 $5,124,549
$0 $0 $1,537,365
$0 $0 $999,287
$0 $0 $666,191
$0 $0 $559,601
$0 $0 $8,887,000
2,080 $83,200 3,796 $151,840 3,796 $151,840 3
400 $30,000 400 $30,000 800 $60,000 8
0 $0 0 $0 0 $0
290,825 $21,812 323,555 $24,267 406,508 $30,488 40
12 $12,000 12 $12,000 12 $12,000
2 $6,760 3 $10,140 3 $10,140
0 $0 0 $0 0 $0
416 $10,400 416 $10,400 416 $10,400 4
0 $0 0 $0 0 $0
0 $0 0 $0 0 $0$164,172 $238,647 $274,868
2% $53,290 2% $53,290 2% $91,050
4% $85,460 4% $85,460 4% $135,836
$302,922 $377,397 $501,754
Tetra Tech Seattle, WA
TREATMENT - MBR

8/14/2019 Port Hadlock Sewer Facility Plan 0908
http://slidepdf.com/reader/full/port-hadlock-sewer-facility-plan-0908 372/387
Project: Port Hadlock UGA Sewer Facility Plan
Subject: Treatment System Analysis
By : Tt
Date : 11-Aug-08
July 2008
ENR: 8361.74
Item Description
Installation, Miscellaneous Mechanical
Electrical
Instrumentation and Control
Subtotal Structural, Mechanical, Elect, I&C
Contractor O&P
Mobilization, demobilization, bond
Total estimated current construction cost
Escalation to time of construction
Total estimated construction cost
Contingency
Engineering Design
Construction Management
Sales Tax
Total Estimated Capital Cost
Operations and Maintenance Cost Estimate (per year)
Item Description
Labor
Membrane Replacement
Diesel oil
Power
Other utilities (water, garbage, etc.)
Chemicals - membrane cleaning
Hypochlorite
Laboratory Testing at Port Townsend
Polymer
Misc expensesTotal Annual Cost
Structural Replacement
Capital Replacement
Total Annual Cost with Replacement Costs
"overhead" horsepower =
"overhead" power with expansion =
ERUs 3069 ERUs 3568 ERUs 3666 ERUs 3768
Flow (mgd) 0.73 Flow (mgd) 0.85 Flow (mgd) 0.87 Flow (mgd) 0.90
Quantity Cost, $ Quantity Unit Cost, $ Cost, $ Quantity Cost, $ Quantity Cost, $
RESIDENTIAL AREA #3
2023 2024 2025 2026
$0 $140,758 $0 $0
$0 $70,379 $0 $0
$0 $52,784 $0 $0
$0 $615,816 $0 $0
$0 $92,372 $0 $0
$0 $36,949 $0 $0
$0 $745,138 $0 $0
$0 $26,080 $0 $0
$0 $771,217 $0 $0
$0 $231,365 $0 $0
$0 $150,387 $0 $0
$0 $100,258 $0 $0
$0 $84,217 $0 $0
$0 $1,337,000 $0 $0
3,796 $151,840 3,796 $151,840 3,796 $151,840 3,796 $151,840
0 $0 400 $30,000 400 $30,000 800 $60,000
0 $0 0 $0 0 $0 0 $0
660,137 $49,510 797,890 $59,842 815,989 $61,199 834,622 $62,597
12 $12,000 12 $12,000 12 $12,000 12 $12,000
3 $10,140 4 $13,520 4 $13,520 4 $13,520
0 $0 0 $0 0 $0 0 $0
416 $10,400 416 $10,400 416 $10,400 416 $10,400
0 $0 0 $0 0 $0 0 $0
0 $0 $0 0 $0 0 $0$233,890 $277,602 $278,959 $310,357
2% $91,050 2% $91,050 2% $91,050 2% $91,050
4% $135,836 4% $149,912 4% $149,912 4% $149,912
$460,776 $518,563 $519,921 $551,318
Tetra Tech Seattle, WA
TREATMENT - MBR

8/14/2019 Port Hadlock Sewer Facility Plan 0908
http://slidepdf.com/reader/full/port-hadlock-sewer-facility-plan-0908 373/387

8/14/2019 Port Hadlock Sewer Facility Plan 0908
http://slidepdf.com/reader/full/port-hadlock-sewer-facility-plan-0908 374/387

8/14/2019 Port Hadlock Sewer Facility Plan 0908
http://slidepdf.com/reader/full/port-hadlock-sewer-facility-plan-0908 375/387

8/14/2019 Port Hadlock Sewer Facility Plan 0908
http://slidepdf.com/reader/full/port-hadlock-sewer-facility-plan-0908 376/387

8/14/2019 Port Hadlock Sewer Facility Plan 0908
http://slidepdf.com/reader/full/port-hadlock-sewer-facility-plan-0908 377/387

8/14/2019 Port Hadlock Sewer Facility Plan 0908
http://slidepdf.com/reader/full/port-hadlock-sewer-facility-plan-0908 378/387

8/14/2019 Port Hadlock Sewer Facility Plan 0908
http://slidepdf.com/reader/full/port-hadlock-sewer-facility-plan-0908 379/387

8/14/2019 Port Hadlock Sewer Facility Plan 0908
http://slidepdf.com/reader/full/port-hadlock-sewer-facility-plan-0908 380/387

8/14/2019 Port Hadlock Sewer Facility Plan 0908
http://slidepdf.com/reader/full/port-hadlock-sewer-facility-plan-0908 381/387

8/14/2019 Port Hadlock Sewer Facility Plan 0908
http://slidepdf.com/reader/full/port-hadlock-sewer-facility-plan-0908 382/387

8/14/2019 Port Hadlock Sewer Facility Plan 0908
http://slidepdf.com/reader/full/port-hadlock-sewer-facility-plan-0908 383/387
Jefferson County Department of Public Works
Port Hadlock UGA Sewer Facility Plan
APPENDIX E.
RELIABILITY AND REDUNDANCY REQUIREMENTS FOR
RECLAMATION AND REUSE STANDARDS
September 2008

8/14/2019 Port Hadlock Sewer Facility Plan 0908
http://slidepdf.com/reader/full/port-hadlock-sewer-facility-plan-0908 384/387

8/14/2019 Port Hadlock Sewer Facility Plan 0908
http://slidepdf.com/reader/full/port-hadlock-sewer-facility-plan-0908 385/387
E1-14 November 2007 Criteria for Sewage Works Design
Table E1-4. Reliability and Redundancy Requirements of Articles 10 and 11 of the WaterReclamation and Reuse Standards
Article Requirements
Article 10—
General
Requirements ofDesign
1. Flexibility of Design
The design of process piping, equipment arrangement, and unit structures in the reclamation plantmust allow for efficiency and convenience in operation and maintenance and provide flexibility of
operation to permit the highest possible degree of treatment to be obtained under varying
circumstances.
There shall be no bypassing of untreated or partially treated wastewater from the reclamation plant or
any intermediate unit processes to the point of use.
2. Power Supply
The power supply shall be provided with one of the following reliability features:
(a) Alarm and standby power source.
(b) Alarm and automatically actuated short-term storage or disposal provisions as specified in
Article 11, item 1.
(c) Automatically actuated long-term storage or disposal provisions as specified in Article 11,
item 1.
3. Storage Where No Approved Alternative Disposal System Exists
(a) Where no alternative disposal system is permitted, a system storage or other acceptable
means shall be provided to ensure the retention of reclaimed water under adverse weather
conditions or at other times when reuse is precluded.
(b) When wet weather conditions preclude the use of reclaimed water, the system storage
volume shall be established by determining the storage period that would be required for the
duration of a 10-year storm, using weather data that is available from, or is representative of,
the area involved. A minimum of 20 years of climatic data shall be used in storage volume
determinations. (Note that the designer must select an appropriate storm duration to provide the
protection of a 10-year recurrence interval.)
(c) At a minimum, system storage capacity shall be the volume equal to three times that portion
of the average daily flow of reuse capacity for which no alternative reuse or disposal system is
permitted.
(d) Reclaimed water storage ponds or quarantine which can impound a volume of 10 acre-feet
(equivalent to 435,600 cubic feet or 3.258 million gallons) or more may be subject to state dam
safety regulations. See G1-1.4.6E.

8/14/2019 Port Hadlock Sewer Facility Plan 0908
http://slidepdf.com/reader/full/port-hadlock-sewer-facility-plan-0908 386/387
Water Reclamation and Reuse November 2007 E1-15
Article Requirements
Article 11—
Alternative
Reliability
Requirements
1. Emergency Storage or Disposal
(a) Where short-term storage or disposal provisions are used as a reliability feature, these shall
consist of facilities reserved for the purpose of storing or disposing of untreated or partially
treated wastewater for at least a 24-hour period. The facilities shall include all the necessary
diversion works, provisions for odor control, conduits, and pumping and pump-back equipment.
All of the equipment other than the pump-back equipment shall be either independent of the
normal power supply or provided with a standby power source.
(b) Where long-term storage or disposal provisions are used as a reliability feature, these shall
consist of ponds, reservoirs, percolation areas, downstream sewers leading to other treatment
or disposal facilities, or any other facilities reserved for the purpose of emergency storage or
disposal of untreated or partially treated wastewater. These facilities shall be of sufficient
capacity to provide disposal or storage of wastewater for at least 20 days, and shall include all
the necessary diversion works, provisions for odor and nuisance control, conduits, and pumping
and pump-back equipment. All of the equipment other than the pump-back equipment shall be
either independent of the normal power supply or provided with a standby power source.
(c) Diversion to a different type of reuse is an acceptable alternative to emergency disposal of
partially treated wastewater provided that the quality of the partially treated wastewater is
suitable for that type of reuse.
(d) Subject to prior approval by DOH and Ecology, diversion to a discharge point where thewastewater meets all discharge requirements is an acceptable alternative to emergency
disposal of partially treated wastewater.
(e) Automatically actuated short-term storage or disposal provisions and automatically actuated
long-term storage or disposal provisions shall include, in addition to provisions of (a), (b), (c),
and (d) listed above, all the necessary sensors, instruments, valves, and other devices to
enable fully automatic diversion of untreated or partially treated wastewater to approved
emergency storage or disposal in the event of failure of the treatment process, and a manual
reset to prevent automatic restart until the failure is corrected.
2. Biological Treatment
All biological treatment unit processes shall be provided with one reliability feature, as follows:
(a) Alarm and multiple biological treatment units capable of producing oxidized wastewater with
one unit not in operation.
(b) Alarm, short-term storage or disposal provisions, and standby replacement equipment.
(c) Alarm and long-term storage or disposal provisions.
(d) Automatically actuated long-term storage or disposal provisions.
3. Secondary Sedimentation
All secondary sedimentation unit processes shall be provided with one reliability feature, as follows:
(a) Multiple sedimentation units capable of treating the entire flow with one unit not in operation.
(b) Standby sedimentation unit process.
(c) Long-term storage or disposal provisions.

8/14/2019 Port Hadlock Sewer Facility Plan 0908
http://slidepdf.com/reader/full/port-hadlock-sewer-facility-plan-0908 387/387
E1-16 November 2007 Criteria for Sewage Works Design
Article Requirements
Article 11—
Alternative
Reliability
Requirements
(continued)
4. Coagulation
(a) All coagulation unit processes shall be provided with all features for uninterrupted chemical
feed, as follows:
• Standby feeders.
• Adequate chemical storage and conveyance facilities.
• Adequate reserve chemical supply.
• Automatic dosage control.
(b) All coagulation unit processes shall be provided with one reliability feature, as follows:
• Alarm and multiple coagulation units capable of treating the entire flow with one unit not in
operation.
• Alarm, short-term storage or disposal provisions, and standby replacement equipment.
• Alarm and long-term storage or disposal provisions.
• Automatically actuated long-term storage or disposal provisions.
• Alarm and standby coagulation unit process.
5. Filtration
All filtration unit processes shall be provided with one reliability feature, as follows:
(a) Alarm and multiple filter units capable of treating the entire flow with one unit not in
operation.
(b) Alarm, short-term storage or disposal provisions, and standby replacement equipment.
(c) Alarm and long-term storage or disposal provisions.
(d) Alarm and standby filtration unit process.


