31
-1- Port of San Francisco 10-Year Capital Plan FY 2011-20 Update

-1-
Port of San Francisco
10-Year Capital Plan
FY 2011-20 Update

-2-
Table of Contents
I. Executive Summary 3 II. Summary of Changes 6 III. Schedule of Expenses / Needs Assessment 8 IV. Proposed Funding – Port Maps 11 V. Unfunded (Deferred) and Emerging Needs 23 VI. Conclusions 24 Appendix A - 10 Year Need Summary, By Facility 26

-3-
I. Executive Summary All of the piers currently in use by the Port or Port tenants were originally constructed around 100 years ago. Of those, only nine have been rehabilitated since 1950, including AT&T Ballpark, the Ferry Building, Pier 1, Piers 1½, 3 & 5, Pier 27, Pier 39, Pier 45, Pier 48, and Pier 80. Most of the buildings atop the Port’s piers are 40 to 100 years old, making many of them historically significant structures. In recognition of this significance, the National Park Service designated the northeast waterfront, from Pier 45 in the north to Pier 48, as the Embarcadero National Register Historic District. This district includes 20 historic piers as well as eight other structures of historic significance. The Pier 70 area also includes 35 buildings and many other features recognized to be of historical significance. The Port is in conversation with the State Office of Historic Preservation regarding the designation of a portion of the Pier 70 area as a National Register Historic District. The Port commenced planning and design work on three park projects during 2009, including Bayfront Park, Pier 43 Bay Trail Link and Brannan Street Wharf. Additionally, planning and design work began for a renewed international cruise terminal at Pier 27 and the adjoining Northeast Wharf Plaza, a major new waterfront plaza along the Embarcadero; design and engineering of critical repairs to the superstructure and the substructure of Pier 35 (the Port’s current primary cruise terminal); and planning, design and engineering for new industrial leasing pads on the Port’s Pier 90-94 Backlands, among other capital projects. The FY 2011-20 update of the Port’s 10-year capital plan identifies a total need of approximately $2.1 billion, primarily for deferred maintenance and seismic upgrade work required on Port facilities. This is approximately $93 million greater than the approximately $2 billion identified in the Port’s FY 2010-19 update. This increase is largely the result of the 3.5% annual cost escalation used by the City and County of San Francisco (CCSF), which has been incorporated into this plan. The City Charter requires all Departments of CCSF to generate a 10-year Capital Plan and update it annually. The City’s capital planning program collates the submission of all departments annually into the City’s Capital Plan. As required by City law, the Port submitted a draft FY 2011-20 Capital Plan update to the City in December of 2008. This report is a more detailed version of that submission. A summary of the changes over the last year is as follows:
Changes in Dollars (in thousands) FY 2010-20191 Total $2,007,322 3.5% Cost Escalation 70,256 Roll in of Estimated FY 2020 Renewal Costs 56,983 Completed Work / Revised Cost Estimates (33,921) Total: $2,100,640
1 See footnote 2.

-4-
Of the $2.1 billion in total need, the Port has identified a total of $688 million in funding including: Port tenant obligations, the Port’s annual operating budget, revenue bonds, development projects, Infrastructure Financing District bonds, General Obligation bonds, and the Water Resources Development Act of 2007. The largest element of the Port’s Plan is the rehabilitation and redevelopment of the heavily blighted Pier 70 area, with an estimated need of approximately $650 million for that area. These costs include upgrading salvageable buildings, demolition of unsalvageable ones, environmental remediation, improvements to street and utility infrastructure, and construction of an open space park area near the water’s edge. While Port staff hopes that much of this work can be completed through private development, much of it must be completed with other sources of funding in order to attract private development interest and funding. The Port has developed policy options to address the unfunded portion of its plan including use of grant funds, tax increment financing and potential private development options. In November 2008, San Francisco’s voters approved Proposition D which provides an option for the Board of Supervisors to capture 75% of the payroll and hotel tax increment generated by future Pier 70 development to help fund Pier 70’s immense public infrastructure and improvements. As a precondition to accessing that funding, the Port must demonstrate that its lease revenues and property tax increment are insufficient to fund all public costs. Proposition D will also facilitate developing Pier 70 by reducing the entitlement risk associated with the number of discretionary approvals the Port’s development projects must currently secure. Specifically, Proposition D allows the Board of Supervisors to waive the final approval of the Pier 70 lease if it approves the Pier 70 development plan and zoning at the outset of the project(s). However, each of these options will require significant staff time to develop and implement, and each will require support from City’s policymakers. In contrast to last year’s Capital Plan, the FY 2011-20 Capital Plan reflects the uncertainty of the current real estate market. Specifically, while Port staff assumes that revenues and tax increment arising from development of SWL 337 will likely be realized before 2019, the Plan no longer assigns the projected $65 million in tax increment debt proceeds arising from this development to specific uses. Furthermore, the projected revenue bond revenues arising from the proposed development, also projected at $65 million, are assigned to projects likely to occur later than 2015. As the Port focuses on delivery of revenue bond and general bond funded projects over the next five years of the Plan, it is clear that the Port must leverage currently available sources of land-based finance (revenue bonds, infrastructure financing districts, community facility districts) with other sources of public and private funding to gap-finance its projects. This strategy will strengthen the Port’s balance sheet in preparation for major projects at SWL 337 and Pier 70 that will require the Port to take on substantial new debt envisioned by the Capital Plan. Toward that end, Port staff is aggressively pursuing federal funding, including $20 million in U.S. Army Corps of Engineers funding authorized by Congress in the Water Resources Development Act but not yet appropriated to specific projects. The Port’s recent ability to utilize the public resources of Infrastructure Finance Districts and other tax increment financing facilitated by Proposition D, private development on SWL 337

-5-
enabled by SB 815, inclusion of Port parks in a City General Obligation Bond, and federal funding of waterfront projects constitutes a beginning to a more financially sound and sustainable Port of San Francisco. II. Summary of Changes A summary of the changes over the last year is as follows:
Changes in Dollars (in thousands) FY 2010-20192 Total $2,007,322 3.5% Cost Escalation 70,256 Roll in of Estimated FY 2020 Renewal Costs 56,983 Completed Work / Revised Cost Estimates (33,921) Total: $2,100,640
Broken down by Port region, capital need increased across the Port as follows: Change in Capital Need, by Region (in thousands)
Port Region FY10 Total FY11 Total Difference Increase China Basin $134,827 $140,544 $5,717 4.24%Ferry Building 90,827 93,867 $3,040 3.35%Fishermans Wharf 107,810 113,514 $5,704 5.29%Northeast Waterfront 391,914 399,711 $7,797 1.99%Portwide 323,658 353,878 $30,220 9.34%South Beach 310,296 321,647 $11,351 3.66%Southern Waterfront 647,990 677,479 $29,489 4.55% $2,007,322 $2,100,640 $93,318 4.65%
For purposes of this plan, the Port treats piers and wharves collectively as infrastructure. The treatment of these structures then, as a group, is similar to how a city would treat a system of utility mains. Instead of maintaining each piece of the system individually, an amount of funding is programmed each year to repair or replace elements that become damaged by external events, as well as elements that become the weakest part of the overall system. This is in part because infrastructure elements, unlike building subsystems (electrical systems, HVAC systems) are not mechanical in nature, and thus have a much longer lifespan. In addition, because of these long life spans, differential wear-and-tear of the Port’s substructure elements is difficult to predict.
2 While this reference to the prior year’s 10-year Capital Plan reads as “FY 2010-2019”, which is a years-leading designation, the documents for the prior iteration of this report self-identify as for the period of “FY 2009-2018”, a years-trailing designation. The Port’s first 10-year capital plan preceded the City’s, and while the Port began with a years-trailing designation, the City later adopted the years-leading convention. The result has been that, since that time, the City and Port capital plans, while covering the same period of time, have been labeled differently. Beginning with this plan, the Port has adopted the City convention of year’s leading. While it may appear that there is a one-year gap between the Port 10-year capital plans, going directly from a plan labeled “FY 2009-2018” to one labeled “FY 2011-2020”, they are indeed successive annual iterations of the Port’s plan.

-6-
As the Port was not able to commit any capital funds to pier and wharf substructure renewal over the past year, the schedule this year reflects the 2008 and 2009 investment amounts, $44.28 million, as part of the 2010 backlog. Until such time as the Port is in a position to commit funding to this line item, that backlog will continue to grow in successive years. This movement of the 2009 foregone capital expenditure into backlog is reflected in the increase of 9.34% in the “Portwide” line item above.

-7-
III. Schedule of Expenses / Needs Assessment

-8-
Just over $1 billion, or approximately 50% of the overall need identified in the Port’s 10-year capital plan, addresses renewal and repair of existing facilities or deferred maintenance. Of the $688 million that the Port proposes to fund in the 10-year capital plan, approximately $333 million are allocated to renewal projects. Much of this consists of funds to address the Port’s facility-specific backlog, largely non-seismic substructure pier and building repairs. Also included are street resurfacing and sewer repair projects. Some of these repairs will be funded by Port tenants as required in their leases. Other repairs will be covered by the Port through its annual operating budget. Some of the balance will be covered by development projects and Port revenue bonds, discussed in detail in the subsequent Enhancement Program sections. The Portwide Annual Programs that are funded in the Port’s annual capital budgets include (1) dredging of the bay floor along the waterfront, which maintains the depth of the berths at the Port’s piers so that they remain suitable for water traffic, (2) facility condition surveys, which allow the Port to evaluate the state of the Port’s structures on a continuous basis and in an organized manner, and (3) emergency facility repair, a set-aside of funds for unforeseen situations, available for the most pressing capital needs in subsequent years if the programmed year remains emergency-free. The Port funds various open space improvements or mandated mitigations (such as the Brannan Street Wharf at Pier 36) under the Special Area Plan Open Space program as funding opportunities become available. The Port proposes to fund part of these projects with land sale proceeds, Port operating revenues, and General Obligation bond funds. Because of the sheer magnitude of the Port’s remaining Annual Program, the Pier/Wharf Substructure Reinvestment program, for the moment, receives little, if any, funding. The Port should reinvest back into the Port’s pier substructures 0.75% of the value of those substructures, each year3. Unfortunately, because of the cost to do so, the Port has been unable to make the necessary investments to maintain the Port’s substructures in good repair. For a detailed breakdown of costs in the schedule above, see Appendix A to this report. A further breakdown of projects within each building is available upon request. It is important to note that, as with prior reports and in keeping with capital planning convention, the backlog costs have been estimated in 2010 dollars, and are not escalated to the anticipated project date.
3 The level of need is calculated based on the cyclical replacement of portions of pier substructures, based on construction type and exposure to tidal action. For example, Port engineers estimate that the Port should rehabilitate 15% of the Port’s pre-1920’s era concrete piers every 20 years.

-9-
IV. Proposed Funding Port staff proposes -- and the Port Commission will eventually make decisions regarding -- a total investment of $688 million in the ten-year capital plan. These investments consist of $164 million in Port Revenue Bonds, $205 million in Infrastructure Finance District (IFD) Bonds, $33.5 million in General Obligation Bonds, $25 million in federal funding from the Water Resources Development Act of 2007, funds from the Port’s operating budget, and private funds from Port tenant obligations and proposed development partners. These sources will fund improvements, including many seismic upgrades, to the following Port facilities: the Pier 27 Cruise Terminal and the Northeast Wharf Plaza; the Pier 35 Cruise Terminal; industrial leasing pads on the Pier 90-94 Backlands; improvements to Pier 33, the Port’s Maintenance Facility; Piers 19 and 23; the Agriculture Building; Piers 15 & 17, where the Exploratorium is planning to relocate, pending major renovation; Wharf J9; and Piers 9 and 33; and various open space improvements along the waterfront. The proposed $688 million in funding over the next ten years is $38 million more than the $650 million proposed in last year’s 10-year Capital Plan. This difference is primarily due to inclusion for the first time of a new source of federal funding, the Water Resources Development Act of 2007, which will provide $25 million during the first half of this plan. Additionally, Development Project sources were increased by $12.5 million to reflect rehabilitation of Pier 48 that is expected to accompany eventual development at SWL 337. Minor adjustments to other sources of revenue were offsetting. Port Revenue Bond Projects The Port anticipates issuing up to $164 million in revenue bonds by FY 2018-19. Structures were selected by Port staff for Revenue Bond funding based on whether or not the facility (1) is currently profitable, (2) has the potential to be more profitable, because it is under-utilized, (3) has potential to be more profitable, because it has a lease set to expire in the next 10-years, allowing the Port to improve the property and increase rents once the property is ready to be re-leased, or (4) is critical to supporting the Port’s operations. The $99 million in projects to be funded under Base Port Revenues reflects an optimal level of revenue bond financing; commercial real estate market conditions will need to improve to achieve this level of debt capacity. The actual revenue bond will depend on the amount of Port revenues available at the time of issuance to repay the debt, interest rates, and on policies adopted by the Port Commission. Based on these criteria, subject to approval of policy makers, Port staff proposes to make improvements to the following Port facilities with Port revenue bond funds:

-10-
Port Revenue Bond Projects (Including Other Related Sources)1 Project
Series 2010 Revenue Bonds2
Port Revenue Bonds
Other Related
Sources
SWL 337 Revenue Bonds3
Total Pier 27 Cruise Terminal & Northeast Wharf Plaza
$10,000,000
$15,000,000
$35,000,0004
$60,000,000
Pier 35 Cruise Terminal 5,500,000 7,500,000 15,000,0005 28,000,000 Piers 90-94 Backlands 8,000,000 8,000,000 Pier 19 or 23 2,000,000 18,000,000 40,000,0006 25,000,000 85,000,0007 Pier 19 Roof 3,500,000 3,500,000 Pier 33 2,000,000 10,000,000 12,000,000 Pier 50 1,500,000 18,500,000 20,000,000 Agriculture Building 5,000,000 5,000,000 Pier 9 25,000,000 25,000,000 Wharf J9 5,500,000 5,500,000 Rail Improvements 2,000,000 2,000,000
Total $32,500,000 $66,500,000 $90,000,000 $65,000,000 $254,000,000 Notes: 1 Subject to actual debt capacity, as well as Port Commission, Mayor and Board of Supervisors approval. 2 Reflects appropriations from the sale of Port Series 2010 Revenue Bonds issued February 3, 2010. 3 Reflects funding for historic resources in the Embarcadero Historic District pursuant to the requirements of
SB 815. 4 Other funding for the Pier 27 Cruise Terminal includes $20,000,000 in funding from the sale of Watermark
Condominiums on Seawall Lot 330. Projected sources of revenue to finance the remaining $15 million in project costs include Port security grants, event revenues, passenger facility charges and/or retail revenues.
5 Other funding for the Pier 35 Cruise Terminal includes (proposed) federal appropriations pursuant to the 2007 Water Resources Development Act approved by Congress.
6 Other funding for the Pier 19 or 23 project includes funding from the following possible sources: lease revenues, IFD revenues, federal historic tax credits, and private equity.
7 Total projects costs for a mixed use, adaptive reuse project at either Pier 19 or 23 are estimated at $85 million, based on a Pier 1-style physical build-out (but assuming a Pier 9 mix of uses). This project is dependent on developing a financially-feasible mixed use program consisting of interim non-trust and public trust uses. Alternately, the Port could invest $20 million in Port revenue bond funding in the substructure of one of these two piers.
Project Descriptions:
• Pier 27 Cruise Terminal Project - On September 27, 2007, the Port Commission accepted the Cruise Terminal Advisory Panel’s recommendation to re-locate the Port’s primary cruise terminal from Pier 35 to Pier 27 because it is the most cost-effective location. The Port currently has $29.3 million available to make the necessary improvements at Pier 27 to accommodate a renewed cruise terminal -- substantially less than the estimated $60 million project cost estimate. The Port proposes to allocate an additional $15 million in Port revenue bond proceeds to help cover the shortfall for a total of $44.3 million available for the cruise terminal project. The Port is also undergoing an engineering evaluation to evaluate project cost alternatives and phasing opportunities based on detailed design and engineering plans. The Port is seeking federal port security funding to fund security upgrades to the facility (a strategy successful in funding upgrades to Pier 35). Finally, the Port intends to use the cruise terminal as event space during

-11-
non-cruise days and include retail uses to generate revenues that could be used to help cover funding shortfalls.
• Pier 35 Cruise Terminal – To continue the Port’s cruise business, which currently consists of approximately 45-65 cruise calls per year, the Port of San Francisco requires at least two cruise berths. Pier 35 is currently the Port’s primary cruise terminal and will continue in service after Pier 27 re-opens. In 2009, Port engineers conducted a facility assessment of Pier 35 and found that urgent repairs are needed to the pier superstructure to keep the facility open. Thus, the Port allocated $5.5 million of the Series 2010 revenue bonds to fund immediate facility repairs. Additional substructure repair and seismic improvements are required to keep the facility operational. Port staff has submitted a request for $15 million in federal funding pursuant to the 2007 Water Resources Development Act to finance these improvements, which will require a 1/3 local match. Port staff proposes revenue bond funding to supply this match.
• Pier 90-94 Backlands: The Port’s largest unleased area of Port property is the
Pier 90-94 Backlands, an area of unengineered fill not suitable for commercial buildings without the inclusion of costly pile supported foundations. The Series 2010 revenue bonds include $8 million in funding for new road and utilities to support new leasing plots that are planned for the site. The current bond allocation is for design and construction costs. The Port has had a conceptual engineering design completed for this project by KCA Engineers. DPW staff is currently developing construction documents. Port staff expects the design will be completed by the end of 2010, and the project will be advertised for bids sometime in spring of 2011. Construction is expected to be completed by the end of 2011.
• Piers 19 and 23: These piers are located near one another in the northern
waterfront. They require repairs and seismic upgrades and are currently without any long-term leases. The Series 2010 revenue bonds include $3.5 million to repair the Pier 19 roof to enable continued interim leasing of that facility. The Pier 19 bulkhead is also a potential location to co-locate emergency response facilities which could include a marine fire station, marine police units, and other agency facilities. The Series 2010 revenue bonds also include $2 million in design funding for further improvements to either Pier 19 or Pier 23.
Port staff envisions a mixed use development project at either Pier 19 or 23, subject to approval by the Port Commission, the Mayor, and the Board of Supervisors. Staff projects that the cost of a mixed use, adaptive reuse project at either Pier 19 or 23 would be $85 million, based on certified costs to construct Pier 1 and construction cost inflation since Pier 1 opened. This project is dependent on developing a financially-feasible mixed use program consisting of interim non-trust and public trust uses, consistent with a proposed interim leasing policy for Port historic structures pending Port Commission consideration. Other

-12-
funding for the Pier 19 or 23 project would include funding from lease revenues, IFD revenues, federal historic tax credits, and private equity. In lieu of a mixed use development project, the Port could invest $20 million in Port revenue bond funding in the substructure of one of these two piers.
• Pier 33: This project will build elevator and other accessible features and a
bathroom to create a leasable space in the Pier 33 Bulkhead. The Series 2010 revenue bond allocation is for construction costs. The project is currently in the design phase with construction expected to commence during the fall of 2010 and be completed by August 2011.
• Agriculture Building: Located in the Ferry Building Area of the Port, the brick
building south of the Ferry Building is currently leased through short-term leases for office space and Amtrak’s San Francisco ticketing office. The Port is developing a plan to determine possible new uses for the Agriculture Building, as well as costs to renovate the facility to accommodate the new uses. The Port proposes to allocate $5 million in SWL 337 revenue bonds to help cover repairs and seismic upgrades.
• Northeast Waterfront Piers - Piers 9 and 33: In 2007, the State legislature
adopted legislation (SB 815) that allows for more varied development on some of the Port’s seawall lots, and allows the Port to enter into lease terms of up to 75 years (the prior maximum had been 66 years). The legislation also restricts the use of new revenue growth generated by seawall lot leases to 1) repair and seismic upgrades of historic facilities and 2) construction of open spaces required by the Special Area Plan. Seawall Lot 337 is the first development affected by the new legislation. The additional annual income associated with SWL 337 development will help the Port to leverage up to, roughly, $65 million in municipal bonds. Port staff recommend Piers 9 and 33 to be the recipient of some of these revenue bond funds (Piers 19-23 and the Agriculture Building to receive the balance), which will go toward seismic upgrades and long-deferred repairs.
• Rail Improvements: To enhance Port and Port tenant freight rail access, Port staff
proposes a $2 million investment in freight facilities serving the Port, including the Quint Street lead.
• Pier 50: Located in China Basin, on Terry Francois Blvd south of AT&T Ballpark, Pier 50 houses the Port’s maintenance facility. The estimated capital need over the next 10 years totals $50 million; the Port proposes to allocate $20 million in revenue bond funds to seismically upgrade and repair the areas of the pier’s substructure in the worse condition.
• Wharf J9 Repairs: The Port needs to replace the Wharf J-9 seawall that is
required to continue use of the adjoining leased facilities for which the Port proposes to allocate $5 million in revenue bonds.

-13-
General Obligation Bond Projects In February 2008 San Francisco voters approved a $185 million General Obligation bond for park and open space improvements, of which $33.5 million has been allocated to fund or partially fund Port open space improvements across the Port’s waterfront. Port projects include: a promenade at Pier 43½ in Fisherman’s Wharf; the Brannan Street Wharf Park in South Beach; Bayfront Park in the Port’s China Basin region; and, in the Port’s Southern Waterfront, Crane Cove Park, Warm Water Cove Park, Islais Creek, and an entrance to Heron’s Head Park. In FY 2009-10, using $3.1 million of the first bond issuance the Port initiated planning and design efforts for these projects. Because the liability has not yet been removed from the capital needs side of the ledger, the 10-year Capital Plan includes the full balance of $33.5 million for these projects. Total G.O. Bond Park Funding Allocated to Port Projects Port Area
Proposed Park
Project
G.O. Bond Funding
Fisherman’s Wharf Pier 43½ Park Pier 43½ $9,000,000South Beach Brannon Street Wharf Park Brannon St. Wharf 3,000,000China Basin Bayfront Park
Crane Cove Park Warm Water Cove Park Islais Creek
Southern Waterfront
Heron’s Head Park Entrance
Blue Greenway Project
21,500,000
Total: $33,500,000 Development Projects The Port’s development projects are public-private partnership projects in which a developer enters into a lease of up to 66 years with the Port for property, secures financing and is responsible for project delivery. The Port expects the Pier 15-17 development project to begin construction in the next five years. As previously noted, cost estimates included in this Plan include only repair and replacement costs and seismic upgrades the Port would need to conduct in order to continue operating these facilities for current uses. The description below includes enhancements The Exploratorium is making to facilities to change their use; these changes go beyond the repairs, replacements, and seismic upgrades identified in the Port’s 10-year capital plan, and so their costs are not included below:
• Piers 15-17: The Board of Supervisors and Mayor Gavin Newsom have approved a Lease Disposition and Development Agreement and Lease with The Exploratorium to renovate Piers 15-17 and relocate The Exploratorium museum there from its current location at the Palace of Fine Arts. During the past several years, the museum has been looking for a new home to accommodate its

-14-
expanding needs. The Exploratorium will lease Pier 15 under a long-term lease and develop it for museum and ancillary uses, with the idea of expanding into Pier 17 in later years. Piers 15 and 17 are located in the Northeast Waterfront on The Embarcadero at Green Street. The most recent estimates for development of this facility include $175 million from The Exploratorium.
• SWL 337: Following extensive public input and a first-round Request for
Qualifications phase, the Port Commission has awarded a Request for Proposals for the development of an approximately 16 acre site immediately south of AT&T Park. The selected development team, SWL 337 Associates, LLC, proposes an urban mix of uses which may include office, rental residential and retail plus more than 5 acres of open space. The Port and development team are currently working on terms for an Exclusive Negotiation Agreement. The developer has stated order of magnitude project costs at $1 billion with total infrastructure costs estimated at approximately $200 million.
• SWL 351: In 2008, the Port sought development proposals for a 2/3 of an acre site
at the Embarcadero and Washington Streets along the Ferry Building Waterfront that is currently a surface parking lot. On February 24, 2009, the Port Commission authorized exclusive negotiations with San Francisco Waterfront Partners to combine the site with the adjacent tennis club property for a 3 acre mixed use project with a rebuilt recreation club, condominiums, restaurants, retail and a new public park. The developer proposes that the Port will receive land rent from the project of $500,000 a year and the developer would incur all capital and operating costs. This project is subject to a public planning process to refine the development parameters. This process is currently underway.
Port Infrastructure Financing District (IFD) In 2005 the State adopted legislation that allows the City to create an Infrastructure Financing District (IFD) within the Port’s jurisdiction. This alternative method of collecting property tax increment is a useful financing tool for the Port. The Port anticipates having a total of $205 million in IFD Bond funds available for a variety of projects, including Pier 70 improvements and other southern waterfront improvements. While some IFD Bond funding will be used by the Port for independent rehabilitation of facilities, other IFD Bond funds will be used as the Port’s investment in larger public-private developments. As described below, the Port intends to dedicate $140 million of these bond proceeds to Pier 70. In contrast to the last year’s Capital Plan, Port staff does not propose to allocate $65 million IFD bond proceeds that will arise from development of SWL 337. Pier 70 Development (Southern Waterfront): The Capital Plan identifies a total of approximately $545 million related to the Pier 70 complex including: environmental remediation, constructing and reconstructing streets, sidewalks, street lighting, and sewer and water system, open space development, historic building preservation and reuse of a portion of the site, principally along the main 20th Street stretching to the waterfront.

-15-
Long a ship-building and ship-repair site, Pier 70 now houses the most important collection of historic industrial buildings west of The Mississippi. Unfortunately, owing to age, type of construction, deterioration, lack of code compliance and absence of site utilities and other infrastructure, approximately half of the over 40 buildings on the site are vacant or underutilized. The Capital Plan program for Pier 70 envisions bringing most of the historic buildings and artifacts (fences, cranes) up to current code, repairing or replacing all building utilities and building systems, but not adding new square footage. Work would be done to meet the standards of the U.S. Secretary of the Department of Interior in keeping with the buildings' eligibility for the National Register of Historic Places. The Port’s 10-year capital plan programs $140 million in IFD Bond funds to cover Pier 70 infrastructure costs, which consist of $40 million to construct streets, sewers, water mains, sidewalks, and street lighting, approximately $30 million to conduct environmental clean-up, $20 million to make needed open space improvements, and $50 million to repair and upgrade wharves and piers. The Port should be better able to redevelop Pier 70 to viable reuses if it can invest growth in tax revenues from new investment in the project. The Port is finalizing a Pier 70 Preferred Master Plan that includes: 1) a survey of the historic resources and identification of adaptive reuse options, and 2) an economic and planning feasibility analysis with development options for Pier 70. Staff expect to complete this master plan by Spring 2010 and, with Port Commission approval, to issue a development RFI for Pier 70 in Spring 2010. This plan includes 3 million square feet of new construction, largely on unbuilt or underutilized parcels, and estimates the ground rent and new tax revenues projected from this development. The financial analyses for the Pier 70 Master Plan address similar capital costs and revenue sources as the Capital Plan, but are more detailed regarding Pier 70 specific issues, including use of growth in payroll taxes for specific project costs.

-16-
[INSERT MAP 1] Fisherman’s Wharf

-17-
[INSERT MAP 2] Northeast Waterfront

-18-
[INSERT MAP 3] Ferry Building Area

-19-
[INSERT MAP 4] South Beach

-20-
[INSERT MAP 5] China Basin

-21-
[INSERT MAP 6] Southern Waterfront

-22-
V. Unfunded (Deferred) and Emerging Needs
The Port’s proposed ten-year capital plan defers a total of $1.3 billion in needs. The most significant deferred projects include the following Port facilities:
Unfunded Projects
Region Port Facility
Unfunded Portion to Repair & Seismically
Upgrade Northeast Waterfront Pier 31, office and warehouse space, pier substructure $30,900,000
Pier 26, office and warehouse space, pier substructure 50,500,000 Pier 28, office and warehouse space, pier substructure 33,750,000 South
Beach Pier 38, maritime recreation facility near South Beach Harbor 50,000,000
Pier 50, Shed D, the Port’s Maintenance Facility, pier substructure 31,000,000 China
Basin Pier 54, office and warehouse space, pier substructure 41,700,000 Pier 70 Campus, contains a vast array of historic structures 320,000,000 Southern
Waterfront Pier 80 Cargo Facility 127,000,000 Funding Options for Deferred Projects
(a) Grant Funds – The Port may be able to secure grant funding for its open space and transportation projects.
(b) Public/Private Partnerships – Port staff believe Pier 33, Pier 35 and Pier 70 are
good candidates for future development projects. However, it has not sought direction from the Port Commission, issued RFPs or secured approvals from various state agencies such as the State Lands Commission and San Francisco Bay Conservation and Development Commission (BCDC) for project scopes. Thus, while the Port has identified these facilities as potential development projects, it is premature to conclude that they will be repaired and upgraded by a developer.
(c) No Identified Funding Options – If the Port is unable to identify a funding source
or a developer to repair and seismically upgrade these facilities, it will eventually need to close the facilities and demolish them (if it can secure funds for demolition) or allow them to deteriorate and fall into the bay.

-23-
VI. Conclusions The Port’s first 10-Year Capital Plan, issued in the spring of 2006, demonstrated the magnitude of the Port’s financial challenges and that dramatic, new strategies will be required to allow the Port to fulfill its maritime and land use missions. Since that time, it has become increasingly clear that the major source of funding to reconnect the City with its waterfront envisioned by the Waterfront Land Use Plan – private equity – is insufficient to the task. Without new public sources of funding, private sector investment alone in the Port will not succeed in revitalizing the Port and its historic structures. However, since 2006, Port staff and the Port Commission, with support of Mayor Gavin Newsom and the Board of Supervisors, have been laying the groundwork for an enhanced approach to financing waterfront improvements. In 2005, the Port won passage of SB 1085, permitting the establishment of Infrastructure Financing Districts on Port property, allowing the capture of future property tax increment. And in 2007, the Port won passage of SB 815, lifting “public trust” use restrictions on four of the Port’s seawall lots (337, 328, 330, and 347S), the largest of which – Lot A, SWL 337, in Mission Bay – is approximately 14 acres. In contrast to last year’s Capital Plan, the FY 2011-20 Capital Plan reflects the uncertainty of the current real estate market. Specifically, while Port staff assumes that revenues and tax increment arising from development of SWL 337 will likely be realized before 2019, the Plan no longer assigns the projected $65 million in tax increment debt proceeds arising from this development to specific uses. Furthermore, the projected revenue bond monies arising from the proposed development, also projected at $65 million, are assigned to projects likely to occur later than 2015. In an historic, first time ever contribution of public tax dollars to the Port, Proposition A on the February 2008 San Francisco Ballot was approved by a margin of 71.66% (Yes) to 28.34% (No). As a result, $33.5 million in waterfront open space projects –projects that serve the public good– are under way. In November 2008, the City’s voters approved Proposition D that provides two new tools to develop Pier 70: (1) an option for the Board of Supervisors to approve a Pier 70 plan in lieu of individual lease approvals; and (2) an optional new financing tool that allows the Port to capture 75% of the payroll and hotel tax increment generated by the Pier 70 development to help fund waterfront parks, marine terminals, environmental remediation, historic rehabilitation, and utility infrastructure. In 2009, the Port’s received $4.7 million from a new federal source of funding, the Water Resources Development Act of 2007. While the Port was successful in seeking this authorizing legislation in 2007, it was not until the Fall of 2009 that appropriations against this authority began to flow to Port projects. Following up on the success of

-24-
2009, Port staff have requested that the remaining $20.2 million of that 2007 federal authority be appropriated in 2010 to commence Port capital projects at Piers 35 and 70. Finally, in July 2009, the Port repaid the last of its municipal debt mandated by the transfer of the Port from State control to City custodialship. As a result, in February 2010 the Port issued $36.65 million in revenue bonds representing the first time in 25 years that the Port has been able to leverage its own balance sheet for new capital projects. In 2006, the Port’s Capital Plan seemed like (at best) a decades-long partial solution to a waterfront problem that developed over decades or (at worst) an exercise in futility. It now appears that the Port is poised to pursue dramatic new open space improvements and new strategies to preserve historic piers and buildings over the next ten years. As the Port focuses on delivery of revenue bond and general bond funded projects over the next five years of the Plan, it is clear that the Port must leverage currently available sources of land-based finance (revenue bonds, infrastructure financing districts, community facility districts) with other sources of public and private funding to gap-finance its projects. This strategy will strengthen the Port’s balance sheet in preparation for major projects at SWL 337 and Pier 70 that will require the Port to take on substantial new debt envisioned by the Capital Plan. Toward that end, Port staff is aggressively pursuing federal funding, including $20 million in U.S. Army Corps of Engineers funding authorized by Congress in the Water Resources Development Act but not yet appropriated to specific projects. There are still issues to be addressed in the Pier 70 area and other areas within the City’s waterfront. However, the Port’s newfound ability to utilize these new public resources constitutes a beginning to a more financially sound and sustainable Port of San Francisco. However, further changes to law and the Port’s financing strategy are required: the City and the Port need to fully develop plans for financing a new Cruise Terminal. The State of California can further contribute to its interests through allocating some or all of its share of possessory tax increment associated with developing Port property, as defined by the public trust and the BCDC Special Area Plan, along the San Francisco waterfront. The federal government, likewise, has an interest in removing threats to navigation posed by rotting Port facilities near navigation channels. The Port needs the continued support of the City’s elected family to enact some of the financing strategies described in the Port’s 10-yearCapital Plan. While these changes may be difficult to achieve, Port staff are energized to pursue these and other solutions that will eliminate waterfront blight and create a 21st century waterfront.

-25-
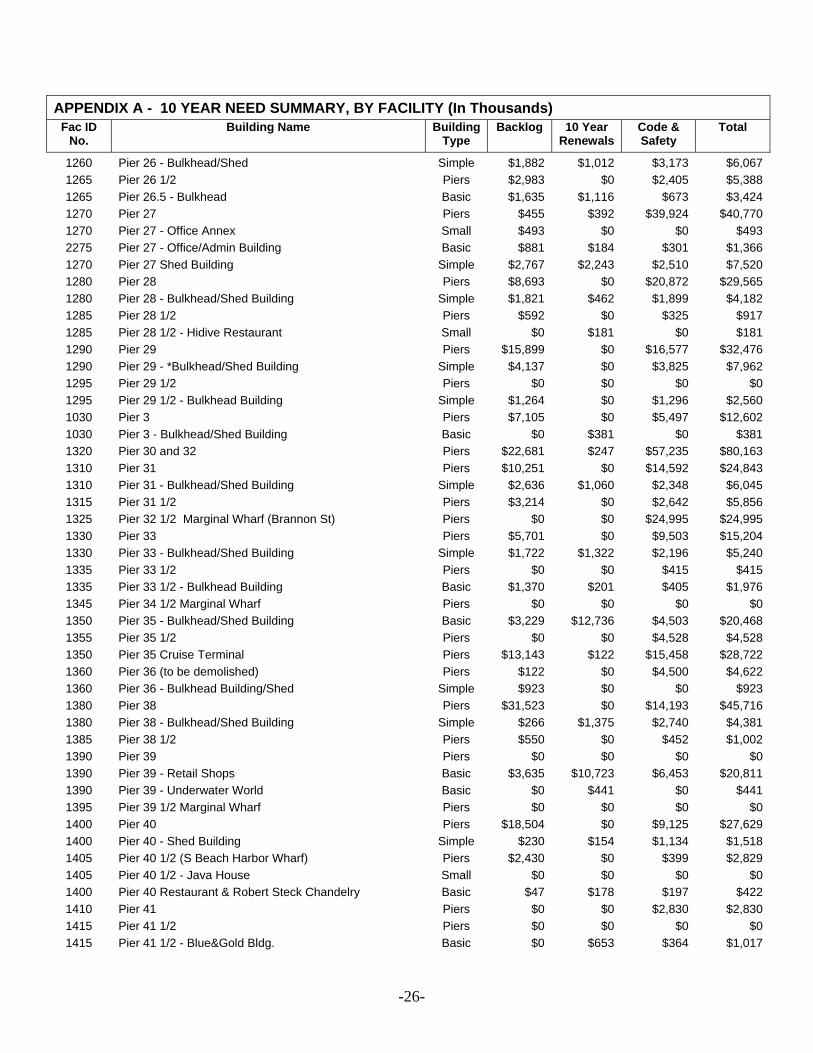
APPENDIX A - 10 YEAR NEED SUMMARY, BY FACILITY (In Thousands) Fac ID
No. Building Name Building
Type Backlog 10 Year
Renewals Code & Safety
Total
5470H Blue Shed Bldg (Wharf J-11) Simple $73 $0 $1,384 $1,457 1840 Copra Crane Basic $751 $0 $0 $751 1001 Downtown Ferry Terminal Basic $637 $0 $33,903 $34,540 0000 Equipment Basic $0 $0 $8,939 $8,939 2740 Fac. 200 - World Trade Club Restaurant Basic $284 $1,668 $741 $2,692 2000 Fac. 2000 - Ferry Plaza Piers $531 $327 $3,784 $4,642 2750 Fac. 274-175 - Ferry Building Clock Tower Basic $0 $310 $301 $611 2750 Fac. 274-275 Ferry Building Basic $0 $7,563 $7,352 $14,915 2780 Fac. 278 Agriculture Bldg Substructure Piers $4,751 $0 $2,605 $7,356 2780 Fac. 278 Agriculture Building Basic $3,163 $241 $547 $3,952 2750 Ferry Building: Fac. 274 - 275 Piers $0 $0 $0 $0 6020 Freight Yard - Intermodal Container Transfer Facility Street $3,355 $9,839 $26,931 $40,125 4000 Harbor Office at Hyde Street Small $0 $0 $505 $505 1980 Herons Head Park Basic $168 $0 $189 $357 2500 Hyde Street Pier Piers $0 $0 $0 $0 2500 Hyde Street Pier - Storage Buildings (3) Small $0 $0 $0 $0
000 Leased Piers Port Wide $0 $39,114 $0 $39,114
1010 Pier 1 Piers $0 $74 $0 $74 1010 Pier 1 - Office Building Basic $0 $2,313 $0 $2,313 1015 Pier 1 1/2 Piers $0 $0 $0 $0 1015 Pier 1 1/2 - Bulkhead/Shed Building Basic $0 $236 $0 $236 1005 Pier 1/2 Piers $733 $0 $2,030 $2,763 1140 Pier 14 (Public Pier) Piers $0 $0 $0 $0 1150 Pier 15 Piers $14,990 $0 $14,127 $29,117 1150 Pier 15 - Bulkhead/Shed Building (contains trailer Simple $2,715 $501 $3,435 $6,651 1155 Pier 15/17 - Office on Marginal Wharf Small $0 $0 $0 $0 1155 Pier 15/17 Valley - demolition Piers $7,986 $0 $0 $7,986 1170 Pier 17 Piers $7,203 $88 $9,525 $16,816 1170 Pier 17 - Shed Building Simple $2,808 $658 $2,883 $6,349 1175 Pier 17 1/2 Piers $1,301 $0 $427 $1,728 1190 Pier 19 Piers $7,956 $0 $8,558 $16,514 1190 Pier 19 - Bulkhead/Shed Building Simple $1,729 $150 $2,415 $4,294 1195 Pier 19 1/2 Piers $4,662 $0 $2,556 $7,218 1195 Pier 19 1/2 - Bulkhead/Shed Simple $563 $69 $1,080 $1,712 1020 Pier 2 Piers $3,882 $0 $1,852 $5,734 2770 Pier 2 - Sinbads Basic $115 $595 $157 $867 1225 Pier 22 1/2 Piers $2,081 $8 $901 $2,990 1225 Pier 22 1/2 - Fire Station Basic $523 $76 $123 $722 1225 Pier 22 1/2 - Maintenance / Recreation Small $0 $0 $0 $0 1230 Pier 23 Piers $5,539 $0 $9,111 $14,650 1230 Pier 23 - Bulkhead/Shed Building Simple $1,445 $565 $2,477 $4,487 1235 Pier 23 1/2 Piers $2,571 $0 $423 $2,994 1235 Pier 23 1/2 Pier 23 Cafe Small $0 $0 $0 $0 1245 Pier 24 1/2 Piers $3,959 $0 $3,102 $7,061 1245 Pier 24 1/2 -Bulkhead/Shed Building Simple $542 $0 $690 $1,232 1260 Pier 26 Piers $13,534 $0 $30,897 $44,431
-26-
APPENDIX A - 10 YEAR NEED SUMMARY, BY FACILITY (In Thousands) Fac ID
No. Building Name Building
Type Backlog 10 Year
Renewals Code & Safety
Total
1260 Pier 26 - Bulkhead/Shed Simple $1,882 $1,012 $3,173 $6,067 1265 Pier 26 1/2 Piers $2,983 $0 $2,405 $5,388 1265 Pier 26.5 - Bulkhead Basic $1,635 $1,116 $673 $3,424 1270 Pier 27 Piers $455 $392 $39,924 $40,770 1270 Pier 27 - Office Annex Small $493 $0 $0 $493 2275 Pier 27 - Office/Admin Building Basic $881 $184 $301 $1,366 1270 Pier 27 Shed Building Simple $2,767 $2,243 $2,510 $7,520 1280 Pier 28 Piers $8,693 $0 $20,872 $29,565 1280 Pier 28 - Bulkhead/Shed Building Simple $1,821 $462 $1,899 $4,182 1285 Pier 28 1/2 Piers $592 $0 $325 $917 1285 Pier 28 1/2 - Hidive Restaurant Small $0 $181 $0 $181 1290 Pier 29 Piers $15,899 $0 $16,577 $32,476 1290 Pier 29 - *Bulkhead/Shed Building Simple $4,137 $0 $3,825 $7,962 1295 Pier 29 1/2 Piers $0 $0 $0 $0 1295 Pier 29 1/2 - Bulkhead Building Simple $1,264 $0 $1,296 $2,560 1030 Pier 3 Piers $7,105 $0 $5,497 $12,602 1030 Pier 3 - Bulkhead/Shed Building Basic $0 $381 $0 $381 1320 Pier 30 and 32 Piers $22,681 $247 $57,235 $80,163 1310 Pier 31 Piers $10,251 $0 $14,592 $24,843 1310 Pier 31 - Bulkhead/Shed Building Simple $2,636 $1,060 $2,348 $6,045 1315 Pier 31 1/2 Piers $3,214 $0 $2,642 $5,856 1325 Pier 32 1/2 Marginal Wharf (Brannon St) Piers $0 $0 $24,995 $24,995 1330 Pier 33 Piers $5,701 $0 $9,503 $15,204 1330 Pier 33 - Bulkhead/Shed Building Simple $1,722 $1,322 $2,196 $5,240 1335 Pier 33 1/2 Piers $0 $0 $415 $415 1335 Pier 33 1/2 - Bulkhead Building Basic $1,370 $201 $405 $1,976 1345 Pier 34 1/2 Marginal Wharf Piers $0 $0 $0 $0 1350 Pier 35 - Bulkhead/Shed Building Basic $3,229 $12,736 $4,503 $20,468 1355 Pier 35 1/2 Piers $0 $0 $4,528 $4,528 1350 Pier 35 Cruise Terminal Piers $13,143 $122 $15,458 $28,722 1360 Pier 36 (to be demolished) Piers $122 $0 $4,500 $4,622 1360 Pier 36 - Bulkhead Building/Shed Simple $923 $0 $0 $923 1380 Pier 38 Piers $31,523 $0 $14,193 $45,716 1380 Pier 38 - Bulkhead/Shed Building Simple $266 $1,375 $2,740 $4,381 1385 Pier 38 1/2 Piers $550 $0 $452 $1,002 1390 Pier 39 Piers $0 $0 $0 $0 1390 Pier 39 - Retail Shops Basic $3,635 $10,723 $6,453 $20,811 1390 Pier 39 - Underwater World Basic $0 $441 $0 $441 1395 Pier 39 1/2 Marginal Wharf Piers $0 $0 $0 $0 1400 Pier 40 Piers $18,504 $0 $9,125 $27,629 1400 Pier 40 - Shed Building Simple $230 $154 $1,134 $1,518 1405 Pier 40 1/2 (S Beach Harbor Wharf) Piers $2,430 $0 $399 $2,829 1405 Pier 40 1/2 - Java House Small $0 $0 $0 $0 1400 Pier 40 Restaurant & Robert Steck Chandelry Basic $47 $178 $197 $422 1410 Pier 41 Piers $0 $0 $2,830 $2,830 1415 Pier 41 1/2 Piers $0 $0 $0 $0 1415 Pier 41 1/2 - Blue&Gold Bldg. Basic $0 $653 $364 $1,017

-27-
APPENDIX A - 10 YEAR NEED SUMMARY, BY FACILITY (In Thousands) Fac ID
No. Building Name Building
Type Backlog 10 Year
Renewals Code & Safety
Total
1430 Pier 43 Piers $98 $0 $265 $363 1430 Pier 43 - Arch Small $0 $208 $0 $208 1435 Pier 43 1/2 Piers $1,920 $0 $13,656 $15,576 1435 Pier 43 1/2 - Franciscan Restaurant Basic $553 $587 $353 $1,492 1435 Pier 43 1/2 - Red & White Tours Small $0 $0 $0 $0 1435 Pier 43 1/2 - Taits/Patio Sandwhich Shop Small $49 $0 $0 $49 1450 Pier 45 Piers $1,258 $2,189 $152 $3,599 1450 Pier 45 - Shed A Simple $448 $1,208 $2,293 $3,949 1450 Pier 45 - Shed B Simple $450 $1,215 $1,798 $3,463 1450 Pier 45 - Shed C Simple $695 $318 $4,880 $5,894 1450 Pier 45 - Shed D Simple $459 $1,098 $1,624 $3,181 1461 Pier 46B China Basin Ferry Terminal Piers $803 $0 $8,925 $9,728 1470 Pier 47 - Guardinos Storage Bldg Small $0 $53 $0 $53 1470 Pier 47 - Scoma / Fish Prep Bldg Small $0 $49 $0 $49 1470 Pier 47 - Scoma Storage Bldg Small $0 $87 $0 $87 1470 Pier 47 - Scomas Restaurant Basic $324 $1,023 $306 $1,654 1470 Pier 47 - Scomas Storage Shed Small $0 $19 $0 $19 1470 Pier 47 - Wharf J6, J7, J8 Piers $1,767 $716 $3,826 $6,310 1470 Pier 47 WF Albert Seafoods Proc Bldg Simple $120 $77 $161 $358 1480 Pier 48 Piers $7,351 $1,417 $1,340 $10,109 1480 Pier 48 - Shed A Simple $1,509 $194 $0 $1,703 1480 Pier 48 - Shed B Simple $1,550 $199 $0 $1,749 1485 Pier 48 1/2 - Jellys restaurant Small $0 $0 $0 $0 1490 Pier 49 - Aliotos Restaurant (Wharf J-1) Basic $0 $357 $298 $655 1490 Pier 49 - Fishermans Grotto No. 9 (Wharf J-1) Basic $0 $554 $463 $1,017 1490 Pier 49 - Fishermans Memorial Chapel Small $0 $139 $0 $139 1490 Pier 49 - Guardinos (Wharf J-1) Small $0 $0 $0 $0 1490 Pier 49 - Sabella & Latorre (Wharf J-1) Small $0 $0 $0 $0 1490 Pier 49 - Tarantinos Restaurant (Wharf J-1) Basic $0 $216 $176 $392 1490 Pier 49 - The Crab Station (Wharf J-1) Small $0 $0 $0 $0 1490 Pier 49 Nicks Lighthouse (Wharf J-1) Small $0 $0 $0 $0 1050 Pier 5 Piers $0 $0 $0 $0 1055 Pier 5 1/2 - Bulkhead Building Basic $0 $279 $0 $279 1500 Pier 50 Piers $26,966 $1,654 $17,471 $46,091 1500 Pier 50 - Shed A Simple $1,991 $320 $1,836 $4,147 1500 Pier 50 - Shed B Simple $1,033 $1,034 $1,862 $3,930 1500 Pier 50 - Shed C Simple $1,244 $1,367 $2,237 $4,848 1500 Pier 50 - Shed D Simple $1,196 $865 $2,860 $4,921 1505 Pier 50 1/2 Piers $0 $0 $329 $329 2505 Pier 50 Administration Building Basic $1,601 $549 $480 $2,630 1520 Pier 52 Piers $0 $0 $3,784 $3,784 1540 Pier 54 Piers $28,669 $0 $11,361 $40,030 1540 Pier 54 - Office Bldg Small $464 $0 $0 $464 1540 Pier 54 - Oil Shed Small $111 $0 $0 $111 1540 Pier 54 - Shed Building Simple $363 $82 $607 $1,053 1540 Pier 54 - Storage Shed Small $0 $37 $0 $37 1600 Pier 60 - Wharf - wood piles Piers $1,021 $0 $441 $1,462

-28-
APPENDIX A - 10 YEAR NEED SUMMARY, BY FACILITY (In Thousands) Fac ID
No. Building Name Building
Type Backlog 10 Year
Renewals Code & Safety
Total
1600 Pier 60 - Wharf Carmens Restaurant Small $120 $0 $0 $120 1640 Pier 64 Piers $2,523 $0 $1,636 $4,159 1645 Pier 64 1/2 Kelly Mission Rock Resort Restnt Basic $0 $171 $0 $171 1680 Pier 68 Piers $6,638 $36,130 $24,104 $66,872 1075 Pier 7 - The Waterfront Restaurant Basic $267 $216 $150 $633 1075 Pier 7 1/2 Piers $0 $0 $0 $0 1070 Pier 7 Public Pier Piers $0 $0 $0 $0 1700 Pier 70 Piers $46,402 $0 $89,458 $135,860 1680 Pier 70 - Pier 68 - Bathrooms Bldg. #141 Small $0 $0 $0 $0 1680 Pier 70 - Pier 68 - Beth Street Substation #2, Bldg. #50 Small $83 $0 $0 $83 1680 Pier 70 - Pier 68 - Beth Street Warehouse Bldg. #30 Small $0 $650 $0 $650 1680 Pier 70 - Pier 68 - Blast Shed Bldg. #150 Small $0 $0 $0 $0 1680 Pier 70 - Pier 68 - Boiler/Steam Power House - #103 Small $0 $258 $202 $460 1680 Pier 70 - Pier 68 - Building #149 Small $0 $0 $0 $0 1680 Pier 70 - Pier 68 - Cable/Electric Shop - Bldg.#38 Simple $733 $0 $5,616 $6,349 1680 Pier 70 - Pier 68 - Checkhouse #1, Bldg. #122 Small $0 $0 $165 $165 1680 Pier 70 - Pier 68 - Checkhouse #2, Bldg. #123 Small $0 $0 $80 $80 1680 Pier 70 - Pier 68 - Equipment Building #36 Simple $243 $92 $2,290 $2,625 1680 Pier 70 - Pier 68 - Machine Shop - Bldg. #105 Simple $451 $41 $3,690 $4,182 1680 Pier 70 - Pier 68 - near checkhouse #2, Building #51 Small $56 $0 $0 $56 1680 Pier 70 - Pier 68 - Office Bldg (#127) Small $0 $0 $0 $0 1680 Pier 70 - Pier 68 - Office Bldg Annex to #101, Bldg. #40 Basic $1,310 $0 $291 $1,601 1680 Pier 70 - Pier 68 - Office Building #101 Basic $5,515 $545 $25,683 $31,744 1680 Pier 70 - Pier 68 - Office Building #104 Basic $3,829 $0 $17,407 $21,236 1680 Pier 70 - Pier 68 - Office/Warehouse Bldg.- Bldg #111 Basic $5,362 $1,213 $9,803 $16,377 1680 Pier 70 - Pier 68 - Ops. Bldg #102 Basic $751 $160 $835 $1,746 1680 Pier 70 - Pier 68 - Pipe Rack, Bldg. #120 Small $0 $0 $43 $43 1680 Pier 70 - Pier 68 - Pipe Storage Bldg #107 Small $0 $200 $0 $200 1680 Pier 70 - Pier 68 - Sheet Metal/Tools Bldg #109 Simple $1,059 $861 $471 $2,391 1680 Pier 70 - Pier 68 - Shipwright Building -#108 Basic $5,418 $226 $10,006 $15,650 1680 Pier 70 - Pier 68 - Steel Shop Office (bldg #121) Small $0 $85 $0 $85 1680 Pier 70 - Pier 68 - Substation #4 (bldg #58) Small $0 $0 $131 $131 1680 Pier 70 - Pier 68 - Substation #6, Bldg. #64 Small $278 $0 $942 $1,220 1680 Pier 70 - Pier 68 - Substation #7 (bldg #68) Small $0 $200 $73 $273 1680 Pier 70 - Pier 68 - Warehouse & 6-ton crane, Bldg. #49 Simple $85 $117 $23 $224 1680 Pier 70 - Pier 68 - Yard Washroom, Bldg. #110 Small $545 $0 $712 $1,257 1680 Pier 70 - Pier 68 - Yard Washroom, Bldg. #119 Small $200 $0 $0 $200
3450 Pier 70 - SWL 345 - Kneass Boatworks, Main Office/boat storage Simple $0 $0 $1,561 $1,561
3450 Pier 70 - SWL 345 - Kneass, Pier 66 Boatyard Office Small $278 $0 $0 $278 3490 Pier 70 - SWL 349 - Auto Yard Shop Bldg #19 Simple $177 $0 $1,042 $1,219
3490 Pier 70 - SWL 349 - Beth Street Stress Relieving, Bldg. #16 Simple $249 $0 $1,159 $1,408
3490 Pier 70 - SWL 349 - Beth Street Warehouse, Bldg. #32 Simple $322 $0 $1,428 $1,750
3490 Pier 70 - SWL 349 - Beth Street Washroom & Locker, Bldg. #24 Small $476 $0 $662 $1,138
3490 Pier 70 - SWL 349 - Beth Street Washroom & Locker, Bldg. #25 Small $0 $207 $50 $257

-29-
APPENDIX A - 10 YEAR NEED SUMMARY, BY FACILITY (In Thousands) Fac ID
No. Building Name Building
Type Backlog 10 Year
Renewals Code & Safety
Total
3490 Pier 70 - SWL 349 - Beth Street Washroom & Locker, Bldg. #29 Small $513 $0 $786 $1,299
3490 Pier 70 - SWL 349 - Brass Foundry, Bldg. #115 Simple $484 $0 $5,161 $5,645 3490 Pier 70 - SWL 349 - Foundry, Bldg. #116 Simple $484 $0 $5,161 $5,645 3490 Pier 70 - SWL 349 - Test Room, Bldg. #23 Small $604 $0 $235 $839 3490 Pier 70 - SWL 349 - UIW Machine Shop, Bldg. #114 Simple $242 $0 $2,353 $2,595 3490 Pier 70 - SWL 349 Building #6 (condemned) Simple $1,035 $0 $6,414 $7,449 3490 Pier 70 - SWL 349 Equipment Bldg - Bldg #14 Simple $433 $0 $4,946 $5,379 3490 Pier 70 - SWL 349 Heavy Machine Shop - Bldg #113 Simple $2,312 $0 $27,240 $29,552 3490 Pier 70 - SWL 349 Office Building - Bldg. #11 Noonan Basic $3,544 $466 $7,608 $11,618 3490 Pier 70 - SWL 349 SF Shipyard Training Bldg 117 Simple $607 $191 $9,625 $10,423 3490 Pier 70 - SWL 349 Shop Building - Bldg #21 Simple $225 $0 $3,404 $3,629 3490 Pier 70 - SWL 349 Traffic Department Bldg. #12 & #15 Basic $7,440 $0 $16,147 $23,587 3490 Pier 70 - SWL 349 Traffic Dept. Shed - Bldg #66 Simple $615 $0 $544 $1,159 3490 Pier 70 - SWL 349 Warehouse - Bldg.2 Simple $2,341 $0 $18,733 $21,074 1800 Pier 80 Piers $8,413 $2,460 $56,833 $67,707 1800 Pier 80 - Entry Canopy Simple $226 $0 $272 $498 1800 Pier 80 - Gear & Maintenance Building Simple $906 $203 $961 $2,070 1800 Pier 80 - Office Bldg #2 Small $0 $98 $0 $98 1800 Pier 80 - Service Building Simple $1,124 $1,180 $764 $3,068 1800 Pier 80 - Shed A Simple $3,813 $1,868 $21,545 $27,226 1800 Pier 80 - Shed D Simple $2,757 $1,173 $4,166 $8,096 1800 Pier 80 - Terminal Office Small $246 $0 $0 $246 2800 Pier 80 Administration Building Basic $2,360 $2,519 $1,935 $6,814 1800 Pier 80 Office Bldg #1 Small $0 $98 $0 $98 1090 Pier 9 Piers $10,801 $0 $8,877 $19,678 1095 Pier 9 1/2 Piers $700 $0 $576 $1,276 1090 Pier 9 Bulkhead/Shed Building Basic $8,030 $2,970 $3,169 $14,169 1900 Pier 90 Piers $9,838 $0 $0 $9,838 1900 Pier 90 - Fire Department Building Basic $68 $46 $154 $268 1900 Pier 90 - Maintenance Bldg Small $0 $87 $0 $87 1900 Pier 90 - Old Powerhouse Small $0 $0 $0 $0 1900 Pier 90 - Storage Bldg Small $0 $32 $0 $32 1900 Pier 90 - Truck Pits Small $0 $91 $0 $91 1920 Pier 92 Piers $3,758 $0 $0 $3,758 1940 Pier 94 - 96 wharf area Piers $4,679 $0 $13,968 $18,647 1940 Pier 94 - Wharfside Building Small $0 $0 $0 $0 1960 Pier 96 - Administration Building Basic $556 $498 $383 $1,437 1960 Pier 96 - Bounty Restaurant Basic $733 $0 $145 $878 1960 Pier 96 - Entry Canopy Simple $173 $0 $246 $419 1960 Pier 96 - Exit Canopy Simple $103 $19 $146 $268 1960 Pier 96 - Gatehouse Bldg Small $0 $201 $0 $201 1960 Pier 96 - Maintenance Building Basic $1,291 $687 $746 $2,724 1960 Pier 96 - Office/Restroom Small $0 $119 $0 $119 1960 Pier 96 - Recycling/LASH Terminal Simple $2,201 $4,466 $4,596 $11,263 1960 Pier 96 - Storage Small $0 $133 $0 $133 1960 Pier 96 - Truck Scales Small $0 $35 $0 $35

-30-
APPENDIX A - 10 YEAR NEED SUMMARY, BY FACILITY (In Thousands) Fac ID
No. Building Name Building
Type Backlog 10 Year
Renewals Code & Safety
Total
0000 Port-wide Projects Port Wide $44,280 $256,808 $4,749 $305,837
4036 Street - 20th east of Illinois Street $401 $0 $0 $401 4038 Street - 24th from Michigan to Maryland Street $559 $0 $500 $1,059 4043 Street - Amador and extension Street $1,774 $0 $15,744 $17,518 4022 Street - Broadway btw Embarcadero & Vallejo Street $441 $0 $63 $504 4008 Street - Embarcadero from Taylor to Powell Street $0 $0 $0 $0 4020 Street - Green between Davis and Front Street $147 $0 $0 $147 3030 Street - Hyde Alley, Fish Alley Street $259 $0 $189 $448 4001 Street - Hyde N of Jefferson to Hyde St Pier Street $210 $0 $0 $210 4004 Street - Jefferson btw Jones and Leavenworth Street $109 $0 $0 $109 4002 Street - Jefferson from Leavenworth to Hyde Street $114 $0 $847 $961 4017 Street - Lombard btw Sansome and Embarcadero Street $156 $0 $0 $156 4040 Street - Marin east of Michigan Street $147 $0 $505 $652 3020 Street - Pier 47, Fish Alley, Al Scoma Way Street $350 $0 $0 $350 4003 Street - R.H. Dana Dr. (Leavenworth) N of Jefferson Street $129 $0 $0 $129 4033 Street - T. Francois along China Basin Street $440 $0 $0 $440 4034 Street - T. Francois btw China Basin and Mission R Street $4,605 $0 $0 $4,605 4006 Street - Taylor Street btw. Jefferson and Embarcadero Street $267 $0 $252 $519 4041 Street - TN, IN, MN btw Tulare and Marin Street $770 $0 $0 $770 3010 SWL 301 - Andre Boudin Pavilion Small $0 $0 $1,514 $1,514 3010 SWL 301 - Andre Boudin Restaurant Basic $0 $139 $0 $139 3020 SWL 302 - Alioto Fish Co. Basic $0 $457 $390 $847 3020 SWL 302 - Castagnola/Storage Bldg Small $0 $0 $0 $0 3020 SWL 302 - Crab Boat Owners Asso. Basic $339 $0 $67 $406 3020 SWL 302 - Firewood Cafe Basic $0 $115 $98 $213 3020 SWL 302 – Pompei’s Grotto Basic $0 $103 $102 $205 3020 SWL 302 - Port Harbor Office Small $0 $53 $0 $53 3020 SWL 302 - Scomas (Smoke House) Basic $0 $67 $118 $185 3020 SWL 302 - United Shellfish Warehouse Small $0 $160 $0 $160 3030 SWL 302 Cal Shell Fish Shed Small $0 $0 $0 $0 3020 SWL 302 Castagnola Rest. Basic $0 $437 $364 $801 3020 SWL 302 Coast Marine Supply Mat. Storage Bldg Simple $0 $181 $515 $696 3020 SWL 302 Costal Marine Retail Space Small $0 $0 $0 $0 3020 SWL 302 D&G Co. d.b.a. Lou Blues Small $0 $511 $0 $511 3020 SWL 302 Franks Fisherman Supply Basic $85 $248 $202 $535 3020 SWL 302 Substructure (Wharf J-9) Piers $4,550 $339 $1,723 $6,613 3020 SWL 302 United Shellfish Processing Simple $0 $15 $42 $57 3030 SWL 303 - Alioto Fish Co, Basic $0 $325 $181 $506 3030 SWL 303 - Cal Shell Fish Basic $0 $275 $120 $395 3030 SWL 303 - Cioppinos/(Hoppe) Basic $0 $572 $281 $853 3030 SWL 303 - Franceschis Restaurant Basic $0 $112 $91 $203 3030 SWL 303 - GP Resources Small $0 $29 $0 $29 3030 SWL 303 - SP Tarantino/Martell Ins Small $0 $0 $0 $0 3030 SWL 303 - The Bay Company, Hoppe, Arthur N. Basic $0 $252 $206 $458 3110 SWL 311 Pier 39 Garage Simple $0 $756 $5,968 $6,724 3130 SWL 313 Embarcadero Triangle Lot Assn. Simple $0 $598 $2,830 $3,428

-31-
APPENDIX A - 10 YEAR NEED SUMMARY, BY FACILITY (In Thousands) Fac ID
No. Building Name Building
Type Backlog 10 Year
Renewals Code & Safety
Total
3150 SWL 315 Office Building (HHC Investment limited) Basic $0 $4,255 $3,260 $7,515 3150 SWL 315 Parking Structure Simple $0 $502 $3,792 $4,294 3160 SWL 316 Houston’s Restaurant Basic $0 $487 $311 $798 3170 SWL 317 Office Building Basic $0 $6,888 $3,578 $10,466 3180 SWL 318 Roundhouse One Basic $0 $627 $496 $1,123 3180 SWL 318 Roundhouse Two Basic $1,246 $771 $674 $2,691 3180 SWL 318 Sandhouse Small $0 $200 $0 $200 3190 SWL 319 Fog City Diner Basic $0 $293 $114 $407 3220 SWL 322 ABC TV Basic $0 $8,944 $4,178 $13,122 3300 SWL 330 Restaurant and Apts. at Townsend Basic $0 $1,749 $1,848 $3,597 3310 SWL 331 & 332 Delancey Street Foundation Basic $0 $3,923 $4,040 $7,963 3430 SWL 343 Blue Peter Building Simple $383 $39 $478 $900 3450 SWL 345 - SF Boat Works Office/Shop Basic $173 $248 $190 $610 3450 SWL 345 - SF Boat Works Storage/The Ramp Simple $147 $0 $158 $305 3520 SWL 352 - Backlands Redevelopment Basic $2,304 $0 $0 $2,304 1620 Third Street Bridge House Small $0 $0 $0 $0
5470H Wharf J-11 Piers $411 $0 $0 $411 5470 Wharf J-4 Piers $989 $80 $0 $1,069 1490 Wharfs J-1 and J-3 (Pier 49) Piers $0 $760 $2,921 $3,681
PORT TOTAL $590,154 $471,017 $1,039,469 $2,100,640


