33 Garment Industry in Sri Lanka Challenges, Prospects and Strategies 1 Rupa Dheerasinghe Abstract Garment industry has been the Sri Lanka’s largest gross export earner since 1986 and accounted for more than 52 per cent of total export earnings of the country. It is also the country’s largest net foreign exchange earner since 1992. Sri Lanka as a garment exporter has shown signs of improvement in many respects yet even at present, the quota system covers more than 52 per cent of the country’s garment exports. However, Sri Lanka depends on quotas much less than other South Asian countries. Besides, dependence on the quota system, there are weaknesses in the domestic industrial and export structure, labour markets rigidities and strong competition in international markets. They need urgent attention for survival in a quota free market. Therefore, the future of the garment industry will depend on the competitive edge that Sri Lanka has over her competitors in Asia, Latin and Central America and emerging producers in Africa and Eastern Europe who benefit from favourable trading arrangements with major markets. This analysis shows that, phasing out of quotas will close down nearly fifty per cent of existing garment factories, as they loss that protection. However, some of the medium and large scale factories are expected to survive exploiting opportunities in the free market. Sri Lanka’s garment industry is highly concentrated in large scale factories. That concentration will save a large part of export earnings while preserving job opportunities. However, in the short-run there will be an adverse impact on employment. (JEL F14, L11) 1/ The author wishes to express her sincere thanks to Dr. A .G. Karunasena, Director and Dr. H N Thenuwara, Additional Director, Economic Research Department for their useful comments and suggestions on an earlier version of this paper.
Transcript
CHALLENGES, PROSPECTS AND STRATEGIES FOR THE GARMENT INDUSTRY IN SRI LANKA
33
Garment Industry in Sri LankaChallenges, Prospects and Strategies1
Rupa Dheerasinghe
Abstract
Garment industry has been the Sri Lanka’s largest grossexport earner since 1986 and accounted for more than 52per cent of total export earnings of the country. It is also thecountry’s largest net foreign exchange earner since 1992.Sri Lanka as a garment exporter has shown signs ofimprovement in many respects yet even at present, the quotasystem covers more than 52 per cent of the country’s garmentexports. However, Sri Lanka depends on quotas much lessthan other South Asian countries. Besides, dependence onthe quota system, there are weaknesses in the domesticindustrial and export structure, labour markets rigidities andstrong competition in international markets. They need urgentattention for survival in a quota free market. Therefore, thefuture of the garment industry will depend on the competitiveedge that Sri Lanka has over her competitors in Asia, Latinand Central America and emerging producers in Africa andEastern Europe who benefit from favourable tradingarrangements with major markets.
This analysis shows that, phasing out of quotas willclose down nearly fifty per cent of existing garment factories,as they loss that protection. However, some of the mediumand large scale factories are expected to survive exploitingopportunities in the free market. Sri Lanka’s garment industryis highly concentrated in large scale factories. Thatconcentration will save a large part of export earnings whilepreserving job opportunities. However, in the short-run therewill be an adverse impact on employment. (JEL F14, L11)
1/ The author wishes to express her sincere thanks to Dr. A .G. Karunasena, Director andDr. H N Thenuwara, Additional Director, Economic Research Department for their usefulcomments and suggestions on an earlier version of this paper.
34
STAFF STUDIES NO. 33
1. Introduction
Garment industry has an important place in Sri Lanka’s economy. It hasbecome Sri Lanka’s largest export industry since 1986. It is also the country’slargest net foreign exchange earner since 1992. Total value of export earningsin the sector was at US dollars 2,424 million accounting for 52 per cent of thetotal export earnings in 2002. The contribution to the Gross Domestic Product(GDP) was 5.3 per cent in 2002. This industry provides more than 330,000direct employment or 5 per cent of country’s total employment in more than1,060 garment factories.
Sri Lanka’s garment exports have been largely governed by theMulti-fibre Arrangement (MFA) since 1978. The MFA is a system of exportrestrictions imposed by developed countries on textiles and garment exportsoriginating in developing countries to protect the garment industry in developedcountries. The Uruguay Round Agreement on Textiles and Clothing (ATC) ofWTO succeeded MFA in 1995. According to the new rules, the sector is to befully integrated into normal rules of WTO by phasing out MFA in four phasesby 2005. Sri Lanka has already fulfilled its commitments under Phase I andPhase II of the elimination of MFA phasing out procedures. The governmentsubmitted to the Textiles Monitoring Body of WTO in 1996 and 1998 lists ofitems on which Sri Lanka is ready to accept the removal of quota. The thirdphase of integration became effective on January 2002.
The MFA, by providing a ready market, has restricted Sri Lanka’s exportsbut has protected it from competitors. Phasing out of MFA will open up moremarkets to Sri Lanka’s exports, and at the same time will intensify competitionfrom other developing countries. The future of the garment industry depends,to a large extent, on the ability to compete in free market where both garmentproducing developed and developing countries in the world will be players inthe market. Over the last 20 years, a strong foundation has been laid for theindustry, on which the future of this sector could be strengthened further andsafeguarded. Yet there is much to be done to meet the challenges of intensecompetition in the coming years. This paper identifies the threats andchallenges faced by the industry and assesses the capabilities and prospectsof the sector to face them.
The rest of the paper is structured as follows. Section II of this paperdiscusses the international and domestic trade policy relating to textiles andgarment industry. Section III examines the nature of Sri Lanka’s textiles andgarment industry and its challenges. Section IV provides the challenges thatthe garment industry face in the global environment and possible challengesin the post–MFA period. Section V evaluates the impact of liberalisation ofworld textiles and garment industry and Section VI identifies the areas in
CHALLENGES, PROSPECTS AND STRATEGIES FOR THE GARMENT INDUSTRY IN SRI LANKA
35
which the textiles and garment sector could maximize existing capacity toachieve its goals and objectives.
II. Impact of International and Domestic Policies on Textiles andGarment Industry
A. International Policy
In the world economy, the textiles and garment sector contributed nearly6 per cent to world merchandise exports. However, world trade in textiles andgarments takes place in a highly protected market with tariffs and quantitativerestrictions. The main impediment to trade in the past has been the quantitativerestrictions that have been in force for several decades.
The restrictions on the textile and garment industry have a long historytracing back to the 1930s, when USA and UK took action to limit textile importsfrom Japan. The emergence of some less developed countries as producers ofgarments together with excess capacity in many developed countries resultedin UK and USA negotiating Voluntary Export Restraints (VERs) with emergingeconomies. A series of short term and long term trading arrangements werethen followed by MFA.
The Multi-fibre Arrangement
The MFA had four successive phases consisting of about 100 bilateralagreements negotiated under a multilateral framework and covering about80 per cent of world textiles and garment exports. The MFA was intended toprovide temporary protection to domestic textiles and garment industry toadjust to foreign competition and to provide developing countries with ‘orderlyaccess’ to industrial country markets. In addition to the restrictions imposedby MFA, there are various other restrictions on developing countries relatingto countries who do not participate in MFA and textiles and garment itemsthat are not included in MFA. Thus, in 1992 the textiles and clothing tradewas subjected to 127 MFA and non-MFA restraints agreements. The industrialcountries as well as many developing countries which export textiles andclothing used extensive and high protection through both high tariffs andquantitative restrictions to limit foreign competition.
The arguments for the benefits of restrictive markets, emphasis that thesebilateral agreements provided opportunities to small exporting countries toaccess large market and enable them to increase earnings from market share
36
STAFF STUDIES NO. 33
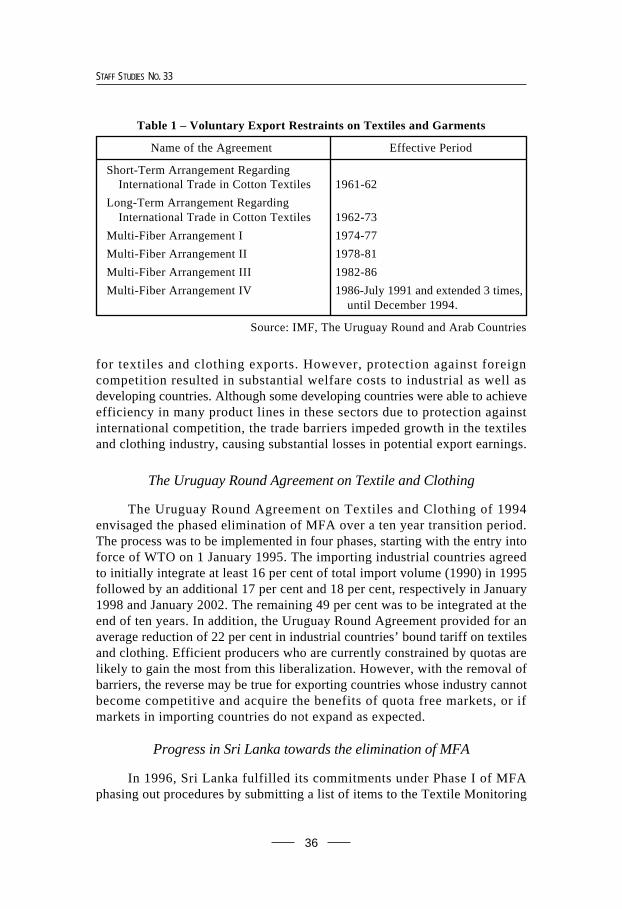
Table 1 – Voluntary Export Restraints on Textiles and Garments
Name of the Agreement Effective Period
Short-Term Arrangement RegardingInternational Trade in Cotton Textiles 1961-62
Long-Term Arrangement RegardingInternational Trade in Cotton Textiles 1962-73
Multi-Fiber Arrangement I 1974-77
Multi-Fiber Arrangement II 1978-81
Multi-Fiber Arrangement III 1982-86
Multi-Fiber Arrangement IV 1986-July 1991 and extended 3 times,until December 1994.
Source: IMF, The Uruguay Round and Arab Countries
for textiles and clothing exports. However, protection against foreigncompetition resulted in substantial welfare costs to industrial as well asdeveloping countries. Although some developing countries were able to achieveefficiency in many product lines in these sectors due to protection againstinternational competition, the trade barriers impeded growth in the textilesand clothing industry, causing substantial losses in potential export earnings.
The Uruguay Round Agreement on Textile and Clothing
The Uruguay Round Agreement on Textiles and Clothing of 1994envisaged the phased elimination of MFA over a ten year transition period.The process was to be implemented in four phases, starting with the entry intoforce of WTO on 1 January 1995. The importing industrial countries agreedto initially integrate at least 16 per cent of total import volume (1990) in 1995followed by an additional 17 per cent and 18 per cent, respectively in January1998 and January 2002. The remaining 49 per cent was to be integrated at theend of ten years. In addition, the Uruguay Round Agreement provided for anaverage reduction of 22 per cent in industrial countries’ bound tariff on textilesand clothing. Efficient producers who are currently constrained by quotas arelikely to gain the most from this liberalization. However, with the removal ofbarriers, the reverse may be true for exporting countries whose industry cannotbecome competitive and acquire the benefits of quota free markets, or ifmarkets in importing countries do not expand as expected.
Progress in Sri Lanka towards the elimination of MFA
In 1996, Sri Lanka fulfilled its commitments under Phase I of MFAphasing out procedures by submitting a list of items to the Textile Monitoring
CHALLENGES, PROSPECTS AND STRATEGIES FOR THE GARMENT INDUSTRY IN SRI LANKA
37
Body of WTO. Sri Lanka submitted a second list of items to be integratedunder phase II in 1998. The third stage of integration came into effect on1 January 2002. However, so far, the process of removing quota in USA andEU has been slow. The number of quota actually eliminated during the firsttwo stages in USA and EU were 2 out of 291 in USA and 14 out of 750 in EUquota.2
Under the third stage of integration in force USA has fully integrated20 categories of garments, 5 categories of fabric, 7 categories of made uparticles and 4 categories of yarn and partially integrated 4 categories ofgarments and one category of made up articles. However, this covers only 8of Sri Lanka quota categories. As a majority of the items are to be phased outin a latter stage, when industrial countries postpone liberalization of sensitiveitems to the end, exporting countries like Sri Lanka may face difficulties inphasing out the last stage of implementation.
There are positive developments in Sri Lanka, in several areas indicatingthat the garment industry is preparing for thrive in quota-free markets. Theshare of non-quota exports increased in the recent past. The importance ofquota categories declined gradually and reached 61 per cent in 2000 from67 per cent in 1990. Quota restrictions imposed by EU on Sri Lanka garmentexports were fully withdrawn in 2001. Dependence on quota markets fell byabout 8 percentage points to 53 per cent in 2002. During 1996-2002, value ofexports to non-restricted markets increased by 11 per cent while garment tradehas diversified to more than 80 countries. However, the value of garmentexports to these countries accounted for not more than 4 per cent until 2000.Nevertheless, removal of quota restrictions on garment exports to EU countrieshelped to increase the share of non restricted markets to 35 per cent in 2002.Another development is that the country has moved towards higher value addedproduct lines, increasing net foreign exchange earnings.
B. Domestic Export Policy relating to Textile and Garment industry
The textiles and garment industry began in 1950’s when the governmenttook steps to promote the textiles industry as an import substitution industry.At this stage Sri Lanka imported raw material and produced yarn, raw fabricsand finished fabrics mainly in a few large scale textile mills established undergovernment ownership. Power-loom and hand loom centres largely owned byprivate sector too engaged in the production of yarn and fabric. The textilesproduced in these industries were fully utilised in the domestic market.Domestic industries were highly protected by the government by controllingthe imports of finished products. Importation and distribution of raw material2/ IMF/World Bank (2001), Market Access for Developing Countries Exports.
38
STAFF STUDIES NO. 33
too were controlled by the government. Local products were limited to a fewstandard items. In a highly protected environment, no incentives for qualityimprovement and not much progress were seen. They were sold mainly in thelower end domestic market. Garments industry began in the mid 1960s, wasmainly run by a few large private companies. As importation of textiles wasbanned or highly restricted, these industries had to depend on local rawmaterial. Almost the entirety of garments produced by these industries wassold in domestic market. There were hardly any exports of textiles andgarments.
Economic liberalisation policies in 1977 paved the way for localhandloom and garment industry to enter the world market. The market friendlyeconomic environment created by liberalisation and supportive measures suchas subsidy and duty rebate schemes, duty free import of raw material andmachinery, lower taxes and tax holidays as well as the implementation of theKatunayaka Industrial Processing Zone in 1978 encouraged export ledindustries. The other important factor that was responsible for the rapidexpansion in the textiles and garment industry were the changes in the worldgarments and textile markets, particularly the introduction of MFA whichprovided opportunities to enter the world markets under the quota system.
Even at present, more than 52 per cent of textiles and garment exportsfrom Sri Lanka are governed by MFA. Under the quota system, garment areexported to USA and Canada. Until January 2001, a part of the garment exportsto EU was also under the quota system. In 2002, 34 per cent of garments wasdirectly exported to non-quota countries. The balance (about 14 per cent) wasnon-quota categories and was exported to the countries which imposed quotas.
Management of Textile Quota System in Sri Lanka
Export of textiles and garments from Sri Lanka under the quota systemstarted in 1978 under the purview of the Secretary to the Ministry of TextilesIndustry. In July 1, 1992, the administration of the quota system became theresponsibility of the Textiles Quota Board (TQB) which was initiallyestablished as an inter-agency ad-hoc committee with the responsibility ofallocating textile quotas. Later, in 1996, TQB was constituted as a statutorybody by the Textile Quota Board Act, No. 33 of 1996. TQB consists of fiveex-officio members and five others representing associations involved in theindustry.
The objective of this scheme was to maximize the utilization of textilequotas available to the country. To serve this purpose, TQB allocates TextileQuotas (TQs) annually on the basis of past export performance. This is donein two stages during each year. The first allocation is made at least four weeks
CHALLENGES, PROSPECTS AND STRATEGIES FOR THE GARMENT INDUSTRY IN SRI LANKA
39
before the commencement of the year and is based on the export performanceduring the first ten months of that year. After verification of export performancefor the whole year, the final allocation is made in February of the succeedingyear. Allocation on the basis of past performances is referred to as ‘MainQuota’ or ‘Performance Quota’ allocation.
Secondly, three per cent of quotas are allocated to small quota holderswho have less than 4000 dozens in all categories on a pro-rata basis. Thirdly,approximately 50 per cent of the Quotas that are available in a year on accountof growth and flexibility are earmarked for new investors and existingmanufacturers who expand capacities by investment in new machinery andequipment.
In order to provide flexibility to the industry, exporters who holdPerformance Quota are permitted to transfer unutilized quotas to other exporterthrough TQB on permanent or temporary basis. However, the sale or purchaseof quota is not legally permitted. Yet, quotas allocated for hot categories aretraded in the black market. The relevant serving agency can also authorizetemporary transfers within a minimum period of two working days.Performance quota holders are encouraged to surrender the unutilized quotato TQB and credit for surrenders will be allocated on the basis of the time ofsurrendering the quota. Quota allocated under the 200 Garment FactoriesProgramme (200-GFP) and small quota holder categories are not transferableduring the first year. Re-transfer of transferred quota to another party is notpermitted.
TQs that remain after the allocation on the criteria discussed above, TQsallocated and not accepted by exporters, unutilized TQs and quotas forfeitedfrom exporters are transferred to a pool and allocated after calling forapplications. This scheme is referred to as the “Main Pool Scheme” andgenerally starts before 31 March, and allocation will be on the basis of thenumber of employees. If the rate of utilization of TQs in any category wassubstantially low in the preceding year, a certain quantity of TQs are allocatedto the pool named Cold Category Pool Quota Scheme (CCPQS) based on theextent of under utilization. TQB declares such CCPQS categories, at least onemonth before the end of quota year.
In the first instance, the quantity and basis of the allocation are decidedby TQB. Remaining quotas are allocated to applicants on condition thatshipments will be made within seven working days. If the exports under SevenDays Quotas (SDQs) did not take place by the end of the seventh day or agrace period of additional three days, the quotas will be added back to thepool and reallocated. In order for the SDQs to be effective, careful monitoringwas required to optimise allocation while avoiding over-utilisation. A SpecialPool Quota Scheme was also operated, if necessary towards the end of the
40
STAFF STUDIES NO. 33
quota year. Applications were to be supported by firm orders valid on the dateof application and quotas were allocated on a first come first served basis.
The Board of Investment (BOI) and the Textile Division of the Ministryof Enterprise Development, Industrial Policy and Investment Promotion issueexport licences (export visas) against the TQs. Once exports are ready to beshipped under the TQs, the exporters should go to the BOI or the Ministry,depending on whether they hold of BOI or non-BOI status, in order to get theexport licences. The licences are issued on the submission of shippingdocuments and are required by buyers to clear the export consignments fromtheir Custom offices. Shipment of products against performance quotaallocations is allowed only on proof of payment of Employees Provident Fundsand Employees Trust Fund contributions. Exports made under the TQs arerecorded in the BOI or the Textile Division of the Ministry, while issued TQsare recorded in the TQB. The BOI services about 82 per cent of the country’squota, while the Ministry services the balance. In order to keep a proper recordof the utilization rate of the TQs and also to take timely action, exchange ofaccurate and up to date information between TQB and the other two authoritiesis essential.
However, this practice of issuing paper visas is vulnerable tocounterfeiting, forging of signatures and illegal routing. The increasing numberof visa forgeries in recent years has caused great difficulties to exporters as awhole and the TQB, and has threatened the integrity of the entire textiles andgarment industry in Sri Lanka. To overcome such difficulties, Sri Lanka joinedthe Electronic Visa Information System (ELVIS)3 which was designed in 1999to transmit key statistics on textiles and garment export directly to theUS Customs through electronic media.
The full operation of ELVIS minimizes forgeries, simplifies exportdocumentation, and increases efficiency in issuing a visa. It also increasesaccuracy, security and reliability of transmitted information and speeds upthe import clearance process in USA. A more accurate and updated databasewill be built-up with TQB providing a comparable source of information toexporters as well as the public. These are some of the basic necessities of thegarment export industry today, which has to find ways and means to competein a highly competitive international market and particularly to face the quotafree market by 2005.
Even though quota requirements for an exports to EU had beeneliminated, exporters to EU have to obtain export visa from BOI or the TextilesDivision of the Ministry of Industrial Development because they want to
3/ For further information on ELVIS refer article on Electronic Visa Information System,News Survey March/April 2000,Vol. 21/No.2 .
CHALLENGES, PROSPECTS AND STRATEGIES FOR THE GARMENT INDUSTRY IN SRI LANKA
41
monitor exports and ensure that the export items have been produced in SriLanka. In addition to the four categories under quota, three new categorieswere brought under the visa requirements in 2001. With the objective ofpreventing forgeries of export visas and Certificates of Origin, TQB introducedan Electronic Data Exchange System in co-ordination with the EuropeanCommission on 1 September 2001. When export visas are issued to exportersto the EU, TQB transmits all relevant information to the European Commissionin Brussels through the Electronic Data Exchange System. This system enablesthe European Commission to monitor the country of origin, product categoryand other relevant information instantaneously and prevent importingmisclassified products and those not produced in Sri Lanka. As Sri Lanka hasaccess to the EU market without quota restrictions, forgeries of this nature areto be expected.
Utilization of Textile Quota
Under the quota system, approximately 30 quota categories were openedfor export to USA and 11 categories were Canada in 2001. Until end 2000,4 categories were available for export to EU countries. From 1996 to 2000,quota allocations by these three countries were increased by 8 per cent. Overallquota availability to USA and Canada increased by 6.8 per cent in 2001.However, overall quota allocation in 2001 declined by 7.5 per cent due to theabsence of EU quota. This will minimize the risk associated with the removalof a large number of quotas at the last stage of the phasing out process in2005.
Under-utilization of Quota
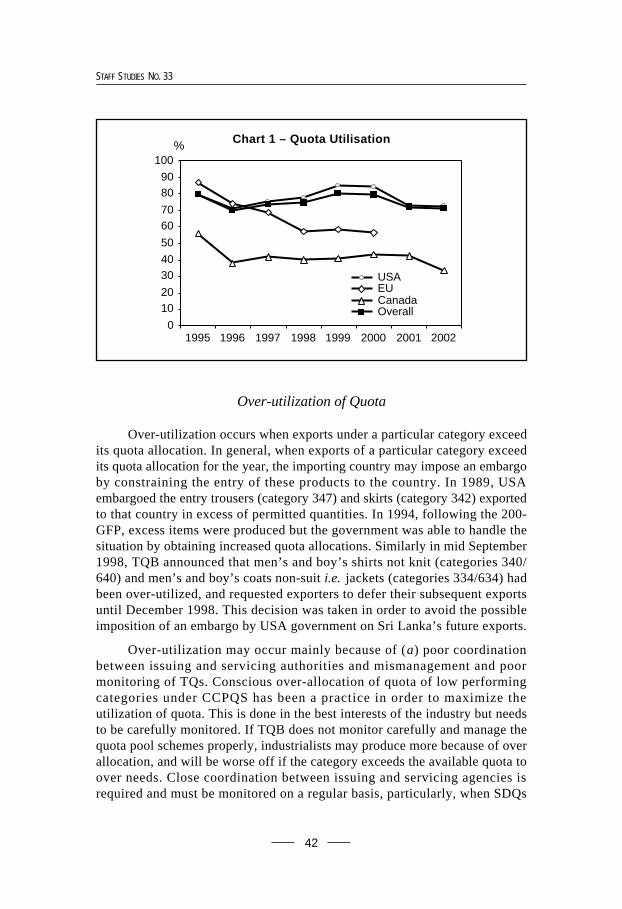
Over the last decade overall utilization ratios varied between 70-80 percent indicating an under utilization of quota. Under-utilization may occurbecause of (a) lower demand for a particular category from importing countries,(b) competition from other countries holding a quota, (c) local producers usingtheir capacity to produce high value added garments under other quotacategories or non quota categories or to meet demand from non quota countriesand (d) mis-allocation of quota. However, under-utilization does not necessarilyimply that the industry is not performing well. Exporters may have used theirfull production capacity to produce garments to non quota areas as Sri Lankaresponds to phased elimination of quotas, shifting from quota to non quotaitems. However, maximum utilization of available quotas is a prime objectiveunder quota system as it ensures the non-competitive access to industrialcountry markets. Once a market is acquired, it may provide access even undera non quota regime.
42
STAFF STUDIES NO. 33
Over-utilization of Quota
Over-utilization occurs when exports under a particular category exceedits quota allocation. In general, when exports of a particular category exceedits quota allocation for the year, the importing country may impose an embargoby constraining the entry of these products to the country. In 1989, USAembargoed the entry trousers (category 347) and skirts (category 342) exportedto that country in excess of permitted quantities. In 1994, following the 200-GFP, excess items were produced but the government was able to handle thesituation by obtaining increased quota allocations. Similarly in mid September1998, TQB announced that men’s and boy’s shirts not knit (categories 340/640) and men’s and boy’s coats non-suit i.e. jackets (categories 334/634) hadbeen over-utilized, and requested exporters to defer their subsequent exportsuntil December 1998. This decision was taken in order to avoid the possibleimposition of an embargo by USA government on Sri Lanka’s future exports.
Over-utilization may occur mainly because of (a) poor coordinationbetween issuing and servicing authorities and mismanagement and poormonitoring of TQs. Conscious over-allocation of quota of low performingcategories under CCPQS has been a practice in order to maximize theutilization of quota. This is done in the best interests of the industry but needsto be carefully monitored. If TQB does not monitor carefully and manage thequota pool schemes properly, industrialists may produce more because of overallocation, and will be worse off if the category exceeds the available quota toover needs. Close coordination between issuing and servicing agencies isrequired and must be monitored on a regular basis, particularly, when SDQs
0
1020
3040
50
6070
8090
100
1995 1996 1997 1998 1999 2000 2001 2002
USA EU Canada Overall
Chart 1 – Quota Utilisation%
CHALLENGES, PROSPECTS AND STRATEGIES FOR THE GARMENT INDUSTRY IN SRI LANKA
43
are allocated and reallocated. If the servicing authority does not reportutilization in time, un-utilised quota may not be reallocated.
Other causes for over-utilization may be (b) mistakes made by theCustoms authority in the importing country which records imports under thewrong category and (c) shipments based on forged export documents. Whenthe demand for a certain quota category is high, some exporters produce forgeddocuments to export more garments which have high demand, exceeding theirquota limits. They obtain visa for one category, which can be exported underquota but export a different category, which is in high demand. For example,in 1998, the USA Customs import data revealed that about 90 per cent of thecategory 334/634 quota had been utilized by end September. Subsequentinvestigations showed that because of the high demand for the category, someexports had been made using fraudulent documents.
The immediate impact of over-utilization will be deferment orcancellation of export orders. The exporters have to bear the total cost ofcancelled orders, face problems of storage and related costs and overcomedifficulties in servicing bank loans. Loss of credibility in exporters due topostponements and cancellations of shipments etc . will divert buyers awayfrom that country. Imposition of an embargo will hinder possibilities of futureenhancement of base limits of the TQs under the flexibility facility until suchtime as both parties come to an agreement. The industry is in a transitionperiod with the gradual phasing out of quotas. It is becoming very competitivedue to new procedures and regional groupings in the West. Maintenance ofthe country’s image among buyers is imperative to survive in the future in ahighly competitive environment under the quota free system.
Meanwhile the industry should use the opportunity of entering largemarkets through the quota system not only to sell their production today butalso to build up relationships with buyers and to look for new markets for thefuture. Sri Lanka is in the process of moving into more non-quota exports andhigh value added products. However, progress has been slow in finding newmarkets in non quota countries. The share of garments exported to non-quotacountries (excluding EU) is still around 4 per cent of total garment exportsfrom Sri Lanka. Sri Lanka should move fast in this direction, and be wellequipped to deal with market conditions when quotas will be dismantled by2005.
III. Nature of Sri Lanka’s Textile and Garment Industry andits Challenges
Sri Lanka as a garment exporter has shown improvement in manyrespects. However, even at present, under the quota system more than 52 per
44
STAFF STUDIES NO. 33
cent of Sri Lanka’s garments exports to the world. Besides, heavy dependenceon the quota system, inflexible labour markets and competition from emerginggarment procedures are the major issues that need urgent attention for survivalin quota free markets.
A. Overdependence on a Single Product
Following liberalisation in 1977, the export structure of the economychanged drastically from the agricultural base to an industrial base until 1995;no significant changes has been seen thereafter. Textiles and garments, whichbecame Sri Lanka’s largest single item of exports in 1986 continued to maintainthat position, increasing its share from 28 per cent in 1986 to 52 per cent in2002.
Although gross earnings from the textiles and garment sector are high,tea remains the country’s largest net foreign exchange earner until 1991.Textiles and garment sector became Sri Lanka’s largest net foreign exchangeearner in 1992 (Chart 2 and 3) partly as the industry shifted from low valueadded garments to high value added garments and as the sector as a wholeexpanded rapidly. Some industries such as rubber based products, machineryand equipment, diamond and jewellery, travel goods and footwear, ceramicproducts, fish products emerged. However, the prominence of textiles andgarments exports has remained unchanged and this product accounted for70 per cent of industrial exports.
This sector used 40 per cent of all intermediate good imports of thecountry in 2001. Therefore, vulnerability to the external sector continued,perhaps, somewhat reduced as Sri Lanka depends heavily on one singleindustrial commodity i.e. garments for exports earnings. That commodity itselfdepends heavily on imported raw material.
Chart 3 – Net Earnings from Textile & Garment vs. Tea
0
200
400
600
800
1,000
1,200
1,400
1,600
1985 1989 1993 1997 2001
Net Earnings from Textile& Garments Tea
B. Heavy Dependence on a Few Export Markets
Sri Lanka’s textiles and garment exports are concentrated in a few exportmarkets. USA accounted for 64 per cent of the total garment exports and theshare of EU was 30 per cent in 2001. Canada, accounted for 2 per cent of totalgarment exports. More than ninety countries, including Australia, Japan,Switzerland and Israel accounted for balance 4 per cent. Even though USAand EU accounted for more than 94 per cent of Sri Lanka’s garment exportsSri Lanka supplies only 2.3 per cent and 0.9 per cent of USA and EU garmentmarkets, respectively.
Heavy dependence on quota markets is a major concern in the textilesand garments industry. Even though phasing out of quota restrictions underthe Agreement of Textiles and Clothing (ATC) had been started since January1995, Sri Lanka had not felt much of these changes until December 2000 as inthe first two stages, USA and EU chose items with less restrictions or which
46
STAFF STUDIES NO. 33
Table 3 – Country-wise Classification of Garment Exports
O/w: Australia 0.2 0.3 0.4 13.4Japan 1.0 0.7 0.6 4.6
Source : Central Bank of Sri Lanka
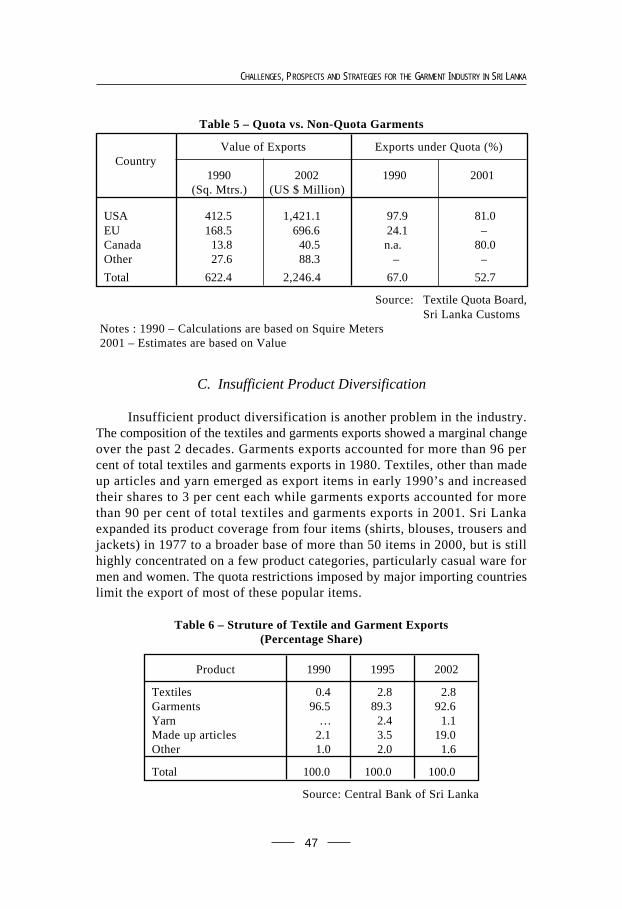
were less competitive in US and EU markets. This was very clear in the USmarket, where Sri Lanka’s share of garments exports under quota restrictiondeclined from 97.9 per cent in 1990 to 84.1 per cent in 2001 whereas share ofquota garments to the EU increased from 24.1 per cent in 1990 to 26.8 percent in 2001. However, Sri Lanka’s dependence on quota market was muchlower than that of her South Asian competitors. (Table 4)
During the period 1996-2000, quota allocation by the USA increased byan annual average rate of 7.5 per cent (in volume terms) while EU quotaallocation increased by an annual average rate of 12.5 per cent. As a resultmore than 60 per cent of Sri Lanka’s garment exports are covered by the MFAin 2000. The removal of quota restriction on Sri Lanka’s exports to the EUcountries by 1 January 2001 will clear about 10 per cent of existing quotarestrictions on Sri Lanka’s garment exports. Even though adverse developmentsin the western world reduced the demand for garments in 2001, quota allocatedby USA and Canada increased by 6.7 per cent and 9.5 per cent, respectively in2001.
Table 4 – Exports of Garments Under Quota System –South Asia
Notes : 1990 – Calculations are based on Squire Meters2001 – Estimates are based on Value
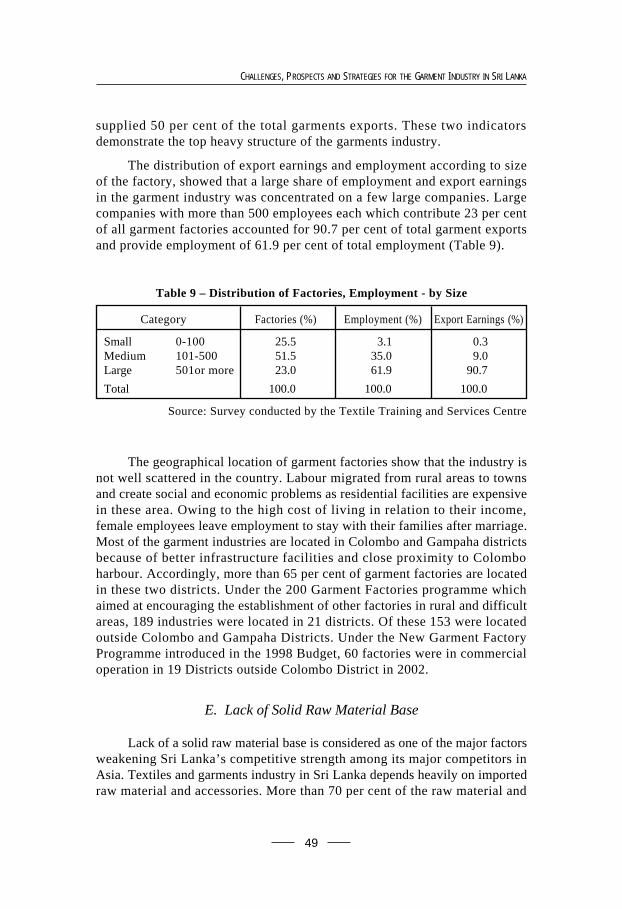
C. Insufficient Product Diversification
Insufficient product diversification is another problem in the industry.The composition of the textiles and garments exports showed a marginal changeover the past 2 decades. Garments exports accounted for more than 96 percent of total textiles and garments exports in 1980. Textiles, other than madeup articles and yarn emerged as export items in early 1990’s and increasedtheir shares to 3 per cent each while garments exports accounted for morethan 90 per cent of total textiles and garments exports in 2001. Sri Lankaexpanded its product coverage from four items (shirts, blouses, trousers andjackets) in 1977 to a broader base of more than 50 items in 2000, but is stillhighly concentrated on a few product categories, particularly casual ware formen and women. The quota restrictions imposed by major importing countrieslimit the export of most of these popular items.
Table 6 – Struture of Textile and Garment Exports(Percentage Share)
D. Heavy Dependence on a Few Large Scale Industries
Heavy dependence on a few large scale producers is another importantfeature of the industry today. Out of 1,061 large and medium scale garmentfactories operated in Sri Lanka, about 26 per cent are small scale with lessthan 100 employees. Another 51 per cent are of medium scale. Only 23 percent belongs to the large and very large category with 500 or more employment.However, these large (244) manufacturers accounted for 62 per cent of totalemployment in the industry. Local entrepreneurs currently own about 80 percent of total garment factories while balance are owned by foreign companiesor partnerships of well known companies.
Table 7 – Distribution of Factories - By Size
No. of Employees No. of Factories Percentage (%)Category
Source : Survey conducted by the Textile Training and Services Centre
According to Customs’ records 1,045 manufacturers exported garmentproducts. However, 55 companies exported garments worth less than US dollar100 each in 2002. These 55 companies accounted for a negligible amount oftotal export earnings in 2002. Out of the balance 990 exporters more than 50per cent accounted for less than 1 per cent of total garments exports. The topten per cent of exporters accounted for more than 70 per cent of total garmentsexports (Table 8). Out of this ten per cent 39 exporters (top 3.9 per cent)
Table 8 – Distribution of export earnings by Companies
Export earning as a percentage of total earnings (%)
1999 2002
Top 10 per cent 72.0 72.32nd top 10 per cent 16.2 17.43rd top 10 per cent 6.9 6.64th top 10 per cent 3.0 2.45th top 10 per cent 1.3 0.9Lowest 50 per cent 0.6 0.4
Source: Sri Lanka Customs
Exporters as apercentage
of total exporters
CHALLENGES, PROSPECTS AND STRATEGIES FOR THE GARMENT INDUSTRY IN SRI LANKA
49
supplied 50 per cent of the total garments exports. These two indicatorsdemonstrate the top heavy structure of the garments industry.
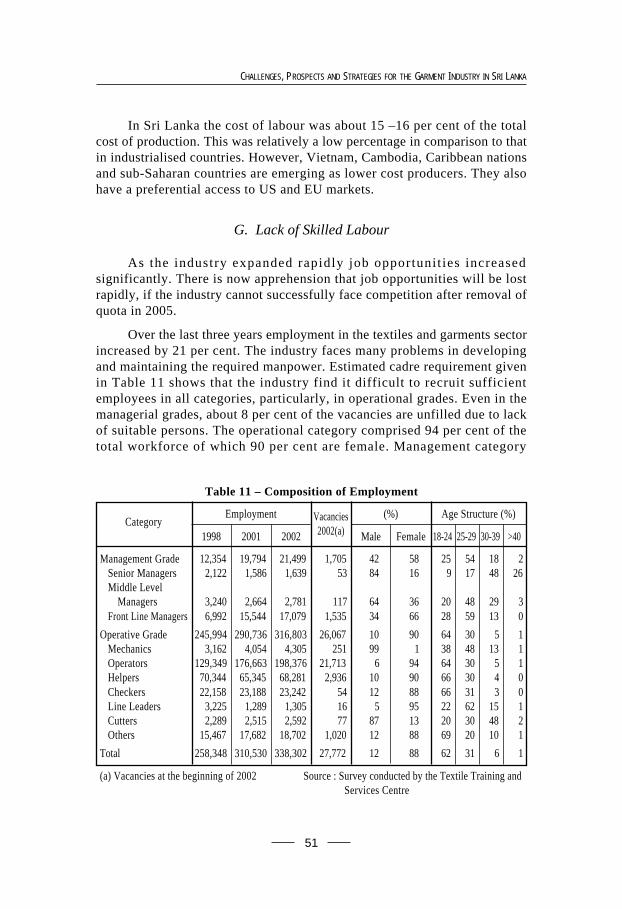
The distribution of export earnings and employment according to sizeof the factory, showed that a large share of employment and export earningsin the garment industry was concentrated on a few large companies. Largecompanies with more than 500 employees each which contribute 23 per centof all garment factories accounted for 90.7 per cent of total garment exportsand provide employment of 61.9 per cent of total employment (Table 9).
The geographical location of garment factories show that the industry isnot well scattered in the country. Labour migrated from rural areas to townsand create social and economic problems as residential facilities are expensivein these area. Owing to the high cost of living in relation to their income,female employees leave employment to stay with their families after marriage.Most of the garment industries are located in Colombo and Gampaha districtsbecause of better infrastructure facilities and close proximity to Colomboharbour. Accordingly, more than 65 per cent of garment factories are locatedin these two districts. Under the 200 Garment Factories programme whichaimed at encouraging the establishment of other factories in rural and difficultareas, 189 industries were located in 21 districts. Of these 153 were locatedoutside Colombo and Gampaha Districts. Under the New Garment FactoryProgramme introduced in the 1998 Budget, 60 factories were in commercialoperation in 19 Districts outside Colombo District in 2002.
E. Lack of Solid Raw Material Base
Lack of a solid raw material base is considered as one of the major factorsweakening Sri Lanka’s competitive strength among its major competitors inAsia. Textiles and garments industry in Sri Lanka depends heavily on importedraw material and accessories. More than 70 per cent of the raw material and
Table 9 – Distribution of Factories, Employment - by Size
Small 0-100 25.5 3.1 0.3Medium 101-500 51.5 35.0 9.0Large 501or more 23.0 61.9 90.7
Total 100.0 100.0 100.0
Source: Survey conducted by the Textile Training and Services Centre
50
STAFF STUDIES NO. 33
70-90 per cent of the accessories used in this industry are imported. Sincefabrics and accessories account for more than 70 per cent of the cost ofproduction, lack of backward linkages is a major constraint to the developmentof this industry. Availability of raw material in the close proximity, mostimportantly within the country, is an essential factor in today’s context wherelead time (the time between ordering the goods and having it arrived in thestores) play a major role in international competitiveness. Backward linkageswill not only provide employment and save foreign exchange, but will managedthe time of transporting inputs efficiently thus reducing lead-time.
Wastage takes place because of several reasons. There are rejects andover production. Wastage takes place in transport within the factory premisesand between the factory and warehouses. Idling machines add to wastage.Waste also access in stocking and in handing. More efficient supportingservices can reduce wastage. Attention to reduce waste will increase thecompetitive edge in most Sri Lankan factories.4
F. Wage Differentials
Wage differences between industrialised western countries anddeveloping countries was the main reason for shift of textiles and garmentsindustry from the western world to Asian countries. All over the world averagelabour cost has increased. However, average hourly wage rates given in Table10 suggest that Sri Lanka no longer has the advantage of lower labour cost inrelation to her Asian competitors although, she has an advantage overdeveloped countries.
4/ Juji Hasumi (1999)
Table 10 – Average Hourly Labour Cost (Wages and social charges - in US $)
Country 1992 1998 2000 Country 1992 1998 2000
USA 10.00 12.97 14.24 Sri Lanka 0.49 0.46Canada 10.50 13.93 14.29 Pakistan 0.40 0.37Mexico 1.70 2.23 2.20 Philippines 1.12Germany 18.40 21.48 18.10 Indonesia 0.24 0.32France 13.40 14.16 13.85 Turkey 2.48 2.69UK 13.58 12.72 Hong Kong 3.70 5.65 6.10Switzerland 24.08 13.85 Korea 3.80 3.63 5.32Thailand 1.09 1.18 China 0.42 0.62 0.69Bangladesh 0.43 Taiwan 5.85 7.23India 0.60 0.58 Japan 10.30 20.70 26.10Italy 15.70 South Korea 2.05 1.82
Sources : World of Work – 1996 & 1999Werner International – 2000
CHALLENGES, PROSPECTS AND STRATEGIES FOR THE GARMENT INDUSTRY IN SRI LANKA
51
In Sri Lanka the cost of labour was about 15 –16 per cent of the totalcost of production. This was relatively a low percentage in comparison to thatin industrialised countries. However, Vietnam, Cambodia, Caribbean nationsand sub-Saharan countries are emerging as lower cost producers. They alsohave a preferential access to US and EU markets.
G. Lack of Skilled Labour
As the industry expanded rapidly job opportunit ies increasedsignificantly. There is now apprehension that job opportunities will be lostrapidly, if the industry cannot successfully face competition after removal ofquota in 2005.
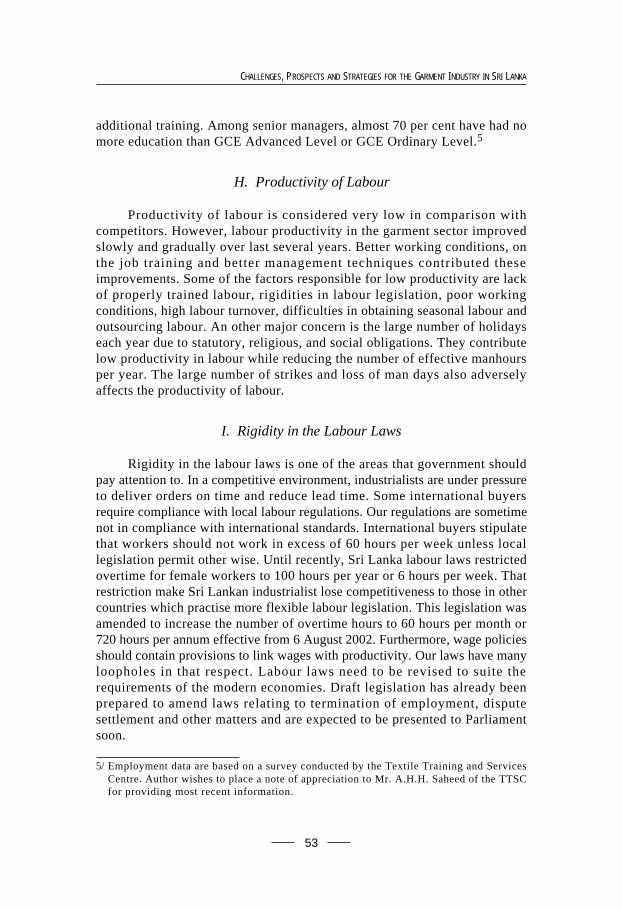
Over the last three years employment in the textiles and garments sectorincreased by 21 per cent. The industry faces many problems in developingand maintaining the required manpower. Estimated cadre requirement givenin Table 11 shows that the industry find it difficult to recruit sufficientemployees in all categories, particularly, in operational grades. Even in themanagerial grades, about 8 per cent of the vacancies are unfilled due to lackof suitable persons. The operational category comprised 94 per cent of thetotal workforce of which 90 per cent are female. Management category
(a) Vacancies at the beginning of 2002 Source : Survey conducted by the Textile Training and Services Centre
Category Vacancies2002(a)
52
STAFF STUDIES NO. 33
accounted for the balance 6 per cent. Most of the female workers leave theindustry after marriage while a considerable number of trained workers leavethe industry for foreign employment. The average labour turnover worked outper factory is about 60 per cent per annum. Taking the labour migration withinthe industry into account, the net number of persons leaving the industry eachyear is estimated as 25 per cent.
There is the problem of maintaining a stable work force and much effortrequired to maintain quality and productivity in the labour force. More than64 per cent of the labour force in the operational grades are in age group18-24 years. Even in managerial grades, nearly 79 per cent are below 29 yearsof age and another 18 per cent are between 30-39 years. Exceptionally 74 percent of senior managers are older than 30 years.
Table 12 – Educational / Vocational Training
Educational (%) Vocational (%)
Deg- G.C.E. G.C.E. Below Total Certifi- Trai- Experi-ree (A/L) (O/L) G.C.E. cates ned -ence
Source: Survey conducted by the Textile Training and Services Centre, 2001
IndustryPreferenceCategory
Only 4 per cent of the workforce currently engaged in the operationalgrades has acquired vocational training; the balance acquired skills throughwork experience. Even in the managerial and technical grades professionallyqualified managers and supervisors are in short supply. In many instances,these positions are held by persons promoted from operator level without any
CHALLENGES, PROSPECTS AND STRATEGIES FOR THE GARMENT INDUSTRY IN SRI LANKA
53
additional training. Among senior managers, almost 70 per cent have had nomore education than GCE Advanced Level or GCE Ordinary Level.5
H. Productivity of Labour
Productivity of labour is considered very low in comparison withcompetitors. However, labour productivity in the garment sector improvedslowly and gradually over last several years. Better working conditions, onthe job training and better management techniques contributed theseimprovements. Some of the factors responsible for low productivity are lackof properly trained labour, rigidities in labour legislation, poor workingconditions, high labour turnover, difficulties in obtaining seasonal labour andoutsourcing labour. An other major concern is the large number of holidayseach year due to statutory, religious, and social obligations. They contributelow productivity in labour while reducing the number of effective manhoursper year. The large number of strikes and loss of man days also adverselyaffects the productivity of labour.
I. Rigidity in the Labour Laws
Rigidity in the labour laws is one of the areas that government shouldpay attention to. In a competitive environment, industrialists are under pressureto deliver orders on time and reduce lead time. Some international buyersrequire compliance with local labour regulations. Our regulations are sometimenot in compliance with international standards. International buyers stipulatethat workers should not work in excess of 60 hours per week unless locallegislation permit other wise. Until recently, Sri Lanka labour laws restrictedovertime for female workers to 100 hours per year or 6 hours per week. Thatrestriction make Sri Lankan industrialist lose competitiveness to those in othercountries which practise more flexible labour legislation. This legislation wasamended to increase the number of overtime hours to 60 hours per month or720 hours per annum effective from 6 August 2002. Furthermore, wage policiesshould contain provisions to link wages with productivity. Our laws have manyloopholes in that respect. Labour laws need to be revised to suite therequirements of the modern economies. Draft legislation has already beenprepared to amend laws relating to termination of employment, disputesettlement and other matters and are expected to be presented to Parliamentsoon.
5/ Employment data are based on a survey conducted by the Textile Training and ServicesCentre. Author wishes to place a note of appreciation to Mr. A.H.H. Saheed of the TTSCfor providing most recent information.
54
STAFF STUDIES NO. 33
J. Lead Time
Lead time has become one of the principal factors considered by westernimporters. In order to respond to fashion trends and meet competition,importers are now looking for delivery services of 8-12 weeks after placingan order. Lead time heavily depends upon overseas locations. Shorter deliverytime makes production and marketing process more efficient providingopportunities for quicker responses to changing demand. Specially US andEU buyers are demanding fast response. Shorter lead time is partly responsiblefor the increase in market share by Mexico and Caribbean countries in the USmarket from 6 per cent in 1984 to 41 per cent in 1999. As there are severalcountries with competitive labour costs and shorter lead time in Latin America,South Asian and Far Eastern countries are now face a growing competitionfrom those countries. According to a recent study6 Canadian buyers haveindicated concerns on perceived long delivery time, high prices and unreliablesupply in Sri Lanka garments sector as well as political instability in thecountry.
K. Product Quality
Product quality is one of the crucial factors in determining the sourcesof the US and EU garments imports. A survey7 conducted with 23 of 35 topretailers in the USA confirmed that over 70 per cent of buyers indicated relativeproduct quality as the most important factor in selecting a garment producer.Where quality is concerned, buyers go for particular producers not for thecountry because quality varies among factories within countries. Lead timeand cost were ranked numbers two and three. However, the mass merchantsand department stores ranked lead time slightly above quality. A more recentstudy found that almost 40 per cent of the respondents indicated price as themost important factor in selecting an apparel producer. The same sourceconcluded that ‘the most successful manufacturers will be those who createand market their own brand names to the consumer’. Brand recognition, brandidentity and consumer acceptance of these brands will enable manufacturersto create better margin opportunities. Quality improvement is the area whereSri Lanka can maximise her potential for wining buyer’s confidence which isessential for retaining customers. Most recent studies on the North Americanmarket for Sri Lanka apparel found that both US and Canadian buyers believedin the high quality of Sri Lankan garments.
6/ Goss Gilroy Inc. (2001)
7/ Hathcote and Nam (1999)
CHALLENGES, PROSPECTS AND STRATEGIES FOR THE GARMENT INDUSTRY IN SRI LANKA
55
L. Investment in Technologies
The garments industry has became a hi-tech industry worldwide. ForSri Lanka to develop competitive edge in international markets and survive, ithas to concentrate on move higher value added products. If Sri Lanka remainsas a producer of standard low value added, low price garments, buyers willfind other cheaper sources in Asia, Africa and Eastern Europe. To becompetitive Sri Lanka must produce specialized, high quality up-marketgarments which are not highly price sensitive. To achieve the quality requiredto meet up-market products it is necessary to invest in advanced technology.During the past several years investment in machinery and equipment increasedat a moderate level but most of them were concentrated in a few large factories.Most small scale factories are unable to invest in hi-tech machinery due tomassive capital costs. Sometimes, unwillingness to bear the large costs inlong term investment has worsened the situation.
IV. International Markets and Challenges
Sri Lanka’s textiles and garments industry is adversely affected by manyof the emerging regional blocks which erode Sri Lanka’s market share in theworld market. This situation will be further aggravated as these agreementsare fully established in the next few years. A recent study8 found that sourcingstrategies in the USA were increasingly driven by government policy towardsspecific regions. USA has already entered into a number of preferential tradingagreements and these agreements influence sourcing decisions world wide.Beyond 2005, sourcing will tend to value those with favoured trade relationswith the USA.
A. Trade Agreements
North American Free Trade Agreement (NAFTA)
North American Free Trade Agreement (NAFTA) made Mexico aprivileged supplier of clothing to Canada and USA and diminished Sri Lanka’saccess to the USA and Canada markets. Although, the cost of labour in SriLanka is very much lower than in Mexico, Mexico is in close proximity toUSA and receives tariff and non-tariff concessions under NAFTA. Mexicoovertook China as the largest exporter to USA and now contributes 4.2 percent to world garment exports. Its share in the world market was less than
8/ Overview of the North American Market for Sri Lankan Apparel – GOSS GILROY INC,Management Consultent.
56
STAFF STUDIES NO. 33
0.1 per cent in 1980. During the last seven years, garment exports from Mexicoto US increased by an average rate of 15.4 per cent per annum. Mexico captured14.8 per cent of the market in 1999 but the share declined to 13 per cent in2002. Sri Lanka’s exports to US increased by an average rate of 6 per cent perannum, during the same period. Although Sri Lanka slipped in rank from 12thin 1995 to 16th in 2002, her market share has been stable around 2.5 per centduring last 7 years.
The ‘African Growth and Opportunity Act’ (AGOA)
The Trade and Development Act of 2000 enacted in USA, which providestariff and quota preferences for garments produced in Sub-Saharan Africancountries (SSA) and Caribbean Basin (CB) countries would place thesecountries in an advantages position over other garment producing countries.Under this agreement 24 Caribbean and Central American countries and 48SSA would be eligible for duty and quota free access to the USA market forgarments made with USA fabric and yarn. The ‘African Growth andOpportunity Act’ (AGOA) which aims at establishing a comprehensive tradeand development policy for SSA signed by the US president in May 2000,would provide similar but limited market access to garments made out ofAfrican fabrics as well. Those countries in SSA with a per capita income belowUS dollars 1500 gives duty and quota free access to garments made fromthird country fabric for a period of 4 years. Mauritius, Lesotho, South Africa,Kenya, and Madagascar who has a production base would be the first to benefitout of this legislation. Nine others were identified as having potential. USAwho imports from AGOA eligible countries will be exempt from paying importduties of 17-33 per cent. As dramatic growth cannot be expected in US demandfor textiles and garments in the near future, the wide opportunities providedby the AGOA will help SSA countries to increase their exports to US at thecost of Asian countries. The AGOA and other TDA eligible countries areexpected to reach their annual export cap to USA of US dollars 8.75 billionby 2008. More important US mass market retailers, who will save their dutypayments will encourage their suppliers to relocate in TDA eligible countries.This would direct large inflows of foreign capital investments to thosecountries.
The second section of TDA 2000, is entitled the United States - CaribbeanBasin Trade Partnership Act (Caribbean Basin Initiative - CBI). This providesduty and quota free treatment to garments cut in US and assembled in theCaribbean using US fabric and yarn, garments cut and assembles in Caribbeanusing US fabric, yarn and thread and limited quantities of certain other items.In addition to concessions under TDA 2000, cheaper labour in the Caribbeanand Mexico, close proximity, lower shipping cost and less lead time give them
CHALLENGES, PROSPECTS AND STRATEGIES FOR THE GARMENT INDUSTRY IN SRI LANKA
57
an advantage over Asian countries. CBI promotes US investments in theCaribbean Basin and helps strengthen the international competitive positionof the US textile industry.
Even before TDA 2000, Caribbean exported wide range of cottongarments to US. These exports grew by an annual rate of about 15.1 per cent1996-1999. Garment exports from Mexico to US increased by an annual rateof 16.8 per cent during 1990-1993 prior to the implementation of NAFTA.From 1994 until 2000, the Mexican garments exports increased by an annualrate about 30 per cent.9 Some project similar growth in Caribbean garmentexports to US in the initial stage. However, they might lose a part of theirmarket share again to Asia, once quota restrictions are removed for all WTOcountries in 2005. However, one should not under estimate that the Caribbeancountries will continue to enjoy advantages over Asia on several fronts.
An Agreement between the EU and Sri Lanka
In 2000, Sri Lanka signed a Memorandum of Understanding with EU.EU removed quota restrictions on textiles and garments exports to EU countriesin January 2001. In reciprocity, Sri Lanka agreed to bind tariff rates at 0 percent for raw materials, 5 per cent for yarn and fabric, 10 per cent for fabricsand 17.5 per cent for clothing products (current rates are 0, 0, 25 and 10 percent, respectively). As some of the binding rates are lower than currentlyeffective rates, some local industries were protected by the extension ofexemptions on selected products, such as coir twine, rope etc. used in producingfishing nets, coconut coir, sanitary articles etc . In line with the bound tariffrate, import duty on carpets and other textile floor coverings were reducedfrom 25 per cent to 10 per cent with effect from 11 January 2001. Sri Lankawill also refrain from introducing any non-tariff barriers on imports of textilesand clothing.
Sri Lanka is the 20th supplier of textile and garments to EU while EU isthe second largest importer of Sri Lanka’s textiles and garments exports.Therefore, it is expected that the phasing out of the textiles and garmentsquota on exports to the EU market would have a positive impact on the SriLanka’s textiles and garments industry. This will result in higher productionand exports while allowing exporters to utilize their unused capacity. Thiswill also build up confidence in exporters to plan for the future while easingfears of facing a quota free market environment.
Advantages that Turkey and Central and Eastern European economieshad in the EU market due to preferential agreements with those countries were
9/ Garment exports by Mexico to USA declined by 7 per cent and 5 per cent respectively in2001 and 2002.
58
STAFF STUDIES NO. 33
diminished to a certain extend, when quota restrictions on Sri Lanka garmentsexports to EU were removed. At present, Sri Lanka has an advantage overIndia and Pakistan to EU. However, India is negotiating with the EU to makebilateral arrangements. Bangladesh and Cambodia have separate bilateralagreements with EU. However, in October 2000, EU approved duty and quotafree access to 48 least developed countries including Bangladesh which isone of the competitors with Sri Lanka in the Asian region. These 48 countriesare eligible for exporting any product, excluding arms, to EU without anyduty or quota restrictions.
Scheme of Generalised Preferences
The Scheme of Generalised Preferences of EU, gives some advantagesto Sri Lanka over India and Pakistan. Sri Lanka is eligible to obtain the tariffcut of 15 per cent of the common EU duty rates for textiles and garments. Ifthe country fulfils the requirements of (a) maintaining sufficient labourstandards and (b) protection of environment, additional tariff cut of 15 percent of common EU duty rates will be granted. However, the utilization rateof this facility so far is not very attractive. The most important bottleneck wasthe lack of local fabric base on the island which prevent for obtaining rule oforigin status.
The European Union has recognised South Asian Association forRegional Co-operation (SAARC) as a regional grouping for the purpose ofextending “Cumulative Rules of Origin” to the member countries of the SouthAsian Preferential Trade Agreement (SAPTA). This decision was effectivefor the fulfilment of Rules of Origin Criteria Under the Generalised Systemof Tariff (GSP) from 1 October 2000. This was a result of negotiations membercountries of SAARC and the SAARC Secretariat had with the EU to obtainspecial concessions for its members on the local content requirement underthe ‘Cumulative Rules of Origin’ criteria for the grouping. Under this criteria,material imported from SAARC member countries and used in production inany member country could be considered ‘local material’ in deciding the localcontent requirement. However, this is also ineffective since for technicalreasons Sri Lanka’s garment producers need to source from other AsianCountries outside SAARC. Import content of fabric from non-SAARCcountries is mostly too high to satisfy the value requirement under the rulesof origin though Sri Lanka continued to receive tariff concessions from theparticipating developed countries of the GSP, without any reciprocity.
CHALLENGES, PROSPECTS AND STRATEGIES FOR THE GARMENT INDUSTRY IN SRI LANKA
59
Other Competitors
Central and Eastern Europe, especially, Bulgaria, Hungary, Poland,Romania, and the Czech Republic are gradually becoming important suppliersto the European market. Since 1992 investors and entrepreneurs have shiftedtheir activities from former Yugoslavia to other countries such as Croatia, theRussian Federation, Slovenia and Ukraine and relocated garment factories inthese countries. Some factories in these countries with ultra-modern technologyenable them to produce articles complying with European quality standards.They are capable of competing with Western counterparts. Morocco, Mauritius,Tunisia and, more recently, Madagascar have become important garmentsproducers. These countries export their products to industrialised countries.Vietnam has became a major competitor with Sri Lanka in the US market in2002. Vietnam textiles and garments exports to USA picked up remarkably in2002 and overtook Sri Lanka in the US textiles and garments market duringthe first quarter of 2003 recording 1,563 per cent growth in textiles and garmentexports to USA. This phenomenal growth was a result of the US-VietnamTrade Agreement (BTA) signed on 13 July 2002. Vietnam overtook 13 otherexporters and rose to the 5th position during the first quarter of 2003.
B. Impact of China’s entry in to WTO
With China’s entry into WTO, China will have the same market accessto the USA and other markets as Sri Lanka by 2005. Lower wage rates, largelabour force, expertise, raw materials base, flexibility and efficiency give Chinaan advantageous position in many areas of textiles and garments industry overSri Lanka. However, most of these advantages are not new to Sri Lanka orother Asian countries, as China has been a competitor over the last severalyears.
China’s entry into the WTO is not a new challenge to world trade becauseChina has been in world trade for the last 50 years and its trade relation haveexpanded to almost every country. The importance of the accession of Chinato the WTO is that China will now be governed by the same rules andregulations of WTO as other countries and as a result provide trading partnersaccess to its huge market. China has a large market with over one billionpopulation. China is the sixth largest economy in the world and Chinese tradeaccounts for about 4.4 per cent of World trade. Similarly, China will haveaccess to member state’s markets on equal terms. This event provides bothchallenges and opportunities for all members of WTO, including Sri Lanka.
A number of developments in the international arena will minimisethreats from the China’s entry into WTO. The favourable development will be
60
STAFF STUDIES NO. 33
that, China itself committed to reduce its import tariffs on textiles and clothingfrom 20.1 % to 11.5 % by January 1, 2005. It has also bound its import dutiesat 5-6 % for yarn, 10-18 % for fabric and made ups and 14-20% for garments.Moreover, all quantitative restrictions on imports, including the one on USexports, would be abolished as required to the agreement on Textile andClothing of WTO. With downward adjustments to the tax system recently,China’s general tariff level has dropped from 15.3 per cent to 12 per cent on1 January 2002 and those reductions affected more than 5,300 taxable items.China has also reduced the scope of commodities under quota and licensecontrols.
China has nearly completed the work of sorting out and revising lawsand statutes relevant to the fulfilment of commitments to WTO. Therefore,other WTO member countries can challenge China in the event of (export)subsidies and dumping. By end June 2002, anti-dumping cases against Chineseproducts by the EU totalled 91, including restrictions on Chinese textiles,canned mushrooms and garlic.
Within the multilateral negotiation system, the bargaining position ofdeveloping countries have been strengthened. Furthermore the agreementbetween China and USA signed in 1999 offers some restrictions to the expectedserge in the Chinese garment industry. Without needing to prove damage tothe local industries, WTO members can reimpose quotas on Chinese garmentstill 2008. Some specific categories of imports can be restricted till 2013.Meantime the growing trade union movement in China which decries the abuseof workers’ rights in China, will provide cause for developed nations to imposerestrictions on China without violating WTO commitments.
C. Restrictions Other than Quota
So far, the implementation of Uruguay Round has not significantlyincreased market access for developing countries. Although the legalcommitments under ATC have been met by most members, there has beencriticism of the way the agreement has been implemented. The selection ofquota free items is at the discretion of importing countries and the integrationlist must encompass products from each of four group i.e. (a) tops and yarn,(b) fabric, (c) made up textile products and (d) clothing. However, after2 stages of implementing ATC, the selection of higher value – added items,particularly clothing has been rather limited. In the case of USA the percentage(basis is volume of 1990 imports) of clothing imports integrate during the twostages amounted to only 3.9 per cent.10 With the implementation of the thirdstage of integration under the MFA phasing out programme on 1 January 2002,
10/ AITIC (1999)
CHALLENGES, PROSPECTS AND STRATEGIES FOR THE GARMENT INDUSTRY IN SRI LANKA
61
USA removed 36 quota categories while 4 categories were partially integrated.However, none of the Sri Lanka’s quota categories were included in the list offully integrated quota categories. Only four categories are in the list of partiallyintegrated quota categories. With this integration, allocation of garment quotato Sri Lanka declined by 10 percent in 2002 as against that of 2001. This willreduce dependence on quota to 50-52 per cent. It has been estimated that by2004 the 11 principle developing country exporters will face quota restrictionson 80 per cent of their textiles and garments exports. Although ATC cannot beextended, some other form of protection could substitute for quota. Tariffsand quantitative restrictions other than quota imposed by developed countrieson developing countries may continue even after the removal of MFA. Manydeveloping countries who export textiles and garments also use extensive andvery high degrees of protection through high tariff and quantitative restrictionsto limit foreign competition. Although the results of an Uruguay Round wasexpected to reduce tariff rates and simplify tariff structures, both the leveland frequency of tariffs remain matters of concern in a number of key sectorsof direct interest to developed countries. Although non-tariff restrictions andsubsidies were not allowed, industrialized countries use measures consistentwith WTO agreements. In addition to tariffs, contingent measures such asanti-dumping or technical barriers could become more common means ofprotecting against imports from developing countries.11
Bound Tariff
Uruguay Round Agreement on Agriculture (URAA) required membersof WTO to replace non-tariff measures (NTM) with tariffs and to bind themagainst future increases. It also required them to reduce these bound tariffs by36 per cent on average by industrial countries during 1995-2000 and 24 percent on average by developing countries during 1995-2004. With the fullimplementation of UR, average duty rate of 7 per cent is expected for allmerchandised trade. Eighty per cent of textile and garments is covered bybound tariffs and bound rate is 12 per cent.
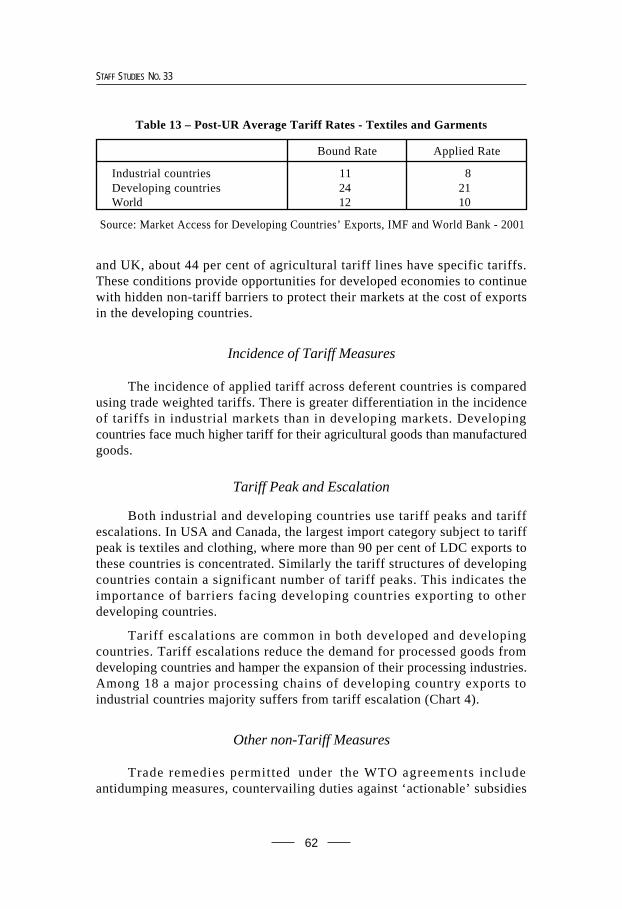
Even though a bound simple average rate of 12 per cent was expectedthis figure covers significant differences between industrial and developingcountries and across the products (Table 13). Furthermore, average appliedtariff rates are lower than bound rates. Thus, there is considerable scope fortextile and garment exporters to raise the apply tariff protection to be consistentwith UR commitments.
In practice, some countries express their tariffs in absolute or specificterms which make them far less transparent and difficult to quantify. In USA11/ Spinanger, 1999
62
STAFF STUDIES NO. 33
and UK, about 44 per cent of agricultural tariff lines have specific tariffs.These conditions provide opportunities for developed economies to continuewith hidden non-tariff barriers to protect their markets at the cost of exportsin the developing countries.
Incidence of Tariff Measures
The incidence of applied tariff across deferent countries is comparedusing trade weighted tariffs. There is greater differentiation in the incidenceof tariffs in industrial markets than in developing markets. Developingcountries face much higher tariff for their agricultural goods than manufacturedgoods.
Tariff Peak and Escalation
Both industrial and developing countries use tariff peaks and tariffescalations. In USA and Canada, the largest import category subject to tariffpeak is textiles and clothing, where more than 90 per cent of LDC exports tothese countries is concentrated. Similarly the tariff structures of developingcountries contain a significant number of tariff peaks. This indicates theimportance of barriers facing developing countries exporting to otherdeveloping countries.
Tariff escalations are common in both developed and developingcountries. Tariff escalations reduce the demand for processed goods fromdeveloping countries and hamper the expansion of their processing industries.Among 18 a major processing chains of developing country exports toindustrial countries majority suffers from tariff escalation (Chart 4).
Other non-Tariff Measures
Trade remedies permitted under the WTO agreements includeantidumping measures, countervailing duties against ‘actionable’ subsidies
Table 13 – Post-UR Average Tariff Rates - Textiles and Garments
Bound Rate Applied Rate
Industrial countries 11 8Developing countries 24 21World 12 10
Source: Market Access for Developing Countries’ Exports, IMF and World Bank - 2001
CHALLENGES, PROSPECTS AND STRATEGIES FOR THE GARMENT INDUSTRY IN SRI LANKA
63
and safeguard measures to protect against serious injury from import surges.During the last decade, antidumping has became the popular safeguardinstrument among high income developed countries and has gained increasedpopularity among developing countries.
In 1997, out of 239 cases initiated in WTO, 143 concerned developingcountries and countries in transition. Between late 1980 and 1994, the EUalone brought at least 179 anti-dumping measures or proceedings against China.During 1995-1999, over 1,200 antidumping investigations were initiated. Asshown in Table 14, developing countries appeared to be the major object ofantidumping cases from both industrial and other developing countries.According to antidumping investigations, initiated during 1995-1999, morethan 58 per cent were initiated by developing countries of which 36 per centwere against developing countries. More than 41 per cent were initiated bydeveloped countries. Less than 1 per cent originated from transition countries.
0
2
4
6
8
10
12
14
16
18
EU USA Canada Japan
Raw Materials Semi-Processed Finished goods
Chart 4 – Tariff Escalation : Average Apply Tariffs byStage of Production
Table 14 – Initiations of Antidumping Investigations
Affected CountriesInitiatingCountry Industrial Developing Transition Total
Countries Countries Countries
Industrial Countries 126 244 129 499Developing Countries 252 258 201 711Transition Countries 4 0 4 8
Total 382 502 334 1,218
Source : WTO –2001, Table II.8
64
STAFF STUDIES NO. 33
Technical, health and safety standards and regulations
The Agreement on Technical Barriers to Trade (TBT) and Agreement onthe Application of Sanitary and Phytosanitary Measures (SPS) attempt tostrengthen international rules governing product standards in order to minimisetheir use for protectionist purposes. Developing countries have to incuradditional expenses to upgrade their infrastructure for maintaining qualitycontrols, testing, certifications etc . and upgrading production methods to meetquality standards. The associated cost will be higher for exporters if they haveto meet the standards different from those in their home markets.
One indicator of the relevance of standards in restricting trade is theincreasing number of trade disputes over standards and technical barriers thathave been initiated during the last 6 years. Most of the cases have been broughtby industrial countries against other industrial countries. Except India, no otherlow income country has brought cases to WTO under TBT or SPS. The needto conform to technical, sanitary, and phytosanitary standards imposes costson exporters. An increasing number of disputes over standards and technicalbarriers also constrains trade in developing countries. This makes it difficultfor poorer countries to shift exports towards higher value added manufactures.Complex and inefficient Customs procedures can also deter trade. Excessivecontrol, inefficiency in customs procedures and documentary red tape incustoms procedures has been estimated to increase the cost of imports,substantially by around 7-10 per cent of world trade.
Tariff Preferential Schemes
The restrictive effect of tariff and non-tariff barriers are lessened bypreferential Access Schemes for poorer countries. However, these are oftenapplying to products that already enjoying low tariffs. In many cases, thesepreferential schemes are subject to various eligibility criteria and conditions.Therefore, these schemes are not an effective as they appear.
V. Welfare Gains and Loses from Liberalization inTextiles and Garments
A. Gains from Liberalization
Recent estimates12 of potential gains from the further liberalization ofmerchandized trade13 shows that full implementation of UR in 2005 will
12/ Anderson and Others (2000)
13/ Computable General Equilibrium (CGE) models are commonly used for estimatingpotential gains from further liberalisation of merchandised trade i.e. Anderson andothers (2000 and 1999) Hertel (2000), Dee and Hanslow (2000) etc .
CHALLENGES, PROSPECTS AND STRATEGIES FOR THE GARMENT INDUSTRY IN SRI LANKA
65
improve welfare in both developed and developing countries. Developingcountries gain most from industrial country liberalization on textiles andgarments, industrial countries gain more from liberalization in developingcountries. MFA quotas in industrial countries on textiles and garments importsfrom developing countries impose substantial costs for both developing andindustrial countries. Therefore the removal of those barriers will increasewelfare gains substantially. Removal of MFA quotas is estimated to improvedeveloping country welfare by US dollars 13-22 billion.14 Global trade intextiles and garments is expected to increase by about 34-60 per cent onceMFA quotas are completely eliminated.15
Table 15 – Welfare Gains from Post UR Liberalisation of Textiles andGarments
Benefiting Region (in billions of 1995 US $)Liberlising
Region Industrial Developing AllCountries Countries Countries
Industrial Countries -5.7 9.0 3.3Developing Countries 10.5 3.6 14.1All countries 4.8 12.6 17.4
Source : Anderson and others (2000)
B. Impact on Employment and Exports
Even though, there are different opinions among industrialists and otherparties concerned, there is a common fear that the garment industry will suffersignificantly after the phasing out of quota in 2005. Some surveys16 revealedthat 50 per cent of the industry would be forced to close down. Most of themedium and small scale factories are not considered up to the level of exportmarkets. Distribution of export earnings and employment according to size ofthe factory, showed that a large share of employment and export earnings inthe garment industry was concentrated in a few large scale companies. Largescale companies with more than 500 employees which cover 23 per cent oftotal garment industries accounted for 90.7 per cent of total garment exportsand provided employment to 61.9 per cent of total employment. CustomsStatistics showed, out of 1,061 garment companies17 50 per cent together
14/ Anderson and others (2000) and Australian department of Foreign affairs and Trade (1999)15/ Deardorff (1994)16/ Gopal Joshi, Garment industry in South Asia.17/ Ministry of Industries records for 2001.
66
STAFF STUDIES NO. 33
exported less than US dollars 10 million of garments in 2002. These factorieswill face severe competition from large scale industries as from the out sideworld and may be wiped out. Closing down these industries will cause a lossof less than 1 per cent of export earnings. However, they may have a greaterimpact on employment as these establishments provide approximately 20 percent of total employment. However, some of the small companies are not inthe list of exporters. Although, there is a scheme to transfer unutilised quotathrough TQB, some small companies get their quota and sell them to largefirms and exports are recorded under the latters’ names. According to surveyconducted by TTSC, out of 175 firms drawn from 1,061 companies in the listin the Ministry of Industries 47 were not in operation. Therefore, the loss ofemployment may be less than estimated. Although, some employment will belost in the short run, labour is likely to be absorbed into recovering strongerfirms. Even at present, the industry is facing difficulties in recruiting skilledand trained labour. As most of the existing firms have to be expanded andbecame stronger to survive in the emerging competitive environment moredemand for labour can be expected from these firms. Some of the small scalefirms may sub-contract, utilizing their capital and labour while some othersmay be acquired by large companies. Therefore, in the long run, employmentloss will be looked after within the industry itself.
VI. Prospects and Strategies for Future Development
Global trade in textile and garment is expected to gain from liberalization.It is expected that the liberalization of textiles and garments industry in bothdeveloped and developing countries will have a positive impact on the industry.It is observed that, phasing out of quotas will close down nearly fifty per centof garment factories. However, as production in the Sri Lanka’s garmentindustry, is concentrated on a few large factories, a large part of export earningsand job opportunities will be saved. However, in the short run there will be anegative impact on employment, which may not be very serious. Large scalefirms and at least a some of the medium scale firms will have to be strongenough to face the competitive environment emerging after the phasing out ofquota in 2005. Therefore, the future of Sri Lanka’s garments industry depends,to a large extent, on maintaining the momentum built up over the last 20 yearswhile increasing the competitive edge that Sri Lanka has in the internationalenvironment. A firm foundation has been laid, on which the future of thissector could be strengthened and safeguarded. Yet there is much to be done tomeet the challenges of intense competition in the future.
In the past, Sri Lanka’s garments industry competed with other countriesprotected by quotas, government incentives, competitive labour costs and FreeTrade Zones. However, nowadays competitiveness is not defined as something
CHALLENGES, PROSPECTS AND STRATEGIES FOR THE GARMENT INDUSTRY IN SRI LANKA
67
emanating from abundant natural resources, cheap labour, continuous currencydepreciation or government incentives. It has to be achieved by increasingvalue addition (and profits) through efficient and effective management. Theseinclude (a) identifying and serving specialized markets, (b) adding uniquefeatures to products, (c) adding value and service dimensions to export productsand (d) developing complex products which cannot be easily replicated.Industries can build competitive advantage through superior economic andbusiness strategies. They should emulate the strategies which are being adoptedby other competitors. Venturing into new markets outside the traditionalmarkets should be coupled with measures to reduce costs of production,increase productivity, specialize and be product focused, to train and developmanpower skills, enhance investments and adopt new and efficient technology.The Government must improve infrastructure facilities, ensure minimumdisruptions in the working environment to support the industry.
Strategies based on labour cost advantages are not a sustainable sourceof comparative advantage due to existing labour market rigidities and lowerlabour costs in other markets. In regard to labour costs, other emerging marketssuch as India, Bangladesh, Indonesia, Vietnam and China will continue to bemajor competitors. As reducing of labour costs per hour is not feasible, theway out should be reduce labour costs per product. Sri Lanka’s garmentindustry is considered as operating at an average of 40 per cent efficiency.18
Hence, there is much room for improving efficiency. High literacy rates andin easily trainable workforce are the advantages possessed by the country.A long term plan to build up professionalism and a stable work force isnecessary for further growth in the industry. Development of infrastructure toprovide training facilities as well as a change in attitudes to match the newchallenges in the industry are essential to provide sufficient manpower as wellas to improve quality and productivity. As a long term strategy, humanresources development should be go hand in hand with educational reforms.Universities, technical colleges and other government and non governmentorganizations such as Industrial Services Centre and Textiles Training andServices Centre are now offering training facilities to develop various skillsrelating to the textiles and garments industry. More investments should bediverted to develop designer capabilities and the marketing and managementskills of entrepreneurs.
Increasing productivity and efficiency of labour is associated withtechnology enhancements as well. This should be associated with work plansand targets set according to international standards. Proper time management,maintaining accurate work measurements, proper tools to collect informationpertaining to production and close monitoring with efficient methods to detect
18/ Mr. R.U. Kuruppu, Seminar on Cost Reduction through Efficiency Improvement,Phoenix College of Clothing, Ratmalana.
68
STAFF STUDIES NO. 33
errors and inefficiencies associated with production are essential to minimizelosses. Quick responses to correct errors and to avoid inefficiencies and usethe most appropriate method to correct them are key elements in efficiencyimprovement.
Working condition and effects on the environment have been brought into the limelight. This is one area when Sri Lanka can capitalise as it has abetter record than many of her neighbouring competitors. Some largecompanies have already taken steps to obtain certificates of conformity isaccepted standards in labour, health and safety and the environment.Eco-labelling, ISO 9000, ISO 14,000 etc . should be taken as advantages forbuilding up marketing strategies in future competitive markets.
Quality improvement is a priority area, with which Sri Lanka canmaximise opportunities in the developed markets. Sri Lanka can focus ondeveloping brand names to build an image as the best garment manufacturerin Asia. Our exporters have already selected this as their vision for the future.Sri Lanka’s product base is highly concentrated on casual ware. Future trendsin European and American markets are for casual ware rather than designerattire. The garment industry is expected to have a grater shift towards casualand comfortable clothes. The newest generation of children, ‘eco boomers’are the force behind the success of the children’s ware industry. Sri Lanka canspecialize in these products with her existing experience and skills to meetthe future demand in those countries.
The geographical location of Sri Lanka places it far from the mainmarkets. This is a disadvantage to some extent, because quick responses arecrucial to keeping up with fast changing fashions. Sri Lanka and India havethe higher lead time (19-45 days) compared to competing countries such asMexico (6-8 days). The industry has to focus on exploring new markets andmaking efforts to strengthen the raw material base for the industry and toreduce lead time. If delays involved in obtaining raw material could beeliminated by attracting world class fabric producers, accessory manufacturersetc ., the present long lead times could be reduced. Therefore, there is anopportunity to develop the textiles industry to provide raw materials andaccessories for the garment industry in the region. Indo Sri Lanka Free TradeAgreement opened a window of opportunity to break through to the huge Indianmarket and source fabric from internationally reputable textiles manufacturers.The industry must focus upon taking advantage of the Free Trade Agreementwith India. Although quotas available for Sri Lanka are limited to 8 millionpieces, the development of India as a supply source of textiles to Sri Lankawill solve the problem of lead time to a large extent. The industry shouldexplore market access in India. This opportunity can be used to explore thepossibility of inviting fabric manufacturers to establish joint ventures/ strategicalliances.
CHALLENGES, PROSPECTS AND STRATEGIES FOR THE GARMENT INDUSTRY IN SRI LANKA
69
The emerging regional trade blocks have adversely affected Sri Lanka’stextiles and garments industry eroding Sri Lanka’s market share in the worldmarket. This situation will be further aggravated when these agreements arefully established in the next few years. However, Sri Lanka has also achievedconsiderable development towards regional and international co-operation.An agreement with the EU and Sri Lanka to remove all quota restrictions ontextiles and garments exports to the EU enabled it to reduce advantages thatTurkey and Central and Eastern European economies had in the EU market.At present, Sri Lanka has an advantage over India and Pakistan. India isnegotiating with the EU for bilateral arrangements. Bangladesh and Cambodiaalso have separate bilateral agreements with the EU.
The Scheme of Generalised Preferences of EU gives the advantages toSri Lanka over India and Pakistan. Sri Lanka is eligible for the preferentialrate of 15 per cent of the common tariff rate for textiles and garments. Underspecial arrangements, another 15 per cent of the common tariff rate is grantedto countries that country fulfil the requirements of (a) maintaining sufficientlabour standards and (b) protecting the environment. Recognition of SAARCas a regional grouping for the purpose of extending ‘ Cumulative Rules ofOrigin’, by EU will help SAARC members to use the facilities available underGSP more effectively.
Government provides a generous incentive package (liberalisation ofimports of raw material and machinery, establishment of free trade zones etc .)for sustained development of the textiles and garments industry. However,such incentives are no longer a sustainable source of competitiveness. Giventhe budgetary constraints, Sri Lanka cannot spend continuously to providethese incentives. Any available resources must be diverted to improveinfrastructure facil i t ies such as transportation, power and energy,telecommunications and waste disposal system etc. Sri Lanka would have toattract fabric mills, accessory manufacturers, marketing and traininginstitutions, designing centres etc . Incentives and encouragement should bediverted to foster areas such as fabric design capabilities and informationtechnology to build up a full service industry. The government has taken stepsto improve efficiency in customs procedures (introduction of ASYCUDA++)and successfully implemented the Electronic Visa Transformation System toreduce the malpractices and inefficiencies in quota utilisation. The industryinitiated the use of electronic media in the textiles and garments industry.Internet has proven to be a viable alternative to traditional distribution channelsin developed countries. Accordingly firms can explore the opportunities thatinternet offers to build up relationships with customers and suppliers throughthese channels. Government can take initiatives to canvass in major exportingcentres to obtain concessions some of which are already enjoyed by ourcompetitors. Such canvassing must be supported with world class negotiatorson behalf of the country.
70
STAFF STUDIES NO. 33
Furthermore, cultivation of more innovative ideologies among publicinstitutions, minimisation of political intervention in labour issues,transparency in economic policies, maintenance of consistency in macroeconomic framework, better co-ordination among public sector institutionsand development of a continuous dialogue between the government and theprivate sector would be the responsibilities of the government to ensure anenvironment conducive to the growth of the industry to grow in a morecompetitive market in the future.
CHALLENGES, PROSPECTS AND STRATEGIES FOR THE GARMENT INDUSTRY IN SRI LANKA
71
References
Agency for International Trade Information & Co-operation (AITIC)1999, “Textiles and Clothing. Implication for Less Developing Countries”(Geneva).
Central Bank of Sri Lanka , Annual Report - 2002, Box 11, “FutureChallenges of the Apparel Industry.”
Central Bank of Sri Lanka, The External Trade Data Base for 1996-2002,Unpublished.
Dheerasinghe R., 2001, “Electronic Visa Information System”, News Survey,March/April 2000, Vol. 21/No.2.
Economic and Social Commission for Asia and Pacific (ESCAP), 2001,“Prospects for BIMSTEC for Asia and the Pacific.”
Federation of Chambers of Commerce and Industry of Sri Lanka, 2002,“Challenges to SAARC Countries”, Seminar on Chinese Entry into WTOheld on 27 August 2002, Colombo.
Fernando Lakdas D., 1997, “Sri Lanka’s Apparel Industry 2005 and beyond”,Textile and Clothing, September 1997.
Gunawardana D. P., 1999, “The Human Resources Needs of the ApparelIndustry - Sri Lanka Experience”, Textile and Clothing, April - June 1999.
Goss Gilroy Inc., 2002, “Overview of the North American Market for SriLankan Apparel”. (Preliminary findings of the study funded by theCommonwealth Secretariat and prepared for Sri Lanka ExportDevelopment Board.)
Hasumi Yeji, 1999, “What is necessary for the Industry of Clothing in SriLanka?”, Textile and Clothing, March 1999.
Hathcote Jan and Il-Ji Nam, 1999, “Advantages of Sourcing Apparel fromChina, Taiwan, South Korea and Mexico.”
International Monetary Fund , 2001, “The Uruguay Round and Arabcountries.”
International Monetary Fund, 2001, International Financial Statistics YearBook 2001.
International Monetary Fund and World Bank, 2001, “Market Access forDeveloping Countries Exports.”
72
STAFF STUDIES NO. 33
International Labour Organization, 1996, Globalization Changes the faceof Textile, Clothing and footwear Industries-World of Work, No.18, 1996.
Kelegama Saman and Frikz Foley , 1999, “Impediments to promotingbackward linkage from the Garment Industry in Sri Lanka”, WorldDevelopment, Vol. 27, No.8, 1999.
Larmer Crook, 2002, “ From Rags to Richer”, Newsweek Article, 12 August2002.
People’s Bank, 1999, Economic Review, June/July 1999.
South Asia Multi-disciplinary Advisory Team (SAMAT), 2002, “ ‘GarmentIndustry’ in International Labour Organisation South Asia Rags or Riches”,(ILO), Gopal Johshi, April 2002.
Spinanger, D., 1999, “Faking Liberalization and Finagling Protectionism, theATC at the Best” (KIEL: Kiel Institute of World Economics).
Sri Lanka Apparel Exporters Association , 2000, Sri Lanka GarmentsVol.1/2000 Issue No. 76, Vol. 2/2000 Issue No.77, Vol. 1/2001 Issue No.78and Vol. 2/2001 Issue No.79.
The World Trade Organisation , 1999, Guide to the Uruguay RoundAgreements.
The World Trade Organisation, 2000, International Trade Statistics, Geneva.
The World Trade Organisation , 2001, Market Access: The WTO’s unfinishedBusiness: Post Uruguay Round Inventory and issues, Geneva.
Textile Training and Services Centre , 1998-2001 Survey on GarmentIndustry.
The World Bank, 2000, World Development Report 1999/2000.
The United Nations Development Programme (UNDP) , 2000, HumanDevelopment Report 2000.
Warner International, 2001, International Business Pages, November 2001.
Yang Yongzheng and Znong Chuanshui, 1998, “China’s Textile and ClothingExports in a Changing World Economy”, The Developing EconomicsXXXVI-1, March 1998.
Yuji Hasumi (1999), “What is necessary for the industry of clothing in SriLanka?”, Textile and Clothing, March 1999.