74
Portfolio Additional Estimates Statements 2015-16 Defence Portfolio (Department of Veterans' Affairs) Explanations of Additional Estimates 2015-16

Portfolio Additional Estimates Statements 2015-16
Defence Portfolio
(Department of Veterans' Affairs)
Explanations of Additional Estimates 2015-16

© Commonwealth of Australia 2016
ISBN 978-0-9944775-2-1
This publication is available for your use under a Creative Commons BY Attribution 3.0 Australia licence, with the exception of the Commonwealth Coat of Arms, the Department of Veterans' Affairs
logo, photographs, images, signatures and where otherwise stated. The full licence terms are available
from http://creativecommons.org/licenses/by/3.0/au/legalcode.
Use of Department of Veterans' Affairs material under a Creative Commons BY Attribution 3.0
Australia licence requires you to attribute the work (but not in any way that suggests that the
Department of Veterans' Affairs endorses you or your use of the work).
Department of Veterans' Affairs material used 'as supplied'
Provided you have not modified or transformed Department of Veterans' Affairs material in any way
including, for example, by changing the Department of Veterans' Affairs text; calculating percentage
changes; graphing or charting data; or deriving new statistics from published Department of Veterans'
Affairs statistics – then Department of Veterans' Affairs prefers the following attribution:
Source: The Australian Government Department of Veterans' Affairs
Derivative material
If you have modified or transformed Department of Veterans' Affairs material, or derived new material
from those of the Department of Veterans' Affairs in any way, then Department of Veterans' Affairs
prefers the following attribution:
Based on The Australian Government Department of Veterans' Affairs data
Use of the Coat of Arms
The terms under which the Coat of Arms can be used are set out on the It’s an Honour website (see
www.itsanhonour.gov.au)
Other Uses
Inquiries regarding this licence and any other use of this document are welcome at:
Assistant Secretary
Anzac Centenary and Communication Branch
GPO Box 9998
Canberra ACT 2601
Printed by CanPrint Communications Pty Ltd


iv
Abbreviations and conventions
The following notation may be used:
NEC/nec not elsewhere classified
- nil
.. not zero, but rounded to zero
na not applicable (unless otherwise specified)
nfp not for publication
$m $ million
Figures in tables and in the text may be rounded. Figures in text are generally rounded to one decimal
place, whereas figures in tables are generally rounded to the nearest thousand. Discrepancies in tables
between totals and sums of components are due to rounding.
ENQUIRIES
Should you have any enquiries regarding this publication please contact Graeme Rochow, Chief
Finance Officer, Department of Veterans' Affairs on (02) 6289 6620.
A copy of this document can be located on the Australian Government Budget website at:
http://www.budget.gov.au.

v
USER GUIDE TO THE
PORTFOLIO ADDITIONAL ESTIMATES STATEMENTS

vi
DVA

vii
USER GUIDE
The purpose of the 2015-16 Portfolio Additional Estimates Statements (PAES), like that of the Portfolio
Budget Statements (PB Statements), is to inform Senators and Members of Parliament of the proposed
allocation of resources to Government outcomes by entities within the portfolio. The focus of the PAES
differs from the PB Statements in one important aspect. While the PAES include an Entity Resource
Statement to inform Parliament of the revised estimate of the total resources available to an entity, the
focus of the PAES is on explaining the changes in resourcing by outcome(s) since the Budget. As such,
the PAES provides information on new measures and their impact on the financial and/or
non-financial planned performance of programmes supporting those outcomes.
The PAES facilitate understanding of the proposed appropriations in Appropriation Bills (Nos. 3 and 4)
2015-16. In this sense the PAES is declared by the Additional Estimates Appropriation Bills to be a
‘relevant document’ to the interpretation of the Bills according to section 15AB of the Acts Interpretation
Act 1901.
Whereas the Mid-Year Economic and Fiscal Outlook (MYEFO) 2015-16 is a mid-year budget report which
provides updated information to allow the assessment of the Government’s fiscal performance against
its fiscal strategy, the PAES update the most recent budget appropriations for entities within the
portfolio.

User Guide
viii
Structure of the Portfolio Additional Estimates Statements
The PAES are presented in three parts with subsections.
User Guide
Provides a brief introduction explaining the purpose of the PAES.
Portfolio Overview
Provides an overview of the portfolio, including a chart that outlines the outcomes for entities
in the portfolio.
Entity Additional Estimates Statements
A statement (under the name of the entity) for each entity affected by Additional Estimates.
Section 1: Entity This section details the total resources available to an entity, the
Overview and Resources impact of any measures since Budget, and impact on
Appropriation Bills Nos. 3 and 4.
Section 2: Revisions to This section details changes to Government outcomes and/or
Outcomes and Planned changes to the planned performance of entity programmes.
Performance
Section 3: Explanatory This section contains updated explanatory tables on special
Tables and Budgeted account flows and staffing levels and revisions to the budgeted
Financial Statements financial statements.
Glossary Explains key terms relevant to the Portfolio.

User Guide
ix
CONTENTS
Portfolio Overview .................................................................................................. 3
Entity Additional Estimates Statements ............................................................... 7
Department of Veterans' Affairs ................................................................................ 9
Glossary ................................................................................................................. 61

User Guide
ix
DVA

User Guide
1
PORTFOLIO OVERVIEW

User Guide
2

User Guide
3
PORTFOLIO OVERVIEW
MINISTER AND PORTFOLIO RESPONSIBILITIES
There has been no change in the Department’s role, planned outcomes or programmes structure since
the 2015-16 Portfolio Budget Statements. A full outline of the Department of Veterans' Affairs (DVA)
Portfolio Overview can be found in the 2015-16 Portfolio Budget Statement.
The portfolio is seeking, for the Department of Veterans' Affairs, net additional funding of
$20.8 million, including $19.1 million for departmental expenses and $1.4 million for administered
expenses. The new appropriation funding of $11,681.7 million being sought will provide the
Department with $11,364.1 million in administered expenses and $317.6 million in total departmental
expenses.
No additional funding is being sought for the Australian War Memorial.

Portfolio Overview
4
Figure 1: Department of Veterans' Affairs Portfolio Structure and Outcomes
Department of Veterans’ Affairs
Secretary: Simon Lewis PSM
Outcome 1: Maintain and enhance the
financial wellbeing and self-sufficiency
of eligible persons and their
dependants through access to income
support, compensation, and other
support services, including advice and
information about entitlements.
Outcome 2: Maintain and enhance the
physical wellbeing and quality of life of
eligible persons and their dependants
through health and other care services
that promote early intervention,
prevention and treatment, including
advice and information about health
service entitlements.
Outcome 3: Acknowledgement and
commemoration of those who served
Australia and its allies in wars, conflicts
and peace operations through
promoting recognition of service and
sacrifice, preservation of Australia’s
wartime heritage, and official
commemorations.
Australian War Memorial
Director: The Hon. Dr Brendan Nelson
Outcome 1: Australians remembering,
interpreting and understanding the Australian
experience of war and its enduring impact
through maintaining and developing the
National Memorial, its collection and
exhibition of historical material,
commemorative ceremonies and research.
Minister
The Hon. Stuart Robert MP
Minister for Veterans’ Affairs
Minister for Human Services
Minister Assisting the Prime Minister for the Centenary of Anzac
Portfolio Overview
5
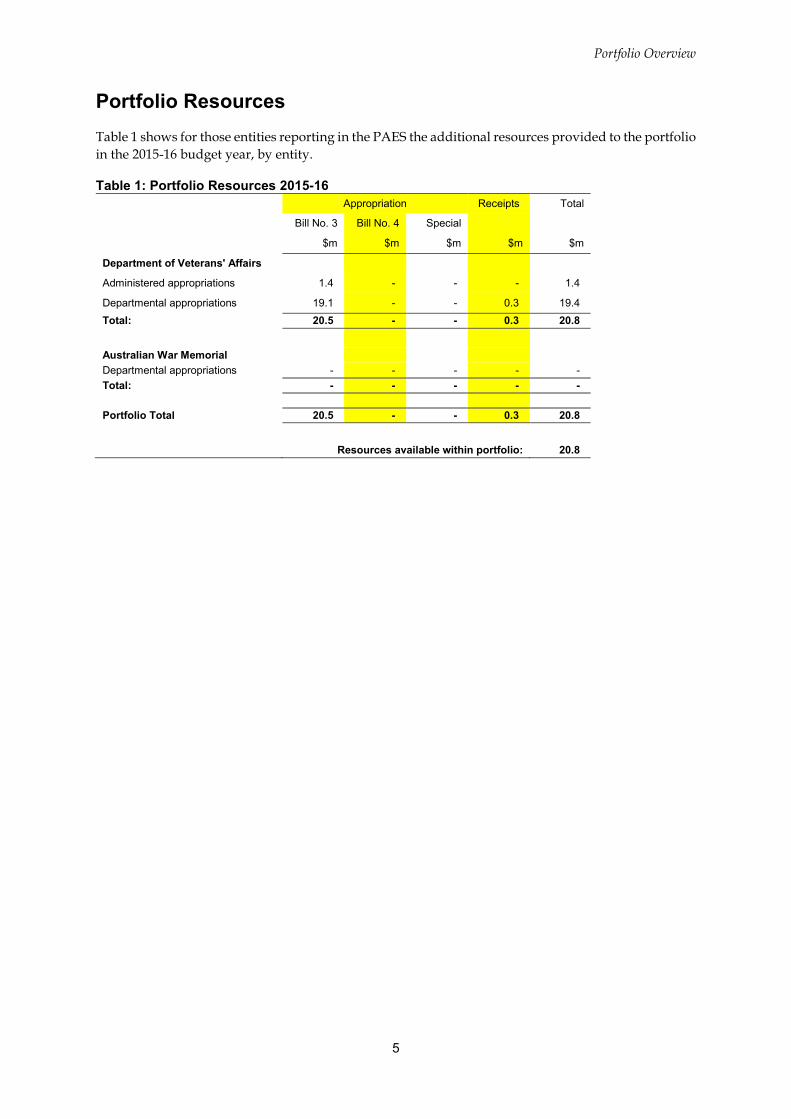
Portfolio Resources
Table 1 shows for those entities reporting in the PAES the additional resources provided to the portfolio
in the 2015-16 budget year, by entity.
Table 1: Portfolio Resources 2015-16
Appropriation Receipts Total
Bill No. 3 Bill No. 4 Special
$m $m $m $m $m
Department of Veterans' Affairs
Administered appropriations 1.4 - - - 1.4
Departmental appropriations 19.1 - - 0.3 19.4
Total: 20.5 - - 0.3 20.8
Australian War Memorial
Departmental appropriations - - - - -
Total: - - - - -
Portfolio Total 20.5 - - 0.3 20.8
Resources available within portfolio: 20.8

ix
DVA

Portfolio Overview
7
ENTITY ADDITIONAL ESTIMATES STATEMENTS
Department of Veterans' Affairs ............................................................................ 9

Portfolio Overview
8
DVA

Portfolio Overview
9
DEPARTMENT OF VETERANS' AFFAIRS
Section 1: Entity Overview and Resources ....................................................... 11
1.1 Strategic Direction ........................................................................................ 11
1.2 Entity Resource Statement .......................................................................... 12
1.3 Entity Measures Table ................................................................................. 16
1.4 Additional Estimates and Variations ............................................................ 19
1.5 Breakdown of Additional Estimates by Appropriation Bill ............................ 22
Section 2: Revisions to Entity Outcomes and Planned Performance ............. 23
2.1 Resources and Performance Information .................................................... 23
Section 3: Explanatory Tables and Budgeted Financial Statements .............. 41
3.1 Explanatory Tables ...................................................................................... 41
3.2 Budgeted Financial Statements ................................................................... 42

Portfolio Overview
10
DVA

Portfolio Overview
11
DEPARTMENT OF VETERANS' AFFAIRS
Section 1: Entity Overview and Resources
1.1 STRATEGIC DIRECTION
For more than 95 years, the Department of Veterans' Affairs (DVA) has supported those who serve or
have served in defence of our nation and commemorated their service and sacrifice. This includes
providing support to Australia’s veterans, current serving men and women, war widows and
widowers, dependants and eligible members of the Australian Federal Police.
DVA’s vision is to be a responsive and flexible organisation, efficiently delivering high quality,
connected services and it does this through providing a wide range of programs and financial
entitlements to support the health and wellbeing of veterans and the wider veteran community.
There has been no change in the DVA’s role, planned outcomes or programs structure since the
2015-16 Portfolio Budget Statements. A full outline of DVA’s strategic direction can be found in the
2015-16 Portfolio Budget Statements.
Administered expenses
The additional administered funding of $1.4 million is required for new measures and other estimate
variations as set out in Table 1.1, 1.2, 1.3 and 1.4, pages 12 to 21.
Departmental expenses
The additional departmental funding of $19.1 million is required for new measures and other estimate
variations as set out in Table 1.1, 1.2, 1.3 and 1.4, pages 12 to 21.

DVA Additional Estimates Statements
12
1.2 ENTITY RESOURCE STATEMENT
The Entity Resource Statement details the resourcing for the Department of Veterans' Affairs at
Additional Estimates. Table 1.1 outlines the total resourcing available from all sources for the 2015-16
Budget year, including variations through Appropriation Bills No. 3 and No. 4, Special Appropriations
and Special Accounts.
Table 1.1: Department of Veterans' Affairs Resource Statement Additional Estimates for 2015-16 as at Additional Estimates February 2016
Total Estimate Proposed Total
available as at + Additional = estimate at
appropriation Budget Estimates Additional
Estimates
2014-15 2015-16 2015-16 2015-16
$'000 $'000 $'000 $'000 1Ordinary annual services
Departmental
Prior year departmental 2 appropriation - 5,568 7,827 13,395
Departmental appropriation3 296,775 297,342 19,072 316,414 4 s74 Retained Revenue Receipts 9,911 9,616 286 9,902
Total
306,686 312,526 27,185 339,711
Administered expenses
Outcome 1 41,569 42,082 - 42,082
Outcome 2 7,343 7,080 - 7,080
Outcome 3 60,252 38,122 1,379 39,501
Payments to corporate entities5 47,808 44,059 - 44,059
Total
Total ordinary annual services 6Other services
A
156,972 131,343 1,379 132,722
463,658 443,869 28,564 472,433
Departmental non-operating
Equity injections 2,617 1,189 - 1,189
Total
2,617 1,189 - 1,189
Administered non-operating
Administered Assets and Liabilities 6,061 - - -
Payments to corporate entities -
non-operating 12,444 7,472 - 7,472
Total
Total other services
Total available annual appropriations
B
18,505 7,472 - 7,472
21,122 8,661 - 8,661
484,780 452,530 28,564 481,094
Continued on next page

DVA Additional Estimates Statements
13
Table 1.1: Department of Veterans' Affairs Resource Statement – Additional Estimates for 2015-16 as at Additional Estimates February 2016 (continued)
Total Estimate Proposed Total
available as at + Additional = estimate at
appropriation Budget Estimates Additional
Estimates
2014-15 2015-16 2015-16 2015-16
$'000 $'000 $'000 $'000
Special appropriations
Special appropriations limited by criteria/entitlement
Outcome 1
Papua New Guinea (Members of the Forces Benefits) Act 1957 52 70 (14) 56
Veterans' Entitlements Act 1986 (VEA) 6,012,242 5,738,445 15,524 5,753,969
Defence Service Homes Act 1918 1,363 1,219 - 1,219
Safety, Rehabilitation and Compensation Act 1988 131,258 132,180 485 132,665
Military Rehabilitation and Compensation Act 2004 265,728 267,293 12,807 280,100
Total Outcome 1 6,410,643 6,139,207 28,802 6,168,009
Outcome 2
Veterans' Entitlements Act 1986 (VEA) 4,998,931 5,155,621 (191,933) 4,963,688
Safety, Rehabilitation and Compensation Act 1988 36,699 39,548 (1,208) 38,340
Military Rehabilitation and Compensation Act 2004 48,864 42,201 11,344 53,545
Australian Participants in British Nuclear Tests (Treatment) Act
2006 347 420 (60) 360
Total Outcome 2 5,084,841 5,237,790 (181,857) 5,055,933
Total special appropriations C 11,495,484 11,376,997 (153,055) 11,223,942
Total appropriations excluding
Special Accounts 11,980,264 11,829,527 (124,491) 11,705,036

DVA Additional Estimates Statements
14
Table 1.1: Department of Veterans' Affairs Resource Statement – Additional Estimates for 2015-16 as at Additional Estimates February 2016 (continued)
Total Estimate Proposed Total
available as at + Additional = estimate at
appropriation Budget Estimate Additional
Estimates
2014-15 2015-16 2015-16 2015-16
$'000 $'000 $'000
$'000
Special Accounts
Opening balance7 2,051 1,215 1,197 2,412
Appropriation Receipts8 320 120 - 120
Special Accounts 49,211 44,801 - 44,801
Total Special Account D 51,582 46,136 1,197
47,333
Total resourcing
A+B+C+D 12,031,846 11,875,663 (123,294)
11,752,369
Less appropriations drawn from annual or special appropriations above and credited to special accounts and/or CAC Act bodies through annual appropriations 56,772 51,651 - 51,651
Total net resourcing for DVA 11,975,074 11,824,012 (123,294)
11,700,718
1. Appropriation Act (No. 1) 2015-16 and Appropriation Bill (No. 3) 2015-16. 2. Estimated adjusted balance carried from previous year for annual appropriations 3. Includes an amount of $13.3m in 2015-16 for the Departmental Capital Budget (refer to table 3.2.5 for further details). For
accounting purposes this amount has been designated as 'contributions by owners'. 4. Estimated retained revenue receipts under section 74 of the Public Governance, Performance and Accountability (PGPA)
Act 2013. 5. ‘Corporate Entities’ are Corporate Commonwealth Entities and Commonwealth Companies as defined under the PGPA
Act 2013. 6. Appropriation Act (No. 2) 2015-16 and Appropriation Bill (No. 4) 2015-16. 7. Estimated opening balance for special accounts (less ‘Special Public Money’ held in a Services for Other Entities and Trust
Moneys Special Accounts (SOETM)). For further information on Special Accounts see Table 3.1.1. 8. Appropriation receipts credited into DSHIS special account included in total departmental appropriation. For further
information, see Table 3.1.1. (Note: Non-appropriation receipts other than those of the DSHIS special account are excluded as these represent Special Public Monies).
Reader note: All figures are GST exclusive.
DVA Additional Estimates Statements
15
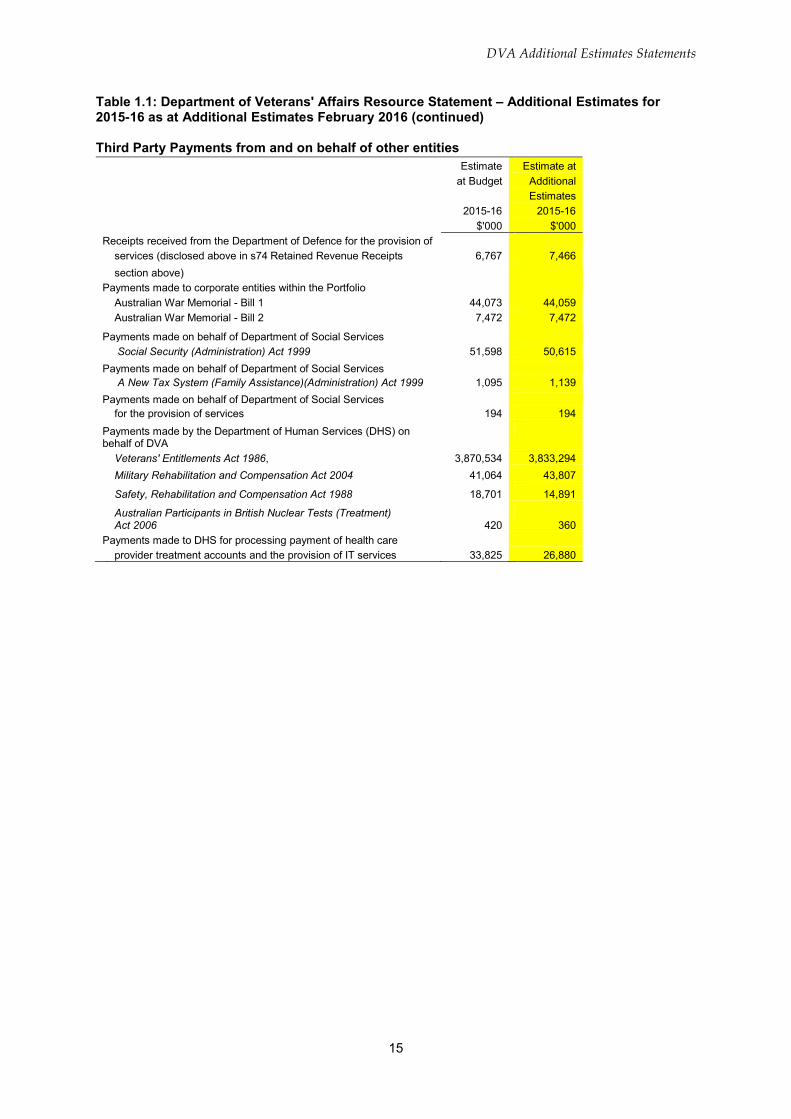
Table 1.1: Department of Veterans' Affairs Resource Statement – Additional Estimates for 2015-16 as at Additional Estimates February 2016 (continued) Third Party Payments from and on behalf of other entities
Receipts received from the Department of Defence for the provision of
Estimate Estimate at
at Budget Additional
Estimates
2015-16 2015-16
$'000 $'000
services (disclosed above in s74 Retained Revenue Receipts 6,767 7,466
section above)
Payments made to corporate entities within the Portfolio
Australian War Memorial - Bill 1 44,073 44,059
Australian War Memorial - Bill 2 7,472 7,472
Payments made on behalf of Department of Social Services
Social Security (Administration) Act 1999 51,598 50,615 Payments made on behalf of Department of Social Services
A New Tax System (Family Assistance)(Administration) Act 1999 1,095 1,139 Payments made on behalf of Department of Social Services
for the provision of services 194 194
Payments made by the Department of Human Services (DHS) on behalf of DVA
Veterans' Entitlements Act 1986, 3,870,534 3,833,294
Military Rehabilitation and Compensation Act 2004 41,064 43,807
Safety, Rehabilitation and Compensation Act 1988 18,701 14,891
Australian Participants in British Nuclear Tests (Treatment) Act 2006 420 360
Payments made to DHS for processing payment of health care
provider treatment accounts and the provision of IT services 33,825 26,880
DVA Additional Estimates Statements
16
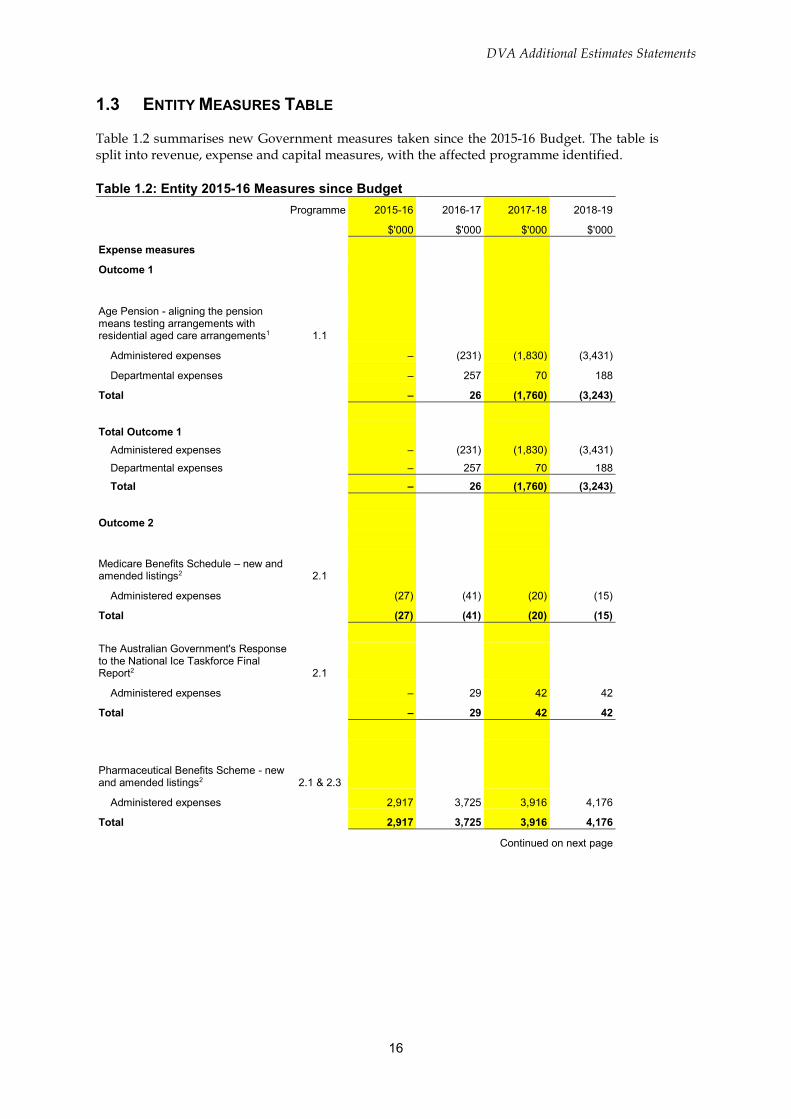
1.3 ENTITY MEASURES TABLE
Table 1.2 summarises new Government measures taken since the 2015-16 Budget. The table is split into revenue, expense and capital measures, with the affected programme identified.
Table 1.2: Entity 2015-16 Measures since Budget
Programme 2015-16 2016-17 2017-18 2018-19
Expense measures
$'000 $'000 $'000 $'000
Outcome 1
Age Pension - aligning the pension means testing arrangements with
1residential aged care arrangements 1.1
Administered expenses – (231) (1,830) (3,431)
Departmental expenses – 257 70 188
Total
– 26 (1,760) (3,243)
Total Outcome 1
Administered expenses – (231) (1,830) (3,431)
Departmental expenses
Total
– 257 70 188
– 26 (1,760) (3,243)
Outcome 2
Medicare Benefits Schedule – new and 2amended listings 2.1
Administered expenses (27) (41) (20) (15)
Total
(27) (41) (20) (15)
The Australian Government's Response to the National Ice Taskforce Final Report2 2.1
Administered expenses – 29 42 42
Total
– 29 42 42
Pharmaceutical Benefits Scheme - new 2and amended listings 2.1 & 2.3
Administered expenses 2,917 3,725 3,916 4,176
Total
2,917 3,725 3,916 4,176
Continued on next page

DVA Additional Estimates Statements
17
Table 1.2: Entity 2015-16 Measures since Budget (continued)
Programme 2015-16 2016-17 2017-18 2018-19
$'000 $'000 $'000 $'000
Expense measures
Outcome 2
Sixth Community Pharmacy Agreement and Pharmaceutical Benefits Scheme Reforms2 2.3
Administered expenses (9,806) (31,042) (31,271) (26,077)
Departmental expenses 1,300 – – –
Total (8,506) (31,042) (31,271) (26,077)
Pharmaceutical Benefits Scheme - price amendments2 2.3
Administered expenses 227 300 285 281
Total 227 300 285 281
Repatriation Pharmaceutical Benefits Scheme - new listings and price amendments 2.3
Administered expenses 71 128 115 109
Total 71 128 115 109
Aged Care Provider Funding – revision to Aged Care Funding Instrument Complex Health Care Domain2 2.4
Administered expenses – (11,920) (17,861) (24,315)
Total – (11,920) (17,861) (24,315)
Total Outcome 2
Administered expenses (6,618) (38,821) (44,794) (45,799)
Departmental expenses 1,300 – – –
Total (5,318) (38,821) (44,794) (45,799)
Outcome 3
Saluting Their Service Commemorative Grants Programme - Vietnam War Commemorative Grants 3.1
Administered expenses – – – –
Departmental expenses – – – –
Total – – – –
Repatriation of Australian Remains from Terendak Military Cemetery in Malaysia and the Kranji War Cemetery in Singapore 3.1
Administered expenses 1,426 – – –
Departmental expenses 301 74 – –
Total 1,727 74 – –
Continued on next page
DVA Additional Estimates Statements
18
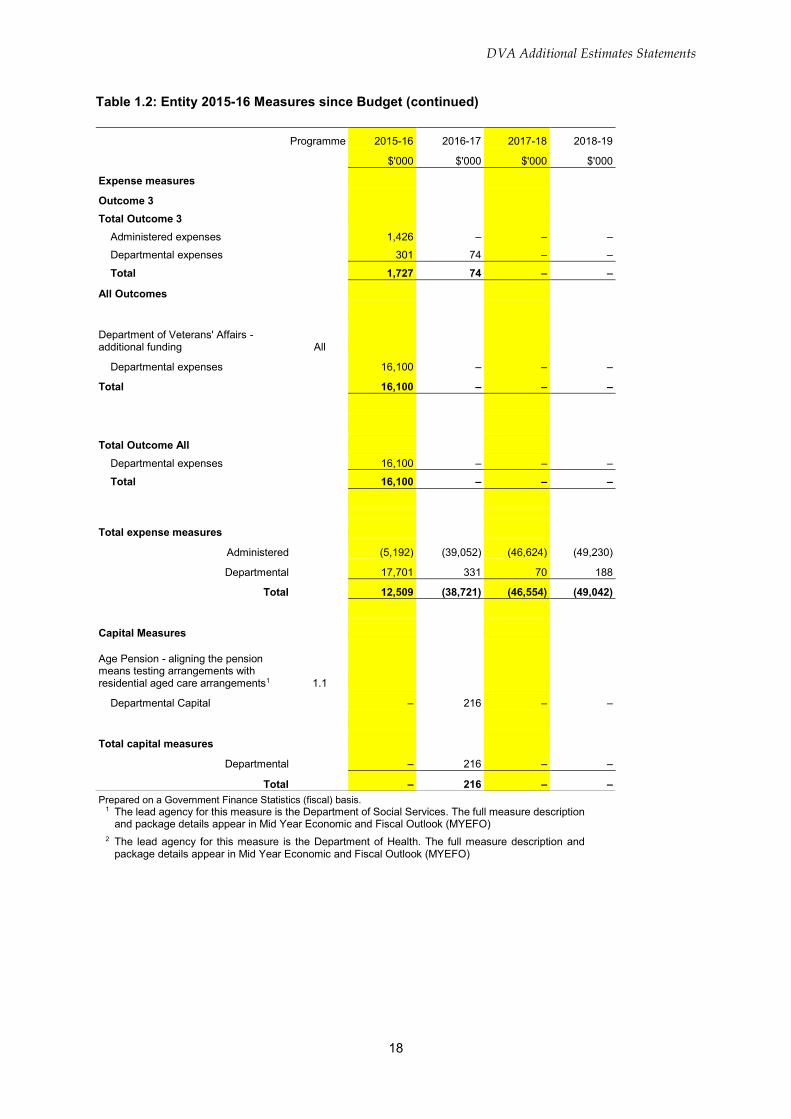
Table 1.2: Entity 2015-16 Measures since Budget (continued)
Programme 2015-16 2016-17 2017-18 2018-19
$'000 $'000 $'000 $'000
Expense measures
Outcome 3
Total Outcome 3
Administered expenses 1,426 – – –
Departmental expenses 301 74 – –
Total 1,727 74 – –
All Outcomes
Department of Veterans' Affairs - additional funding All
Departmental expenses 16,100 – – –
Total 16,100 – – –
Total Outcome All
Departmental expenses 16,100 – – –
Total 16,100 – – –
Total expense measures
Administered (5,192) (39,052) (46,624) (49,230)
Departmental 17,701 331 70 188
Total 12,509 (38,721) (46,554) (49,042)
Capital Measures
Age Pension - aligning the pension means testing arrangements with residential aged care arrangements1 1.1
Departmental Capital – 216 – –
Total capital measures
Departmental – 216 – –
Total – 216 – –
Prepared on a Government Finance Statistics (fiscal) basis. 1 The lead agency for this measure is the Department of Social Services. The full measure description
and package details appear in Mid Year Economic and Fiscal Outlook (MYEFO)
2 The lead agency for this measure is the Department of Health. The full measure description and package details appear in Mid Year Economic and Fiscal Outlook (MYEFO)

DVA Additional Estimates Statements
19
1.4 ADDITIONAL ESTIMATES AND VARIATIONS
The following tables detail the changes to the resourcing for Department of Veterans' Affairs at Additional Estimates, by outcome. Table 1.3 details the Additional Estimates and variations resulting from new measures since the 2015-16 Budget in Appropriation Bills Nos. 3 and 4. Table 1.4 details Additional Estimates or variations through other factors, such as parameter adjustments.
Table 1.3: Additional 2015-16 Budget
Estimates and Variations to Outcomes from Measures since
Programme
impacted
2015-16
$'000
2016-17
$'000
2017-18
$'000
2018-19
$'000
Outcome 1
Increase in estimates (departmental)
Age Pension - aligning the pension means testing arrangements with
residential aged care arrangements
Age Pension - aligning the pension means testing arrangements with residential aged care arrangements
(Capital)
Net impact on estimates
1.1
1.1
–
–
257
216
70
–
188
–
for Outcome 1 (departmental) – 473 70 188
Outcome 2
Increase in estimates (departmental)
Sixth Community Pharmacy Agreement and Pharmaceutical
Benefits Scheme Reforms
Net impact on estimates
2.3
1,300
–
–
–
for Outcome 2 (departmental) 1,300 – – –
Net impact on estimates
Outcome 3
Increase in estimates (administered)
Repatriation of Australian Remains from Terendak Military Cemetery in Malaysia and the Kranji War
Cemetery in Singapore
Net impact on estimates
3.1
1,426
–
–
–
for Outcome 3 (administered) 1,426 – – –
Increase in estimates (departmental)
Repatriation of Australian Remains from Terendak Military Cemetery in Malaysia and the Kranji War
Cemetery in Singapore
Net impact on estimates
3.1
301
74
–
–
for Outcome 3 (departmental) 301 74 – –
Outcome All
Increase in estimates (departmental)
Department of Veterans' Affairs - additional funding
Net impact on estimates
All
16,100
–
–
–
for Outcome All (departmental)
16,100 – – –
Prepared on a Government Financial Statistics (fiscal balance)

DVA Additional Estimates Statements
20
Table 1.4: Additional Estimates and Variations to Outcomes from Other Variations
Programme 2015-16 2016-17 2017-18 2018-19
Impacted $'000 $'000 $'000 $'000
Outcome 1 1.1-1.6
Increase in estimates (administered)
Movement of funds between years 1,479 – – –
Decrease in estimates (administered)
Change in price and wage indices (40) (77) (133) (154)
Self balancing transfers within the same year
(1,479) – – –
Net impact on estimates for Outcome 1 (administered)
(40) (77) (133) (154)
Increase in estimates (departmental)
Self balancing transfers within the same year
802 – – –
Decrease in estimates (departmental)
Change in price and wage indices – – (151) (304)
Net impact on estimates for Outcome 1 (departmental)
802 – (151) (304)
Outcome 2 2.1-2.6
Decrease in estimates (administered)
Change in price and wage indices (2) (6) (14) (20)
Change in beneficiary composition or rates
(172) (166) (139) (164)
Net impact on estimates for Outcome 2 (administered)
(174) (172) (153) (184)
Increase in estimates (departmental)
Self balancing transfers within the same year
540 – – –
Decrease in estimates (departmental)
Change in price and wage indices – – (98) (198)
Net impact on estimates for Outcome 2 (departmental)
540 – (98) (198)
Outcome 3 3.1-3.2
Increase in estimates (administered)
Movement of funds between years – 28 – –
Decrease in estimates (administered)
Change in price and wage indices (47) (82) (121) (127)
Net impact on estimates for Outcome 3 (administered)
(47) (54) (121) (127)
Increase in estimates (departmental)
Self balancing transfers within the same year
137 – – –
Decrease in estimates (departmental)
Change in price and wage indices – – (28) (51)
Net impact on estimates for Outcome 3 (departmental)
137 – (28) (51)
Continued on next page

DVA Additional Estimates Statements
21
Table 1.4: Additional Estimates and Variations to Outcomes from Other Variations (continued)
Programme 2015-16 2016-17 2017-18 2018-19
Impacted $'000 $'000 $'000 $'000
Outcome All All
Decrease in estimates (departmental)
Whole of Government Savings (108) (108) (108) (108)
Net impact on estimates for Outcome All (departmental)
(108) (108) (108) (108)
1. Excludes movements in liability provision for the Safety, Rehabilitation and Compensation and Military Rehabilitation
and Compensation Schemes

DVA Additional Estimates Statements
22
1.5 BREAKDOWN OF ADDITIONAL ESTIMATES BY APPROPRIATION BILL
The following tables detail the Additional Estimates sought for the Department of Veterans' Affairs
through Appropriation Bills Nos. 3 and 4.
Table 1.5: Appropriation Bill (No. 3) 2015-16
2014-15 2015-16 2015-16 Additional Reduced
Available Budget Revised Estimates Estimates
$'000 $'000 $'000 $'000 $'000
ADMINISTERED ITEMS
Outcome 1 40,090 42,082 42,042 – (40)
Outcome 2 7,343 7,080 6,906 – (174)
Outcome 3 57,792 38,122 39,501 1,379 –
Total 105,225 87,284 88,449 1,379 (214)
DEPARTMENTAL PROGRAMMES
Outcome 11 162,219 160,515 169,939 9,424 –
Outcome 21 108,935 109,511 117,226 7,715 –
Outcome 31 25,621 27,316 29,249 1,933 –
Total 296,775 297,342 316,414 19,072 –
Total administered and departmental
402,000 384,626 404,863 20,451 (214)
Table 1.6: Appropriation Bill (No. 4) 2015-16
2014-15 2015-16 2015-16 Additional Reduced
Available Budget Revised Estimates Estimates
$'000 $'000 $'000 $'000 $'000
Non-operating
Equity Injections 1,913 1,189 1,189 – –
Total Departmental 1,913 1,189 1,189 – –
Administered Assets and Liabilities 6,061 – – – –
Total Administered 6,061 – – – –
Total non-operating 7,974 1,189 1,189 – –

DVA Additional Estimates Statements
23
Section 2: Revisions to Entity Resources and Planned Performance
2.1 RESOURCES AND PERFORMANCE INFORMATION
There has been no change in the Department’s role, planned outcomes or programmes structure since the 2015-16 Portfolio Budget Statements. Therefore, the objectives, deliverables and targets have not been altered. Complete details of the Department’s resources and performance information can be found in the 2015-16 Portfolio Budget Statements.
OUTCOME 1
Outcome 1 Strategy
Maintain and enhance the financial wellbeing and self sufficiency of eligible persons and their dependants through access to income support, compensation, and other support services, including advice and information about entitlements.
Table 2.1 provides an overview of the total expenses for Outcome 1, by programme.
Table 2.1: Budgeted Expenses and Resources for Outcome 1
Programme 1.1: Veterans' Income Support and Allowances
Administered Expenses
Ordinary annual services (Appropriation Bill No. 1 & 3)
Other services (Appropriation Bill No. 2 & 4)
Special Appropriations
Special Accounts
Departmental Expenses
Departmental appropriation1 2 Expenses not requiring appropriation in the Budget year
Total for Programme 1.1
Programme 1.2: Veterans' Disability Support
Administered Expenses
Ordinary annual services (Appropriation Bill No. 1 & 3)
Other services (Appropriation Bill No. 2 & 4)
Special Appropriations
Special Accounts
Departmental Expenses
Departmental appropriation1 2 Expenses not requiring appropriation in the Budget year
Total for Programme 1.2
2014-15
Actual
expenses
$'000
2015-16
Revised
estimated
expenses
$'000
-
-
2,662,349
-
59,216
12,220
-
-
2,535,713
-
60,811
7,516
2,733,785 2,604,040
11,628
-
1,567,166
-
39,877
7,339
13,916
-
1,549,256
-
40,985
4,512
1,626,009 1,608,669
Continued on next page
DVA Additional Estimates Statements
24
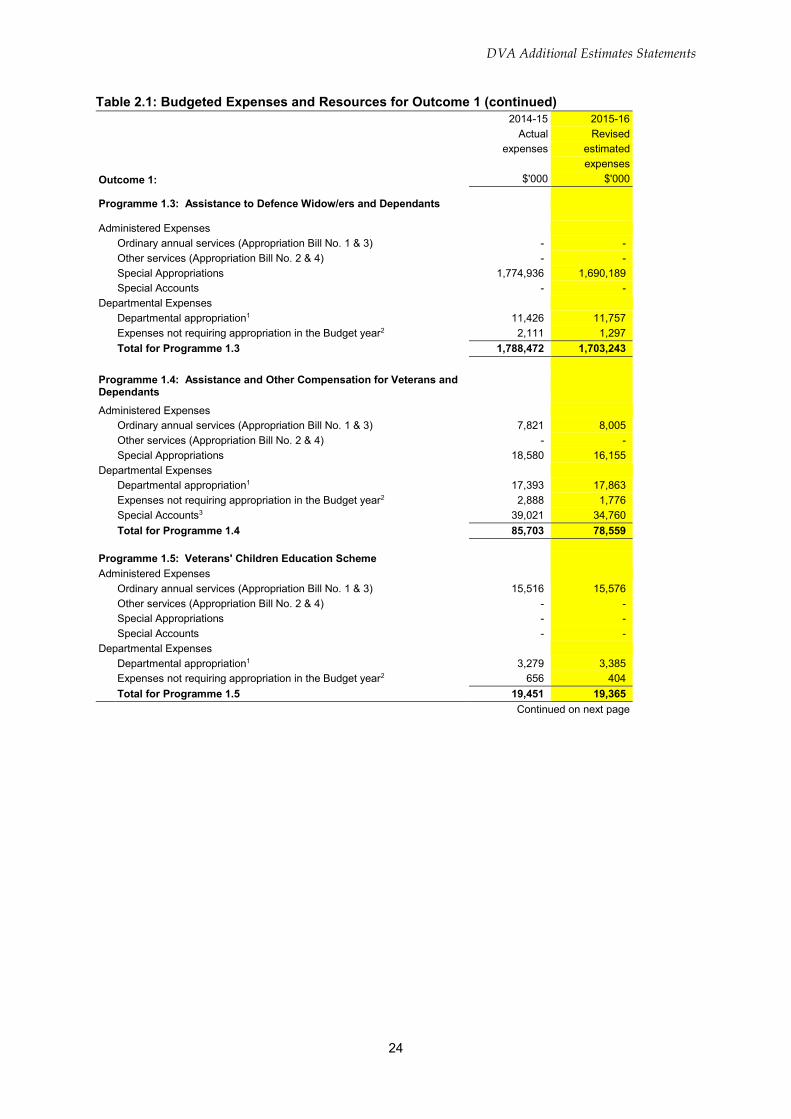
Table 2.1: Budgeted Expenses and Resources for Outcome 1 (continued)
Outcome 1:
2014-15 2015-16
Actual Revised
expenses estimated
expenses
$'000 $'000
Programme 1.3: Assistance to Defence Widow/ers and Dependants
Administered Expenses
Ordinary annual services (Appropriation Bill No. 1 & 3) - -
Other services (Appropriation Bill No. 2 & 4) - -
Special Appropriations 1,774,936 1,690,189
Special Accounts - -
Departmental Expenses
Departmental appropriation1 11,426 11,757
Expenses not requiring appropriation in the Budget year2 2,111 1,297
Total for Programme 1.3 1,788,472 1,703,243
Programme 1.4: Assistance and Other Compensation for Veterans and Dependants
Administered Expenses
Ordinary annual services (Appropriation Bill No. 1 & 3) 7,821 8,005
Other services (Appropriation Bill No. 2 & 4) - -
Special Appropriations 18,580 16,155
Departmental Expenses
Departmental appropriation1 17,393 17,863
Expenses not requiring appropriation in the Budget year2 2,888 1,776
Special Accounts3 39,021 34,760
Total for Programme 1.4 85,703 78,559
Programme 1.5: Veterans' Children Education Scheme
Administered Expenses
Ordinary annual services (Appropriation Bill No. 1 & 3) 15,516 15,576
Other services (Appropriation Bill No. 2 & 4) - -
Special Appropriations - -
Special Accounts - -
Departmental Expenses
Departmental appropriation1 3,279 3,385
Expenses not requiring appropriation in the Budget year2 656 404
Total for Programme 1.5 19,451 19,365
Continued on next page

DVA Additional Estimates Statements
25
Table 2.1: Budgeted Expenses and Resources for Outcome 1 (continued)
Outcome 1:
2014-15 2015-16
Actual Revised
expenses estimated
expenses
$'000 $'000
Programme 1.6: Military Rehabilitation and Compensation Acts Payments - Income Support and Compensation
Administered Expenses
Ordinary annual services (Appropriation Bill No. 1 & 3) 4,450 4,633
Other services (Appropriation Bill No. 2 & 4) - -
Special Appropriations 395,988 414,050
Special Accounts 197 282
Departmental Expenses
Departmental appropriation1 34,380 35,333
Expenses not requiring appropriation in the Budget year2 5,506 3,384
Total for Programme 1.6 440,521 457,682
Programme 1.7: Adjustment to the Military Rehabilitation and Compensation Acts Liability Provision - Income Support and Compensation
Administered Expenses
Ordinary annual services (Appropriation Bill No. 1 & 3) - -
Other services (Appropriation Bill No. 2 & 4) - -
Special Appropriations - -
Special Accounts - -
Expenses not requiring appropriation in the Budget year 1,240,700 132,800
Departmental Expenses
Departmental appropriation1 - -
Expenses not requiring appropriation in the Budget year2 - -
Total for Programme 1.7 1,240,700 132,800
Outcome 1 Totals by appropriation type
Administered Expenses
Ordinary annual services (Appropriation Bill No. 1 & 3) 39,414 42,130
Other services (Appropriation Bill No. 2 & 4) - -
Special Appropriations 6,419,019 6,205,363
Special Accounts 197 282
Expenses not requiring appropriation in the Budget year 1,240,700 132,800
Departmental Expenses
Departmental appropriation1 165,570 170,134
Expenses not requiring appropriation in the Budget year2 30,720 18,889
Special Accounts3 39,021 34,760
Total Expenses for Outcome 1 7,934,640 6,604,358
2014-15 2015-16
Average Staffing Level (number) 1,062 1,037
1. Departmental Appropriation combines ‘Ordinary annual services (Appropriation Bills No. 1 & 3)’ and ‘Retained Revenue Receipts (s74)’.
2. Expenses not requiring appropriation in the Budget year are made up of Depreciation Expense, Amortisation Expense, Audit Fees and ATO Data Matching Services.
3. DSHIS expenses (Section 3, Table 3.1.1 and Table 3.2.1c refers).
Note: Departmental appropriation splits and totals are indicative estimates and may change in the course of the budget year as government priorities change.

DVA Additional Estimates Statements
26
Programme 1.1: Veterans' Income Support and Allowances Programme 1.1: expenses
2014-15 2015-16 2016-17 2017-18 2018-19
Actual Revised Forward Forward Forward $('000) expenses budget year 1 year 2 year 3
Special Appropriations:
Veterans' Entitlements Act 1986 (VEA)
Income support pensions 2,631,717 2,531,130 2,437,891 2,311,962 2,250,279
Other allowances 30,632 4,583 4,263 4,026 3,836
Programme support 59,216 60,811 59,056 59,328 58,234
Expenses not requiring appropriation in the Budget year 12,220 7,516 6,312 5,826 5,949
Total programme expenses 2,733,785 2,604,040 2,507,522 2,381,142 2,318,298
Programme 1.2: Veterans' Disability Support Programme 1.2: expenses
2014-15 2015-16 2016-17 2017-18 2018-19
Actual Revised Forward Forward Forward $('000) expenses budget year 1 year 2 year 3
Annual Administered Expenses:
Appropriation Bill No. 1 & 3
Medical examinations, fares and expenses 11,027 13,130 14,089 14,458 14,401
Repayments of maintenance deductions - 71 71 71 71
Vehicle Assistance Scheme 601 715 713 729 729
Special Appropriations:
Veterans' Entitlements Act 1986 (VEA)
Disability pensions 1,564,927 1,547,022 1,528,501 1,528,507 1,541,059
Loss of earnings 423 439 429 418 398
Recreation transport allowance 1,816 1,795 1,644 1,532 1,443
Programme support 39,877 40,985 39,803 39,985 39,248
Expenses not requiring appropriation in the Budget year 7,339 4,512 3,790 3,498 3,570
Total programme expenses 1,626,009 1,608,669 1,589,040 1,589,198 1,600,919

DVA Additional Estimates Statements
27
Programme 1.3: Assistance to Defence Widow/ers and Dependants Programme 1.3: expenses
2014-15 2015-16 2016-17 2017-18 2018-19
Actual Revised Forward Forward Forward
$('000) expenses budget year 1 year 2 year 3
Special Appropriations:
Veterans' Entitlements Act 1986 (VEA)
War & Defence Widows pension 1,774,936 1,690,189 1,592,440 1,456,714 1,312,368
Programme support 11,426 11,757 11,418 11,470 11,259
Expenses not requiring appropriation in the Budget year 2,111 1,297 1,090 1,006 1,026
Total programme expenses 1,788,472 1,703,243 1,604,948 1,469,190 1,324,653

DVA Additional Estimates Statements
28
Programme 1.4: Assistance and Other Compensation for Veterans and Dependants Programme 1.4: expenses
2014-15 2015-16 2016-17 2017-18 2018-19
Actual Revised Forward Forward Forward
$('000) expenses budget year 1 year 2 year 3
Annual administered expenses:
Appropriation Bill No. 1 & 3
Compensation and Legal Expenses 1,917 1,585 1,612 1,638 1,632
Defective Administration 183 250 249 248 247
Payments to ESOs (BEST & TIP) 4,978 4,993 5,078 5,070 5,069
Veterans' Access to Community Information 687 1,100 1,117 1,137 1,135
Act of Grace 55 77 79 81 81
Veterans' Entitlements Act 1986 (VEA)
Funeral benefits 10,214 9,042 8,035 7,141 6,346
POW (J) - 50 25 25 25
POW (E) 6,241 4,984 4,016 3,236 2,607
Compensation payments for BCAL veterans 739 804 761 720 681
Papua New Guinea (Members of the Forces Benefits) Act 1957
PNG pensions 53 56 58 60 62
Defence Service Homes Act 1918
Interest subsidy 1,333 1,219 1,030 877 753
Special Account expenses:
DSHIS 39,021 34,760 35,360 35,960 36,560
Programme support 17,393 17,863 17,348 17,427 17,106
Expenses not requiring appropriation in the Budget year 2,888 1,776 1,492 1,377 1,405
Total programme expenses 85,703 78,559 76,260 74,997 73,709

DVA Additional Estimates Statements
29
Programme 1.5: Veterans' Children Education Scheme Programme 1.5: expenses
2014-15 2015-16 2016-17 2017-18 2018-19
Actual Revised Forward Forward Forward $('000) expenses budget year 1 year 2 year 3
Annual administered expenses:
Appropriation Bill No. 1 & 3
Veterans' Children Education Scheme 15,516 15,576 15,645 16,085 16,085
Programme support 3,279 3,385 3,288 3,303 3,242
Expenses not requiring appropriation in the Budget year 656 404 339 313 319
Total programme expenses 19,451 19,365 19,272 19,701 19,646

DVA Additional Estimates Statements
30
Programme 1.6: Military Rehabilitation and Compensation Acts Payments - Income Support and Compensation
Programme 1.6: expenses
2014-15 2015-16 2016-17 2017-18 2018-19
Actual Revised Forward Forward Forward
$('000) expenses budget year 1 year 2 year 3
Annual administered expenses:
Appropriation Bill No. 1 & 3
Other income support and compensation-related payments - SRCA 2,703 2,696 2,691 2,752 2,752
Other income support and compensation-related payments - MRCA 1,747 1,937 569 435 317
Special Appropriations:
Safety, Rehabilitation and Compensation Act 1988
Permanent impairment 44,095 41,113 36,740 37,566 34,991
Benefits for eligible dependants 12,540 16,490 16,163 15,669 15,179
Incapacity payments 67,118 67,869 63,897 62,530 61,192
Medical examinations 4,535 4,868 4,402 4,575 4,400
Death payments 1,810 2,496 2,363 2,433 2,429
Other income support and compensation-related payments 174 335 335 343 343
Military Rehabilitation and Compensation Act 2004
Permanent impairment 144,894 153,327 138,641 126,787 125,177
Benefits for eligible dependants 7,632 8,364 8,128 7,938 7,533
Income maintenance payments 101,371 106,908 115,107 125,748 137,381
Medical examinations 11,770 12,243 12,684 13,098 13,522
Other income support and compensation-related payments 48 37 37 38 38
Special Account Expenses:
Military death claim compensation 197 282 246 619 360
Programme support 34,380 35,333 34,314 34,470 33,836
Expenses not requiring appropriation in the Budget year 5,506 3,384 2,843 2,624 2,678
Total programme expenses 440,521 457,682 439,160 437,625 442,128

DVA Additional Estimates Statements
31
Programme 1.7: Adjustment to the Military Rehabilitation and Compensation Acts Liability Provision - Income Support and Compensation
Programme 1.7: expenses
2014-15 2015-16 2016-17 2017-18 2018-19
Actual Revised Forward Forward Forward $('000) expenses budget year 1 year 2 year 3
Administered Expenses: Expenses not requiring appropriation in the Budget year
1,240,700 132,800 196,400 221,800 229,900
Total programme expenses 1,240,700 132,800 196,400 221,800 229,900

DVA Additional Estimates Statements
32
OUTCOME 2
Outcome 2 Strategy
Maintain and enhance the physical wellbeing and quality of the life of eligible persons and their dependants through health and other care services that promote early intervention, prevention and treatment, including advice and information about health service entitlements.
Table 2.2 provides an overview of the total expenses for Outcome 2, by programme.
Table
2.2: Budgeted Expenses and Resources for Outcome
2
Programme 2.1: General Medical Consultations and Services
Administered Expenses
Ordinary annual services (Appropriation Bill No. 1 & 3)
Other services (Appropriation Bill No. 2 & 4)
Special Appropriations
Special Accounts
Departmental Expenses
Departmental appropriation1 2 Expenses not requiring appropriation in the Budget year
Total for Programme 2.1
Programme 2.2: Veterans' Hospital Services
Administered Expenses
Ordinary annual services (Appropriation Bill No. 1 & 3)
Other services (Appropriation Bill No. 2 & 4)
Special Appropriations
Special Accounts
Departmental Expenses
Departmental appropriation1 2 Expenses not requiring appropriation in the Budget year
Total for Programme 2.2
Programme 2.3: Veterans' Pharmaceuticals Benefits
Administered Expenses
Ordinary annual services (Appropriation Bill No. 1 & 3)
Other services (Appropriation Bill No. 2 & 4)
Special Appropriations
Special Accounts
Departmental Expenses
Departmental appropriation1 2 Expenses not requiring appropriation in the Budget year
Total for Programme 2.3
2014-15
Actual
expenses
$'000
2015-16
Revised
estimated
expenses
$'000
-
-
857,754
-
20,701
470
-
-
854,186
-
21,278
288
878,925 875,752
-
-
1,629,156
-
10,081
1,569
-
-
1,599,953
-
10,367
966
1,640,806 1,611,286
-
-
355,347
-
1,213
61
-
-
365,321
-
1,239
37
356,621 366,597
Continued on next page

DVA Additional Estimates Statements
33
Table 2.2: Budgeted Expenses and Resources for Outcome 2 (continued)
Outcome 2:
2014-15 2015-16
Actual Revised
expenses estimated
expenses
$'000 $'000
Programme 2.4: Veterans' Community Care and Support
Administered Expenses
Ordinary annual services (Appropriation Bill No. 1 & 3) 2,449 2,240
Other services (Appropriation Bill No. 2 & 4) - -
Special Appropriations 1,538,309 1,529,147
Special Accounts - -
Departmental Expenses
Departmental appropriation1 29,365 30,194
Expenses not requiring appropriation in the Budget year2 4,692 2,886
Total for Programme 2.4 1,574,815 1,564,467
Programme 2.5: Veterans' Counselling and Other Health Services
Administered Expenses
Ordinary annual services (Appropriation Bill No. 1 & 3) 4,057 4,666
Other services (Appropriation Bill No. 2 & 4) - -
Special Appropriations 604,972 624,963
Special Accounts - -
Departmental Expenses
Departmental appropriation1 28,865 29,681
Expenses not requiring appropriation in the Budget year2 3,558 2,188
Total for Programme 2.5 641,451 661,498
Programme 2.6: Military Rehabilitation and Compensation Acts - Health and Other Care Services
Administered Expenses
Ordinary annual services (Appropriation Bill No. 1 & 3) - -
Other services (Appropriation Bill No. 2 & 4) - -
Special Appropriations 87,293 91,885
Special Accounts - -
Departmental Expenses
Departmental appropriation1 14,247 14,629
Expenses not requiring appropriation in the Budget year2 2,641 1,623
Total for Programme 2.6 104,182 108,137
Continued on next page

DVA Additional Estimates Statements
34
Table 2.2: Budgeted Expenses and Resources for Outcome 2 (continued)
Outcome 2:
2014-15 2015-16
Actual Revised
expenses estimated
expenses
$'000 $'000
Programme 2.7: Adjustment to the Military Rehabilitation and Compensation Acts Liability Provision - Health and Other Care Services
Administered Expenses
Ordinary annual services (Appropriation Bill No. 1 & 3) - -
Other services (Appropriation Bill No. 2 & 4) - -
Special Appropriations - -
Special Accounts - -
Expenses not requiring appropriation in the Budget year 453,300 59,800
Departmental Expenses
Departmental appropriation1 - -
Expenses not requiring appropriation in the Budget year2 - -
Total for Programme 2.7 453,300 59,800
Outcome 2 Totals by appropriation type
Administered Expenses
Ordinary annual services (Appropriation Bill No. 1 & 3) 6,505 6,906
Other services (Appropriation Bill No. 2 & 4) - -
Special Appropriations 5,072,831 5,065,455
Expenses not requiring appropriation in the Budget year 453,300 59,800
Departmental Expenses
Departmental appropriation1 104,472 107,388
Expenses not requiring appropriation in the Budget year2 12,992 7,988
Total expenses for Outcome 2 5,650,100 5,247,537
2014-15 2015-16
Average Staffing Level (number) 638 616
1. Departmental Appropriation combines ‘Ordinary annual services (Appropriation Bills No. 1 & 3)’ and ‘Retained
Revenue Receipts (s74)’. 2. Expenses not requiring appropriation in the Budget year are made up of Depreciation Expense, Amortisation
Expense, Audit Fees and ATO Data Matching Services.
Note: Departmental appropriation splits and totals are indicative estimates and may change in the course of the budget year as government priorities change.

DVA Additional Estimates Statements
35
Programme 2.1: General Medical Consultations and Services Programme 2.1 expenses 2014-15 2015-16 2016-17 2017-18 2018-19
Actual Revised Forward Forward Forward $('000) expenses budget year 1 year 2 year 3
Special Appropriations:
Veterans' Entitlements Act 1986 (VEA)
LMO consultations 162,400 161,879 160,733 159,017 157,473
Specialist consultations 145,300 142,948 137,682 132,348 127,348
Medical services 452,616 449,939 443,349 436,269 429,918
Dental 97,438 99,420 98,303 96,999 95,805
Programme support 20,701 21,278 20,664 20,759 20,377
Expenses not requiring appropriation in the Budget year 470 288 242 224 228
Total programme expenses 878,925 875,752 860,973 845,616 831,149
Programme 2.2: Veterans' Hospital Services Programme 2.2 expenses
2014-15 2015-16 2016-17 2017-18 2018-19
Actual Revised Forward Forward Forward $('000) expenses budget year 1 year 2 year 3
Special Appropriations:
Veterans' Entitlements Act 1986 (VEA)
Public hospitals 778,548 743,466 755,012 769,193 783,283
Private hospitals 847,098 853,175 851,870 848,315 842,687
Psych - 1 1 1 1
Nursing homes (POW) 3,510 3,311 3,141 2,993 2,861
Programme support 10,081 10,367 10,068 10,114 9,928
Expenses not requiring appropriation in the Budget year 1,569 966 811 749 764
Total programme expenses 1,640,806 1,611,286 1,620,903 1,631,365 1,639,524

DVA Additional Estimates Statements
36
Programme 2.3: Veterans' Pharmaceuticals Benefits Programme 2.3 expenses 2014-15 2015-16 2016-17 2017-18 2018-19
Actual Revised Forward Forward Forward $('000) expenses budget year 1 year 2 year 3
Special Appropriations:
Veterans' Entitlements Act 1986 (VEA)
Pharmaceutical services 355,347 365,321 334,842 319,045 309,778
Programme support 1,213 1,239 1,203 1,209 1,187
Expenses not requiring appropriation in the Budget year 61 37 31 29 30
Total programme expenses 356,621 366,597 336,076 320,283 310,995
Programme 2.4: Veterans' Community Care and Support Programme 2.4 expenses 2014-15 2015-16 2016-17 2017-18 2018-19
Actual Revised Forward Forward Forward $('000) expenses budget year 1 year 2 year 3
Annual administered expenses:
Appropriation Bill No. 1 & 3
Grants-In-Aid 112 145 145 145 145
Community Care Grants 630 624 634 642 640
Joint Venture Grants 1,110 1,103 1,120 1,133 1,129
JV Day Clubs 367 368 373 397 396
JV Home Maintenance1 231 - - - -
Special Appropriations:
Veterans' Entitlements Act 1986 (VEA)
Residential care2 1,326,683 1,278,466 1,231,968 1,189,646 1,148,335
Community nursing 109,302 137,478 138,023 138,715 139,793
Veterans' Home Care 90,706 99,990 104,100 101,600 100,801
In-home respite 10,662 12,015 11,815 11,592 11,382
Carer and volunteer support 956 1,198 1,404 1,409 1,410
Programme support 29,365 30,194 29,324 29,458 28,915
Expenses not requiring appropriation in the Budget year 4,692 2,886 2,424 2,237 2,283
Total programme expenses 1,574,815 1,564,467 1,521,330 1,476,974 1,435,229
1. The Veterans Home Maintenance Line ceased on 5 February 2015. 2. Residential Care estimates have been revised on the basis of population trends as Veterans' Affairs clients are declining as a proportion of the overall Residential Care population. This is offset by increasing Residential Care demand from Department of Health clients and does not constitute a reduction to the whole of government Residential Care estimate.

DVA Additional Estimates Statements
37
Programme 2.5: Veterans' Counselling and Other Health Services Programme 2.5 expenses 2014-15 2015-16 2016-17 2017-18 2018-19
Actual Revised Forward Forward Forward $('000) expenses budget year 1 year 2 year 3
Annual Administered Expenses:
Appropriation Bill No. 1 & 3
Counselling support & children's assistance 1,208 1,504 1,233 857 854
Compensation and legal expenses -5 55 56 57 57
Veterans' employment & training 623 618 648 697 697
Health & medical research 2,231 2,489 2,527 2,566 2,606
Special Appropriations:
Veterans' Entitlements Act 1986 (VEA)
Travel for treatment 168,218 184,167 185,798 190,794 195,750
Subsistence 6,124 6,518 6,588 6,662 6,754
Veterans and veterans' families counselling services 30,758 32,637 33,952 35,102 36,621
Non-institutional care - services 168,826 164,084 161,177 156,816 151,680
Non-institutional care - products 61,833 58,565 55,814 53,073 50,371
Rehabilitation appliances* 160,076 169,832 171,684 173,637 177,137
Health treatment for BCAL veterans 8,792 8,800 8,000 7,984 7,976
Australian Participants in British Nuclear Tests (Treatment) Act 2006
Nuclear test health care payments 347 360 360 379 379
Programme support 28,865 29,681 28,825 28,956 28,423
Expenses not requiring appropriation in the Budget year 3,558 2,188 1,838 1,696 1,731
Total programme expenses 641,451 661,498 658,500 659,276 661,036
* A range of falls prevention appliances previously provided under HomeFront are available effective 6 February 2015 under Rehabilitation Appliances.

DVA Additional Estimates Statements
38
Programme 2.6: Military Rehabilitation and Compensation Acts - Health and Other Care Services Programme 2.6 expenses 2014-15 2015-16 2016-17 2017-18 2018-19
Actual Revised Forward Forward Forward $('000) expenses budget year 1 year 2 year 3
Special Appropriations:
Safety, Rehabilitation and Compensation Act 1988
Medical services 22,014 22,632 20,114 20,495 20,415
Rehabilitation services 5,613 6,258 6,154 6,252 6,228
Other services 9,736 9,450 9,300 8,883 7,976
Military Rehabilitation and Compensation Act 2004
Medical services 34,889 40,400 38,612 38,198 40,221
Rehabilitation services 12,967 10,741 11,129 11,491 11,867
Other services 2,075 2,404 2,843 2,888 2,877
Programme support 14,247 14,629 14,207 14,272 14,009
Expenses not requiring appropriation in the Budget year 2,641 1,623 1,363 1,258 1,284
Total programme expenses 104,182 108,137 103,722 103,737 104,877
Programme 2.7: Adjustment to the Military Rehabilitation and Compensation Acts Liability Provision - Health and Other Care Services Programme 2.7 expenses 2014-15 2015-16 2016-17 2017-18 2018-19
Actual Revised Forward Forward Forward $('000) expenses budget year 1 year 2 year 3
Administered Expenses
Expenses not requiring appropriation in the Budget year 453,300 59,800 79,800 85,600 88,100
Total programme expenses 453,300 59,800 79,800 85,600 88,100

DVA Additional Estimates Statements
39
OUTCOME 3
Table 2.3 provides an overview of the total expenses for Outcome 3 by programme.
Table 2.3: Budgeted Expenses and Resources for Outcome 3 Outcome 3: Acknowledgement and commemoration of those who served Australia and its allies in wars, conflicts and peace operations through promoting recognition of service and sacrifice, preservation of Australia’s wartime heritage, and official commemorations.
2014-15 2015-16
Actual Revised
expenses estimated
expenses
$'000 $'000
Programme 3.1: War Graves and Commemorations
Administered Expenses
Ordinary annual services (Appropriation Bill No. 1 & 3) 50,040 33,655
Other services (Appropriation Bill No. 2 & 4) - -
Special Appropriations - -
Special Accounts 11,515 22,527
Departmental Expenses
Departmental appropriation1 22,641 23,273
Expenses not requiring appropriation in the Budget year2 3,671 1,885
Total for Programme 3.1 87,867 81,340
Programme 3.2: Gallipoli-related Activities
Administered Expenses
Ordinary annual services (Appropriation Bill No. 1 & 3) 8,614 5,846
Other services (Appropriation Bill No. 2 & 4) - -
Special Appropriations - -
Special Accounts - -
Departmental Expenses
Departmental appropriation1 1,397 1,451
Expenses not requiring appropriation in the Budget year2 106 66
Total for Programme 3.2 10,118 7,363
Outcome 3 Totals by appropriation type
Administered Expenses
Ordinary annual services (Appropriation Bill No. 1 & 3) 58,654 39,501
Other services (Appropriation Bill No. 2 & 4) - -
Special Appropriations - -
Special Accounts 11,515 22,527
Departmental Expenses
Departmental appropriation1 24,038 24,724
Expenses not requiring appropriation in the Budget year2 3,777 1,951
Total expenses for Outcome 3 97,984 88,703
2014-15 2015-16
Average Staffing Level (number) 149 170
1. Departmental Appropriation combines ‘Ordinary annual services (Appropriation Bills No. 1 & 3)’ and ‘Retained Revenue Receipts (s74)’.
2. Expenses not requiring appropriation in the Budget year are made up of Depreciation Expense, Amortisation Expense, Audit Fees and ATO Data Matching Services.
Note: Departmental appropriation splits and totals are indicative estimates and may change in the course of the budget year as government priorities change.

DVA Additional Estimates Statements
40
Programme 3.1: War Graves and Commemorations Programme 3.1 expenses
2014-15 2015-16 2016-17 2017-18 2018-19
Actual Revised Forward Forward Forward $('000) expenses budget year 1 year 2 year 3
Annual administered expenses:
Appropriation Bill No. 1 & 3
War graves care & maintenance 21,031 17,068 16,349 16,929 17,350
OAWG refurbishment, reconstruction & relocation 998 1,000 1,023 1,047 1,047
Compensation and legal expenses - 5 5 5 5
Veterans' commemorative activities 28,011 15,582 14,145 15,190 10,438
Special Account Expenses:
Australians at War - - - - -
Services for Other Entities and Trust Moneys Special Account 174 102 102 122 102
Anzac Centenary Public Fund Special Account 11,341 22,425 19,600 8,500 8,500
Programme support 22,641 23,273 22,602 22,705 22,287
Expenses not requiring appropriation in the Budget year 3,671 1,885 1,584 1,462 1,492
Total programme expenses 87,867 81,340 75,410 65,960 61,221
Programme 3.2: Gallipoli-related Activities Programme 3.2 expenses 2014-15 2015-16 2016-17 2017-18 2018-19
Actual Revised Forward Forward Forward $('000) expenses budget year 1 year 2 year 3
Annual administered expenses:
Appropriation Bill No. 1 & 3
Gallipoli-related activities 8,614 5,846 3,611 3,683 3,195
Programme support 1,397 1,451 1,409 1,415 1,389
Expenses not requiring appropriation in the Budget year 106 66 56 51 52
Total programme expenses 10,118 7,363 5,076 5,149 4,636
DVA Additional Estimates Statements
41
Section 3: Explanatory Tables and Budgeted Financial Statements
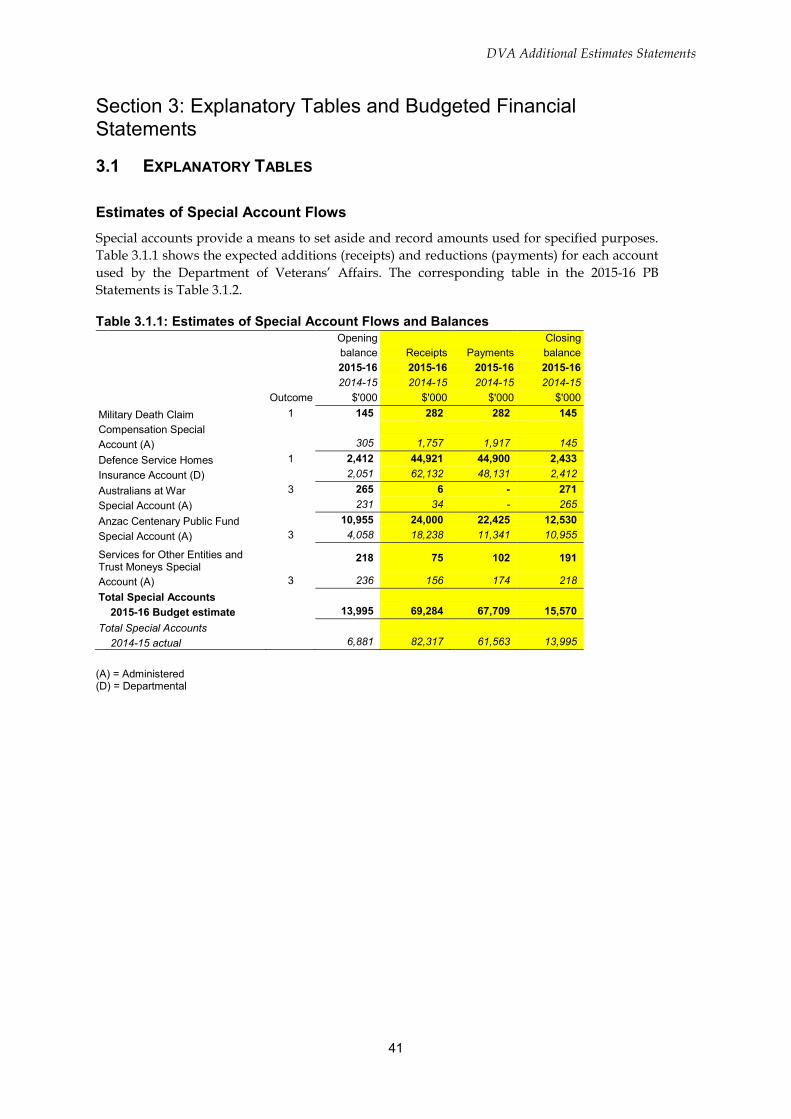
3.1 EXPLANATORY TABLES
Estimates of Special Account Flows
Special accounts provide a means to set aside and record amounts used for specified purposes.
Table 3.1.1 shows the expected additions (receipts) and reductions (payments) for each account
used by the Department of Veterans’ Affairs. The corresponding table in the 2015-16 PB
Statements is Table 3.1.2.
Table 3.1.1: Estimates of Special Account Flows and Balances
Outcome
Opening
balance
2015-16
2014-15
$'000
Receipts
2015-16
2014-15
$'000
Payments
2015-16
2014-15
$'000
Closing
balance
2015-16
2014-15
$'000
Military Death Claim
Compensation Special
Account (A)
1
145
305
282
1,757
282
1,917
145
145
Defence Service Homes
Insurance Account (D)
1
2,412
2,051
44,921
62,132
44,900
48,131
2,433
2,412
Australians at War
Special Account (A)
3
265
231
6
34
-
-
271
265
Anzac Centenary Public Fund
Special Account (A)
3
10,955
4,058
24,000
18,238
22,425
11,341
12,530
10,955
Services for Other Entities and Trust Moneys Special
Account (A)
Total Special Accounts
2015-16 Budget estimate
Total Special Accounts
2014-15 actual
3
218
236
75
156
102
174
191
218
13,995
69,284
67,709 15,570
6,881
82,317
61,563 13,995
(A) (D)
= =
Administered Departmental

DVA Additional Estimates Statements
42
3.2 BUDGETED FINANCIAL STATEMENTS
3.2.1 Analysis of Budgeted Financial Statements
The budgeted financial statements are shown at three levels and reflect the financial results of the three
reporting entities that comprise DVA’s departmental accounts: DVA amalgamated, DVA excluding
Defence Services Homes Insurance Scheme (DSHIS), and DSHIS.
Departmental (DVA excluding DSHIS)
Budgeted Departmental Income Statement
The Department is budgeting a surplus of $16.1m in 2015-16 due to supplementary funding from the
government.
Budgeted Departmental Balance Sheet
The Department’s net asset (equity) position for the 2015-16 financial year is projected to be $29.8
million, which is an increase of $13.9 million from the estimated Budget figure of $15.9 million. This
change in equity is a result of an increase in estimated accumulated results of $16.7 million mainly due
to the supplementary funding provided by the government. This has been offset by a decrease in asset
revaluation reserve of $2.9 million as a result of revaluation at 30 June 2015.

DVA Additional Estimates Statements
43
3.2.2 Budgeted Financial Statements
Table 3.2.1a: Budgeted Departmental Comprehensive Income Statement (amalgamated) (Showing Net Cost of Services)
Actual Revised Forward Forward Forward
budget estimate estimate estimate
2014-15 2015-16 2016-17 2017-18 2018-19
$'000 $'000 $'000 $'000 $'000
EXPENSE
Employee benefits 189,989 190,733 186,112 184,197 180,816
Supplier expenses 109,720 113,939 108,573 111,569 109,637
Depreciation and amortisation 28,836 28,003 23,390 21,525 21,986
Insurance claims 34,201 29,000 29,500 30,000 30,500
Other expenses 18,045 - - - -
Total expenses 380,791 361,675 347,575 347,291 342,939
LESS:
OWN-SOURCE INCOME
Revenue
Sale of goods and rendering
of services 45,544 44,902 42,540 43,549 39,149
Resources received free of charge 827 825 825 825 825
Other revenue 4,264 4,600 4,700 4,800 4,900
Total revenue 50,635 50,327 48,065 49,174 44,874
Gains
Other gains 94 - - - -
Total gains 94 - - - -
Total own-source income 50,729 50,327 48,065 49,174 44,874
Net cost of services 330,062 311,348 299,510 298,117 298,065
Revenue from Government 283,306 303,097 280,272 281,244 281,029
Surplus (Deficit) before income tax (46,756) (8,251) (19,238) (16,873) (17,036)
Continued on next page

DVA Additional Estimates Statements
44
Table 3.2.1a: Budgeted Departmental Comprehensive Income Statement (amalgamated) (Showing Net Cost of Services) (continued)
Actual Revised Forward Forward Forward
budget estimate estimate estimate
2014-15 2015-16 2016-17 2017-18 2018-19
$'000 $'000 $'000 $'000 $'000
Income tax expense (competitive neutrality) 250 202 202 202 -
Surplus (Deficit) after income tax (47,006) (8,453) (19,440) (17,075) (17,036)
OTHER COMPREHENSIVE INCOME
Changes in assets revaluation
reserve (2,879) - - - -
Total other comprehensive income (2,879) - - - -
Total comprehensive income
attributable to the
Australian Government (49,885) (8,453) (19,440) (17,075) (17,036)
Note: Reconciliation of operating result attributable to the agency
2014-15 2015-16 2016-17 2017-18 2018-19
$'000 $'000 $'000 $'000 $'000
Total Comprehensive Income
(loss) Attributable to the
Australian Government (49,885) (8,453) (19,440) (17,075) (17,036)
Plus non-appropriated expenses:
Depreciation and amortisation expenses 28,836 28,003 23,390 21,525 21,986
Total Comprehensive Income
(loss) Attributable to the
agency (21,049) 19,550 3,950 4,450 4,950
Prepared on Australian Accounting Standards basis

DVA Additional Estimates Statements
45
Table 3.2.2a: Budgeted Departmental Balance Sheet (amalgamated) (as at 30 June)
Actual Revised Forward Forward Forward
budget estimate estimate estimate
2014-15 2015-16 2016-17 2017-18 2018-19
$'000 $'000 $'000 $'000 $'000
ASSETS
Financial assets
Cash and equivalents 5,122 3,924 3,780 3,748 3,823
Trade and other receivables 16,736 16,736 16,736 16,736 16,736
Appropriation receivables 8,273 5,408 3,563 2,560 640
Investments 54,893 57,893 60,693 63,293 65,593
Total financial assets 85,024 83,961 84,772 86,337 86,792
Non-financial assets
Land and buildings 13,088 7,218 13,378 12,086 17,425
Infrastructure, plant and equipment 3,141 4,191 5,677 7,378 9,083
Intangibles 87,798 79,122 61,807 53,866 38,870
Other non-financial assets 8,932 7,681 7,681 7,681 7,681
Total non-financial assets 112,959 98,212 88,543 81,011 73,059
Total assets 197,983 182,173 173,315 167,348 159,851
LIABILITIES
Payables
Supplier payables 20,596 19,608 18,390 17,856 17,161
Other payables 28,597 23,876 24,536 24,535 24,514
Total payables 49,193 43,484 42,926 42,391 41,675
Provisions
Employee provisions 68,032 57,157 55,705 55,234 54,034
Other provisions 24,341 20,412 19,283 17,404 14,825
Total provisions 92,373 77,569 74,988 72,638 68,859
Total liabilities 141,566 121,053 117,914 115,029 110,534
Net assets 56,417 61,120 55,401 52,319 49,317
Equity
Contributed equity 204,047 218,553 232,274 246,267 260,301
Asset revaluation reserve 10,592 10,592 10,592 10,592 10,592
Retained surplus (accumulated deficit) (158,222) (168,025) (187,465) (204,540) (221,576)
Total equity 56,417 61,120 55,401 52,319 49,317
Prepared on Australian Accounting Standards basis

DVA Additional Estimates Statements
46
Table 3.2.3a: Budgeted Departmental Statement of Cash Flows (amalgamated) (for the period ended 30 June)
Actual Revised Forward Forward Forward
budget estimate estimate estimate
2014-15 2015-16 2016-17 2017-18 2018-19
$'000 $'000 $'000 $'000 $'000
OPERATING ACTIVITIES
Cash received
Appropriations 293,142 316,528 289,331 289,470 284,772
Sale of goods and services 51,757 52,959 50,261 51,271 46,331
Net GST received 8,378 9,435 9,457 9,587 10,210
Other 8,933 2,801 2,801 2,801 2,801
Total cash received 362,210 381,723 351,850 353,129 344,114
Cash used
Employees 188,330 200,217 187,315 184,468 181,866
Suppliers 119,921 132,836 117,363 120,518 118,900
Other 52,013 48,218 44,516 45,575 40,973
Total cash used 360,264 381,271 349,194 350,561 341,739
Net cash from or (used by)
operating activities 1,946 452 2,656 2,568 2,375
INVESTING ACTIVITIES
Cash received
Proceeds from sales of property,
plant and equipment - 1,350 - - -
Investments realised 11,935 - - - -
Total cash received 11,935 1,350 - - -
Cash used
Purchase of property, plant
and equipment, and intangibles 15,390 14,506 13,721 13,993 14,034
Purchase of investments 13,640 3,000 2,800 2,600 2,300
Total cash used 29,030 17,506 16,521 16,593 16,334
Net cash from or (used by)
investing activities (17,095) (16,156) (16,521) (16,593) (16,334)
FINANCING ACTIVITIES
Cash received
Equity Injections 16,086 14,506 13,721 13,993 14,034
Total cash received 16,086 14,506 13,721 13,993 14,034
Net cash from or (used by)
financing activities 16,086 14,506 13,721 13,993 14,034
Net increase or (decrease)
in cash held 937 (1,198) (144) (32) 75
Cash and cash equivalents at the
beginning of the reporting period 4,185 5,122 3,924 3,780 3,748
Cash and cash equivalents at the
end of the reporting period 5,122 3,924 3,780 3,748 3,823
Prepared on Australian Accounting Standards basis

DVA Additional Estimates Statements
47
Table 3.2.1b: Departmental Comprehensive Income Statement (DVA excluding DSHIS) (Showing Net Cost of Services) (for the period ended 30 June)
Actual Revised Forward Forward Forward
budget estimate estimate estimate
2014-15 2015-16 2016-17 2017-18 2018-19
$'000 $'000 $'000 $'000 $'000
EXPENSE
Employee benefits 187,199 186,633 181,962 179,997 176,566
Supplier expenses 107,318 112,104 106,688 109,634 107,652
Depreciation and amortisation 28,761 27,928 23,315 21,450 21,911
Other expenses 18,045 - - - -
Total expenses 341,323 326,665 311,965 311,081 306,129
LESS:
OWN-SOURCE INCOME
Own-source revenue
Sale of goods and rendering
of services 11,845 11,292 7,930 7,939 2,539
Resources received free of charge 775 770 770 770 770
Total own-source revenue 12,620 12,062 8,700 8,709 3,309
Gains
Other gains 94 - - - -
Total gains 94 - - - -
Total own-source income 12,714 12,062 8,700 8,709 3,309
Net cost of (contribution by) services 328,609 314,603 303,265 302,372 302,820
Revenue from Government 282,986 302,977 280,152 281,124 280,909
Surplus (Deficit) before
income tax (45,623) (11,626) (23,113) (21,248) (21,911)
Continued on next page

DVA Additional Estimates Statements
48
Table 3.2.1b: Departmental Comprehensive Income Statement (DVA excluding DSHIS) (Showing Net Cost of Services) (for the period ended 30 June) (continued)
Actual Revised Forward Forward Forward
budget estimate estimate estimate
2014-15 2015-16 2016-17 2017-18 2018-19
$'000 $'000 $'000 $'000 $'000
Income tax (competitive neutrality) 250 202 202 202 -
Surplus (Deficit) after income tax (45,873) (11,828) (23,315) (21,450) (21,911)
OTHER COMPREHENSIVE INCOME
Changes in assets revaluation
reserve (2,879) - - - -
Total other comprehensive income (2,879) - - - -
Total comprehensive income
attributable to the
Australian Government (48,752) (11,828) (23,315) (21,450) (21,911)
Note: Reconciliation of operating result attributable to agency
2014-15 2015-16 2016-17 2017-18 2018-19
$'000 $'000 $'000 $'000 $'000
Total Comprehensive Income (loss)
Attributable to the
Australian Government (48,752) (11,828) (23,315) (21,450) (21,911)
Plus non-appropriated expenses:
Depreciation and amortisation expenses 28,761 27,928 23,315 21,450 21,911
Total Comprehensive Income
(loss) Attributable to the
agency (19,991) 16,100 - - -
Prepared on Australian Accounting Standards basis

DVA Additional Estimates Statements
49
Table 3.2.2b: Budgeted Departmental Balance Sheet (DVA excluding DSHIS) (as at 30 June) Actual Revised Forward Forward Forward
budget estimate estimate estimate
2014-15 2015-16 2016-17 2017-18 2018-19
$'000 $'000 $'000 $'000 $'000
ASSETS
Financial assets
Cash and cash equivalents 2,710 1,491 1,326 1,323 1,327
Trade and other receivables 3,440 3,440 3,440 3,440 3,440
Appropriation receivables 8,273 5,408 3,563 2,560 640
Investments - - - - -
Total financial assets 14,423 10,339 8,329 7,323 5,407
Non-financial assets
Land and buildings 13,088 7,218 13,378 12,086 17,425
Infrastructure, plant and equipment 3,141 4,191 5,677 7,378 9,083
Intangibles 87,343 78,742 61,502 53,636 38,715
Other non-financial assets 7,866 6,615 6,615 6,615 6,615
Total non-financial assets 111,438 96,766 87,172 79,715 71,838
Total assets 125,861 107,105 95,501 87,038 77,245
LIABILITIES Payables
Supplier payables 16,636 15,648 14,430 13,896 13,201
Other payables 6,786 2,065 2,725 2,724 2,703
Total payables 23,422 17,713 17,155 16,620 15,904
Provisions
Employees provisions 68,032 57,157 55,705 55,234 54,034
Other provisions 5,985 2,485 2,485 2,485 2,485
Total provisions 74,017 59,642 58,190 57,719 56,519
Total liabilities 97,439 77,355 75,345 74,339 72,423
Net assets 28,422 29,750 20,156 12,699 4,822
Equity
Contributed equity 204,047 218,553 232,274 246,267 260,301
Asset revaluation reserve 10,592 10,592 10,592 10,592 10,592
Retained surplus (accumulated deficit) (186,217) (199,395) (222,710) (244,160) (266,071)
Total equity 28,422 29,750 20,156 12,699 4,822
Prepared on Australian Accounting Standards basis

DVA Additional Estimates Statements
50
Table 3.2.3b: Budgeted Departmental Statement of Cash Flows (DVA excluding DSHIS) (for the period ended 30 June) Actual Revised Forward Forward Forward
budget estimate estimate estimate
2014-15 2015-16 2016-17 2017-18 2018-19
$'000 $'000 $'000 $'000 $'000
OPERATING ACTIVITIES
Cash received
Appropriations 292,822 316,408 289,211 289,350 284,652
Sale of goods and services 12,002 12,349 8,651 8,661 2,721
Net GST received 8,451 9,435 9,457 9,587 10,210
Other - - - - -
Total cash received 313,275 338,192 307,319 307,598 297,583
Cash used
Employees 185,540 196,417 183,415 180,468 177,766
Suppliers 117,765 132,226 116,653 119,708 117,990
Other 10,090 12,118 7,416 7,425 1,823
Total cash used 313,395 340,761 307,484 307,601 297,579
Net cash from (used by)
operating activities (120) (2,569) (165) (3) 4
INVESTING ACTIVITIES
Cash received
Proceeds from sales of property,
plant and equipment - 1,350 - - -
Total cash received - 1,350 - - -
Cash used
Purchase of property, plant
and equipment, and intangibles 15,390 14,506 13,721 13,993 14,034
Total cash used 15,390 14,506 13,721 13,993 14,034
Net cash from (used by)
investing activities (15,390) (13,156) (13,721) (13,993) (14,034)
FINANCING ACTIVITIES
Cash received
Contributed equity 16,086 14,506 13,721 13,993 14,034
Total cash received 16,086 14,506 13,721 13,993 14,034
Net cash from (used by)
financing activities 16,086 14,506 13,721 13,993 14,034
Net increase (decrease)
in cash held 576 (1,219) (165) (3) 4
Cash and cash equivalents at the
beginning of the reporting period 2,134 2,710 1,491 1,326 1,323
Cash and cash equivalents at the
end of the reporting period 2,710 1,491 1,326 1,323 1,327
Prepared on Australian Accounting Standards basis

DVA Additional Estimates Statements
51
Table 3.2.1c: Departmental Comprehensive Income Statement (DSHIS) (Showing Net Cost of Services) (for the period ended 30 June) Actual Revised Forward Forward Forward
budget estimate estimate estimate
2014-15 2015-16 2016-17 2017-18 2018-19
$'000 $'000 $'000 $'000 $'000
EXPENSES
Employee benefits 2,996 4,100 4,150 4,200 4,250
Supplier expenses 3,586 3,225 3,275 3,325 3,375
Depreciation and amortisation 75 75 75 75 75
Insurance claims 34,201 29,000 29,500 30,000 30,500
Total expenses 40,858 36,400 37,000 37,600 38,200
LESS:
OWN-SOURCE INCOME
Own-source revenue
Sale of goods and rendering
of services 35,089 35,000 36,000 37,000 38,000
Resources received free of charge 52 55 55 55 55
Other revenue 4,264 4,600 4,700 4,800 4,900
Total own-source revenue 39,405 39,655 40,755 41,855 42,955
Total own-source income 39,405 39,655 40,755 41,855 42,955
Net contribution by services 1,453 (3,255) (3,755) (4,255) (4,755)
Revenue from Government 320 120 120 120 120
Surplus (Deficit) after income tax (1,133) 3,375 3,875 4,375 4,875
Total comprehensive income
attributable to the
Australian Government (1,133) 3,375 3,875 4,375 4,875
Note: Reconciliation of comprehensive income attributable to the agency
2014-15 2015-16 2016-17 2017-18 2018-19
$'000 $'000 $'000 $'000 $'000
Total Comprehensive Income
Attributable to the
Australian Government (1,133) 3,375 3,875 4,375 4,875
Plus non-appropriated expenses:
Depreciation and amortisation expenses 75 75 75 75 75
Total Comprehensive Income
Attributable to the
agency (1,058) 3,450 3,950 4,450 4,950
Prepared on Australian Accounting Standards basis

DVA Additional Estimates Statements
52
Table 3.2.2c: Budgeted Departmental Balance Sheet (DSHIS) (as at 30 June) Actual Revised Forward Forward Forward
budget estimate estimate estimate
2014-15 2015-16 2016-17 2017-18 2018-19
$'000 $'000 $'000 $'000 $'000
ASSETS
Financial assets
Cash and cash equivalents 2,412 2,433 2,454 2,425 2,496
Trade and other receivables 14,686 14,686 14,686 14,686 14,686
Appropriation receivables - - - - -
Investments 54,893 57,893 60,693 63,293 65,593
Total financial assets 71,991 75,012 77,833 80,404 82,775
Non-financial assets
Intangibles 455 380 305 230 155
Other non-financial assets 1,066 1,066 1,066 1,066 1,066
Total non-financial assets 1,521 1,446 1,371 1,296 1,221
Total assets 73,512 76,458 79,204 81,700 83,996
LIABILITIES
Payables
Supplier payables 5,350 5,350 5,350 5,350 5,350
Other payables 21,811 21,811 21,811 21,811 21,811
Total payables 27,161 27,161 27,161 27,161 27,161
Provisions
Other provisions 18,356 17,927 16,798 14,919 12,340
Total provisions 18,356 17,927 16,798 14,919 12,340
Total liabilities 45,517 45,088 43,959 42,080 39,501
Net assets 27,995 31,370 35,245 39,620 44,495
Equity
Contributed equity - - - - -
Asset revaluation reserve - - - - -
Retained surplus 27,995 31,370 35,245 39,620 44,495
Total equity 27,995 31,370 35,245 39,620 44,495
Prepared on Australian Accounting Standards basis

DVA Additional Estimates Statements
53
Table 3.2.3c: Budgeted Departmental Statement of Cash Flows (DSHIS) (for the period ended 30 June) Actual Revised Forward Forward Forward
budget estimate estimate estimate
2014-15 2015-16 2016-17 2017-18 2018-19
$'000 $'000 $'000 $'000 $'000
OPERATING ACTIVITIES
Cash received
Appropriations 320 120 120 120 120
Sales of goods and services 40,948 42,000 43,000 44,000 45,000
Net GST received (73) - - - -
Other 8,933 2,801 2,801 2,801 2,801
Total cash received 50,128 44,921 45,921 46,921 47,921
Cash used
Employees 2,996 3,800 3,900 4,000 4,100
Suppliers 3,143 2,000 2,100 2,200 2,300
Other 41,923 36,100 37,100 38,150 39,150
Total cash used 48,062 41,900 43,100 44,350 45,550
Net cash from (used by)
operating activities 2,066 3,021 2,821 2,571 2,371
INVESTING ACTIVITIES
Cash received
Investments realised 11,935 - - - -
Total cash received 11,935 - - - -
Cash used
Purchase of investments 13,640 3,000 2,800 2,600 2,300
Total cash used 13,640 3,000 2,800 2,600 2,300
Net cash from (used by)
investing activities (1,705) (3,000) (2,800) (2,600) (2,300)
Net increase (decrease)
in cash held 361 21 21 (29) 71
Cash and cash equivalents at the
beginning of the reporting period 2,051 2,412 2,433 2,454 2,425
Cash and cash equivalents at the
end of the reporting period 2,412 2,433 2,454 2,425 2,496
Prepared on Australian Accounting Standards basis

DVA Additional Estimates Statements
54
Table 3.2.4: Departmental Statement of Changes in Equity – Summary of Movement (Budget Year 2015-16)
Retained Asset Contributed Total
earnings revaluation equity/ equity
reserve capital
$'000 $'000 $'000 $'000
Opening balance as at 1 July 2015 (158,222) 10,592 204,047 56,417
Comprehensive income
Comprehensive income attributable to the Australian Government (8,453) - - (8,453)
Total comprehensive income attributable to the Australian Government (8,453) - - (8,453)
Transactions with owners
Distribution to owners:
Other (1,350) - - (1,350)
Contribution by owners:
Appropriation (equity injection) - - 1,189 1,189
Departmental Capital Budget (DCBs) - - 13,317 13,317
Sub-total transactions with owners (1,350) - 14,506 13,156
Estimated closing balance
as at 30 June 2016 (168,025) 10,592 218,553 61,120
Prepared on Australian Accounting Standards

DVA Additional Estimates Statements
55
Table 3.2.5: Capital Budget Statement - Departmental Actual Revised Forward Forward Forward
budget estimate estimate estimate
2014-15 2015-16 2016-17 2017-18 2018-19
$'000 $'000 $'000 $'000 $'000
CAPITAL APPROPRIATIONS
Capital budget - Bill 1 (Departmental Capital Budget) 13,469 13,317 13,308 13,913 14,034
Equity injections - Bill 2 2,617 1,189 413 80 -
Total capital appropriations 16,086 14,506 13,721 13,993 14,034
Total new capital appropriations
Represented by:
Purchase of non-financial assets 16,086 14,506 13,721 13,993 14,034
Total items 16,086 14,506 13,721 13,993 14,034
PURCHASE OF NON-FINANCIAL ASSETS
Funded by capital appropriations 3,317 1,189 413 80 -
Funded by capital appropriations - Departmental Capital Budget1 11,306 13,317 13,308 13,913 14,034
Funded internally from Departmental resources2 767 - - - -
TOTAL 15,390 14,506 13,721 13,993 14,034
RECONCILIATION OF CASH
USED TO ACQUIRE ASSETS
TO ASSET MOVEMENT TABLE
Total purchases 15,390 14,506 13,721 13,993 14,034
less additions by finance lease - - - - -
less additions by creditors / borrowings - - - - -
plus borrowing / finance costs - - - - -
plus Annual finance lease costs - - - - -
less Gifted assets - - - - -
less s32 / restructuring - - - - -
Total cash used to
acquire assets 15,390 14,506 13,721 13,993 14,034
Prepared on Australian Accounting Standards basis
1. Does not include annual finance lease costs. Includes purchases from current and previous years' Departmental
Capital Budgets. 2. Includes the following sources of funding:
– annual and prior year appropriations – section 74 retained revenue receipts – proceeds from the sale of assets.

DVA Additional Estimates Statements
56
Table 3.2.6: Statement of Asset Movements (2015-16)
Land Buildings Other Intangibles L&B IP&E Total
infrastructure, held for plant and sale
equipment
$'000 $'000 $'000 $'000 $'000 $'000
As at 1 July 2015
Gross book value - 18,263 8,279 195,211 1,350 223,103
Accumulated depreciation/
amortisation and impairment - (5,175) (5,138) (107,413) - (117,726)
Opening net book balance - 13,088 3,141 87,798 1,350 105,377
CAPITAL ASSET ADDITIONS
Estimated expenditure on
new or replacement assets
By purchase or internally developed:
Appropriation equity1 - - - 1,189 - 1,189
Appropriation ordinary annual services2 - 1,047 2,700 9,570 - 13,317
Total additions - 1,047 2,700 10,759 - 14,506
Other movements
Depreciation/amortisation expense - (6,917) (1,650) (19,436) - (28,003)
Total depreciation/amortisation - (6,917) (1,650) (19,436) - (28,003)
As at 30 June 2016
Gross book value - 19,310 10,979 205,970 - 236,259
Accumulated depreciation/
amortisation and impairment - (12,092) (6,788) (126,848) - (145,728)
Closing net book balance - 7,218 4,191 79,122 - 90,531
Prepared on Australian Accounting Standards basis
1. "Appropriation equity" refers to equity injections provided through Appropriation Bills (No.2 & 4) 2015-16.
2. “Appropriation ordinary annual services” refers to funding provided through Appropriation Bills (No. 1 & 3) 2015-16 for depreciation / amortisation expenses, DCBs or other operational expenses.
3. Net proceeds may be returned to the OPA.

DVA Additional Estimates Statements
57
Table 3.2.7: Schedule of Budgeted Income and Expenses Administered on Behalf of Government (for the period ended 30 June) Actual Revised Forward Forward Forward
Budget estimate estimate estimate
2014-15 2015-16 2016-17 2017-18 2018-19
$'000 $'000 $'000 $'000 $'000
EXPENSES ADMINISTERED ON
BEHALF OF GOVERNMENT
Employee Benefits 7,137 10,100 10,080 10,050 10,010
Grants 24,456 6,865 6,977 6,990 6,983
Personal benefits 7,694,131 6,340,667 6,174,924 5,934,311 5,751,749
Payments to corporate entities 44,008 44,059 41,630 41,082 41,147
Other 5,568,682 5,194,323 5,129,359 5,073,841 5,019,505
Total expenses
administered on
behalf of government 13,338,414 11,596,014 11,362,970 11,066,274 10,829,394
LESS:
INCOME ADMINISTERED ON
BEHALF OF GOVERNMENT
Revenue
Non-taxation revenue
Other sources of
non-taxation revenue 6,655 18,795 18,795 18,795 18,795
Total non-taxation 6,655 18,795 18,795 18,795 18,795
Total revenues
administered on
behalf of government 6,655 18,795 18,795 18,795 18,795
Net Cost of (contribution by)
services 13,331,759 11,577,219 11,344,175 11,047,479 10,810,599
Surplus (Deficit) (13,331,759) (11,577,219) (11,344,175) (11,047,479) (10,810,599)
Prepared on Australian Accounting Standards basis

DVA Additional Estimates Statements
58
Table 3.2.8: Schedule of Budgeted Assets and Liabilities Administered on Behalf of Government (as at 30 June) Actual Revised Forward Forward Forward
Budget estimate estimate estimate
2014-15 2015-16 2016-17 2017-18 2018-19
$'000 $'000 $'000 $'000 $'000
ASSETS ADMINISTERED ON
BEHALF OF GOVERNMENT
Financial assets
Cash and cash equivalents 46,033 46,033 46,033 46,033 46,033
Other receivables 86,287 86,287 86,287 86,287 86,287
Investments 1,275,195 1,272,481 1,269,949 1,268,327 1,275,864
Total financial assets 1,407,515 1,404,801 1,402,269 1,400,647 1,408,184
Non-financial assets
Other 4,980 4,980 4,980 4,980 4,980
Total non-financial assets 4,980 4,980 4,980 4,980 4,980
Total assets administered
on behalf of government 1,412,495 1,409,781 1,407,249 1,405,627 1,413,164
LIABILITIES ADMINISTERED
ON BEHALF OF GOVERNMENT
Provisions and payables
Other provisions and payables 2,528,256 2,597,581 2,693,320 2,796,546 2,909,006
Personal benefits 5,462,433 5,623,348 5,826,458 6,043,166 6,264,611
Grants payables 990 990 990 990 1,006
Employee provisions 1,880 1,880 1,880 1,880 1,880
Other payables and accrued
expenses 33,251 33,251 33,251 33,251 33,251
Total provisions and payables 8,026,810 8,257,050 8,555,899 8,875,833 9,209,754
Total liabilities administered on
behalf of the government 8,026,810 8,257,050 8,555,899 8,875,833 9,209,754
Prepared on Australian Accounting Standards basis

DVA Additional Estimates Statements
59
Table 3.2.9: Schedule of Budgeted Administered Cash Flows (for the period ended 30 June) Actual Revised Forward Forward Forward
budget estimate estimate estimate
2014-15 2015-16 2016-17 2017-18 2018-19
$'000 $'000 $'000 $'000 $'000
OPERATING ACTIVITIES
Cash received
GST input credit received 47,134 43,512 43,512 43,512 43,512
Other 1,866 18,795 18,795 18,795 18,795
Total cash received 49,000 62,307 62,307 62,307 62,307
Cash used
Personal benefits 6,440,518 6,179,752 5,971,814 5,717,603 5,530,304
Employees 5,756 10,100 10,080 10,050 10,010
Other 5,175,830 5,125,997 5,034,638 4,970,615 4,907,045
Grant payments 24,455 5,866 5,959 6,990 6,967
GST payments to suppliers 49,809 43,512 43,512 43,512 43,512
Payments to Corporate Entities 44,008 44,059 41,630 41,082 41,147
Total cash used 11,740,376 11,409,286 11,107,633 10,789,852 10,538,985
Net cash from (used by)
operating activities (11,691,376) (11,346,979) (11,045,326) (10,727,545) (10,476,678)
INVESTING ACTIVITIES
Cash used
Payments to Corporate Entities 12,762 7,472 7,168 7,493 7,537
Purchase of property, plant and equipment 4,980 - - - -
Total cash used 17,742 7,472 7,168 7,493 7,537
Net cash from (used) by
investing activities (17,742) (7,472) (7,168) (7,493) (7,537)
Net increase/decrease in cash held (11,709,118) (11,354,451) (11,052,494) (10,735,038) (10,484,215)
Cash and cash equivalents at beginning of reporting period 52,817 46,033 46,033 46,033 46,033
Cash from Official Public Account 11,720,535 11,363,922 11,061,965 10,744,509 10,493,767
Cash to Official Public Account (18,201) (9,471) (9,471) (9,471) (9,552)
Cash and cash equivalents
at end of reporting period 46,033 46,033 46,033 46,033 46,033
Prepared on Australian Accounting Standards basis

DVA Additional Estimates Statements
60
Table 3.2.10: Capital Budget Statement - Administered Actual Revised Forward Forward Forward
budget estimate estimate estimate
2014-15 2015-16 2016-17 2017-18 2018-19
$'000 $'000 $'000 $'000 $'000
CAPITAL APPROPRIATIONS
Administered Assets and Liabilities - Bill 2 6,061 - - - -
Total capital appropriations 6,061 - - - -
Total new capital appropriations
Represented by:
Purchase of non-financial assets 6,061 - - - -
Total items 6,061 - - - -
PURCHASE OF NON-FINANCIAL ASSETS
Funded by capital appropriations 4,980 - - - -
TOTAL 4,980 - - - -
Prepared on Australian Accounting Standards basis

Glossary
61
GLOSSARY
Accrual accounting System of accounting where items are brought to account and included in the financial statements as they are earned or incurred, rather than as they are received or paid.
Accumulated depreciation The aggregate depreciation recorded for a particular depreciating asset.
Additional estimates Where amounts appropriated at Budget time are insufficient, Parliament may appropriate more funds to portfolios through the Additional Estimates Acts.
Administered items Expenses, revenues, assets or liabilities managed by agencies on behalf of the Commonwealth. Agencies do not control administered items. Administered expenses include grants, subsidies and benefits. In many cases, administered expenses fund the delivery of third party outputs.
AEIFRS Australian Equivalents to International Financial Reporting Standards, which were issued by the Australian Accounting Standards Board in July 2004.
Appropriation An authorisation by Parliament to spend moneys from the Consolidated Revenue Fund for a particular purpose.
Annual Appropriation Acts of Parliament, which provide appropriation for the government’s activities during a specific financial year. Three appropriation Bills are introduced into Parliament in May and comprise the Budget. Further supplementary Bills are introduced later in the financial year as part of the Additional Estimates process. The Parliamentary departments have their own appropriation Bills.
Capital expenditure Expenditure by an agency on capital projects, for example purchasing a building.
Consolidated Revenue Fund Section 81 of the Constitution stipulates that all revenue raised or money received by the Commonwealth forms the one consolidated revenue fund (CRF). The CRF is not a bank account. The Official Public Account reflects most of the operations of the CRF.

Glossary
62
Departmental items Assets, liabilities, revenues and expenses that are controlled by the agency to produce outputs. Departmental items would generally include computers, plant and equipment assets used by agencies in providing goods and services, and most employee expenses, supplier costs and other administrative expenses incurred.
Depreciation Apportionment of an asset’s capital value as an expense over its estimated useful life to take account of normal usage, obsolescence, or the passage of time.
Effectiveness indicators Indicators to assess the degree of success in achieving outcomes. As outcomes are generally long-term in nature, effectiveness indicators often relate to intermediate outcomes (shorter term impacts) below the planned outcomes specified.
Efficiency indicators Measures the adequacy of an agency’s management of its outputs and, where applicable, administered items. Includes price, quality and quantity indicators. The interrelationship between the three efficiency indicators of any one output should be considered when judging efficiency.
Equity or net assets Residual interest in the assets of an entity after deduction of its liabilities.
Expense Expenses represent the full costs of an activity, that is, the total value of all the resources consumed in producing goods and services or the loss of future economic benefits in the form of reductions in assets or increases in liabilities of the entity. Expenses include cash items, such as salary payments, as well as expenses that have been incurred, such as accruing employee entitlements that will be paid in the future.
Fair value Valuation methodology: The amount for which an asset could be exchanged or a liability settled between knowledgeable, willing parties in an arm’s length transaction. Australian Government entities will move to this method incrementally by 30 June 2006 for valuing most infrastructure, plant and equipment.
Intermediate outcomes More specific medium-term impacts (eg trend data, targets or milestones) below the level of the planned outcomes specified in the Budget. A combination of several intermediate outcomes can at times be considered as a proxy for determining the achievement of outcomes or progress towards outcomes. See Outcomes.

Glossary
63
Operating result Equals revenue less expenses.
Outcomes The government’s objectives in each portfolio area. Outcomes are desired results, impacts or consequences for the Australian community as influenced by the actions of the Australian Government. Actual outcomes are assessments of the end results or impacts actually achieved.
Output groups A logical aggregation of agency outputs, where useful, and based either on homogeneity, type of product, business line or beneficiary target group. Aggregation of outputs may also be needed for the provision of adequate information for performance monitoring, or based on a materiality test.
Outputs The goods and services produced by agencies on behalf of government for external organisations or individuals. Outputs also include goods and services for other areas of government external to the agency.
Price One of the three key efficiency indicators. The amount the government or the community pays for the delivery of agreed outputs.
Quality One of the three key efficiency indicators. Relates to the characteristics by which customers or stakeholders judge an organisation, product or service. Assessment of quality involves use of information gathered from interested parties to identify differences between users’ expectations and experiences.
Quantity One of the three key efficiency indicators. Examples include the size of an output; count or volume measures; how many or how much.
Revenue Total value of resources earned or received to cover the production of goods and services.

Glossary
64
Special Account Balances existing within the Consolidated Revenue Fund (CRF) that are supported by standing appropriations (Financial Management and Accountability Act 1997, ss. 20
and 21). Special accounts allow money in the CRF to be acknowledged as set aside (hypothecated) for a particular purpose. Amounts credited to a Special Account may only be spent for the purposes of the Special Account. Special accounts can only be established by a written determination of the Finance Minister (s. 20 FMA Act) or through an Act of Parliament (referred to in s. 21 of the FMA Act).
Special Appropriations (including Standing Appropriations)
An amount of money appropriated by a particular Act of Parliament for a specific purpose and number of years. For special appropriations, the authority to withdraw funds from the Consolidated Revenue Fund does not generally cease at the end of the financial year.
Standing appropriations are a subcategory consisting of ongoing special appropriations — the amount appropriated will depend on circumstances specified in the legislation.


