Highlights Real Estate Analytics Suite ► FTP bulk data download ► Timely Reporting ► Customizable Graphs ► Interactive maps MARKETTRENDS HIGHLIGHTS Derived from multiple CoreLogic data sources including public record, servicing and securities data, MarketTrends exposes the underlying market health at any geographic level. Historical data available for most fields from 2000 to present. ► Available by subscription ► Frequency: Monthly ► Coverage (varies by data field): ♦ 50 States ♦ 3,100+ Counties ♦ 900+ CBSA ♦ 37,000+ Zip Codes PORTFOLIO ANALYSIS MarketTrends CoreLogic® Real Estate Analytic Suite The MarketTrends solution is the industry’s only monthly neighborhood data report on home sales, market distress and mortgage performance. Every month CoreLogic combines zip-code level public recordings of home sales, prices, foreclosure filings with mortgage performance into a single dataset that provides a unique monthly snapshot of MarketTrends that can be used to identify potential markets for expansion, valuation trends, performance analysis, and benchmarking. CALIFORNIA: SHORT SALES BY COUNTY < 3.0% % of Short Sales by County 3.0% – 7.0% 7.0% – 10.0% 10.0% – 15.0% > 15.0% • Los Angeles San Diego San Jose San Francisco Fresno Sacramento Santa Ana Bakersfield Stockton Chula Vista CoreLogic is the nation’s largest provider of advanced property and ownership information, analytics, and solutions. CoreLogic obtains property records from county recorders offices across the nation and mortgage performance information from its Securities and Servicing databases, which contain data on over 45 million loans that cover over 85% of all outstanding mortgage loans. The data is captured monthly at the zip code level then aggregated to County, CBSA, and State levels for comprehensive U.S. coverage.
Transcript
Highlights
Real Estate Analytics Suite
► FTP bulk data download
► Timely Reporting
► Customizable Graphs
► Interactive maps
MARKETTRENDS HIGHLIGHTS
Derived from multiple CoreLogic data sources including public record, servicing and securities data, MarketTrends exposes the underlying market health at any geographic level.
Historical data available for most fi elds from 2000 to present.
► Available by subscription
► Frequency: Monthly
► Coverage (varies by data fi eld): ♦ 50 States ♦ 3,100+ Counties ♦ 900+ CBSA ♦ 37,000+ Zip Codes
PORTFOLIO ANALYSISMarketTrends
CoreLogic® Real Estate Analytic Suite
The MarketTrends solution is the industry’s only monthly neighborhood data report on home sales, market distress and mortgage performance.
Every month CoreLogic combines zip-code level public recordings of home sales, prices, foreclosure fi lings with mortgage performance into a single dataset that provides a unique monthly snapshot of MarketTrends that can be used to identify potential markets for expansion, valuation trends, performance analysis, and benchmarking.
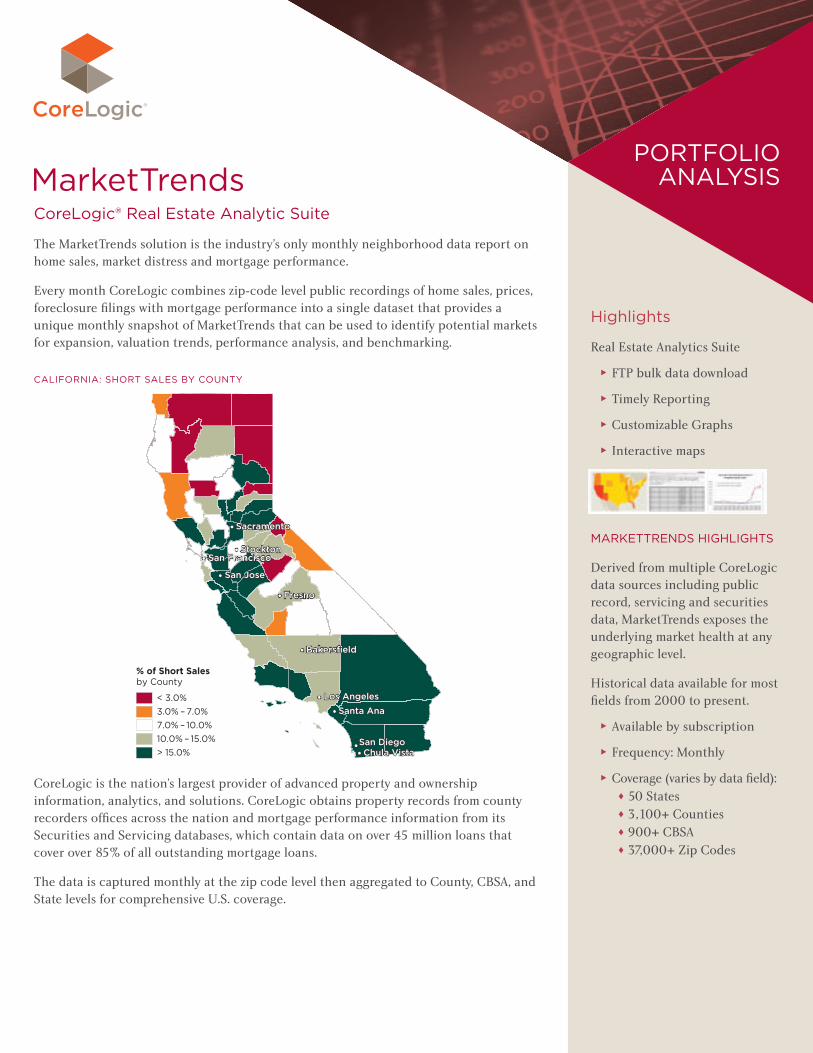
CALIFORNIA: SHORT SALES BY COUNTY
< 3.0%
% of Short Salesby County
3.0% – 7.0%7.0% – 10.0%10.0% – 15.0%> 15.0%
•
Los Angeles
San Diego
San Jose
San Francisco
Fresno
Sacramento
Santa Ana
Bakersfield
Stockton
Chula Vista
CoreLogic is the nation’s largest provider of advanced property and ownership information, analytics, and solutions. CoreLogic obtains property records from county recorders offi ces across the nation and mortgage performance information from its Securities and Servicing databases, which contain data on over 45 million loans that cover over 85% of all outstanding mortgage loans.
The data is captured monthly at the zip code level then aggregated to County, CBSA, and State levels for comprehensive U.S. coverage.
CORELOGIC and the CoreLogic logo are trademarks of CoreLogic, Inc. and/or its subsidiaries.
1-REASMT-0215-04
REAL ESTATE ANALYTIC SUITE – MARKETTRENDS
The CoreLogic Real Estate Analytic Suite – MarketTrends solution delivers the most comprehensive early view of current real estate market health trends, a critical factor in determining investment risks. Whatever your role, success in the real estate market space requires greater insight to market health and fl exibility when hedging positions, rebalancing portfolios, or speculating on movements in the real estate market.
Identify and Assess Real Estate Risk
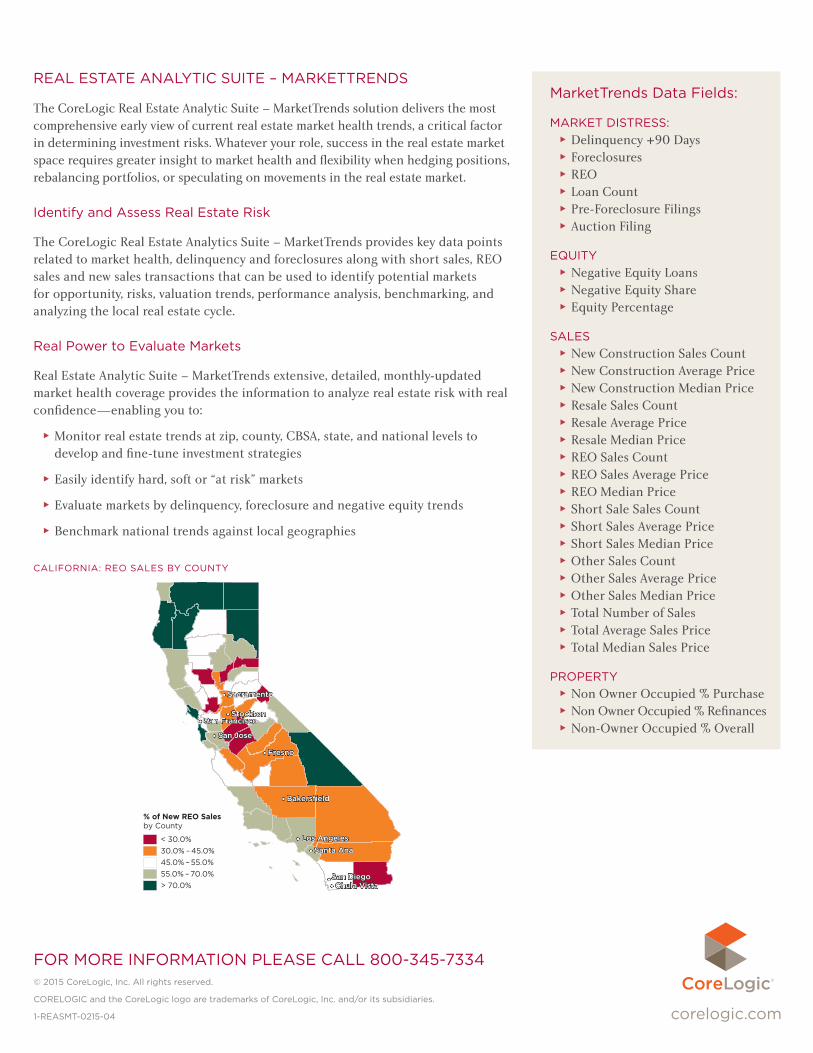
The CoreLogic Real Estate Analytics Suite – MarketTrends provides key data points related to market health, delinquency and foreclosures along with short sales, REO sales and new sales transactions that can be used to identify potential markets for opportunity, risks, valuation trends, performance analysis, benchmarking, and analyzing the local real estate cycle.
Real Power to Evaluate Markets
Real Estate Analytic Suite – MarketTrends extensive, detailed, monthly-updated market health coverage provides the information to analyze real estate risk with real confi dence—enabling you to:
► Monitor real estate trends at zip, county, CBSA, state, and national levels to develop and fi ne-tune investment strategies
► Easily identify hard, soft or “at risk” markets
► Evaluate markets by delinquency, foreclosure and negative equity trends
► Benchmark national trends against local geographies
SALES ► New Construction Sales Count ► New Construction Average Price ► New Construction Median Price ► Resale Sales Count ► Resale Average Price ► Resale Median Price ► REO Sales Count ► REO Sales Average Price ► REO Median Price ► Short Sale Sales Count ► Short Sales Average Price ► Short Sales Median Price ► Other Sales Count ► Other Sales Average Price ► Other Sales Median Price ► Total Number of Sales ► Total Average Sales Price ► Total Median Sales Price
PROPERTY ► Non Owner Occupied % Purchase ► Non Owner Occupied % Refi nances ► Non-Owner Occupied % Overall