i (This paper was originally published in Japanese in the Bank of Japan Monthly Bulletin, November 1999 issue). Portfolio Selection of Financial Assets by Japan’s Households + -- Why Are Japan’s Households Reluctant to Invest in Risky Assets? -- August 2000 Shinobu Nakagawa * Bank of Japan Tomoko Shimizu ** Bank of Japan + The opinions presented herein are the personal views of the authors, and do not represent the official opinion of the Bank of Japan or of the Research and Statistics Department. * Economic Research Division, Research and Statistics Department (Now: studying at University of California, San Diego), Bank of Japan. ** Economic Research Division, Research and Statistics Department (Now: Budget Division, Budget and Management Office), Bank of Japan. E-mail: [email protected]
Transcript
i
(This paper was originally published in Japanese in the Bank of Japan Monthly Bulletin,November 1999 issue).
Portfolio Selection of Financial Assets byJapan’s Households +
-- Why Are Japan’s Households Reluctant to Invest in Risky Assets? --
August 2000
Shinobu Nakagawa*
Bank of Japan
Tomoko Shimizu**
Bank of Japan
+ The opinions presented herein are the personal views of the authors, and do not represent the official opinionof the Bank of Japan or of the Research and Statistics Department.
* Economic Research Division, Research and Statistics Department (Now: studying at University of California,San Diego), Bank of Japan.** Economic Research Division, Research and Statistics Department (Now: Budget Division, Budget andManagement Office), Bank of Japan. E-mail: [email protected]
ii
[Abstract]
1. The breakdown of financial assets held by Japan’s households shows that the ratio of
safe assets, such as deposits, has been around 60 percent since the middle of the 1970s,
while that of risky assets, such as stocks, increased temporarily to above 20 percent at the
end of “bubble” era. It, however, has been substantially below 10 percent level since the
middle of 1990s.
2. Although the opinion that the percentage of risky assets would start to rise prevailed
in the early 1990s in accordance with developments in financial liberalization, this has
not been the case. This paper employs various survey data regarding households,
including the Family Savings Survey (Management and Coordination Agency), as well as
the Public Opinion Survey on Household Savings and Consumption (Central Council for
Savings Information), to analyze why Japan’s households are reluctant to invest in risky
assets. We investigate in greater detail by comparing the current situation with the period
before the 1990s, including the “bubble” era in Japan (focusing on “change”), and with
the United States (focusing on “level”).
3. First, the household’s portfolio selection model is estimated employing the change in
percentage of each financial asset as dependent variable, and indexes of return on each
asset and annual income as independent variables. The results show that in the 1990s,
deteriorating return on risky assets and the increase in precautionary demand for safe
assets due to uncertainties about income have been the main factors that make
households more reluctant to invest in risky assets (“shunting to safe assets”) than they
were before the 1990s.
4. Next, international comparison of risky assets held by households shows that this
ratio is substantially lower in Japan. To analyze in detail the reasons, we compare the
selection criteria for savings of Japan’s households with the United States based on
survey data. The survey result indicates that Japan’s households attach importance to
“profitability” of financial assets only half as much as those in the United States, while
they put more importance on its “safety” and “liquidity.” In addition, we calculate the
degree of relative risk aversion in both Japan and the United States using Capital Asset
Pricing Model (CAPM). The result also shows that Japan’s households are two or three
times as risk averse as those in the United States. These facts imply that the reason why
iii
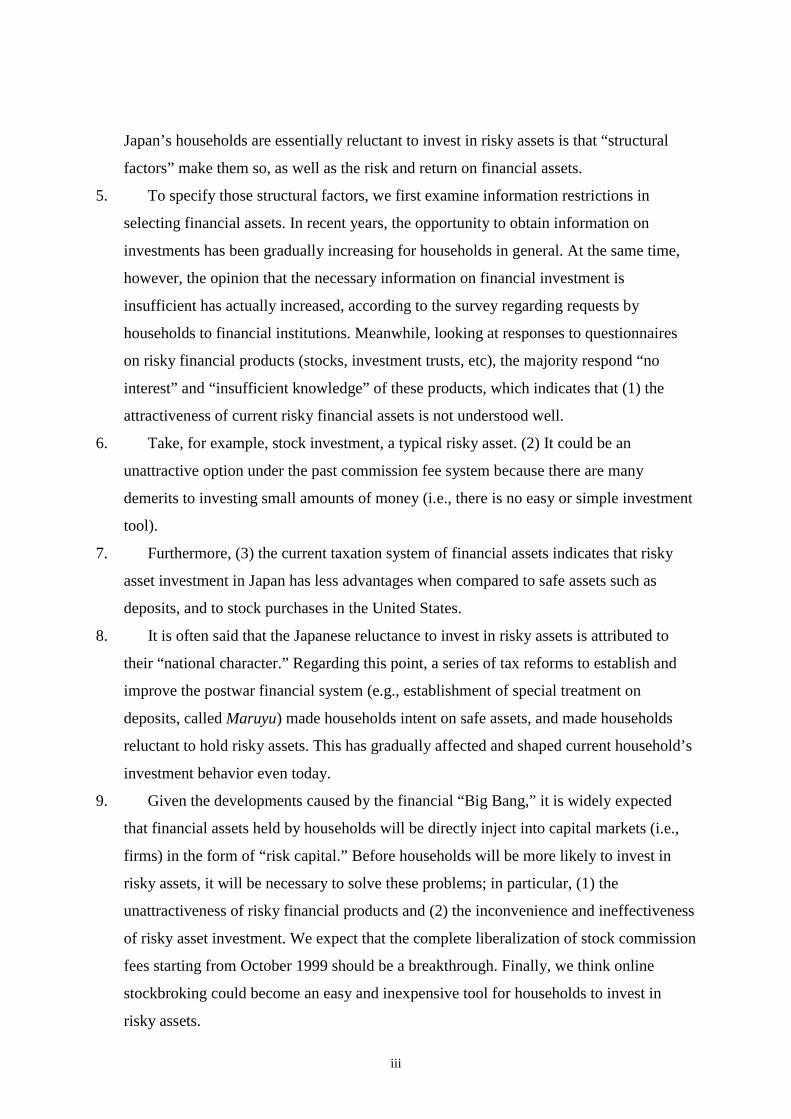
Japan’s households are essentially reluctant to invest in risky assets is that “structural
factors” make them so, as well as the risk and return on financial assets.
5. To specify those structural factors, we first examine information restrictions in
selecting financial assets. In recent years, the opportunity to obtain information on
investments has been gradually increasing for households in general. At the same time,
however, the opinion that the necessary information on financial investment is
insufficient has actually increased, according to the survey regarding requests by
households to financial institutions. Meanwhile, looking at responses to questionnaires
on risky financial products (stocks, investment trusts, etc), the majority respond “no
interest” and “insufficient knowledge” of these products, which indicates that (1) the
attractiveness of current risky financial assets is not understood well.
6. Take, for example, stock investment, a typical risky asset. (2) It could be an
unattractive option under the past commission fee system because there are many
demerits to investing small amounts of money (i.e., there is no easy or simple investment
tool).
7. Furthermore, (3) the current taxation system of financial assets indicates that risky
asset investment in Japan has less advantages when compared to safe assets such as
deposits, and to stock purchases in the United States.
8. It is often said that the Japanese reluctance to invest in risky assets is attributed to
their “national character.” Regarding this point, a series of tax reforms to establish and
improve the postwar financial system (e.g., establishment of special treatment on
deposits, called Maruyu) made households intent on safe assets, and made households
reluctant to hold risky assets. This has gradually affected and shaped current household’s
investment behavior even today.
9. Given the developments caused by the financial “Big Bang,” it is widely expected
that financial assets held by households will be directly inject into capital markets (i.e.,
firms) in the form of “risk capital.” Before households will be more likely to invest in
risky assets, it will be necessary to solve these problems; in particular, (1) the
unattractiveness of risky financial products and (2) the inconvenience and ineffectiveness
of risky asset investment. We expect that the complete liberalization of stock commission
fees starting from October 1999 should be a breakthrough. Finally, we think online
stockbroking could become an easy and inexpensive tool for households to invest in
risky assets.
1
1. Introduction
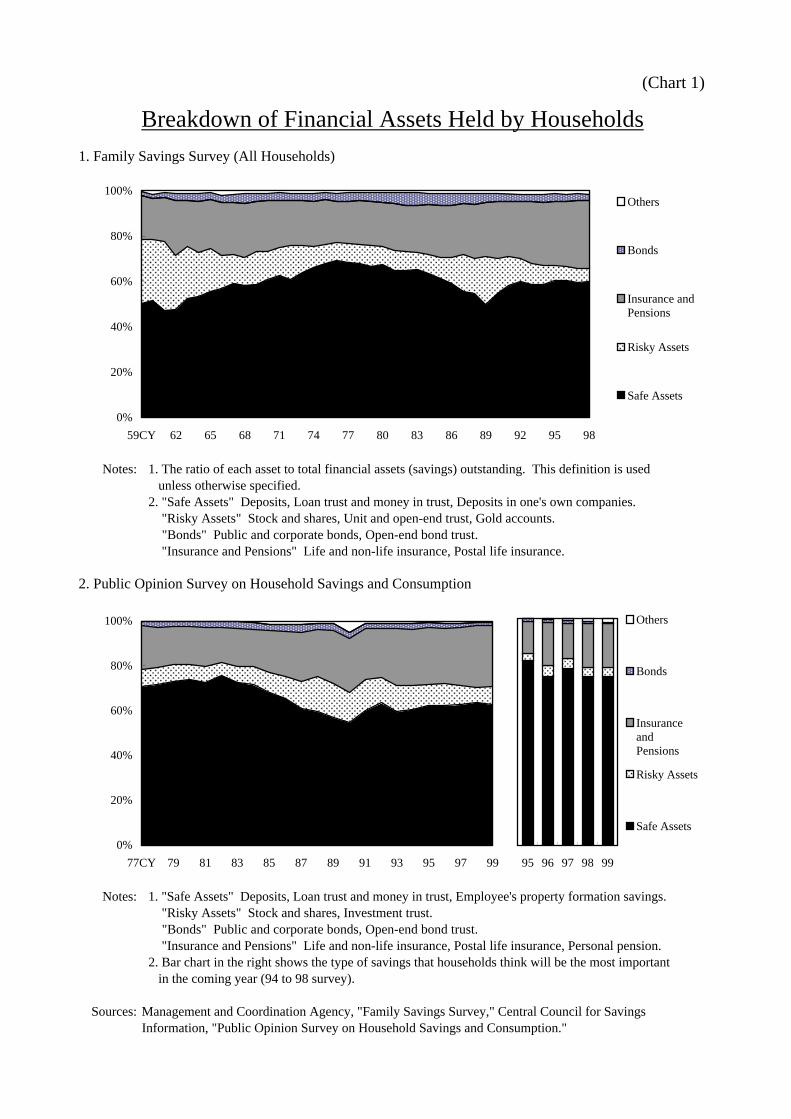
According to the Family Savings Survey by the Management and Coordination Agency
(Chart 1-1), the breakdown of financial assets held by Japan’s households shows that the ratio
of safe assets, such as deposits, has been around 60 percent since the middle of the 1970s,
when Japan became a mature economy. The ratio of risky assets, such as stocks, increased
temporarily to top 20 percent at the end of “bubble” era, but it has been substantially below
the 10 percent level since the middle of the 1990s1. The Public Opinion Survey on Household
Savings and Consumption by the Central Council for Savings Information shows similar
results. It shows that the ratio of risky assets rose temporarily in the “bubble” era, but it has
been decreasing since then.
The environment surrounding risky asset investment has improved gradually in the 1990s
in accordance with developments in financial liberalization2. Although in the early 1990s it
seemed that the Japanese people’s portfolio selection behavior would become more
diversified and the percentage of risky assets would increase, this has not been the case3.
This paper employs various survey data regarding households to analyze why Japanese
households are reluctant to invest in risky assets even in the 1990s. In doing so, we
investigate in greater detail by comparing the current situation to the period before the 1990s,
which includes the “bubble” era in Japan (focusing on “change”), and to the United States
(focusing on “level”).
2. Determinants of A Household’s Portfolio Selection Behavior
– Focusing on Risky Assets –
2-1. Relationship between Return on Assets and Portfolio Selection
It is generally said that people invest in financial assets that have a relatively high utility.
This utility is determined by a combination of risk and return. In other words, for example,
1 As far as bonds are concerned, we define it as another type of asset not safe or risky in this paper. For example,if it is sold prematurely, capital losses could arise. On the other hand, it could also be defined as a safe assetbecause the possibility of government default is negligible.2 Take the example of investment trust improvements; (1) increase in sales windows, (2) change in mutual fundbusiness from license to authorization, (3) introduction of corporation and privately floating investment trusts.In addition, the revised foreign exchange law in April 1998 enabled Japanese to open deposit accounts inforeign banks and purchase foreign stocks directly.3 In the Public Opinion Survey on Household Savings and Consumption, respondents are asked what kind ofinvestments they think will be the most important in the coming year (Chart 1-2). The response “risky asset” hasbeen about 3 to 5 percent in recent years, which means that there has been no clear change in households’negative attitude toward risky assets.
2
when households “judge” that the return on stocks (a risky asset) exceeds deposit rate (a safe
asset) even taking into account the risk involved, they purchase the stocks.
In Chart 1-1, we observe that (1) investment in risky assets was relatively common until
the early 1970s. For example, the ratio of risky assets held by households exceeded 30
percent in some periods. Furthermore, (2) the ratio of risky assets increased temporarily in the
“bubble” era of late 1980s. However, (3) households became reluctant to invest in risky
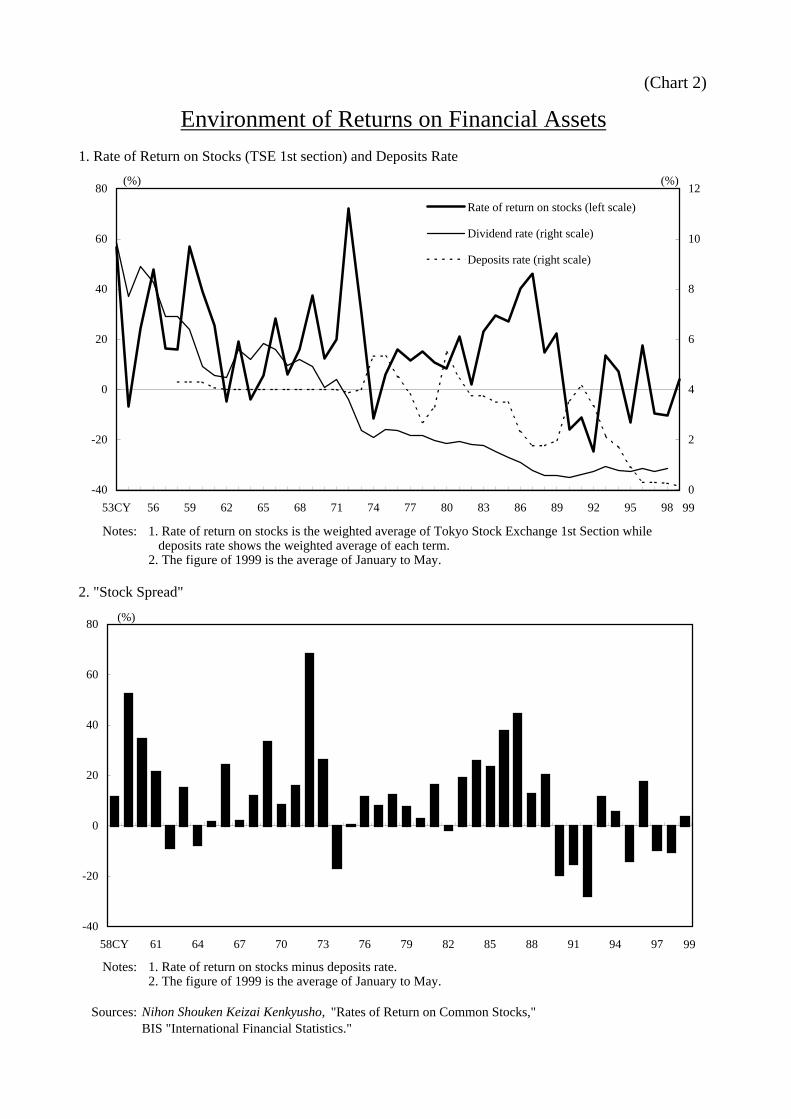
assets in the 1990s. To explain these movements, we first focus on developments in the return
on assets (Chart 2). First, (1) in the 1950s and 1960s, stock prices rose (large amounts of
capital gains were realized) in accordance with high economic growth in Japan, while deposit
rates remained around 4 percent, which indicates that stock investment had relative
advantages during those periods4. Second, (2) a sharp increase in stock prices while deposit
rates remained with relatively low made stock investment more attractive in the “bubble” era.
Finally, (3) the stagnation and highly volatile movement (risky motion) of stock prices in the
1990s made stock investment less attractive in most periods5.
2-2. Risky Assets Selection by Household Characteristics
– Micro Data Analysis –
We should investigate factors other than return and risk on assets when trying to
understand determinants of a household’s selection behavior. We employ the Public Opinion
Survey on Household Savings and Consumption6 to analyze the impact of household
characteristics and the life environment surrounding households (e.g., annual income level,
age, family member, occupation, residence area, home ownership, anxiety about post-
retirement (or future)) on their asset selection. This behavior is analyzed using the Tobit
model. The Tobit model estimates and tests how each respondent’s characteristics and life
environment affects the response to the question (“whether to have or not to have risky assets,
4 In addition, since stock was usually issued at par value in the 1950s and 1960s, stock holders in particularcould purchase stocks at a price that was even lower than the market price. In the 1970s, the type of stockissuance abruptly changed into that of market price issuance. This change also had a significant impact on thedecline in the ratio of risky assets in the early 1970s in Chart 1-1.5 Some “costs” should be considered in stock investment; price change risk, commission fees and taxdisincentives (compared with deposits). So we should bear in mind that there is a slight upper bias in the stockspread in Chart 2-2. In other words, even if we consider the “effective” rate that includes these costs, investmentin safe assets, such as deposits, has been substantially more advantageous in the 1990s.6 The data was processed and analyzed with the cooperation of the Central Council for Savings Information.
3
and if have, then how much of total financial assets?7”). Please refer to Appendix 1 at the end
of the paper for the details of the Tobit model.
We analyze each household’s asset selection behavior in 1991 and 1999 using the Tobit
RW: Ratio of risky assets to total financial assets (percent, if nothing, then zero) YA: Annual income (10,000 yen) HE: Home ownership status (0: non-homeowner, 1: homeowner) AR: Residence area (1: major city, 2: city with at least 40,000 households, 3: city with at least 20,000 but less
than 40,000 households, 4: city with at least 10,000 but less than 20,000 households, 5:city with less than 10,000 households, 6: town, village, or county area)
NF: Family member (2, 3, 4, 5, 6, 7 or more) SV: Evaluation of savings outstanding (0: not enough, 1: enough) UC: Degree of anxiety about post-retirement (or future) (0: not worried so much, 1: more or less worried, 2:
worry a lot) DAj: Age dummy (j=1.20s, 2.60 or older) DOj: Occupation dummy (j=1.Agricultural, forestry and fisheries workers, 2.Merchants and Private
The estimation results in 1999 presented in the following table (left) show that the person
who (1) earns a high annual income (YA), (2) has less family members (NF), (3) doesn’t
worry about post-retirement (or future) (UC) and (4) is an office worker (DO3) and in an
administrative post (DO5), tends to hold more risky assets. These factors (1) to (4) are all
closely related to income, so we conclude that the person who is thought to be less anxious
about current and future income is likely to be a risky asset investor9. Moreover, the person
who (5) is a homeowner (HE) and (6) lives in a big city (AR) also has a relatively large
amount of risky assets10. In the meantime, (7) age (DA1, DA2) is not a significant factor in
determining willingness to invest in risky assets11.
7 If binary response (“whether just to have or not to have”) is handled, the probit (logit) model is used.8 For the sake of comparison to “bubble” era, we also estimate the model using data in 1991. Although we knowthat the data in 1989 or 1990 is essentially used as its better proxy, we substitute the data in 1991 in view of theconsistency with current questionnaire styles.9 The more family members, the larger the amount of educational expenses needed in general, and the strongerhe or she feels anxiety about income.10 Homeowners tend to hold a relatively large amount of risky assets. If this is true, then non-homeowners investtheir money in safe assets, such as deposits, in order to prepare for downpayments on their home. We actuallyobtain the empirically significant result that the person who is now a non-homeowner but has the intention to
4
On the other hand, the estimation for 1991 presented in the following table (right) show
almost the same results as 1999, which implies that the relationship described herein has
Notes:1. Estimated using the maximum likelihood method (censored regression). Data are for the person who has savings.2. Figures in parentheses show the z value (the asymptotic t value). Figures in brackets show the p value (the possibility of
each parameter being zero).3. The shadowed areas have a significance level of 5 percent.
Next, we examine the investment attitude about risky assets in the future using the Probit
model. Concretely, the dependent variable in the estimation formula of the Tobit model is
become a homeowner is not likely to hold risky assets (Results are omitted). We also describe briefly infootnotes 12 and 18, respectively, the relationship between homeownership status (i.e., real assets) andhousehold selection of financial assets as well as what households think real assets are (i.e., risky or safe ones).11 Based on the Family Savings Survey (Chart 3), the breakdown of financial assets held by the age of the headof household shows that there is no clear difference in the ratio of risky assets in general. But if we look in detail,the elderly (60 or older) have a relatively larger amount of safe assets. To examine why the elderly are likely tohold safe assets, we cite the survey data on savings behavior and the explanation given by the elderly for theirneed for savings (Chart 4). In this survey, the elderly report an insufficiency of current savings outstandingdespite having a large amount of savings. Many of the elderly cite the risk of requiring nursing care. In otherwords, the elderly put importance on “safety” and “liquidity” of assets in order to prepare for the expensive costof nursing care. See Nakagawa (1999) for greater detail on this point.12 Residential land prices fell by about 18 percent from the first half of 1991 FY to the second half of 1998 FY.If homeowners had become less inclined to invest in risky assets because of the decline in the value of their realassets, then the parameters regarding homeownership status (HE) should have been different in 1991 and 1999.But the parameter conditions are almost the same, which implies that there is no clear relationship between thedecline in the value of real assets and a household’s selection of financial assets in the 1990s.
5
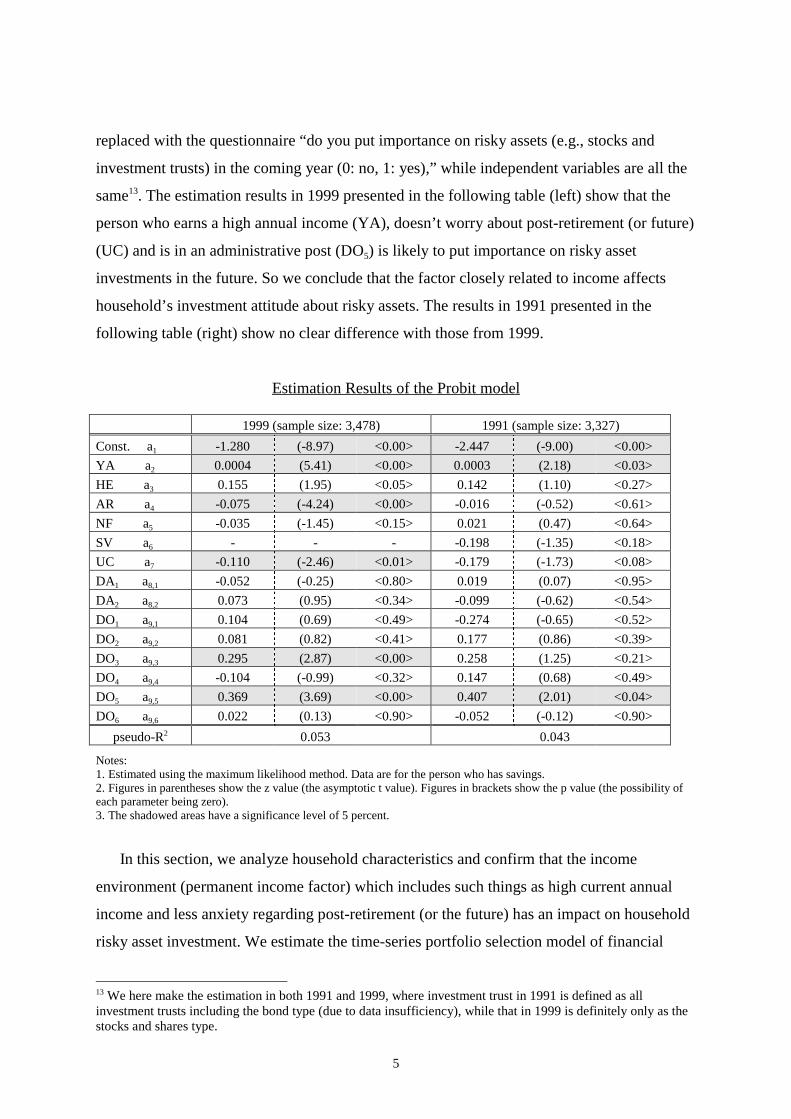
replaced with the questionnaire “do you put importance on risky assets (e.g., stocks and
investment trusts) in the coming year (0: no, 1: yes),” while independent variables are all the
same13. The estimation results in 1999 presented in the following table (left) show that the
person who earns a high annual income (YA), doesn’t worry about post-retirement (or future)
(UC) and is in an administrative post (DO5) is likely to put importance on risky asset
investments in the future. So we conclude that the factor closely related to income affects
household’s investment attitude about risky assets. The results in 1991 presented in the
following table (right) show no clear difference with those from 1999.
Notes:1. Estimated using the maximum likelihood method. Data are for the person who has savings.2. Figures in parentheses show the z value (the asymptotic t value). Figures in brackets show the p value (the possibility ofeach parameter being zero).3. The shadowed areas have a significance level of 5 percent.
In this section, we analyze household characteristics and confirm that the income
environment (permanent income factor) which includes such things as high current annual
income and less anxiety regarding post-retirement (or the future) has an impact on household
risky asset investment. We estimate the time-series portfolio selection model of financial
13 We here make the estimation in both 1991 and 1999, where investment trust in 1991 is defined as allinvestment trusts including the bond type (due to data insufficiency), while that in 1999 is definitely only as thestocks and shares type.
6
assets in the next section using the return on assets and income as independent variables. This
estimation analyzes empirically the factors that explain the movement (or change) in a
household’s investment behavior.
2-3. Estimation of Portfolio Selection Model and Its Implications
We here estimate the household’s portfolio selection model using the change in the ratio
of each financial asset (safe assets, risky assets and bonds) from the previous year as the
dependent variable. Independent variables are return on and risk of assets, change rate in
annual income, ratio of the elderly (60 or older) and expected inflation rate, respectively14.
AWi : Ratio of each financial asset (i: safe assets, risky assets, bonds) rj : Nominal rate of return on asset (j: f. deposits, m. stocks, b. bonds) volrm: Standard deviation of rate of return on stocks in each year (calculated by monthly data) DY: Change rate in annual income AG60: Ratio of the elderly (60 or older) DP: Change rate in private final consumption deflator
The estimation results presented in the following table15 show that as for rate of return on
each asset, (1) the increase in deposit rate (rf) and rate of return on stocks (rm) works
significantly to increase the ratio of safe assets and risky assets respectively. Conversely, (2)
the increase in deposit rate (rf) and rate of return on stocks (rm) leads to a decline in the ratio
of risky assets and safe assets respectively. In addition, (3) the increase in the volatility of
return on stocks (volrm) urges the money to shift to safe assets from risky assets, and (4)
improvements in income environment (DY) stimulate investment in the risky assets16. In the
meantime, (5) age (AG60) has no significant impact on risky asset investment as described in
section 2-2, while the expected inflation rate assuming adaptive expectation (DP-1) is another
insignificant factor in determining household selection of financial assets.
14 The basic framework of the model is in Brainard and Tobin (1969) and Saito and Oshika (1979). We add theexpected inflation rate to the independent variables since we think that fixed investment (e.g., term deposits andbond investment) becomes relatively less advantageous as inflation expectations arise.15 It is generally said in this kind of model that the error term in each financial asset equation affects the others.To solve this problem, we also estimate the system using the Seemingly Unrelated Regression (SUR), but theresults are almost the same as the ones by OLS.
7
Estimation Results of Portfolio Selection Model
const.
b0
rf
b1f
rm
b1m
rb
b1b
volrm
b2
DY
b3
AG60
b4
DP-1
b5
adjR2
S.E.
D.W.
Safe Assets 2.20
(0.6)
1.34
(2.7)
-0.06
(-3.1)
-0.73
(-2.3)
0.47
(2.6)
-0.05
(-0.8)
0.16
(1.5)
0.06
(0.6)
0.38
1.75
1.91
Risky Assets -1.31
(-0.3)
-0.57
(-1.1)
0.08
(3.9)
0.05
(0.2)
-0.30
(-1.6)
0.11
(1.7)
0.11
(0.9)
-0.03
(-0.3)
0.40
1.87
2.33
(reference)
Bonds
-1.02
(-1.3)
-0.05
(-0.4)
-0.004
(-0.9)
0.18
(2.6)
-0.11
(-2.6)
0.003
(0.2)
0.03
(1.3)
-0.02
(-0.7)
0.24
0.40
2.20
Notes:
1. Figures in parentheses show the t value. S.E. shows the standard error of regression. D.W. is Durbin-Watson statistics.
2. The shadowed areas have a significance level of 10 percent.
We confirm in this section that the movement (or change) in a household’s risky asset
investment is mainly explained by the environment created by return on assets and income
conditions. Especially in the 1990s, households became more reluctant to invest in risky
assets mainly because of the deterioration of the return on assets (e.g., the decline in rate of
return on stocks, the increase in volatility in stock returns) and the increase in precautionary
demand for safe assets due to bad income conditions (“shunting to safe assets”).
3. Analysis of the Level of Risky Assets Held by Households
3-1. International Comparison of the Breakdown of Financial Assets
Again looking at Chart 1, we realize that the percentage of risky assets held by
households has roughly been about 10 percent except in the “bubble” era since the middle of
1970s and its movement (or “change”) has stayed within a narrow range17.
We also need to evaluate the ratio of risky assets held by Japan’s households (“level”).
Based on each country’s flow of funds, the ratio of risky assets in the United States is
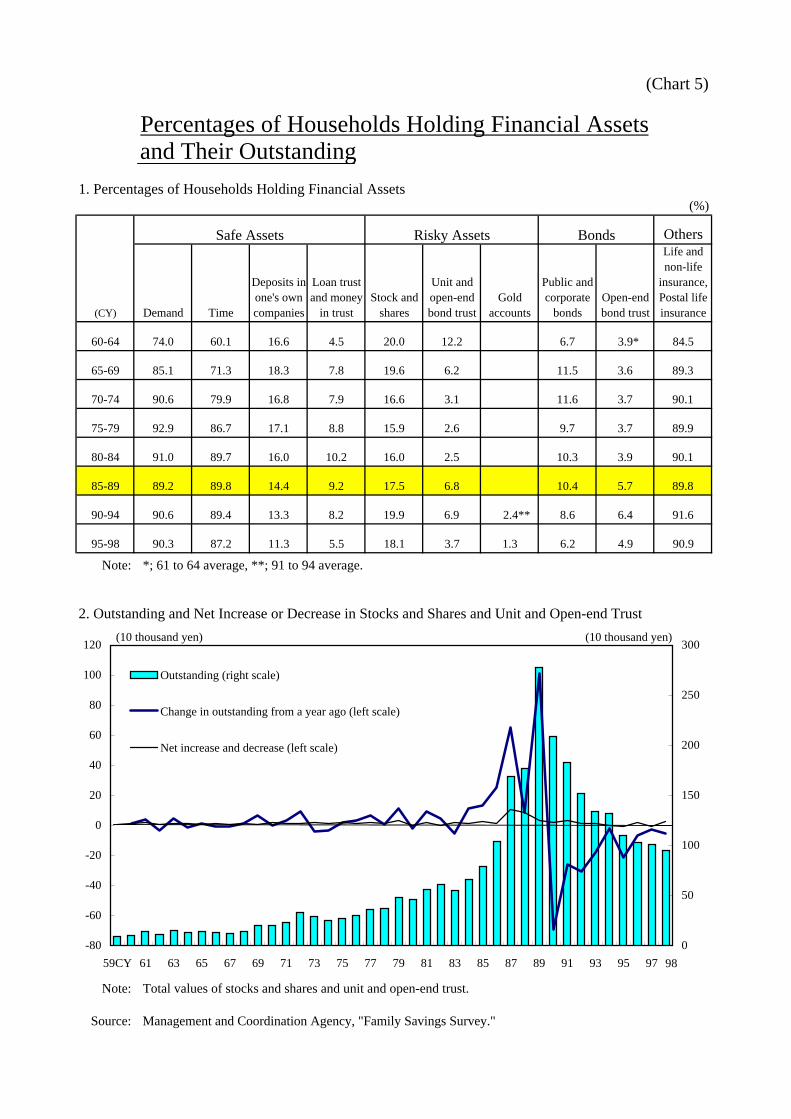
16 There is possibility that multi-collinearity in the estimation results for risky assets occurs since the correlationbetween the change rate in annual income (DY) and rate of return on stocks (rm) is not negligible. As far as D.W.statistics (2.33) in the table is concerned, however, the penalty for multi-collinearity seems to be small.17 It is generally thought that households were more willing to invest in risky assets in the “bubble” era.However, the changes in the structure of financial assets held by each household show that the net increase inratio from 1985 to 1989 was not so big as previous periods (Chart 5-1). Rather, if we look at the relationshipbetween the outstanding and the net increase in stocks and investment trusts (Chart 5-2), it becomes clear thatthe reason why the percentage of risky assets increased in the “bubble” era is not a new willingness to invest inrisky assets but the appreciation in the value of stocks that had been held by households before the “bubble”began (e.g., employee’s stock holding system).
8
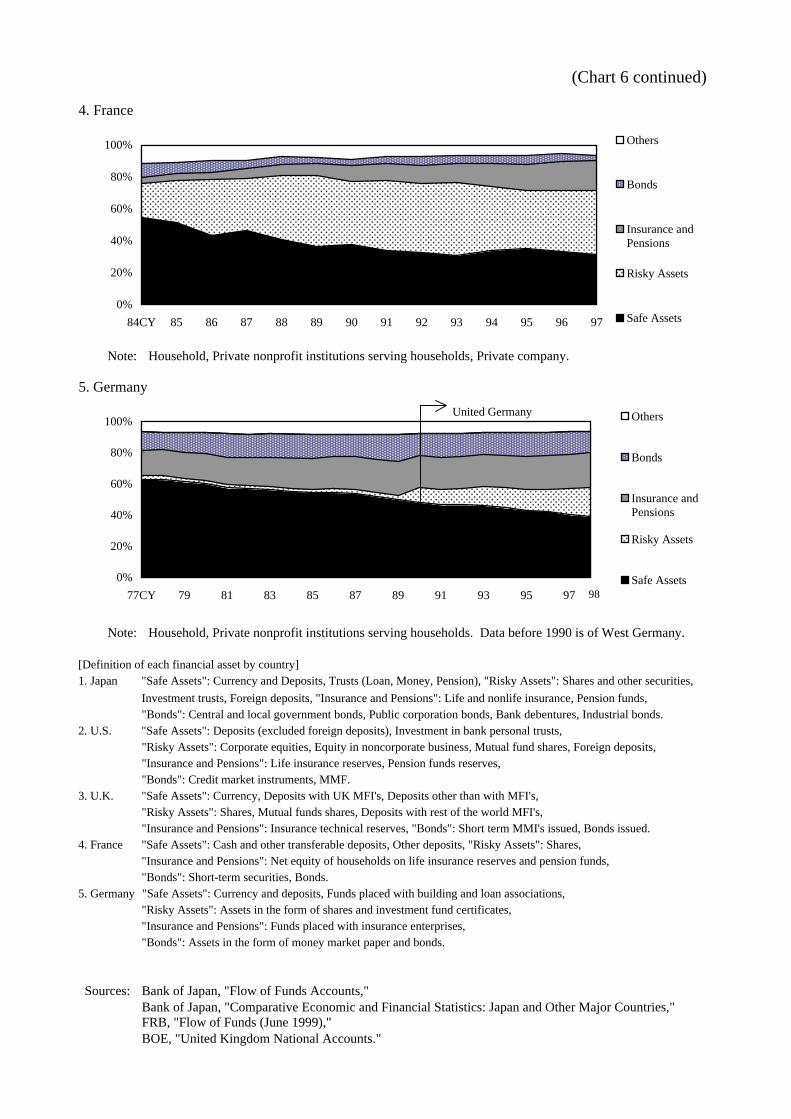
relatively high. It exceeds 40 percent in 1998 (Chart 6-2)18. In addition, its ratio in the 1990s
was about 20 percent in the United Kingdom and about 40 percent in France. Comparing
these facts shows that Japan’s households are reluctant to invest in risky assets. In other
words, they are risk averse (Chart 6-3 to 6-5)19, 20.
3-2. Japan’s Households That Are Risk Averse – Japan-U.S. Comparison –
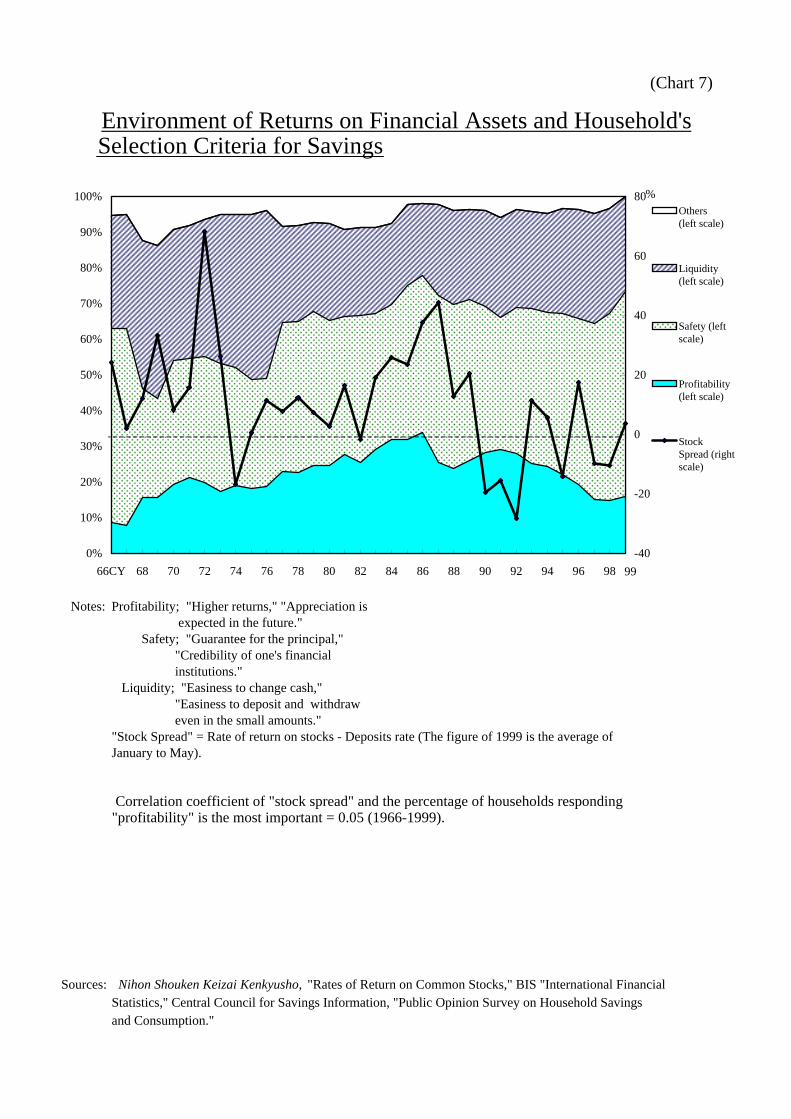
To make sure that Japan’s households are risk averse, first, we look at a survey that
investigates the selection criteria for savings (Chart 7). We find that the number of household
attaching great importance to "profitability" of assets is around 20 percent in whatever all
profit environments21. On the other hand, the number of households putting great importance
on "safety" and "liquidity" of assets is about 70 to 80 percent. Next, based on a “Japan-U.S.
comparison of savings (1996)” conducted by the Institute for Posts and Telecommunications
Policy (Chart 8-1), only 13 percent of Japan’s households attach importance to "profitability"
of assets compared to 24 percent of households in the United States. On this point, we should
pay attention to the different profit environment in both countries at the study period. In
addition, when compared by household annual income (Chart 8-2), U.S. households attach
greater importance to “profitability” of assets for all income cohorts and this difference
becomes remarkable as annual income goes up.
We calculate the degree of relative risk aversion of households in Japan and the United
States using the standard capital assets pricing model (CAPM) of Blume and Friend (1975),
Mankiw and Shapiro (1986). CAPM summarized the relationship between risk and return on
assets and risky assets selection of households (Chart 9)22. We find that Japan’s households
18 Economic Planning Agency “Annual Economic Report (1999)” shows that if land is included in individualassets and land is considered to be risky asset, then there is no big difference between the ratio of risky assetsheld in both Japan and United States. Considering, however, (1) Japanese want to live longer at the same placeand (2) the lack of liquidity in real estate, we think that land is a different type of asset than conventional riskyassets such as stocks.19 We could say that Germany, where the percentage of risky assets held is about 10 percent after unification,has the same structure as Japan.20 The change in stock prices from the end of 1990 to the end of 1998 shows a roughly 42 percent decrease inJapan (Nikkei), an increase of about 250 percent in the United States (NY Dow), about 170 percent increase inthe United Kingdom (FT100), about 160 percent in France (CAC40) and about 260 percent in Germany(XETRADAX). It is natural to say that the difference in the individual willingness to hold risky assets (i.e.,change) between Japan and these countries is mainly explained by the difference in stock price performances.But even if this is considered, we can say that the ratio of risky assets held by Japanese is relatively very low.21 The ratio of households attaching importance to “profitability” has decreased rapidly to fall under the 20percent level for recent few years.22 Please refer to BOX for the calculation method for the degree of relative risk aversion.
9
are several times as risk averse as those in the United States and this relation has not changed
in general.
[BOX] Calculation Method of the Degree of Relative Risk Aversion and Its Implications
(As for the deviation of the equation in detail, please refer to Appendix 2 in the end of paper.)
[Equation]
a×
s-
=1r)r(E
C2
m
fm
C : Degree of relative risk aversion a : Ratio of risky assets rf : Rate of return on safe assets (Japan: deposit rate, U.S.: TB3M) E(rm): Expected rate of return on risky assets (calculated by TOPIX <Japan>, S&P500 <U.S.>) sm
2 : Variance of rate of return on risky assets
The degree of relative risk aversion (C) show the willingness of a representative
household to hold risky assets according to the difference between the expected rate of return
on risky assets and the rate of return on safe assets (E(rm)-rf) under the risk of change in risky
asset prices in one year (sm2). For example, assuming that the risk of change in risky asset
prices is constant, the degree of relative risk aversion would be large if the actual ratio of
risky assets (a) does not change very much when there is a big difference in the expected rate
of return on risky assets and the rate of return on safe assets. This situation implies that
households are “relatively risk averse.”
Japan’s households are (1) more risk averse than those in the United States and (2) their
degree of risk aversion has not changed very much until now. On this point, the reluctance of
Japan’s households to invest in risky assets is thought to be affected by structural factors that
lower their preference for risky assets as well as the relation of risk and return on assets. In
general, the investment environment is thought to affect preferences for such assets. In the
next section we analyze in detail on various environments surrounding risky asset investment
in Japan, focusing mainly on the 1990s.
4. Structural Factors Prescribing the Household’s Investment Behavior
4-1. Information and Household’s Portfolio Selection
10
First, we consider the limitation of information on portfolio selection of financial assets.
We start with a brief look at the relationship between “comparison information regulation23”
introduced by Okumura (1999) and household’s portfolio selection.
It is often assumed in economic theory that “a market participant has complete
information on trading goods and services.” When we apply this to a household’s portfolio
selection, it is assumed that households acquire information on risk and return on various
financial assets, analyze, forecast, and invest in the preferred financial assets24.
It is, however, actually thought that voluntary agreements concerning “comparison
information regulation” by each trade group (e.g., Japan Securities Dealers Association, The
Investment Trust Association of Japan, Bankers Association) prevented households from
getting effective information from financial institutions until the middle of the 1990s. The
“comparison information regulation” has been relaxed by degrees in accordance with
developments in finance liberalization in the latter half of 1990s. As a result, however, it was
not until June 1998 that the comparative advertisements of various financial products were
conducted freely (cf., list shown below).
History of “Comparison Information Regulation" on Financial Products
April 1993 Bankers Association liberalized the display of comparisons among banks of deposits thathave strong resemblance to their own in advertisements for financial products for the firsttime.
Late 1994 The Investment Trust Association of Japan becomes concerned about providinginformation on rate comparisons of MMF and deposits. They began to examine it at theown sale information committee.
Dec. 1994 For the first time, a brokerage firm advertised in a newspaper that each financial productwas characterized as risk and return.
Oct. 1995 Japan Securities Dealers Association and The Investment Trust Association of Japanabolished the requirement that all member advertisements are shown and examined by thegroup in advance. Brokerage firms carried newspaper ads comparing the rate of return onbond trusts (including MMF) and deposits rate for the first time.
June 1998 Bankers Association revised “a fair competition agreement about indication in bankbusiness,” and enabled banks to run advertisements that compare financial products, butonly for those items that have similar amounts and periods.
(Source) Okumura (1999).
23 The “comparison information regulation” is the voluntary regulation by each trade group that preventsconsumers from getting information on different financial products (e.g., deposit rate v.s. average return oninvestment trusts) as a result of propaganda and advertising. Under existing regulations, investor should haverelatively high costs when attempting to collect information needed to determine whether investment to onefinancial asset is advantageous.24 Generally the assumption of perfect information is the basis for the belief that financial liberalization will leadto optimal financial asset transactions.
11
We analyze how the limits on information influence the household’s portfolio selection
using the “Opinion Surveys on Lifestyle and Financial Behavior” conducted by the Bank of
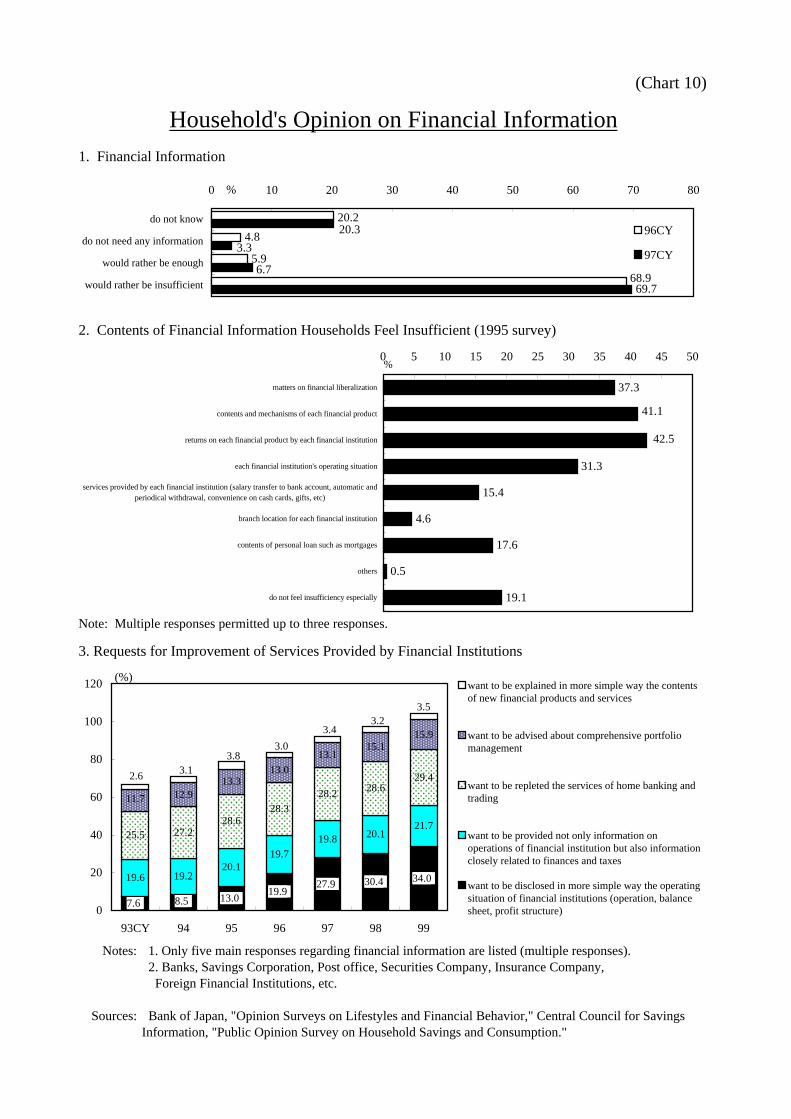
Japan. First, looking at the situation of acquiring the financial information in 1996 and 1997
(Chart 10-1), the majority of households reply that the information on financial products is
“rather lacking.” When asked what information they have, they respond “return by each
financial institution and savings product” and “contents and structures of savings product”
(Chart 10-2 <1995>). This kind of limitation may raise the information gathering cost,
especially for risky asset investment25. By the last year, the “comparison information
regulation” had been relaxed largely. However, when asked whether financial institutions
provide the information necessary for financial asset investment in terms of quality and
quantity (e.g., “want to explain the contents of new savings products and services in more
detail,” “want to be advised in detail about comprehensive fund management”), the number
of households that say it is still insufficient are increasing in recent years (Chart 10-3).
4-2. Contents of Products and Images of Risky Asset Investment
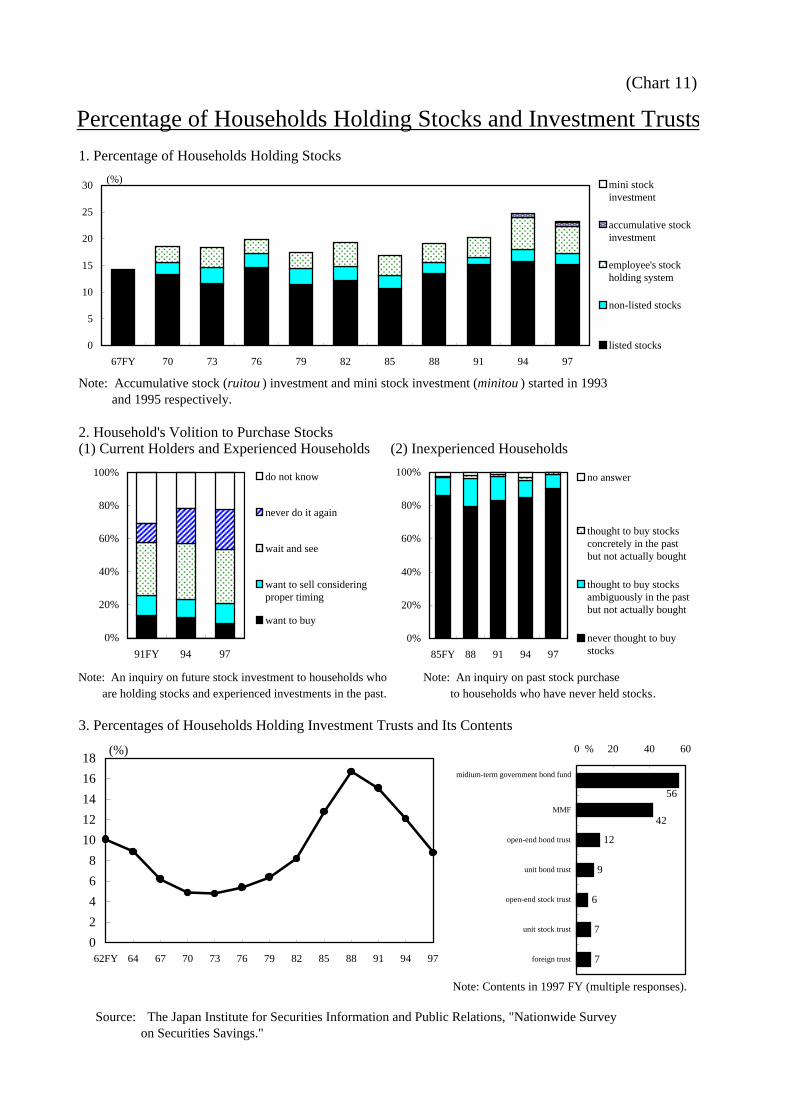
Additional confirmation of the household’s reluctance to invest in risky assets comes
from the “nationwide survey on securities savings” conducted once every three years by the
Japan Institute for Securities Information and Public Relations. Only a little more than 20
percent of households possess stocks, although new products, such as accumulative stock
investment and mini stock investment, were released in the 1990s (Chart 11-1. Please refer to
the table below about stock-related products). In addition, when we examine the household’s
intention of purchasing stocks in 1997 (Chart 11-2), Less than 10 percent of households who
have ever invested in stocks “want to buy stocks at the proper timing.” Furthermore, about 90
percent of households who have never invested in stocks, respond that “they never think
about buying stocks26.” When we turn to investment trusts (Chart 11-3), after the “bubble”
burst, the ratio of household who possesses investment trusts has fallen rapidly. As for the
contents of investment trusts (1997), the main products are safe bond trusts, such as medium-
25 In other words, there is probability that the lack of information on financial products makes the range of ahousehold’s financial asset selection narrow and implicitly encourages a shift to deposits for which there is lessneed for information about investment risk.26 In chart 11-2(1), the number of households responding “never buy stocks again” increased two times from1991 to 1994 and has continued to increase since. We find that the deterioration of the profit environment forfinancial assets (“pain” caused by bubble burst) makes a household’s willingness to invest in risky assetsnegative in the 1990s.
12
term government bond funds and MMF, while risk-type investment trusts, such as stock
investment trusts, are possessed by only 6 percent to 7 percent of households.
Products of Stock Investment
Stock investment Accumulative stock investment(released in Feb. 1993)
Mini stock investment(released in Oct. 1995)
Characteristics A unit of stock isthe minimumpurchase amount.
A fixed amount of money on a fixedday is paid to brokerage firm everymonth, and a brokerage firmpurchases stocks per brand.
Turning a trading unit ofstocks (usually 1,000 units ofstocks) into 1/10 unit.
Amount ofpayment
(Trading unit)
50 yen value: 1,000units of stocks500 yen value: 100units of stocks50,000 yen value: 1unit of stocks
An amount of money that is notenough for unit stock .
Integer times of 1/10 (up to9/10).
Brand No limit. No limit in the selected brand. No limit in the selected brand.Method of
buying / sellingSettlement on fourthbusiness day afterthe promise ofbuying or selling.
Buying: starting value ofpredetermined daySelling: starting value of thefollowing business day ofapplication (any time possible)
Any time possible. Startingvalue of the followingbusiness day of order.
Rights ofstockholder
Purchaser formallybecomes thestockholder after thechange in proprietoris complete.
Proprietor is in the name of“accumulative stocks investmentunit,” but a stock dividend is paidaccording to the amount of stocksheld.
Proprietor is in the name of“mini stocks investment unit,”but a stock dividend is paidaccording to the amount ofstocks held.
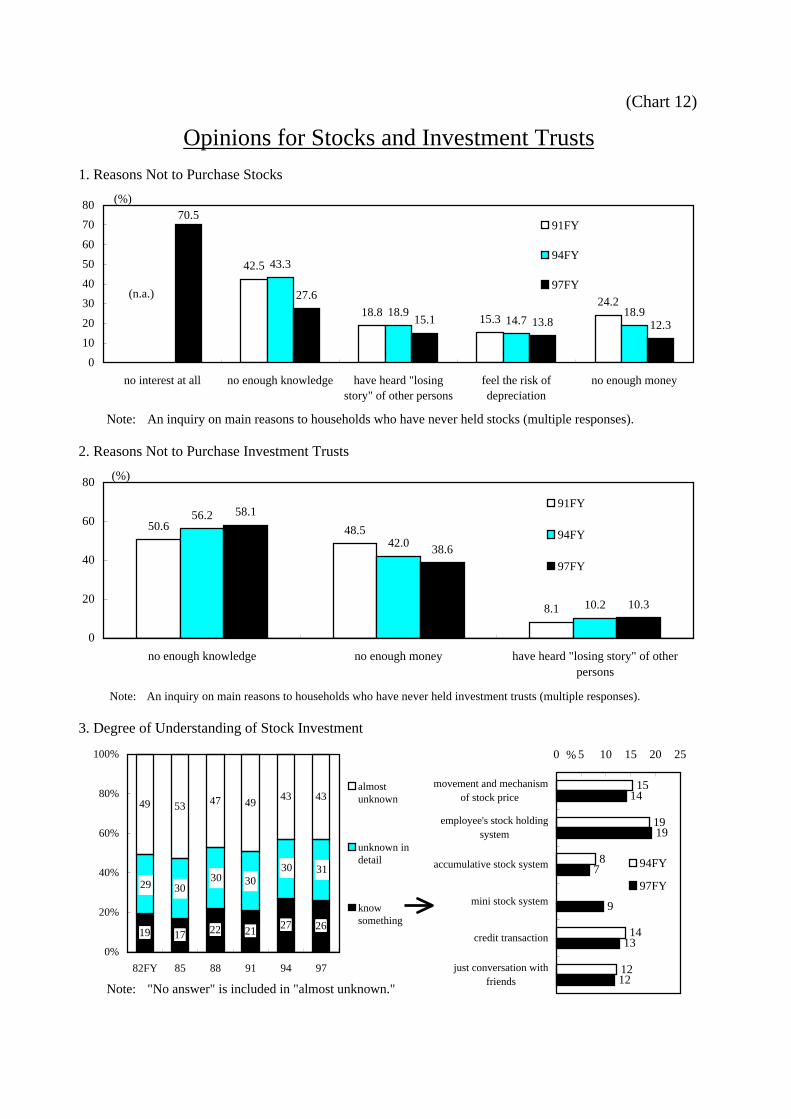
When asked why households do not purchase stocks and investment trusts in the “the
nationwide survey on securities savings,” the responses “no interest” and “no enough
knowledge” predominate (Chart 12-1 and 12-2). Although in the 1990s there are signs that
the products of stocks and investment trusts are improved, in fact households do not
understand well the framework and content of stock investments. For example, 74 percent of
households respond “no understanding of stock investment” and “understanding but no
greater detail of stock investment” in 1997 (Chart 12-3)27. Financial institutions must improve
the products of stocks and investment trusts and make them look more appealing to diffuse
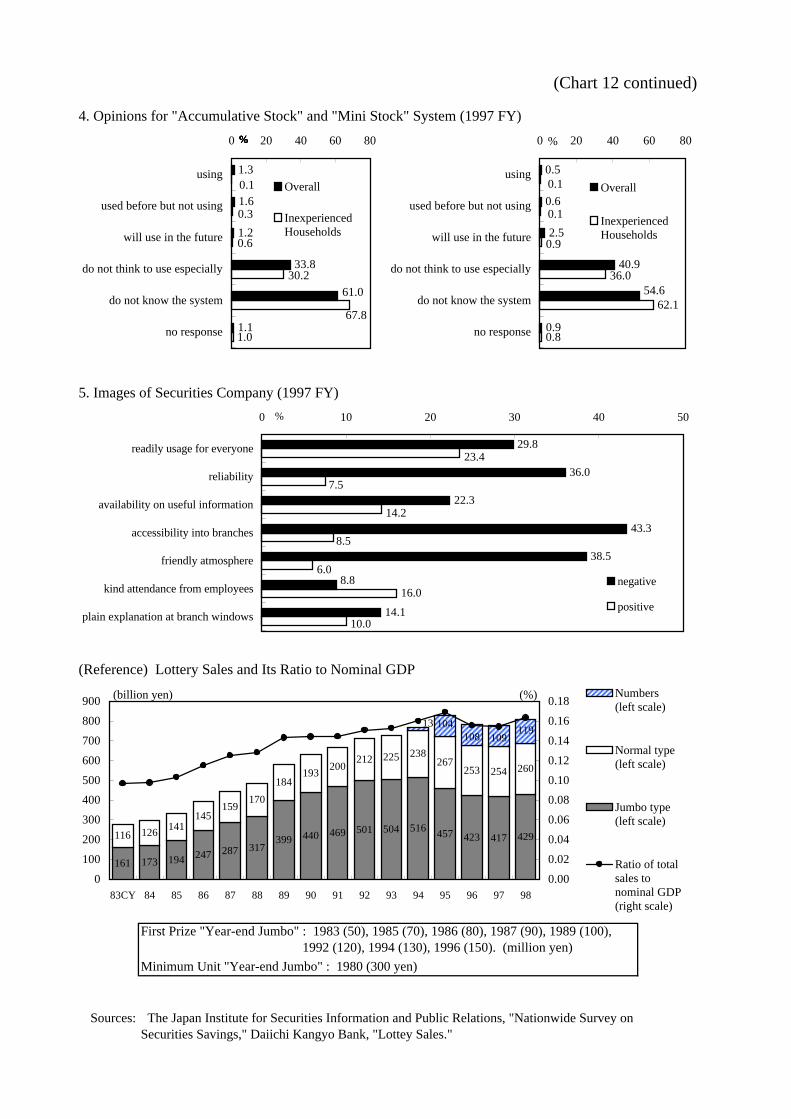
the risky asset investments in Japan. In addition (Chart 12-5), the negative views dominate
household perception of brokerage firms when households do begin investing in risky assets
27 Many also respond “do not know” and “do not want to use” when asked about accumulative stock investmentand mini stock investment (Chart 12-4).
13
(e.g., “easy to enter branches”, “atmosphere that is easy to be got close”, “trustable”). This
means that the financial industry must also work on its image28.
4-3. Costs in Investing in Risky Assets – Focusing on Stock Investments –
(Commission Fee)
When people invest in stocks, as opposed to deposits and savings, fees to brokerage firms
(called stock commission fees) are required. In addition, about 3,000 yen (plus consumption
tax) annually per account is paid for account management charges in accumulative stock
investment and mini stock investment, as well as charges when asking for the change in
proprietors.
This stock commission fee system shifts the investment calculus for small investors (cf.,
see a table below)29. Concretely speaking, for example, when we purchase stocks for 50,000
yen and sell them after one year, it is necessary that the stock prices increase at least more
than 10 percent so that some profits are realized, because 5,000 yen (i.e. 2,500 yen + 2,500
yen), 10 percent of 50,000 yen, is required as a commission fee in both buying and selling the
stocks30. In other words, it is necessary to prepare some amounts of money beforehand in
order to invest in stocks in a cost-effective way. We cannot say that stock investments in
Japan are “easy to do” or “easy to access (superior in convenience)” when compared to
deposits and savings31.
28 We consider the example of lottery, a widely recognized risky commodity in Japan, to show how the contentsand images of a product are important when households invest in risky assets. A Lottery is “risky asset” becausethere is high probability of having zero value (of course purchasing a lottery could be considered a kind ofconsumption). Since our analysis shows households are risk averse, this kind of large risky investment productshould be kept at a distance. But actual lottery sale shows no change as a result of the recent economic slump inJapan (Chart 12 <reference>). There are four reasons why lottery purchases are widespread in Japan; (1) goodcontents (small amount of money to invest, only 100 to 300 yen per lottery), (2) good image (buy a “dream”),(3) convenience (a lot of sales points, about 10,000 in Japan) and (4) easy to understand (simple structure).29 The stock commission fee system was completely liberalized effective October 1, 1999. A brokerage firm candetermine the commission fee based on its own judgment. In the United States, the complete liberalization ofcommission fees was effective May 1, 1975, which is called “Securities May Day”.30 We neglect dividends in this calculation.31 A stock investment trust is the product with relatively small amount of money (by 1 yen if more than or equalto 10,000 yen in most case). It is however necessary for investors to pay 2 to 3 percent of the fee on purchasingamount plus consumption tax regarding its fee.
14
Stock Commission Fee System (calculation method, effective April 1, 1999)
Amount of money invested Calculation methodEqual to or less than 1 million yen 1.150%*
More than 1 million yen and equal to orless than 5 million yen
0.900%+2,500 yen
More than 5 million yen and equal to orless than 10 million yen
0.700%+12,500 yen
More than 10 million yen and equal to orless than 30 million yen
0.575%+25,000 yen
More than 30 million yen and equal to orless than 50 million yen
0.375%+85,000 yen
More than 50 million yen Amount of money by mutual agreement with a brokeragefirm, but equal to or more than 272,500 yen
* 2,500 yen should be paid if the amount of 1.150% of money invested is less than 2,500 yen.(Note) Consumption tax depending on commission fee is also collected.(Source) Central Council for Savings Information, “Encyclopedia of Financial Products in 1999”
(Tax System)
A tax as well as a commission fee must be paid when investing in stocks and other
financial products. The current tax system disadvantages risky asset investment, such as
stocks, when compared to deposits and savings in Japan and stock investments in the United
States. In Japan, the reporting separate taxation (rate: 26 percent) is principally applied for the
transfer gain of stocks. For the dividend, aggregate taxation of 20 percent of tax rate at the
source is applied when it is paid32. In comparison, (1) the uniform 20 percent of separate
taxation at source (c.f., 18 percent for the redemption margin of discount bond) is applied to
deposits and savings, while there is a tax-free system for senior citizens aged 65 or older and
there is the worker’s property accumulation system house / pension savings system (tax-free
up to 5.5 million yen in total) for general office workers. In short, various tax-free options
exist when investing in deposits and savings in Japan. In addition, (2) in the United States,
the tax system is simple (aggregate taxation with other income is applied in principle33) and
when the transfer losses of stocks are generated, the system allows investors to sum them up
by 3,000 dollars annually along with other taxable income. Furthermore, remaining losses
can be carried into the future.
32 The securities transaction tax applied to the sale of securities, such as stocks, was abolished at the end ofMarch in 1999.33 The current U.S. tax system has a five step progressive taxation (15 to 39.6 percent). This implies thatrelatively high income people are disadvantaged, but relatively low income people are better off on transfergains of stocks when compared to Japanese people (In principle, there is a flat 26 percent separate taxation rate).Furthermore, in the United States, separate taxation (10 or 20 percent of tax rate on transfer gains of stocksdepending on the individual’s income tax rate) is applied in the case of possessing stocks more than 12 months.This means that a relatively lower tax rate could be applied to everyone in the United States when compared toJapan.
15
5. Conclusion
We analyze why Japan’s households are reluctant to invest in risky assets despite
financial liberalization in the 1990s, by examining in detail the data concerning financial
assets of households.
First, we show that households have become more reluctant to invest in risky assets
mainly as a result of the deterioration of the profit environment caused by the slumping stock
market and because of the precautionary savings motive (“shunting to safe assets”) triggered
by the deteriorating income environment. Next, we explain that the Japanese aversion to risky
assets (i.e., the willingness to hold risky assets in Japan is substantially lower when compared
to other developed countries) is probably affected by; (1) households do not well understand
the contents of financial products due to the lack of information necessary for financial
investment (in both quality and quantity), (2) risky asset investment of small amounts of
money is disadvantageous when considering commission fees, and furthermore, (3) taxation
of risky asset investment make it less profitable when compared to deposits and savings.
It is often said that the national character of Japanese who think “savings (particularly
deposits) is virtuous but stock investment is not” is the greatest cause for this risk aversion.
To examine this point, we looked at the breakdown of financial assets held by the private
sector including before and after the Second World War (Chart 13)34. There was no big
difference in the amount of safe and risky assets held in prewar periods. But after the war, the
ratio of safe assets had increased rapidly, while that of risky assets had decreased to the 10 to
20 percent level. We think this is affected by (a) the establishment of a property tax aimed at
preventing hyper-inflation immediately after the war and redistributed national wealth (cf.,
one-time taxation in 1946), and (b) the gradual increase in the upper limit of tax-free amounts
on deposits and savings interests by the revisions of the National Savings Association Act
and the establishment of the Maruyu system (1963), which gave special treatment to deposits
and savings. In other words, taxation measures made in the process of establishing the
postwar economic system in Japan made financial institutions the chief source of capital. At
the same time, these measures gave households strong incentives to accumulate deposits and
34 We use the statistics of the private sector (households + private firms) due to data restrictions.
16
savings and to establish a preference that avoids investment in risky assets. We think that this
continues to influence Japan’s households35,36.
Financial assets held by households are expected to be injected directly into capital
markets (i.e., firms) in the form of risk capital as well as in the conventional indirect manner
as the financial “Big Bang” continues. These developments, along with the capital markets in
Japan are revitalized and direct financing by firms is more smoothly conducted, should help
medium- and small-size venture businesses, which has been observed in the United States in
the 1990s. At the same time, large firm’s funding methods are going to diversify, which will
provide the opportunity for structural adjustments of Japanese industries in the 21st century37.
To encourage the household’s investment in risky assets, it is at first necessary to solve
the problems “contents” and “convenience.” The complete liberalization of commission fees
on stocks that started in October 1999 should do just that. In addition, online stockbroking,
which has been flourishing in the United States and provides the minimum amount of
investment information but cuts fees significantly by using the Internet, is attracting attention
as a useful tool that enables individuals to easily invest in risky assets at a substantially lower
cost38.
35 This system aimed at enhancing a household’s motivation to accumulate safe assets and made a largecontribution to the revitalization of postwar Japanese economy and the realization of the high-growth economyduring the 1950s and 1960s. It constructed the basic framework of the so called indirect-financing system byusing the large amount of deposits and savings accumulated by households as the source for extensiveinvestment in large and heavily-equipped industries in Japan. But as Japan transformed into a mature economyafter experiencing oil shocks twice, Japanese firms, which experienced globalization and the rise of the serviceeconomy, have not necessarily benefited from the efficiency of this indirect financing system. On the otherhands, households, who are feeling problems identified earlier, have still less incentive to invest in risky assetsand still have strong preference for safe assets.36 Looking at the history of taxation in the United States, we could say that the two large scale tax revisions(1981 and 1986) carried out by the Reagan administration created the risky asset investment boom in the 1990s.As far as income taxation is concerned, the decrease in the tax rate in 1981 (from 15 step <14 to 70 percent> to14 step <11 to 50 percent>) and the large scale flattening of the progressive taxation system (from 14 step <11to 50 percent> to 2 step <15 and 28 percent>) provide motivation especially for middle and high income peopleto increase investments in financial market assets. After 1986, to correct the huge fiscal imbalance, the tax ratehas been gradually increased to three steps (15, 28 and 31 percent) by the Bush administration in 1990 and tofive steps (15 to 39.6 percent) by the Clinton administration in 1993.37 Economic Planing Agency “Annual Economic Report (1999)” points out that if household financial assets aredirectly injected into firms, the efficiency of corporate management would be enhanced because firms arechecked and monitored by many households (i.e., stockholders) in capital markets.38 The growing power of online brokers in the United States is often called the “Second Securities May Day.”According to research by Piper Jaffray Inc., a subsidiary of U.S. Bancorp, the ratio of online trading to allindividual stock trading in the United States was 17 percent in 1997 but increased to 27 percent in 1998.
17
[Appendix 1] The Tobit Model
The Tobit model is a stochastic method used for the analysis of qualitative data.
Qualitative data is not continuous quantitative data such as GDP, but data that belongs in
particular categories such as “good or bad” and “have or don’t have.” We could observe
concrete numbers if the qualitative data includes not only the simple binary choice (“have or
don’t have”) but also has a condition in the case of “have.” In this case, the Tobit model we
explain below is used39.
1. Let us assume that Yi is observed and its response is classified in 0 (“don’t have”)
and in Yi* (“have and how much”).
2. We show Yi*, a latent variable in determining the value of Yi, as,
ii*i uXY +b= , (1)
where Xi is the independent variable that affects the choice of Yi such as characteristics
and the life environment of each respondent. The equation (1) consists of the part
explainable by Xi and error term ui. The latent variable Yi* is not observed when it is
negative40.
îíì
=*i
iY
0Y if
0Y
0Y*i
*i
>
£ (2)
3. It is also assumed that the error term ui is mutually independent and normally
distributed with an average of zero and variance of s2. In addition, if f and F are
defined as the density function and distribution function of standard normal distribution
respectively, then the likelihood function and log value of likelihood function (LLF) are
shown as
å
Õ Õ
=
-
= >
-
úû
ùêë
é
þýü
îíì
÷øö
çèæsb
fs×>+þýü
îíì
÷øö
çèæsb
F-×==sb
þýü
îíì
÷øö
çèæsb
fs×þýü
îíì
÷øö
çèæsb
F-=sb
n
1i
i1i
ii
2
0Y 0Y
i1i2
Xlog)0Y(1
X1log)0Y(1),(LLF
XX1),(L
i i
(3)
39 There are five types of the Tobit models. We here explain briefly the most standard “censored regressionmodel.”40 For example, because the ratio of risky assets cannot be negative (it is a positive value or zero), even if Yi
* isnegative as a result of calculation, the model then selects Yi=0 as the second best.
18
respectively, where 1( ) is called an indicator function, that is, if the condition of
parenthesis is satisfied, then take 1, otherwise 0.
4. Finally, partially differentiating LLF in equation (3) with each parameter (b, s2) and
setting them equal to zero to maximize, we obtain the estimated value of each parameter
(called the Tobit ML estimator).
19
[Appendix 2] Calculation Method of the Degree of Relative Risk Aversion
(Assumption)
· Only two kinds of financial assets, safe and risky, exist. Define rate of return on safe
asset, rf and that on risky asset, rm (expected value: E(rm), variance:sm2).
· Investing period can be divided infinitely (n periods) with starting period t and ending
period t+dt.
· Investors maximize the expected utility of Wt+dt. The utility function is defined as a type
of diminishing marginal utility (i.e. investor of risk aversion), U’(W)>0, U”(W)<0.
1. Under these assumptions, setting the asset at starting period as Wt (given) and the
ratio of risky asset as a, then asset outstanding at ending period Wt+dt is defined as
{ } ]dt)t(ydtr)1()r(E1[WW mfmtdtt as+a-+a+=+ ,
where y(t) is the stochastic variable which is standard normally distributed.
2. Investors determine a in order to maximize E[U(Wt+dt)]. For simplicity, conducting
the second order Taylor expansion of U(Wt+dt) in the neighborhood of Wt, we obtain
{ } dtW)W(''U2
1dtr)1()r(EW)W('U)W(U)]W(U[E 2
m22
ttfmtttdtt sa+a-+a+=+ .
Setting this equation equal to zero after differentiating with a,
C
1r)r(E2
m
fm ×s
-=a or
a×
s-
=1r)r(E
C2
m
fm
is obtained. The right side of above equation is in Chart 9 where C is the degree of
relative risk aversion shown as
)W(''UW
)W('UC
tt
t-= .
Data necessary for C and assumptions are basically the same as Muramoto (1998).
20
[References]
Blume, M. E. and Friend, I. (1975), “The Demand for Risky Asset,” American Economic
Review.
Brainard, W. C. and Tobin, J. (1969), “Pitfalls in Financial Model Building,” American
Economic Review, Papers and Proceedings.
Mankiw, N. G. and Shapiro, M. (1986), “Risk and Return, Consumption Beta versus Market
Beta,” Review of Economics and Statistics, Vol.68, No.2.
Nakagawa, S. (1999), “Why Has Japan’s Household Savings Rate Remained High even
during the 1990s?” Bank of Japan Monthly Bulletin, April 1999.
(Only available in Japanese)
Muramoto, T. (1998), “Financial Asset Selection by Japanese People,” Toyo Keizai
Shinposha.
Okumura, H. (1999), “Modern Economics in Japan – Generating and Collapsing of the
Bubble Economy,” Toyo Keizai Shinposha.
Saito, M. and Oshika, T. (1979), “Analysis of Factors of Asset Selection,” Keizai Bunseki,
Vol.74.
(Chart 1)
1. Family Savings Survey (All Households)
Notes: 1. The ratio of each asset to total financial assets (savings) outstanding. This definition is used unless otherwise specified. 2. "Safe Assets" Deposits, Loan trust and money in trust, Deposits in one's own companies. "Risky Assets" Stock and shares, Unit and open-end trust, Gold accounts. "Bonds" Public and corporate bonds, Open-end bond trust. "Insurance and Pensions" Life and non-life insurance, Postal life insurance.
2. Public Opinion Survey on Household Savings and Consumption
Notes: 1. "Safe Assets" Deposits, Loan trust and money in trust, Employee's property formation savings. "Risky Assets" Stock and shares, Investment trust. "Bonds" Public and corporate bonds, Open-end bond trust. "Insurance and Pensions" Life and non-life insurance, Postal life insurance, Personal pension. 2. Bar chart in the right shows the type of savings that households think will be the most important in the coming year (94 to 98 survey).
Sources: Management and Coordination Agency, "Family Savings Survey," Central Council for Savings Information, "Public Opinion Survey on Household Savings and Consumption."
1. Rate of Return on Stocks (TSE 1st section) and Deposits Rate
Notes: 1. Rate of return on stocks is the weighted average of Tokyo Stock Exchange 1st Section while deposits rate shows the weighted average of each term. 2. The figure of 1999 is the average of January to May.
2. "Stock Spread"
Notes: 1. Rate of return on stocks minus deposits rate. 2. The figure of 1999 is the average of January to May.
Sources:Nihon Shouken Keizai Kenkyusho, "Rates of Return on Common Stocks,"BIS "International Financial Statistics."
Environment of Returns on Financial Assets
-40
-20
0
20
40
60
80
53CY 56 59 62 65 68 71 74 77 80 83 86 89 92 95 98
0
2
4
6
8
10
12
Rate of return on stocks (left scale)
Dividend rate (right scale)
Deposits rate (right scale)
(%) (%)
-40
-20
0
20
40
60
80
58CY 61 64 67 70 73 76 79 82 85 88 91 94 97
(%)
99
9999999999
Less than 30s 30s
40s 50s
60 or older
Note: The definition of financial assets and calculation method is the same in Chart1-1.
Source: Management and Coordination Agency, "Family Savings Survey."
Breakdown of Financial Assets Held by Age of the Head of Household (All Households)
(Chart 3)
69.8 68.860.3 58.3 62.7
0%
20%
40%
60%
80%
100%
80CY 85 90 95 98
Others
Bonds
Insurance andPensions
Risky Assets
Safe Assets
70.0 64.355.3 54.3 55.8
0%
20%
40%
60%
80%
100%
80CY 85 90 95 98
Others
Bonds
Insurance andPensions
Risky Assets
Safe Assets
66.4 62.053.9 54.6 54.3
0%
20%
40%
60%
80%
100%
80CY 85 90 95 98
Others
Bonds
Insurance andPensions
Risky Assets
Safe Assets
65.1 60.4 55.8 60.2 58.0
0%
20%
40%
60%
80%
100%
80CY 85 90 95 98
Others
Bonds
Insurance andPensions
Risky Assets
Safe Assets
69.260.6 54.9
63.9 64.0
0%
20%
40%
60%
80%
100%
80CY 85 90 95 98
Others
Bonds
Insurance andPensions
Risky Assets
Safe Assets
1. Savings Outstanding and Its Target Amounts (1999)
2. Savings Purpose of the Elderly (1999)
Note: Only the main responses are listed. Multiple responses permitted up to three responses.
3. Reasoning Concerning the Consumption of Savings 4. Selection Criteria for Savings (1999) by Elderly (1996)
Notes: Profitability; "Higher returns," "Appreciation is expected in the future."
Safety; "Guarantee for the principal," "Credibili ty of one's financialinstitutions."
Liquidity; "Easiness to change cash," "Easiness to deposit and withdraweven in the small amounts."
Sources: Central Council for Savings Information, "Public Opinion Survey on Household Savings and Consumption," Economic Planning Agency, "National Survey of Lifestyle Preferences (1999FY)."
(Chart 4)
Savings Behavior and Its Purposes of the Elderly
13661857 1758
23202793 2717
0
1000
2000
3000
Overall average 60s 70 or older
Savingsoutstanding
TargetAmounts
(per household, 10 thousand yen)
55.9 58.1 62.3
25.6 25.3
15.4 14.4
22.9
12.1
2.622.8
0%
20%
40%
60%
80%
100%
Overallaverage
60s 70 orolder
Others
Profitability
Liquidity
Safety
68.3
77.4
71.1 79.7
74.3
78.0
2.5 4.3
9.5
10.2
16.7
44.5
0 20 40 60 80 100 120 140 160 180 200
50s
60s
70 or older
Funds for post-retirement(future) livelihood
Preparation for illness oremergencies
Leave behind assets fordescendents
Funds for children'seducation and marriage
%
Savings cancontinually beconsumed in a
planned mannerfor the purpose ofenjoying hobbies
and a moreabundant lifestyle
7%
Others1%
Unclear7%
Savings should beinherited by
children and otherfamily members,and should not be
Note: Household, Private nonprofit institutions serving households. Data before 1990 is of West Germany.
[Definition of each financial asset by country]1. Japan "Safe Assets": Currency and Deposits, Trusts (Loan, Money, Pension), "Risky Assets": Shares and other securities,
Investment trusts, Foreign deposits, "Insurance and Pensions": Life and nonlife insurance, Pension funds, "Bonds": Central and local government bonds, Public corporation bonds, Bank debentures, Industrial bonds.
2. U.S. "Safe Assets": Deposits (excluded foreign deposits), Investment in bank personal trusts, "Risky Assets": Corporate equities, Equity in noncorporate business, Mutual fund shares, Foreign deposits, "Insurance and Pensions": Life insurance reserves, Pension funds reserves, "Bonds": Credit market instruments, MMF.
3. U.K. "Safe Assets": Currency, Deposits with UK MFI's, Deposits other than with MFI's, "Risky Assets": Shares, Mutual funds shares, Deposits with rest of the world MFI's, "Insurance and Pensions": Insurance technical reserves, "Bonds": Short term MMI's issued, Bonds issued.
4. France "Safe Assets": Cash and other transferable deposits, Other deposits, "Risky Assets": Shares,"Insurance and Pensions": Net equity of households on life insurance reserves and pension funds, "Bonds": Short-term securities, Bonds.
5. Germany "Safe Assets": Currency and deposits, Funds placed with building and loan associations, "Risky Assets": Assets in the form of shares and investment fund certificates, "Insurance and Pensions": Funds placed with insurance enterprises, "Bonds": Assets in the form of money market paper and bonds.
Sources: Bank of Japan, "Flow of Funds Accounts,"Bank of Japan, "Comparative Economic and Financial Statistics: Japan and Other Major Countries,"FRB, "Flow of Funds (June 1999),"BOE, "United Kingdom National Accounts."
(Chart 6 continued)
0%
20%
40%
60%
80%
100%
84CY 85 86 87 88 89 90 91 92 93 94 95 96 97
Others
Bonds
Insurance andPensions
Risky Assets
Safe Assets
0%
20%
40%
60%
80%
100%
77CY 79 81 83 85 87 89 91 93 95 97
Others
Bonds
Insurance andPensions
Risky Assets
Safe Assets
United Germany
98
Notes: Profitability; "Higher returns," "Appreciation is expected in the future."
Safety; "Guarantee for the principal," "Credibility of one's financialinstitutions."
Liquidity; "Easiness to change cash," "Easiness to deposit and withdraweven in the small amounts."
"Stock Spread" = Rate of return on stocks - Deposits rate (The figure of 1999 is the average ofJanuary to May).
Correlation coefficient of "stock spread" and the percentage of households responding "profitability" is the most important = 0.05 (1966-1999).
Sources: Nihon Shouken Keizai Kenkyusho, "Rates of Return on Common Stocks," BIS "International FinancialStatistics," Central Council for Savings Information, "Public Opinion Survey on Household Savingsand Consumption."
Selection Criteria for SavingsEnvironment of Returns on Financial Assets and Household's
Note: Inquiry to the most important criteria for savings.
2. Selection Criteria for Savings by Annual IncomeJapan
U.S.
Note: 1 dollar = 110 yen is assumed.
Source: The Institute for Posts and Telecommunications Policy, "Japan - U.S. Comparison of Household Savings(1997FY)."
(Chart 8)
Japan - U.S. Comparison of Selection Criteria for Savings
0% 20% 40% 60% 80% 100%
- 3
3 - 4
4 - 5
5 - 6
6 - 7
7 - 8
8 - 9
9 - 10
10 - 12
12 - 15
more than 15
Profitability
Liquidity
Safety
Others
million yen
0% 20% 40% 60% 80% 100%
less than 30
30 - 40
40 - 50
50 - 60
60 - 70
70 - 80
80 - 90
90 - 100
100 - 125
125 - 150
150 -
Profitability
Liquidity
Safety
Others
thousand dollar
Liquidity38%
Others11% Profitability
24%
Safety27%
Liquidity26%Safety
44%
Profitability13%
Others17%
Note: Calculation method is described in detail in Appendix 2 of the paper.
Sources: Bank of Japan, "Flow of Funds Accounts," FRB, "Flow of Funds," Nihon Shouken Keizai Kenkyusho,"Rates of Returns on Common Stocks," BIS, "International Financial Statistics."
(Chart 9)
Degree of Relative Risk Aversion in Japan and U.S.
2. Contents of Financial Information Households Feel Insufficient (1995 survey)
Note: Multiple responses permitted up to three responses.
3. Requests for Improvement of Services Provided by Financial Institutions
Notes: 1. Only five main responses regarding financial information are listed (multiple responses). 2. Banks, Savings Corporation, Post office, Securities Company, Insurance Company, Foreign Financial Institutions, etc.
Sources: Bank of Japan, "Opinion Surveys on Lifestyles and Financial Behavior," Central Council for SavingsInformation, "Public Opinion Survey on Household Savings and Consumption."
(Chart 10)
Household's Opinion on Financial Information
13.019.9
27.9 30.4 34.019.6 19.220.1
19.7
19.8 20.121.7
25.5 27.228.6
28.3
28.2 28.629.4
11.7 12.913.3
13.0
13.115.1
15.9
7.6 8.5
3.53.2
3.4
3.03.8
3.12.6
0
20
40
60
80
100
120
93CY 94 95 96 97 98 99
want to be explained in more simple way the contentsof new financial products and services
want to be advised about comprehensive portfoliomanagement
want to be repleted the services of home banking andtrading
want to be provided not only information onoperations of financial institution but also informationclosely related to finances and taxes
want to be disclosed in more simple way the operatingsituation of financial institutions (operation, balancesheet, profit structure)
(%)
37.3
31.3
15.4
4.6
17.6
0.5
19.1
42.5
41.1
0 5 10 15 20 25 30 35 40 45 50
matters on financial liberalization
contents and mechanisms of each financial product
returns on each financial product by each financial institution
each financial institution's operating situation
services provided by each financial institution (salary transfer to bank account, automatic andperiodical withdrawal, convenience on cash cards, gifts, etc)
branch location for each financial institution
contents of personal loan such as mortgages
others
do not feel insufficiency especially
%
69.7
5.9
4.8
6.7
3.3
20.320.2
68.9
0 10 20 30 40 50 60 70 80
would rather be insufficient
would rather be enough
do not need any information
do not know96CY
97CY
%
1. Percentage of Households Holding Stocks
Note: Accumulative stock (ruitou ) investment and mini stock investment (minitou) started in 1993 and 1995 respectively.
2. Household's Volition to Purchase Stocks(1) Current Holders and Experienced Households (2) Inexperienced Households
Note: An inquiry on future stock investment to households who Note: An inquiry on past stock purchase are holding stocks and experienced investments in the past. to households who have never held stocks.
3. Percentages of Households Holding Investment Trusts and Its Contents
Note: Contents in 1997 FY (multiple responses).
Source: The Japan Institute for Securities Information and Public Relations, "Nationwide Surveyon Securities Savings."
(Chart 11)
Percentage of Households Holding Stocks and Investment Trusts
0%
20%
40%
60%
80%
100%
91FY 94 97
do not know
never do it again
wait and see
want to sell consideringproper timing
want to buy
0%
20%
40%
60%
80%
100%
85FY 88 91 94 97
no answer
thought to buy stocksconcretely in the pastbut not actually bought
thought to buy stocksambiguously in the pastbut not actually bought
never thought to buystocks
0
5
10
15
20
25
30
67FY 70 73 76 79 82 85 88 91 94 97
mini stockinvestment
accumulative stockinvestment
employee's stockholding system
non-listed stocks
listed stocks
(%)
0
2
4
6
8
10
12
14
16
18
62FY 64 67 70 73 76 79 82 85 88 91 94 97
(%)
12
9
6
7
7
42
56
0 20 40 60
midium-term government bond fund
MMF
open-end bond trust
unit bond trust
open-end stock trust
unit stock trust
foreign trust
%
1. Reasons Not to Purchase Stocks
Note: An inquiry on main reasons to households who have never held stocks (multiple responses).
2. Reasons Not to Purchase Investment Trusts
Note: An inquiry on main reasons to households who have never held investment trusts (multiple responses).
3. Degree of Understanding of Stock Investment
Note: "No answer" is included in "almost unknown."
(Chart 12)
Opinions for Stocks and Investment Trusts
19 17 22 21 27 26
3030
49 53 47 4943 43
2930
30 31
0%
20%
40%
60%
80%
100%
82FY 85 88 91 94 97
almostunknown
unknown indetail
knowsomething
15
19
8
14
12
14
19
7
9
13
12
0 5 10 15 20 25
movement and mechanismof stock price
employee's stock holdingsystem
accumulative stock system
mini stock system
credit transaction
just conversation withfriends
94FY
97FY
%
42.5
18.815.3
24.2
43.3
18.914.7
18.9
27.6
15.1 13.8 12.3
70.5
0
10
20
30
40
50
60
70
80
no interest at all no enough knowledge have heard "losingstory" of other persons
feel the risk ofdepreciation
no enough money
91FY
94FY
97FY(n.a.)
(%)
50.6 48.5
8.1
56.2
42.0
10.2
58.1
38.6
10.3
0
20
40
60
80
no enough knowledge no enough money have heard "losing story" of otherpersons
91FY
94FY
97FY
(%)
4. Opinions for "Accumulative Stock" and "Mini Stock" System (1997 FY)
5. Images of Securities Company (1997 FY)
(Reference) Lottery Sales and Its Ratio to Nominal GDP
Sources: The Japan Institute for Securities Information and Public Relations, "Nationwide Survey onSecurities Savings," Daiichi Kangyo Bank, "Lottey Sales."
Notes: 1. Private savings data is calculated by excluding government savings from domestic savings. 2. "Safe Assets" Time deposits (city banks, post offices, mutual banks, others), Money trust, Currencies, Demand deposits (city banks, post offices, other financial institutions) "Risky Assets" Stock and shares "Bonds" Bonds "Insurance and Pensions" Life insurance, Postal life insurance 3. Due to World War II, data was discreted in 1945. In addition, estimation is partially conducted for the data of life insurance.
Source: Toyo Keizai Shinposha, "Long-term Economic Statistics; Savings and Currencies."
Long Time Series Data of Financial Assets in Japan