Attachment 3.1 Portland Area Carbon Monoxide Maintenance Plan State Implementation Plan Volume 2 Section 4.58 December 10, 2004 Prepared by: Oregon Department of Environmental Quality Air Quality Division 811 SW 6 th Avenue Portland, OR 97204-1390
Transcript
Attachment 3.1
Portland Area Carbon Monoxide Maintenance Plan
State Implementation Plan
Volume 2
Section 4.58
December 10, 2004
Prepared by:
Oregon Department of Environmental Quality Air Quality Division 811 SW 6th Avenue
Portland, OR 97204-1390
Portland Area Carbon Monoxide Maintenance Plan
Oregon State Implementation Plan Volume 2, Section 4.58
Table of Contents
4.58.0 Acknowledgements 4 4.58.1 Introduction 6 4.58.1.0 Purpose of the Second Maintenance Plan 6 4.58.1.1 History of CO Problem in the Portland Area 6 4.58.1.2 National Ambient Air Quality Standards for CO 6 4.58.1.3 Maintenance Plan Criteria/Organization 7 4.58.2 Continued Attainment Demonstration 9 4.58.2.1 Ambient Air Quality Monitoring Program 9 4.58.2.2 Summary of Ambient CO Data 9 4.58.2.3 Permanent and Enforceable Improvement in Air Quality 12 4.58.2.4 Demonstration that DEQ’s CO Network Represents Worst Case CO Concentrations 13 4.58.2.4.1 Comprehensive CO Field Studies 13 4.58.2.4.2 Screening Technique – High CO Intersections 14 4.58.2.5 Conclusions - Demonstration of Continued Attainment 15 4.58.3 Maintenance Plan 16 4.58.3.1 Attainment Inventory 16 4.58.3.2 Maintenance Demonstration 18 4.58.3.2.1 Motor Vehicle Emissions Budgets 19 4.58.3.2.2 Control Measures 20 4.58.3.2.2 Transportation Control Measures 22 4.58.3.3 Total Projected CO Emissions 22 4.58.3.4 Contingency Plan 23 4.58.4 Administrative Requirements 26 4.58.4.1 SIP Requirements 26 4.58.4.1.1 Summary of Fully Approved SIP 26 4.58.4.1.2 1990 Clean Air Act Amendments 28 4.58.4.2 Monitoring Network and Commitments 28 4.58.4.3 Verification of Continued Attainment 28 4.58.4.4 Maintenance Plan Commitments 29
List of Tables
Table 1 Highest CO Concentrations 1993 to 2003 10 Table 2 Five Highest 8-Hour CO Concentrations 11 Table 3 Intersections with Highest Approach Leg Emissions 14 Table 4 1999 Annual & Seasonal CO Emissions 17 Table 5 Pounds of CO per Winter Day 19 Table 6 Tons of CO per Year 19
Table 7 CO Motor Vehicle Emissions Budgets 20 Table 8 Projected CO Emissions with MVEB & Growth Allowance 23
List of Figures
Figure 1 CO Trends: 1982 to 2003 12 Figure 2 Calculation of Airshed Capacity 18
Portland Area Carbon Monoxide Maintenance Plan December 10, 2004 4
PORTLAND AREA CARBON MONOXIDE MAINTENANCE PLAN OREGON STATE IMPLEMENTATION PLAN VOLUME 2, SECTION 4.58: 4.58.0 Acknowledgement and Summary Oregon Department of Environmental Quality (DEQ) acknowledges the critical contributions that Metro (the Portland area regional government) made in developing this air quality CO maintenance plan. Special recognition is deserved for:
• Metro’s transportation modeling used to determine on-road mobile emissions for baseline and future forecast years;
• Metro’s lead role in developing Transportation Control Measures for the CO maintenance plan; and
• The Transportation Policy Alternatives Committee, Joint Policy Advisory Committee on Transportation and Metro Council for reviewing and providing input on the transportation-related components of the CO maintenance plan.
Other contributors are listed below: Principal Author: Dave Nordberg
Contributors: Oregon Department of Environmental Quality Annette Liebe Dick Pedersen Audrey O’Brien David Collier Brian Finneran Marianne Fitzgerald Bruce Hope Kevin McCrann Wes Risher Monica Russell Jeff Stocum Chris Swab Metro Andy Cotugno Mark Turpel Bill Stein
Portland Area Carbon Monoxide Maintenance Plan December 10, 2004 5
Other Agencies Mike Boyer (Washington Department of Ecology) Mark Kendall (Oregon Department of Energy) Glenn Montgomery (Oregon Economic and Community Development Department) Brent Searle (Department of Agriculture) David Stewart-Smith (Oregon Department of Energy)
Portland Area Carbon Monoxide Maintenance Plan December 10, 2004 6
4.58.1 Introduction 4.58.1.0 Purpose of the Second Maintenance Plan This is the second air quality maintenance plan developed to document and ensure continued attainment of the National Ambient Air Quality Standard (NAAQS) for carbon monoxide (CO) in the Portland, Oregon CO Attainment Area. The plan is written to comply with the federal Clean Air Act and the policies of the U.S. Environmental Protection Agency (EPA).
4.58.1.1 History of CO Problem in the Portland Area On March 3, 1978, the EPA officially found that the Portland region failed to meet the 8-hour CO standard and designated the Portland metropolitan area as ”nonattainment” for that pollutant. On June 20, 1979, the Oregon Department of Environmental Quality (DEQ) submitted a CO Control Strategy to EPA as required by the 1977 Clean Air Act. At the same time, DEQ requested an extension of the 1982 deadline for attaining the 9 parts per million (ppm) CO NAAQS. When DEQ submitted the CO Control Strategy, the area’s design value (a numerical index of air quality) was 65% higher than the standard allowed. That value was based on measurements at the Central Air Monitoring Station from 1977 to 1979. EPA approved DEQ’s plan and gave the Portland CO Nonattainment Area until the end of 1987 to come into compliance.
Although CO concentrations improved, the area’s initial attempts to achieve the standard failed as did many other nonattainment areas throughout the nation. After the 1990 amendments to the Clean Air Act were enacted, EPA classified the Portland-Vancouver region as a moderate nonattainment area for CO and extended the deadline for compliance to the end of 1995. In November 1995, the EPA divided the Portland-Vancouver interstate control area into separate nonattainment areas for each state.
In 1996, monitoring demonstrated that the area achieved the air quality standard and was eligible for redesignation to attainment. Therefore, in 1996 DEQ submitted the first Portland Area CO Maintenance Plan to EPA demonstrating that the area would continue to maintain the CO standard ten years into the future and requested official redesignation to attainment. In 1997, EPA approved the new plan and officially designated the Portland area as attainment for CO.
CO concentrations in the Portland area continue to be significantly better than the air quality standard requires. However, the Clean Air Act requires DEQ to develop this second 10-year maintenance plan to ensure that the area will continue to achieve the NAAQS into 2017.
4.58.1.2 National Ambient Air Quality Standards for Carbon Monoxide This CO Maintenance Plan addresses the CO NAAQS as defined by EPA pursuant to the federal Clean Air Act.
CO is a colorless, odorless gas that displaces oxygen in the body’s red blood cells through normal respiration. The major human-caused source of CO is incomplete combustion of carbon-based fuels primarily through the use of gasoline-powered motor vehicles. Other important sources of CO emissions are woodstoves, open burning and
Portland Area Carbon Monoxide Maintenance Plan December 10, 2004 7
industrial boilers. Most serious CO concentrations occur during winter in urban areas, when cooler temperatures promote incomplete combustion and when CO emissions are trapped near the ground by atmospheric inversions.
EPA established the NAAQS for CO at 35 parts per million (ppm) for a 1-hour average and 9 ppm over an 8-hour average. 40 CFR part 50.8 defines how ambient air quality monitoring data are to be compared to the applicable NAAQS. It states that monitoring data should be expressed to one decimal place, and that standards defined in parts per million should be compared “in terms of integers with fractional parts of 0.5 or greater rounding.” EPA interprets this rule to mean that any 8-hour CO concentration less than 9.5 ppm meets the standard. Any CO value monitored at or above 9.5 ppm is an exceedance. Two exceedances in one calendar year constitute an air quality violation. Therefore, it is the second highest CO concentration that is critical in determining if an area attains the air quality standard.
In general, demonstrating attainment of the standard requires monitoring ambient air quality using approved measuring instruments and procedures and verifying the results with a formal quality assurance/quality control program. All of the monitored locations within an area must be lower than the de facto standard of 9.5 ppm to remain in attainment. Air quality measurements in the Portland area easily satisfy this requirement as shown in Section 4.58.2 of this document.
4.58.1.3 Maintenance Plan Criteria/Organization of Document Section 175A and related provisions of the Clean Air Act establish the criteria that must be satisfied for an air quality maintenance plan update:
• Attainment of NAAQS for CO • Full approval of the State Implementation Plan (SIP) under section 110(k)* • Demonstration that air quality improvement is due to permanent and enforceable
emission reductions (see section 4.58.2.4) • Full approval of CO maintenance plan under section 175A • Fulfillment of all applicable Section 110 requirements*
The following sections summarize these criteria and refer to additional discussion of each topic elsewhere in this document. *Section 110 describes general provisions needed for a SIP. Section 110(k) addresses Clean Air Act requirements applying to the redesignation of a specific area to attainment.
Attainment Verification A maintenance area must continue to meet the applicable NAAQS. Attainment of the NAAQS for CO in the Portland area is discussed in Section 4.58.2, “Attainment Demonstration.”
SIP Approval EPA must have fully approved the applicable SIP for the area pursuant to Section 110(k) of the CAA. EPA approved the Portland Area CO Attainment Plan Oct. 7, 1982 and the 1985 revision on Feb. 13, 1987.
Portland Area Carbon Monoxide Maintenance Plan December 10, 2004 8
Section 110 requirements were addressed by the Portland Area CO Maintenance Plan and the area’s requested redesignation to attainment adopted by the Oregon Environmental Quality Commission on Jul. 12, 1996 and approved by EPA to be effective Oct. 2, 1997. Permanent and Enforceable Improvements in Air Quality Permanent and enforceable reductions in emissions and improved ambient CO concentrations in the Portland area are discussed in section 4.58.2.4, “Permanent and Enforceable Improvements in Air Quality.” Maintenance Plan Elements Section 175A of the Clean Air Act requires DEQ to submit a revision to the original CO maintenance plan eight years after redesignation that demonstrates maintenance of the air quality standard for an additional ten year period. This revision modifies the original CO maintenance plan and includes the following maintenance plan requirements: Section 4.58.3: [Continued] Attainment Emissions Inventory Section 4.58.3: [Continued] Maintenance Demonstration Section 4.58.4: Commitment to Continue Operating a Monitoring Network Section 4.58.4: Commitment to Continue to Verify Attainment Section 4.58.3: Contingency Plan
Portland Area Carbon Monoxide Maintenance Plan December 10, 2004 9
4.58.2 CONTINUED ATTAINMENT DEMONSTRATION 4.58.2.1 Ambient Air Quality Monitoring Program The Portland area has three CO monitoring sites (see Appendix D9-1). One site is located in downtown Portland and the other two sites are located on Portland’s eastside. The downtown site is at the Postal Building on SW 3rd Ave. between Alder and Washington Sts. The Portland eastside sites are at SE 82nd Ave. at Division St. and SE 58th at Lafayette. The 3rd Avenue Postal Building site has recorded CO concentrations since 1988 and since 2002 operates all year. The remaining monitoring sites operate from October through March. The SE 58th at Lafayette monitor is a neighborhood scale installation that tracks a number of pollutants and has operated since 1981. The SE 82nd at Division site was established in 1989. Historical sites (those that have been discontinued) include monitors at SW 4th Ave. between Alder and Washington Sts.; the Central Air Monitoring Station (CAMS) at West Burnside between SW Broadway and SW 8th Ave.; and the Hollywood Station at 4112 NE Sandy Blvd. The CAMS station was shut down after three years of complying data so monitoring could be shifted to the SW 3rd Ave. site where concentrations appeared to be higher. The SW 4th and Alder station operated year-round until 2002 when the station was discontinued after recording14 years of complying CO concentrations. Monitoring at the Hollywood site was stopped after six years of complying measurements. During the CO season, monitors run continuously with 1 hour and 8 hour average CO concentrations being derived electronically via data loggers and integrators. After the results are reviewed for quality assurance, the measurements are entered into the Aerometric Information Retrieval System (AIRS) to provide EPA with DEQ’s air quality data. 4.58.2.2 Summary of Ambient CO Data Each recording of a CO concentration higher than the NAAQS is an exceedance. Two exceedances at a given monitor in a single year constitute a violation. Monitors in downtown Portland demonstrate that area last violated the CO NAAQS in 1984. The site at SE 82nd Ave. at Division last violated the CO standard in 1989. The last exceedance of the CO NAAQS in downtown Portland occurred Feb. 1, 1991 (10.6 ppm) at 3rd Ave. Based on short term monitoring during the winter of 1984-1985 and follow up monitoring at two different eastside locations, DEQ installed a permanent monitor at 82nd at Division in 1989. The last exceedance at that site occurred on Jan. 31, 1991 (10.2 ppm). The highest and second highest CO concentrations at each of the Portland area monitors over the past decade are shown below:
Portland Area Carbon Monoxide Maintenance Plan December 10, 2004 10
Table 1 Highest CO Concentrations: 1993 to 2003
1-HOUR AVERAGES 8-HOUR AVERAGES STATION LOCATION AND NUMBER YEAR
Portland 4th & Alder was shut down on 3/31/2002 and does not have a complete data set.
Portland Area Carbon Monoxide Maintenance Plan December 10, 2004 12
A graph of the second highest 8 hour CO average at each of the Portland area monitors is shown below: Figure 1 CO Trends – 1982 to 2003 4.58.2.3 Permanent and Enforceable Improvement in Air Quality Permanent Emission Reductions Control strategies included in the initial maintenance plan period were: Federal Motor Vehicle Control Program (establishing emission standards for new motor vehicles). Vehicle Inspection and Maintenance Program Basic Test: 1975 to 1980 model year vehicles Enhanced Test: 1981 through 1995 vehicles On Board Diagnostic (OBD) Test: 1996 to 4+ year old vehicles Wintertime Oxygenated Fuel Major New Source Review with Best Achievable Control Technology (BACT) Transportation Control Measures 2040 Growth Concept & Land use Measures
Increased Transit Service Expanded Light Rail Transit System Central City Transportation Management Plan (selected portions) Expanded Bicycle and Pedestrian Facilities
1982 - 2003 Portland CO Second High 8hr Average Trends
0.0
2.0
4.0
6.0
8.0
10.0
12.0
14.0
D at e
Hollywood
4th & Alder
SE Lafayette
Postal Bldg
82nd & DivisionCO Std. = 9 ppm
Portland Area Carbon Monoxide Maintenance Plan December 10, 2004 13
Contingency Plan Representative Baseline Period As a condition of redesignation to attainment, EPA requires that air quality improvements not be the result of temporary factors such as slow economic periods or unusually favorable meteorology. While that requirement does not necessarily pertain to areas that were previously redesignated to attainment, the “Probabilistic Rollback” technique of establishing regional airshed capacity (described in 4.58.3.) is based on the 11 year period between 1992 and 2002. Use of this long term base period removes any need to demonstrate that a single baseline year is not an anomaly. 4.58.2.4 Demonstration That DEQ’s CO Network May Reasonably Be
Considered Representative Of Worst Case CO Concentrations This section presents evidence that the locations of the DEQ monitors for CO represent “worst case” or peak level concentrations. Specific elements include: • wide ranging field sampling conducted by DEQ to identify areas with high peak CO
levels, • screening techniques used to identify intersections with apparent potential for high
CO concentrations, and • historical field studies showing that the DEQ CO network tends to record higher CO
concentrations than screened intersections. 4.58.2.4.1 Comprehensive CO Field Studies DEQ has vigorously tried to identify the localized areas that experience the highest peak CO concentrations. It conducted studies that included monitoring at more than 100 locations during the winters of 1984-85, 1988-89, and 1993-94. When those special studies identified areas that seemed to have higher CO levels than the existing network, DEQ added new monitoring sites. Those actions resulted in the addition of the CO sites at 510 SW 3rd Ave. (Postal Building) and 82nd Avenue at Division. These studies demonstrate that the DEQ CO site network can reasonably be considered representative of worst case CO concentrations. DEQ conducted a meteorological evaluation of general conditions present during those special sampling studies. That analysis is presented in the second portion of Appendix D2-2 of the original Portland Area Carbon Monoxide Maintenance Plan adopted in 1996. That analysis found that the conditions present during the 1984-85 sampling period included typical average winter conditions (with a number of especially high wind speed days). The protocol for selecting sampling days was changed for the 1988-89 and 1993-94 field studies to capture a higher percentage of sampling days with lower wind speeds and poorer air dispersion conditions. Findings from those studies provide a reasonable basis for concluding that the DEQ CO monitoring network appears to be representative of worst case conditions.
Portland Area Carbon Monoxide Maintenance Plan December 10, 2004 14
4.58.2.4.2 Screening Technique Used To Identify Intersections With Potential For High CO Concentrations.
To identify the Portland area intersections with the greatest potential to produce high CO concentrations, Metro (the local Metropolitan Planning Organization) used its EMME 2 Travel Demand Model to determine which intersections experience the highest CO emissions from mobile sources. To do this, Metro calculated the total amount of CO emissions produced at the top 25 intersections in the Portland area for a 24 hour period. For the purpose of this calculation, the approaching legs of each intersection were normalized to 1/20th of a mile to approximate the length of one city block. This technique has several advantages over the traditional method of assessing worst case intersections. The traditional method involves multiplying the traffic volume at a given intersection by the quotient of the intersection’s volume divided by its capacity. The formula is expressed as V*V/C. One difficulty with this approach is that it depends on data collected by several different jurisdictions in the metropolitan area, which invariably introduces inconsistencies that cannot be fully reconciled. An additional shortcoming is that the V*V/C algorithm does not directly account for the emission factors of the mix of vehicles (and varying CO emission rates of those vehicles) that are present at specific locations. In contrast, the EMME 2 approach used by Metro applies a single assessment technique that is consistent for intersections in each of the 24 local jurisdictions in the Portland metropolitan area. The travel demand model technique also has the advantage of estimating intersection emissions using Mobile 6.2 emission factors that are applicable for the traffic speeds and vehicle mix that are characteristic of specific locations. Applying this technique indicates that the six intersections with the greatest potential for producing high CO concentrations are: Table 3 Intersections with the Highest CO Approach Leg Emissions (grams
per day) Intersection 1999 Value 2020 Value 1. SE McLoughlin (OR 99E) at SE Bybee 105,250 48,893 2. Cascade Hwy. (OR 213) at Washington St. not in top 25 48,692 3. SE McLoughlin (OR 99E) at SE Holgate 88,696 44,770 4. SE McLoughlin (OR 99E) at SE 17th Ave. 90,555 44,085 5. Mt. Hood Hwy (US 26) at SE Palmquist not in top 25 40,954 6. Pacific Hwy. (OR 99W) at SW Hall Blvd. 94,357 39,144 [Note: Intersection emissions for 1999 are calculated with oxygenated fuel. Emission projections for 2020 are calculated without oxygenated fuel.] These locations are to be taken as representing the three intersections with the heaviest traffic volumes plus the three intersections with the worst level of service (LOS). Therefore, they are to be used in meeting the requirements for CO “hot spot” analyses cited in the transportation conformity rules at OAR 340-252-0240(1)(a)(C) and (D). 4.58.2.5 Conclusions Regarding Demonstration of Continued Attainment
Portland Area Carbon Monoxide Maintenance Plan December 10, 2004 15
Ambient air monitoring results demonstrate that since the Portland area was redesignated to attainment of the CO air quality standard, CO concentrations have fallen steadily. That trend reflects a national pattern of newer vehicles producing considerably reduced amounts of CO. The “probabilistic rollback” method used to establish the Portland area’s airshed capacity (to accommodate CO emissions) is based on data from eleven consecutive years. That long baseline period eliminates the need to demonstrate that a single baseline or design value year reflected typical economic and meteorological conditions. The intersection assessment technique described in section 4.58.2.4.2 provides an objective indication of the Portland area intersections (including approaching legs) that have the highest potential to produce elevated CO concentrations in the future. Designating these intersections means they will receive additional scrutiny under the transportation conformity rules (hot spot analysis) if they are affected by a future transportation project.
Portland Area Carbon Monoxide Maintenance Plan December 10, 2004 16
4.58.3 MAINTENANCE PLAN Section 175A of the Clean Air Act section requires a state to submit a second maintenance plan to EPA 8 years after an area is redesignated to attainment. The new maintenance plan must demonstrate that the area will continue to meet the air quality standard for an additional 10-year period (Nov. 1, 2007 through Feb. 28, 2017). However, the existing Motor Vehicle Emissions Budgets must be updated using a new computer model of mobile emissions (Mobile6) before the next Metropolitan Transportation Improvement Program can demonstrate that its projects will not cause more vehicle emissions than the air quality plan allows. Therefore, the revised emissions budgets need to be approved by the Environmental Protection Agency (EPA) in 2005 to avoid interruption of the transportation project approval process. To minimize such disruptions, this maintenance plan and its emissions analyses address the years 2005 through 2017 so the plan can take effect early--as soon as it is approved by EPA. This updated Carbon Monoxide (CO) Maintenance Plan demonstrates that the CO NAAQS will not be violated in the Portland area throughout the plan period. 4.58.3.1 Attainment Inventory As part of the Portland Area CO Maintenance Plan update, DEQ developed an attainment emission inventory for the year 1999. The CO emission inventory reflects detailed estimates of CO emissions from all sources on a typical winter day. Emissions are grouped in four major categories: Industrial (Point) Sources, On-Road Mobile Sources, Non-Road Mobile Sources, and Area Sources. The emissions inventory is used in conjunction with ambient air quality monitoring to determine the capacity of the region’s airshed to accommodate CO emissions without violating the CO standard. The 1999 baseline year was originally chosen because that year reflected the highest ambient CO concentrations in Portland’s recent history and therefore represented a conservative base year for demonstrating future compliance with the CO NAAQS. The effect of this choice of baseline years was later minimized, however, when EPA Region 10 requested that the Probabilistic Rollback technique of calculating airshed capacity be applied instead of a single baseline year. The Probabilistic Rollback approach is discussed in Appendix D9-6. The 1999 emissions were based on actual industrial emissions rather than permitted emissions. On-road motor vehicle emissions were calculated using EPA’s Mobile 6.2 emissions factor model in a link based analysis using Metro’s EMME2 travel demand model. The baseline inventory reflected the use of oxygenated fuel in the Portland area and a vehicle inspection and maintenance program using basic and enhanced vehicle testing. Details are provided in the 1999 Emissions Inventory, Appendix E, Table 3, which is summarized by Table 4 below:
Portland Area Carbon Monoxide Maintenance Plan December 10, 2004 17
Table 4 1999 Annual and Seasonal CO Emissions
CO Emissions
Area / County Source Type Annual
(tons/year)
Seasonal Day
(lbs/day) Portland CO MA Stationary Point * 19,159 106,590 Stationary Area 77,942 809,455 Mobile Non-Road 121,669 372,098 Mobile On-Road 278,333 1,525,114 Total CO MA 497,103 2,813,257 * includes 25 mile buffer sources
Traditionally, the “design value” (an index of air quality in relation to the 9 ppm air quality standard) is based on the emissions inventory on a single baseline year. The proportion of that design value to the air quality standard is then used to establish regional airshed capacity. For example, if emissions in the baseline year totaled 100,000 lbs. of CO per winter day, and if the design value for that period were 4.5 ppm (half the allowable 9 ppm standard), one can calculate that the airshed could experience twice the inventoried emissions (or 200,000 lbs. per winter day) before reaching the 9 ppm CO standard. In reality, the design value for 1999 was 6.2 ppm, or 69% of the CO standard. However, EPA suggested that DEQ apply a “Probabilistic Rollback” technique for calculating airshed capacity, noting that it is based on a multiple year period and is statistically more robust. See Appendix D9-6. This technique is also more conservative in that it focuses on the 99% confidence interval for baseline year emissions. Applying this technique produces the plot for the controlling CO monitor located at 82nd Avenue at Division St. as shown in Figure 2. Using the Probabilistic Rollback technique, the 99% upper bound confidence interval for the year 1999 is 7.55 ppm or 83.9% of the 9 ppm CO standard. The 7.55 ppm value is used as the de facto design value for purposes of this CO maintenance plan. Proportioning 1999 CO emissions of 2,813,25 lbs. per winter day up to the level at which ambient CO concentrations would reach the 9 ppm CO limit,indicates that the airshed should be able sustain 3,347,776 lbs. of CO emissions per winter day. This calculation of airshed capacity is done at the 99% confidence interval, meaning that with emissions at the 3,347,776 lbs. per winter day limit, the region has only a 1% chance of violating the air quality standard in a given year. (The reciprocal of 83.9% is 119%, therefore regional airshed capacity can be computed as 2,813,256 lbs. per day times 119% = 3,347,776 lbs. per day at the 99% confidence interval.)
Portland Area Carbon Monoxide Maintenance Plan December 10, 2004 18
Figure 2 CO Concentration 99% Confidence Interval at 82nd & Division
Demonstration of Maintenance for CO Using Probabilistic ModelSite: 82nd & Division
Observed CO Concentrations: 1992-2002 99% Confidence Interval: 1992-2002
0.0
2.0
4.0
6.0
8.0
10.0
12.0
92 93 94 95 96 97 98 99 00 01 02
Year
2nd
Max
CO
(ppm
)
9 ppmUpper Bound99% Confidence Interval
2nd Max Trend Liney = -0.4036x + 8.1582
R2 = 0.775
De Facto Design Value 7.55 ppm
4.58.3.2 Maintenance Demonstration CO emissions within the Portland area airshed were estimated for future years as described in the Emission Inventory (SIP Volume 2, Section 4.58, Appendix D9-4). Emissions projections were completed for the years 2005, 2010, and 2020. Emissions for 2017 (the final year of the plan) were determined by interpolating between the 2010 and 2020 analysis years. While emissions for the 1999 baseline year were estimated with oxygenated fuel, projections of future emissions reflect the removal of the oxygenated fuel requirement for the Portland area effective Oct. 31, 2005. Future projections also assume that 1981 through 1995 vehicles are tested by the “basic” inspection and maintenance test rather than the “enhanced” test currently required. This assumption in demonstrating future compliance allows that change to be made in the future and is discussed in Section 4.58.3.2.2. Baseline and future CO emissions (summarized from Emissions Inventory Appendix D9-4) are shown below:
Portland Area Carbon Monoxide Maintenance Plan December 10, 2004 19
Table 5 Pounds of CO Per Winter Day
1999 2005 2010 2017 Industrial Emissions 106,590 67,401 71,085 76,241 Area Sources 809,454 872,852 925,684 999,648 On-Road Emissions 1,525,114 1,226,323 619,753 834,301 Non-Road Emissions 372,098 530,435 975,074 690,469 Total: 2,813,256 2,679,011 2,591,596 2,600,659 Table 6 Tons of CO Per Year
1999 2005 2010 2017 Industrial Emissions 19,159 11,957 12,610 13,525 Area Sources 77,944 84,029 89,152 96,323 On-Road Emissions 278,333 223,804 177,951 142,769 Non-Road Emissions 121,669 159,595 182,459 203,516 Total: 497,105 479,385 462,172 456,133 Several trends in emissions between the 1999 baseline year, and final year of the CO maintenance plan merit comment. First, the large decrease in industrial emissions between 1999 and 2005 is the result of permanent closure of a large aluminum company. Second, on-road emissions decrease steadily in the future due to the increased effectiveness of emission control devices of modern cars and trucks. Third, CO emissions from non-road vehicle are projected to increase substantially from 1999 to 2017. That increase reflects the projected growth in the future use of non-road equipment. Finally, total CO emissions are projected to stay well below the calculated airshed capacity of 3,347,776 lbs. of CO per winter day throughout the life of the new CO maintenance plan. See projected allowable emissions in Table 8, below. 4.58.3.2.1 Motor Vehicle Emissions Budgets (MVEBs) Federal and state transportation conformity regulations require that on-road mobile emissions produced by the Portland area’s regional transportation system remain within the amount anticipated by this CO maintenance plan. Motor Vehicle Emissions Budgets (MVEB) are therefore set as provided in Table 7 below. MVEBs are established in relation to projected future vehicle emissions. Given the large safety margin between projected future emissions and airshed capacity, CO MVEBs were set using forecasted on-road motor vehicle emissions plus an additional safety margin. Emissions budgets for 2005 and 2010 reflect 1% per year more than the on-road motor vehicle emissions forecast available when the Joint Policy Advisory Committee on Transportation (JPACT) and Metro Council recommended budget amounts. The budget for 2017 reflects 1% per year above the forecast, plus 1.5% annual growth for an additional 20 years.
Portland Area Carbon Monoxide Maintenance Plan December 10, 2004 20
This approach will allow Metro as the Metropolitan Planning Organization (MPO) to write a 20 year Regional Transportation Plan (RTP) in 2017 (the final year of the Second CO Maintenance Plan) that is able to demonstrate conformity until 2037--the last possible year of the 2017 RTP. The resulting CO budgets are shown below: Table 7 CO Motor Vehicle Emissions Budgets (lbs. per winter day) 2005 2010 2017 1,238,575 1,033,578 1,181,341 4.58.3.2.2 Control Measures This update of the Portland Area CO Maintenance Plan includes several changes to the control strategies included in the initial CO maintenance plan. Modified and unchanged control strategies follow: Subregions The original CO maintenance plan included motor vehicle emissions budgets for two subregions: the Central Business District of downtown Portland and 82nd Ave. corridor (Division to Woodstock). These subregional budgets have not limited emissions in either area and air quality monitoring in each subregion shows that CO concentrations continue to improve. DEQ finds these subregional budgets provide no benefit but add an administrative burden to Metro’s conformity demonstrations. Therefore, subregional emissions are not continued in this plan. Central City Transportation Management Plan (CCTMP) The Portland Area CO Maintenance Plan developed in 1996 incorporated many provisions of the Portland CCTMP as Transportation Control Measures. These provisions are highly complicated to interpret and enforce and are not continued in the updated CO maintenance plan. The full CCTMP, however, remains in force as requirements of the City of Portland. Oxygenated Fuel The Clean Air Act Amendments of 1990 mandated the use of wintertime oxygenated fuel in areas such as Portland that failed to meet the National Ambient Air Quality Standard for CO. Since then, Portland’s CO concentrations have improved significantly, and oxygenated fuel has a far lower CO reduction benefit. This reduced benefit is largely due to the increasing prevalence of improved catalytic converters and computerized engine controls which effectively minimize emissions without fuel additives. Since the oxygenated fuel requirement was adopted as a means to control levels of ambient CO, and the requirement is no longer needed for that purpose, this CO maintenance plan discontinues the oxygenated fuel requirement effective Oct. 31, 2005. Inspection and Maintenance Program
Portland Area Carbon Monoxide Maintenance Plan December 10, 2004 21
Under DEQ’s existing vehicle emissions testing program in the Portland area,1975 to 1980 vehicles are subject to the basic test, 1981 through 1995 vehicles are subject to the enhanced test and 1996 and newer vehicles are subject to the On Board Diagnostics (OBD) test. The OBD test is quicker and more effective than the enhanced test and will become increasingly dominant as 1996 and newer vehicles become an ever larger portion of the fleet. This CO maintenance plan therefore modifies the SIP to replace the enhanced test requirement for 1981-1995 vehicles with the quicker and easier “basic” (two speed idle) emissions test. This change is a change to the SIP only. The vehicle testing rules for 1981-1995 vehicles will remain unchanged because the Portland Area Ozone Maintenance Plan continues to require enhanced testing to control ozone precursors. However, if a similar modification is evaluated and found to not interfere with maintenance of the ozone standard, the rule change to replace enhanced testing with basic testing will be pre-approved within the CO plan.
Until the Inspection/Maintenance requirement in the rules for 1981 through 1995 vehicles (enhanced testing) is changed to align with the test requirement in the CO maintenance plan (basic testing), DEQ will consider vehicles that meet the enhanced test requirement as also meeting the basic test requirement. Forecasts of future emissions in this CO maintenance plan are calculated on the premise that 1981 through 1995 vehicles are subject to the basic emissions test. This change increases CO emissions in 2005 by 15,960 lbs. per winter day (1.4% of on-road motor vehicle emissions for that year). Major New Source Review The CO maintenance plan continues the existing requirement that new and expanding industrial sources apply the level of emissions control equipment described as Best Available Control Technology (BACT). The plan also continues to offer an Industrial Growth Allowance that may be used by new or expanding sources instead of securing emissions offsets (as described below). Industrial Growth Allowance The current CO maintenance plan continues the existing CO industrial growth allowance of 14,880 lbs. per day or 2700 tons per year. The owner or operator of a proposed major source or major modification may apply to DEQ for an allocation of the growth allowance in lieu of providing an emission offset. The DEQ will allocate the growth allowance on a first-come, first-served basis until the allowance is depleted. No applicant may be awarded more than 50% of the available allowance or 10 tons per year (whichever is greater) unless the Oregon Environmental Quality Commission approves an exception. DEQ will report the use the growth allowance to EPA Region 10 for each period described in Section 4.58.4.4 “Administrative Requirements.” Each report is due within 12 months following the end of each activity period. If the Portland area violates the CO standard, use of the growth allowance will be suspended as described in the Contingency Plan below. Transportation Control Measures (TCMs)
Portland Area Carbon Monoxide Maintenance Plan December 10, 2004 22
This CO Maintenance Plan includes Transportation Control Measures which are measures that reduce emissions by reducing vehicle use, and that must be implemented under the transportation conformity rules. The TCMs in this CO maintenance plan replace the TCMs specified in the first Portland Area CO Maintenance Plan. The emission reduction benefits of these TCMs are included in the emission projections on which the Portland Area CO Maintenance Plan is based. The revised TCMs are as follow: 1. Transit Service Increase: Regional transit service revenue hours (weighted by capacity) shall be increased 1.0% per year. The increase shall be assessed on the basis of a 5 year rolling average of actual hours for assessments conducted between 2006 and 2017. Assessments made for the period through 2008 shall include the 2004 opening of Interstate MAX. 2. Bicycle Paths: Jurisdictions and government agencies shall program a minimum total of 28 miles of bikeways or trails within the Portland metropolitan area between the years 2006 through 2017. Bikeways shall be consistent with state and regional bikeway standards. A cumulative average of 5 miles of bikeways or trails per biennium must be funded from all sources in each Metropolitan Transportation Improvement Program (MTIP). Facilities subject to this TCM must be in addition to those required for expansion or reconstruction projects under ORS 366.514.
3. Pedestrian Paths: Jurisdictions and government agencies shall program at least nine miles of pedestrian paths in mixed use centers between the years 2006 through 2017, including the funding of a cumulative average of 1½ miles in each biennium from all sources in each MTIP. Facilities subject to this TCM must be in addition to those required for expansion or reconstruction projects under ORS 366.514.except where such expansion or reconstruction is located within a mixed-use center. Contingent TCMs This CO maintenance plan includes several measures that will become TCMS under the transportation conformity rules if an index of per person vehicle travel (Vehicle Miles Traveled per capita) increases certain amounts for two consecutive years. These provisions are included in this maintenance plan under the Contingency Plan, Part B, Phase 2. 4.48.3.3 Total Projected CO Emissions In addition to normal growth projected for the future, this plan allows CO emissions to increase through the industrial growth allowance and full use of the Motor Vehicle Emissions Budget. If emissions grow to the maximum allowed under each of these mechanisms, total future CO emissions will be as shown:
Portland Area Carbon Monoxide Maintenance Plan December 10, 2004 23
Table 8 Total Projected CO Emissions w Growth Allowance and max. MVEB
(lbs. CO per winter day)
2005 2010 2017 Industrial Emissions 67,401 71,085 76,241 (Growth Allowance) 14,880 14,880 14,880 Area Sources 872,852 925,684 999,648 On-Road MVEB 1,238,575 1,033,578 1,181,341 Non-Road Emissions 530,435 619,753 690,469 Total: 2,724,143 2,664,980 2,962,579 4.58.3.4 Contingency Plan The CO maintenance plan must contain contingency measures that will be implemented in the event of a violation of the CO standard or other triggering mechanisms contained in the plan. This contingency plan includes two sets of contingency measures. The provisions specified under Part A of the Contingency Plan are linked to ambient concentrations of CO. The provisions specified under Part B of the Contingency Plan are linked to increases in the average amount of vehicle use per person. Part A, Phase 1: Risk of Violation If monitored (8-hour) CO levels at any site within the Portland area on the National Air Monitoring System or the State and Local Air Monitoring System registers a second high concentration equaling or exceeding 90% (8.1 ppm) of the 9 ppm CO National Ambient Air Quality Standard during a calendar year, DEQ will form a planning group to evaluate the implementation of additional emission reduction strategies. Within six months of the validated 90% second high CO concentration, the planning group will recommend which additional control strategies (if any) should be applied to prevent or correct any violation of the 8-hour CO standard. Additional strategies to be considered include, but are not limited to: a) increased parking pricing in the Central City, b) increased funding for transit, c) value pricing on major roadways that increase vehicle travel capacity, d) a trip reduction program, e) modified regional parking ratios, and f) accelerated implementation of bicycle and pedestrian networks. If a third 8-hour CO concentration exceeds 90% of the CO standard in a single calendar year, the planning group may evaluate additional potential actions or take no further action if the third exceedance was due to an exceptional event.
Portland Area Carbon Monoxide Maintenance Plan December 10, 2004 24
Part A, Phase 2: Actual Violation Section 175A(d) of the Clean Air Act provides that any control strategies removed upon redesignation to attainment must be reinstated if the area violates the air quality standard. The provisions of this section of the Contingency Plan are dictated by that Clean Air Act requirement. If the Portland area violates the NAAQS for CO, the following contingency measures will automatically be implemented: a) New Source Review requirements for proposed major sources and major modifications in the maintenance plan area (and the area of significant air quality impact) will be changed. The requirement to install BACT will be replaced with a requirement to install Lowest Achievable Emissions Rate (LAER) technology. In addition, the Industrial Growth Allowance established in Section 4.58.3.2 will be eliminated. These requirements will take effect upon validation of the violation. BACT and a growth allowance may be reinstated if provided for in a new maintenance plan adopted by the Environmental Quality Commission (EQC) and approved by EPA. b) The requirement to use wintertime oxygenated fuel in Clackamas, Multnomah, Washington, and Yamhill Counties will be reinstated. c) The downtown parking lid will be reinstated. (This measure will be implemented only if the violation occurs in the downtown area formerly subject to the parking lid requirement.) Part B, Phase 1: 5% VMT Increase Metro will review and verify the local average vehicle miles traveled per capita (VMT/capita) derived from the most recent estimates of population and daily vehicle miles traveled from federal and state sources. If daily VMT/capita exceeds 20.5 daily VMT/capita (a 5 % increase above the 2002 rate) for two successive years, the Standing Committee [TPAC, as defined at OAR 340-252-0060(2)(b)(A)(iii)] shall be convened to: a) determine whether there is a data problem with the trigger;
b) if there is not a data problem with the trigger, identify and analyze the
effectiveness of those local actions that could reduce air pollutant emissions; and,
c) determine whether a recommendation should be made to JPACT to initiate local action to reduce VMT/capita until the 2002 level is once again attained.
Portland Area Carbon Monoxide Maintenance Plan December 10, 2004 25
Part B, Phase 2: 10% VMT Increase Metro will review and verify local VMT/capita values derived from the most recent estimates of population and daily vehicle miles traveled from federal and state sources.
If average daily VMT/capita exceeds 21.5 miles (a 10 percent increase above the 2002 rate) for the Oregon portion of the Portland-Vancouver Air Quality Maintenance Area for two successive years, the following measures will become required Transportation Control Measures for the region (as determined by the programming of funds for specified projects):
a) Washington County Commuter Rail within six years after exceeding the 21.5 VMT/capita rate, b) Interstate 205 Light Rail Transit (I-205 LRT) within six years after exceeding the 21.5 VMT/capita rate; c) An increase of efforts for the Regional Travel Options Program sufficient to increase the number of employers reached by the program by at least 5 % per year the number of employers currently subject to the DEQ Employee Commute Options program. Alternatively, specific projects from the Regional Transportation Options program could be substituted.
d) An increase of funding of at least 5% per year greater than current funding for Transit Oriented Development projects.
e) Other programs or projects consistent with state and federal law as may be determined by the Metro Council after consultation with the Joint Policy Advisory Committee on Transportation.
Portland Area Carbon Monoxide Maintenance Plan December 10, 2004 26
4.58.4 ADMINISTRATIVE REQUIREMENTS Administrative requirements related to compliance with Clean Air Act provisions are described below. 4.58.4.1 State Implementation Plan (SIP) Requirements Portland meets all requirements for the State Implementation Plan (SIP) specified in Section 110 of the federal Clean Air Act. Section 110 requires a former nonattainment area to provide for the implementation, maintenance and enforcement of an air quality standard. 4.58.4.1.1 Summary of Fully Approved SIP The Portland Carbon Monoxide Attainment Plan adopted in 1979 and amended in 1982 plus the Portland Area Carbon Monoxide Maintenance Plan adopted in 1996 applied a variety of control strategies to control CO emissions. Because motor vehicles generate the majority of CO emissions in the Portland area, control strategies focused on transportation control measures. EPA approved the attainment plan in October 1982. Strategies in that CO maintenance plan included: a. A vehicle inspection and maintenance program for vehicles registered in the control area. The program became mandatory in 1975 and required affected vehicles to pass a biennial emission inspection before being registered. In the program’s first twelve years, the vehicle inspection program achieved more than a 25% reduction in CO emissions. b. Improved public transit in the Portland metropolitan area that included expanded service, a downtown transit mall, bus shelters, park and ride lots, exclusive bus lanes, and a “fareless square” area in downtown Portland. c. An area-wide carpool program offered by TriMet (the regional transit service) since 1974. The program encouraged ride-sharing and included a ride-matching service and incentives, such as reduced or free parking rates in downtown Portland for carpool vehicles. d. A light rail line linking downtown Portland to Gresham on the east side of the metropolitan area. e. Traffic flow improvements, including installation of computerized traffic signals and parking limitations on several streets in downtown Portland. f. Establishment of bicycle lanes and other programs to encourage cycling as a travel option. g. A downtown parking and circulation program that included a maximum number of parking spaces allowed in the downtown area, improved roads to divert traffic away from downtown, a program to encourage “employee flex time” by downtown businesses, etc. h. Federal Motor Vehicle Emissions Control Program.
Portland Area Carbon Monoxide Maintenance Plan December 10, 2004 27
In addition to the control measures cited in the attainment plan, Portland implemented several projects after the original 1979 plan submittal that benefited air quality. These included: a. More transit improvements, especially a new route system for TriMet that increased ridership up to 25,000 passengers per day within 3 years of implementation. b. Increased bus purchases and service improvements. c. Transit fare incentives, including monthly bus passes at a reduced rate. d. More ramp metering at freeway entrances. e. Additional traffic flow improvements, especially the connection of traffic signals in the Coliseum area, Hall Blvd. by Tualatin Valley Hwy. and Denny Rd., construction of the Tualatin Bypass, and establishment of one way couplets in residential areas in Northwest Portland. f. McLoughlin Corridor Rideshare program. g. Employer bicycle planning project similar to rideshare program already in place. h. Legislation to encourage ridesharing. i. Shop and Ride program. j. City of Portland Bicycle Parking program. k. A program for flexible employee working hours. l. Traffic signal system project that more efficiently coordinated and interconnected traffic signals throughout Portland. m. Downtown Portland air quality plan under the CO attainment plan, including: • Maintaining a downtown parking inventory and establishing a maximum parking ratio. • Measures to improve downtown traffic circulation (e.g., improved road connections
and limiting new off street parking facilities). • Measures to encourage employee flexible working hours. • Measures to promote bicycling. • Measures to encourage ridesharing. • Measures to improve transit. n. City of Portland employee travel project that included a reduction in work-related travel. o. Construction of Westside Light Rail. 4.58.4.1.2 1990 Clean Air Act Amendments
Portland Area Carbon Monoxide Maintenance Plan December 10, 2004 28
The 1990 Amendments to the Clean Air Act placed additional requirements on the Portland area. These included the following: a. 1990 emission inventory (to be revised every three years thereafter). b. Oxygenated gasoline. c. Vehicle Inspection and Maintenance Program modifications. d. Transportation Conformity Rules. e. New Source Review Rules for major sources. f. Contingency Measures. 4.58.4.2 Monitoring Network and Commitments DEQ will continue to comply with the air monitoring requirements of Title III, Section 319 of the Clean Air Act. DEQ will continue to operate the monitoring sites in compliance with EPA monitoring guidelines set out in 40 CFR Part 58 “Ambient Air Quality Surveillance” and Appendices A through G of Part 58. In addition, DEQ will continue to comply with the “Ambient Air Quality Monitoring Program” specified in Volume 2, Section 6 of the SIP. Further, DEQ will continue to operate and maintain the network of State and Local Air Monitoring Stations (SLAMS) and National Air Monitoring Stations (NAMS) in accordance with the terms of agreement between DEQ and EPA Region 10. 4.58.4.3 Verification of Continued Attainment DEQ will analyze CO air quality monitoring data once each year to verify continued attainment of the CO standard as required by 40 CFR Part 50 and EPA guidance. This data, along with data from previous years, will be used to determine whether the region continues to attain the NAAQS. DEQ will also prepare an updated “growth factor” emission inventory summary if the second highest 8-hour CO concentrations exceed 85% (or 7.6 ppm) of the 9 ppm CO standard during any three year reporting period. Growth factor reporting year will be 2007, 2010, 2013 and 2016. The growth factor emission inventory updates will be submitted to EPA within 12 months following the end of the periodic emission inventory calendar year. In preparing the updates, DEQ will review the emission factors, rule effectiveness and penetration factors, and other significant assumptions used in the emission forecast. DEQ will confirm or adjust these factors if more accurate data are available. Any new emission sources will be included in the update. If the second highest 8-hour CO concentrations remain below 85% of the standard, no reports will be submitted. DEQ will compare the updated emission summary to the emission inventory and forecast in Appendix E, Table 3 to evaluate any changes that have occurred. If there have been significant changes, DEQ will consult with EPA Region 10 to determine if a more extensive periodic emission inventory is necessary. If a more detailed inventory is needed, it will be submitted to EPA within 23 months after the end of the reporting year.
Portland Area Carbon Monoxide Maintenance Plan December 10, 2004 29
4.58.4.4 Maintenance Plan Commitments As part of the CO maintenance plan, DEQ commits to do the following:
• If monitored CO concentrations exceed 85% of the 8-hour CO standard, DEQ will prepare periodic emission inventory updates for 2007, 2010, 2013 and 2016. (When required, the emission inventory updates will be submitted to EPA within 12 months following the end of the periodic emission inventory calendar year specified in Section 4.58.4.3);
• Report activity in the CO industrial growth allowance program for the periods
2005 -2007, 2008-2010, 2011-2013 and 2014-2016. (These reports will be submitted to EPA within 12 months following the end of each period.); and
• Maintain documentation of approved TCM substitutions as specified in Appendix
D9-2 Substitution of Transportation Control Measures
In the event that a Transportation Control Measure (TCM) is not included in the Regional Transportation Plan or Transportation Improvement Program in the time frame contained for that measure in this maintenance plan adopted by the Environmental Quality Commission (EQC), the parties in the interagency consultation process established pursuant to OAR 340-252-0060 shall assess whether such measure continues to be appropriate. Where Metro and the DEQ concur that a transportation control measure identified in the SIP is no longer appropriate, the agencies may initiate the process described in this Appendix to identify and adopt a substitute transportation control measure. A substitute TCM must provide for equivalent or greater emissions reductions than the measure contained in the maintenance plan. (Those reductions are identified in Appendix D9-3 of the Portland Area CO Maintenance Plan.) In addition, a replacement TCM must be implemented in the time frame established for the existing TCM contained in this plan. Where such implementation date has already passed, TCMs selected pursuant to this Appendix that require funding must be included in the first year of the next TIP and long range plan adopted by Metro. The substitute TCMs must be fully implemented within two years after the implementation date of the original measure in order to be a basis for a finding of timely implementation under OAR 340-252-0140. In order for the EQC to adopt substitute TCMs under this Appendix, there must be evidence of adequate personnel, funding and authority under State or local law to implement and enforce the measures. Commitments to implement the substitute TCMs must be made by the agency with legal authority for implementation. Metro will convene a committee (or working group) to identify and evaluate possible substitute measures. The committee shall include members from all affected jurisdictions, state and/or local air quality agencies and local transportation agencies. In addition, the working group shall consult with EPA. Consultation with EPA may be accomplished by sending copies of all draft and final documents, agendas and reports to EPA Region 10. Metro, DEQ and EPA Region 10 must concur with the appropriateness and equivalency of the substitute TCM. All substitute measures must be adopted by the EQC following the public comment period and EPA’s 14-day concurrence period described below. The TCM to be replaced shall stay in effect until the substitute measure has been adopted. The TCM to be replaced must be rescinded for the new TCM substituted pursuant to this Appendix to be effective. By adopting a substitution under this Appendix, the EQC formally rescinds the previously applicable TCM and adopts the substitute measures. Prior to adopting a substitute measure under this Appendix, the substitute TCM(s) must have been subject to a public hearing and comment process. This means there must be at least one public hearing on the substitution. The hearing can only be held after reasonable public notice, which will include the following elements at least 30 days prior to the hearing:
• notice given to the public by prominent advertising in the area affected announcing the date, time and place of the hearing;
• availability of each proposed plan or revision for public inspection in at least one location in each region to which it will apply;
• notification to interested parties in accordance with the Oregon Administrative
Procedures Act;
• notification to the Administrator (through the Region 10 Office);
• notification to the Southwest Washington Air Pollution Control Agency and the Washington Department of Ecology; and
• notification of the chief executives of affected local governments, planning
agencies, transportation agencies, environmental control agencies, and economic development agencies.
A description of the TCM(s) and analysis supporting the proposal, including assumptions and methodology, must be made available to the public, DEQ and EPA Region 10 within a reasonable time before the public hearing, and at least 30 days prior to the close of the comment period. DEQ shall submit to EPA Region 10 a summary of comments received during the public comment period along with DEQ’s responses following the close of the public comment period. EPA shall notify DEQ within 14 days if the Agency’s concurrence with the substitution has changed as a result of the public comments. Where EPA fails to notify DEQ within 14 days, EPA is deemed to concur. The analysis of substitute measures under this Appendix must be consistent with the methodology used for evaluating measures in the maintenance plan. Where emissions models and/or transportation models have changed since those used for purposes of evaluating measures in the maintenance plan, the TCM to be replaced and the substitute measure(s) shall be evaluated using the latest modeling techniques to demonstrate equivalent or greater emissions reductions will be achieved through implementation of the substitute TCM(s). Key methodologies and assumptions that must be consistent, and reconciled in the event of a discrepancy, are, for example:
• EPA approved regional and hot-spot (for CO and PM-10) emissions models;
• The area’s transportation model; and
• Population and employment growth projections. DEQ will maintain documentation of approved TCM substitutions. The documentation will provide a description of the substitute and replaced TCMs, including the requirements and schedules. The documentation will also provide a description of the substitution process including the committee or working group members, the public hearing and comment process, EPA’s concurrence, and EQC adoption. The documentation will be submitted to EPA following adoption of the substitute measure by EQC, and made available to the public as an attachment to the maintenance plan. See Section 4.58.4.4, Maintenance Plan Commitments.
Carbon Monoxide Emission Reduction Benefits of Transportation Control Measures (TCM)
To calculate the air quality benefits of the transit, pedestrian and bicycle transportation control measures in the 2004 Portland Area Carbon Monoxide Maintenance Plan, the following methodology has been used and air quality benefits estimated. It should be noted that the methodologies used are intended to be very conservative when estimating the air quality benefits. That is, it is likely that the emission reductions likely to occur from the implementation of these TCMs is likely to be greater than the estimates. In addition, these control measures also reduce other air pollutants and toxics not included in the CO Maintenance Plan. Accordingly, actual benefits will likely result in healthier air than those estimated. In addition, these estimates are based on averages and benefits may vary widely depending on improvement locations. The emission reduction benefits of these TCMs are included in the emission projections on which the Portland Area CO Maintenance Plan is based. Transit Service Increase The transit TCM is to increase transit service hours by one percent per year, weighted by transit service type (bus, light rail). In 2003 the total revenue hours reported by TriMet were 1,677,156 hours that resulted in 88,863,600 boarding rides (62,743,200 bus boardings and 26,120,400 rail boardings). Assuming that a ratio of revenue hours to ridership is more or less constant1, a one percent change in reported 2003 revenue hours would result in an annual ridership of 89,751,153 (63,370,632 bus and 26,381,604 rail boardings). Subtracting the one year difference results in an estimate of a one year increase of yearly ridership of 888,553 (bus 627,432 and 261204 for LRT), which on a daily basis would be an increase of 2,843 riders. These riders are assumed to take the average transit trip, which is 5.9 miles in length. Using the same assumptions that were used by the region in estimating benefits for the Portland metropolitan area CMAQ program (6.66 grams per mile for CO), the following CO air quality benefit for bicycle improvements was estimated. Air Quality Benefit of Transit Improvements CO Emission Benefit 246.3 pounds per day 1 Although this estimate is based on an assumption that the ratio will be constant, Metro's travel forecasting computer models of the transportation system of the region suggest that as the region's population and jobs grow that the transit system will become much more efficient and therefore more riders will be attracted without spending as much revenue. However, in keeping with the intent of the methodology (to conservatively estimate benefits), a constant ratio is assumed.
Bicycle Paths Metro has measured existing bike usage in the region through an extensive household survey, accounting for trip types, economic, demographic, and geographic location factors. Future trip demand is forecast by allocating expected growth of jobs and households as allowed by existing land use plans, expected changes in the demographics of households and employment, and the addition of planned transportation facilities. To forecast new bike trips attributable to the bike projects proposed in the Regional Transportation Plan’s financially constrained system, data was accessed for the years 2004 and 2025 for bike trips in the region for an average weekday. From this data, the growth in bike trips was calculated by subtracting the 2004 base year bike trips from the forecasted year 2025 bike trips. Using the Stuart Goldsmith methodology to calculate travel mode diversion in Seattle, Washington, an average modal share increase of 26% was calculated to be induced by the provision of new bicycle facilities. Of these newly induced bicycle trips, 75.9% are calculated to be diverted from auto travel in proportion to the auto mode share of all trips. 2004 Bike Trips (Average Weekday)
2025 Bike Trips (Average Weekday)
New Bike Trips 2004 to 2025 (Average Weekday)
New Bike Trips induced by new bicycle projects
New Bike Trips induced by new bike projects diverted from auto trips
77,132 145,339 68,207 17,734 13,460 The length of bicycle projects in the financially constrained system within the region expected to be constructed by 2025 was then calculated. Dividing the length of improvements by the number of induced new bike trips provides a regional average of induced bike trips per length of bike improvements in the region. This figure may be used as a method for providing substitution projects to provide an equivalent air quality benefit to a specific length of bike project in the Metro region. Miles of new bike projects in region (Financially Constrained RTP)
Daily Bike Trips induced by new bike projects (Financially Constrained RTP)
Miles of new bike projects proposed for TCM
Daily Bike Trips induced by new TCM bike projects
68.3 13,460 28 5,518 Using the same assumptions that were used by the region in estimating benefits for the CMAQ program (6.66 grams per mile for CO) and an average of 2.1 miles average bike trip length in the region, the following CO air quality benefit for bicycle improvements was estimated. Air Quality Benefit of Bicycle Improvements CO Emission Benefit 170.1 pounds per day
Pedestrian Paths Metro has measured existing pedestrian usage in the region through an extensive household survey, accounting for trip types, economic, demographic, and geographic location factors. Future trip demand is forecast by allocating expected growth of jobs and households as allowed by existing land use plans, expected changes in the demographics of households and employment, and the addition of planned transportation facilities. To forecast new pedestrian trips attributable to the pedestrian projects proposed in the Regional Transportation Plan’s financially constrained system, data was accessed for the years 2004 and 2025 for walk trips in the mixed-use areas surrounding those pedestrian projects for an average weekday. From this data, the growth in pedestrian trips was calculated by subtracting the 2004 base year walk trips from the forecasted year 2025 walk trips. Ten percent of the new walk trips were assumed to be induced by the proposed pedestrian projects in the financially constrained system. The remaining 90% of new walk trips were assumed to either switch from walking to another trip mode or to occur without the proposed projects in the financially constrained system. Of these newly induced walk trips, 75.9% are calculated to be diverted from auto travel in proportion to the auto mode share of all trips. 2004 Walk Trips in Mixed-use areas (Average Weekday)
2025 Walk Trips in Mixed-use areas (Average Weekday)
New Walk Trips 2004 to 2025 (Average Weekday)
New Walk Trips induced by new pedestrian projects
New Walk Trips induced by new pedestrian projects diverted from auto trips
118,521 287,511 168,990 16,889 12,819 The length of pedestrian projects in the financially constrained system within these Centers (mixed-use areas, including residential and employment, especially retail and office commercial uses in close proximity) expected to be constructed by 2025 was then calculated. Dividing the length of improvements by the number of induced new walk trips provides a regional average of induced walk trips per length of pedestrian improvements within mixed-use areas. This figure may be used as a method for providing substitution projects to provide an equivalent air quality benefit to a specific length of pedestrian project in the Metro region. Miles of new pedestrian projects in mixed-use areas (Financially Constrained RTP)
Daily Walk Trips induced by new pedestrian projects (Financially Constrained RTP)
Average Daily Walk Trips induced by mixed use area pedestrian projects (Financially Constrained RTP)
Average Daily Walk Trips induced by mixed use area pedestrian projects using TCM goal of 9 miles
Using the same assumptions that were used by the region in estimating benefits for the CMAQ program (6.66 grams per mile for CO) and an average of 1/2 mile average pedestrian trip length in the region, the following air quality benefit for pedestrian improvements in mixed use centers was estimated. Air Quality Benefit of Pedestrian Improvements in Mixed Use Areas CO Emission Benefit 0.9 pounds per day
Appendix D9-4 of Portland Area CO Maintenance Plan: Emsissions Summary and Forecast (Derived from the Emission Inventory)
Actuals Actuals Actuals Actuals Actual Actual Actual Actual Actual Actual Actual Actual Actual Actual Actual Actual Actual Actual Actual Actual Actual ActualPOINT SOURCES 106,590 94,364 64,455 65,191 65,928 66,665 67,401 68,138 68,875 69,611 70,348 71,085 71,821 72,558 73,295 74,031 74,768 75,505 76,241 76,978 77,715 78,451
Percent of Base Case 4% 3% 2% 2% 2% 2% 3% 3% 3% 3% 3% 3% 3% 3% 3% 3% 3% 3% 3% 3% 3% 3%Percent of Base Case 4% 3% 2% 2% 2% 2% 2% 3% 3% 3% 3% 3% 3% 3% 3% 3% 3% 3% 3% 3% 3% 3%
1) On-road Mobile Sources Emissions are modeled only for years 1999, 2005, 2010 and 2020. Emissions for intermediate years are calculated on the basis of a polynomial line interpolation between these four analysis years.2) Point sources emissions were projected out from the most current year the actuals were calculated for. 3) Selected Scenario represents emissions with oxygenated fuel and Enhanced I/M Test in 1999, all other modeled years (2005, 2010, 2020) have no oxygenated fuel and a Basic I/M program as control measures.
2020_PDX CO Summary Growth Table(1993 to 2020 Seasonal CO Summary) Page 1 of 2
SIP Development Plan Portland CO Maintenance Plan No. 2
Technical Analysis Protocol
Final Purpose In 1997 EPA approved Portland’s CO Maintenance Plan and redesignated the region to attainment for carbon monoxide. The Clean Air Act requires that the original maintenance plan be updated 2 years before that plan expires. In the case of Portland, a new Carbon Monoxide Maintenance Plan must be submitted to Region 10 by Dec. 31, 2004. The purpose of this SIP Development Plan is to facilitate a common understanding between Oregon DEQ and EPA Region 10 concerning how this work will be done. Background The Portland area is the last region in the state to require the wintertime use of oxygenated fuel. DEQ expects the potential removal of the oxy-fuel requirements to be the leading issue addressed by this update. The Department expects CO concentrations to be a decreasing problem in the future, and thinks that a strong case for continued attainment can be made without extensive analysis. There are circumstances in which EPA policy considers a reduced level of analysis to be appropriate for resdesignation to attainment. For example, EPA’s Limited Maintenance Plan policy allows an area to be redesignated if it has a design value less than 85% of the NAAQS. Under the policy an agency needs to compile a new “attainment year” inventory, continue AQ monitoring and retain a contingency plan. In addition, the limited plan approach relieves the agency of completing a future year emissions projection, and future conformity determinations are “presumed to pass.” However, the limited plan is not to be applied if an area intends to remove any previous control strategies. Because the Department may rescind oxygenated fuel for Portland as part of the second plan, we are restricted to the traditional approach. Yet, other circumstances indicate that “full” maintenance plan requirements could require more than is reasonably necessary to ensure continued attainment. EPA’s guidance for maintenance plans is geared to areas seeking redesignation to attainment, and not for areas solidly in attainment and only needing to renew the first maintenance plan. Furthermore, carbon monoxide is commonly shown to be of decreasing concern and oxy-fuel is known to have much less benefit than previously supposed. Finally, Portland’s worst second-high 8-hour CO value in recent years is 69% of the NAAQS—a value that allows twice the safety margin that is needed to in order to use the limited plan approach if oxy fuel were to be retained. Therefore, Oregon DEQ would like to use a modified approach to demonstrate that Portland will continue to attain the CO standard during its second maintenance plan period.
The principle feature of this proposal is that Portland’s maintenance demonstration will be based on regional emissions. We offer the following outline of requirements for evaluation and discussion: Overview Portland has continuously attained the CO standard since it was redesignated in 1997. The 1997 maintenance plan projected continued attainment both with and without oxyfuel. (However EPA’s review and approval did not address the no-oxy scenario.) Monitoring of ambient CO concentrations shows continued air quality improvement. Mobile 6.2 gives a much more optimistic view of future CO emissions than Mobile 5. M6.2 shows higher emissions before 2005 (during baseline) and lower emissions after 2005 These effects multiply the likelihood that Portland’s carbon monoxide concentrations will remain below the carbon monoxide standard by an increasing margin. The update process is likely to remove the requirement to use oxy-fuel. Air Quality Demonstration DEQ intends to indicate the agency’s intentions for assembling an emission inventory by submitting an “Individual Source Summary Table” instead of an Emission Inventory Preparation Plan. Oregon will prepare a new baseline Emissions Inventory for 1999, the period with the highest CO concentration in recent years. Airshed capacity will be determined using a Probabilistic Rollback (linear regression) technique as recommended by EPA Region 10. Emissions will be calculated on the basis of pounds of carbon monoxide per CO season day. Motor Vehicle emissions will be adjusted from an annual average weekday (five day average) to an average winter day (seven day average) using seasonal adjustment factors. The seasonal adjustment factors are calculated by Metro from Highway Performance Monitoring System data collected by Oregon Department of Transportation. Because the probabilistic rollback technique of determining airshed capacity incorporates variations in ambient concentrations over an eleven year period, there is no need for a meteorological assessment to demonstrate that the baseline period is represents typical weather conditions. The 1999 baseline emission inventory will tally actual industry (point source) emissions.
Maintenance Demonstration DEQ will demonstrate that a return to nonattainment is unlikely. DEQ will forecast future regional emissions for the beginning and end of the second maintenance plan period. The projections for these years will demonstrate the effect that rescinding the oxyfuel requirement would have on motor vehicle emissions. If those demonstrations show that oxy-fuel requirements can be lifted, subsequent emissions projections need only address the non-oxy-fuel condition (assuming total emissions remain below airshed capacity). Additional projections of motor vehicle emissions may be used to develop emissions budgets beyond the time span of the plan to demonstrate compliance with the transportation conformity rules. Future projections of motor vehicle emissions without oxygenated fuel will be based on the permanent enforceable level of oxygenating agent required in Portland’s fuel supply. Future industrial emissions will be calculated on the basis of “expected actual emissions.” Future projections will address regional emissions using a proportional approach to demonstrating maintenance of the air quality standard. The relationship of baseline emissions to airshed capacity will be in proportion to the design value’s relation to the NAAQS. I.e., 6.2 ppm DV is to 9 ppm NAAQS as base year emissions are to airshed capacity. DEQ anticipates that this analysis will show that motor vehicle emissions will not increase over baseline, and that therefore hot spot modeling will not be required. We believe this is consistent with EPA’s memo of Sept. 4, 1992 from John Calcagni on the subject of “Procedures for Processing Requests to Redesignate Areas to Attainment. (See the passage on “Maintenance Demonstration” section 5b, paragraph 4.) The maintenance plan period will be 2007 to 2017. The Portland area plan will use 2005 as the first analysis year even though it is prior to the official plan period. DEQ expects this approach will demonstrate that the new Motor Vehicle Emissions Budget (based on Mobile 6.2) and any changes to the oxygenated fuel requirement can be applied upon plan approval and before 2007. Subsequent analysis years will be 2010 and 2017. The second Portland Carbon Monoxide Maintenance Plan will provide permanent and enforceable emission reduction measures, some of which will be included as Transportation Control Measures (TCM) to ensure continued good air quality. The plan will continue the TCM Substitution Process used in the initial plan. The new maintenance plan will provide continued AQ monitoring. The second maintenance plan will include a contingency plan that will reinstate past control strategies—including oxygenated fuel--if a violation occurs.
The plan will provide that periodic emission inventories will be performed using a growth factor analysis. If the analyses indicate that emissions may significantly exceed the amounts projected by the plan, an actual emissions inventory will be conducted to determine if continued attainment is likely. Additional Elements DEQ has found the Motor Vehicle Emissions budgets for two sub-areas of Portland to be inconsequential in controlling emissions and expects to discontinue these additional conformity demonstrations in the new plan.
Probabilistic Rollback for Demonstrating Maintenance
of the National Ambient Air Quality Standard
for Carbon Monoxide in the Portland, Oregon Area
Air Quality Program
Oregon Department of Environmental Quality
September, 2004
1. Background
The Second Portland Area Carbon Monoxide Maintenance Plan must demonstrate how the region will continue to meet the National Ambient Air Quality Standard for Carbon Monoxide through February 28, 2017. An important piece of that demonstration is determining the capacity of the Portland area airshed to accommodate carbon monoxide emissions without violating the 8-hour carbon monoxide standard of 9 parts per million (ppm). To do this, the Oregon Department of Environmental Quality (DEQ) applied a probabilistic rollback technique as described below and in section 4.58.3.1 of Volume 2 of Oregon’s State Implementation Plan.
The probabilistic rollback methodology used for this maintenance demonstration was recommended by EPA Region 10 for use in the Portland area plan as being statistically more robust than previous methods of determining airshed capacity. The simplified technique was developed by the Municipality of Anchorage, and has been applied in carbon monoxide maintenance plans for Anchorage and Fairbanks, Alaska as well as the Puget Sound area in Washington.
The simplified probabilistic rollback uses linear regression analysis, or least-squares analysis, to statistically fit the most suitable straight line through a set of data points. Regression analysis provides a means for estimating both the precision and confidence intervals of the estimated line. Precision is measured by the square of the correlation coefficient, r2, the fraction of the variation in the values of "y" that is explained by the least-squares regression on "x". The r2 value may range from negative one to positive one, in which r2 equals zero determines no linear relationship, and r2 equals plus or minus one represents a perfect linear relationship. Confidence intervals are determined by percent (%) values that range from zero to one, in which the higher the percent value the greater the level of confidence.i For our analysis, "x" is the calendar year and "y" is the observed second highest 8-hour CO concentration. Our confidence interval is 99%--a very high level.
Decreased emissions from new vehicles over the past few decades have significantly reduced total on-road motor vehicle emissions. Changes in "x" (the calendar year) equate to different levels of vehicle emissions, and changes in "y" (the monitored concentrations) reflect different ambient concentrations of CO due to the changes in motor vehicle emissions. Therefore, an r2 value of 0.6 means that 60% of the change in monitored concentrations ("y") may be explained by the change in vehicle emissions ("x"). Note that meteorology can be expected to explain a significant percentage of the changes in monitored concentrations. If 30% of the change in monitored concentrations is due to meteorology, and 10% is due to the background concentration, then an r2 value of 0.6 would demonstrate a strong cause and effect relationship between vehicle emissions and monitored concentrations. For this analysis, an r2 value that approaches 0.6 is considered as demonstrating a "reasonable" statistical fit for a suitable straight line through a set of data points.
2. Overview of Probabilistic Rollback Approach The probabilistic rollback approach shares many similarities with the traditional deterministic rollback approach. The conventional rollback equation is used to determine the reduction required:
% reduction required = 100xppmppmppmppm
bkgdesign
stddesign
−
−
ppmdesign = 2nd highest eight-hour CO concentration recorded during the design year
ppmstd = 8-hour NAAQS for CO
ppmbkg = Background CO concentration
Although this same basic equation is used to determine the reduction required in the probabilistic approach, the method used to estimate the design value is different than that used in previous maintenance plans.
3. Determining Probabilistic Design Values The probabilistic method uses linear regression analyses on the observed second highest 8-hour CO concentration data from the three CO monitoring sites in the Portland area: SE Lafayette at 58th, Postal Building at SW 3rd Ave., and 82nd Ave. at Division. Eleven years of data (1992 – 2002) were examined. The second highest annual CO concentrations shown below were used in a linear regression analysis to determine the best fit trend line and the upper-bound 99% confidence interval for each site using standard statistical procedures.ii The results of these regression analyses are shown in Figures 1 through 3. Each plot shows the observed second highest values for each year, the best-fit regression line, and the calculated upper-bound 99% confidence interval. The graph for each site also identifies the upper-bound 99% confidence interval for 1999 (the year CO emissions were inventoried) as the de facto design value for that
site. The highest de facto design value (7.55 ppm at the 82nd and Division monitor) was applied as the design value for the second Portland area CO Maintenance Plan. Second Highest 8-hour CO Readings at Portland Area Monitors 1992-2002
Demonstration of Maintenance for CO Using Probabilistic ModelSite: 82nd & Division
Observed CO Concentrations: 1992-2002 99% Confidence Interval: 1992-2002
0.0
2.0
4.0
6.0
8.0
10.0
12.0
92 93 94 95 96 97 98 99 00 01 02
Year
2nd
Max
CO
(ppm
)
9 ppmUpper Bound99% Confidence Interval
2nd Max Trend Liney = -0.4036x + 8.1582
R2 = 0.775
De Facto DesignValue = 7.55 ppm
The de facto design value for the SE 82nd and Division Ave. site was used to demonstrate future attainment of the CO air quality standard as described in section 4.58.3 of the maintenance plan.
i Moore, David S., McCabe, George P., Introduction to the Practice of Statistics, 2nd Ed., 1993, W.H. Freeman and Company.
ii Sokol, RR & F Rohlf, FJ (1981). ., “Biometry.” W.H. Freeman & Company, New York. Refer to Box 14.2 (p. 472); (pp. 473-4); Fig. 14.11 (p. 476); text (p. 477).
Relative Toxicity Comparison: Fuel Oxygenated with Gasoline
& Conventional Gasoline Two different fueling schemes (gasoline oxygentated with 10% ethanol by volume and conventional gasoline) produce different amounts (mixtures) of the same five air toxics: acetaldehyde, acrolein, benzene, 1,3-butadiene, and formaldehyde. The question is, all other factors (e.g., exposure, risk, etc.) being equal, how do these two mixtures compare in terms of their potential toxicity? This comparison is based on emissions factors estimated by Mobile 6.2 for the Portland fleet, focusing on the primary compounds addressed as Mobile Source Air Toxics by Mobile 6.2.
This comparison was done by weighting emissions estimates (in mg/mi) for each compound by a common measure of its toxicity: the unit risk estimate (URE) for carcinogens and the reference concentration (RfC) for noncarcinogens. Weights were assigned from “5” for the most toxic to “1” for the least toxic (or “0” if it isn’t a carcinogen), as shown below:
The emission estimate for each air toxic was multiplied by its cancer and noncancer toxicity ranks to give a weighted values. These weighted values were then summed and that sum divided by the sum of the toxicity ranks to give a toxicity-rank-weighted-average that could be used to make a simple comparison between options on the basis of toxicity. These calculations were performed for 2005 and 2020 emission estimates; results are detailed in Tables 1 and 2. With 2005 estimates, the oxy (with ethanol) fuel option has about a 3.5% lower potential for cancer toxicity than does the non-oxy fuel option, but about a 1.6% higher potential for noncancer toxicity. With 2020 estimates, the oxy (with ethanol) fuel option has about a 4.6% lower potential for cancer toxicity than does the non-oxy fuel option, but about a 0.03% higher potential for noncancer toxicity. Depending on the degree of uncertainty in these estimates of 2005 and 2020 emissions, these relative differences in toxicity may not reflect any real difference between the oxy and non-oxy fuel options. Bruce Hope, August 12, 2004


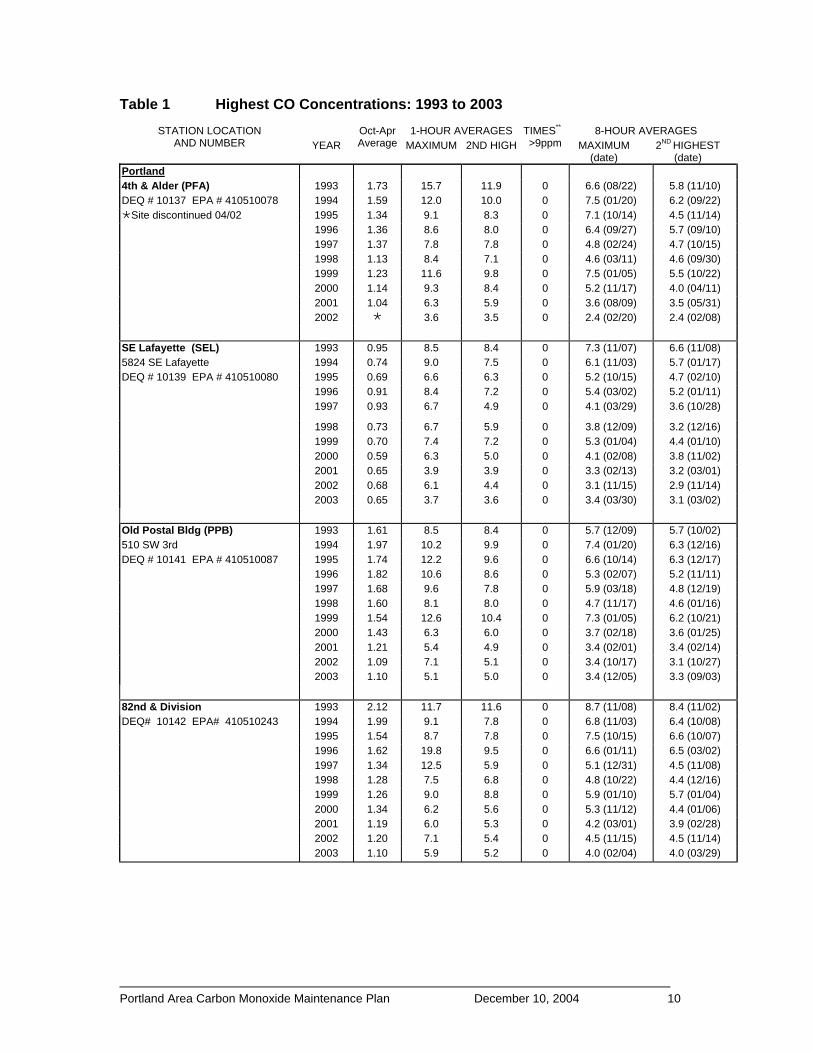

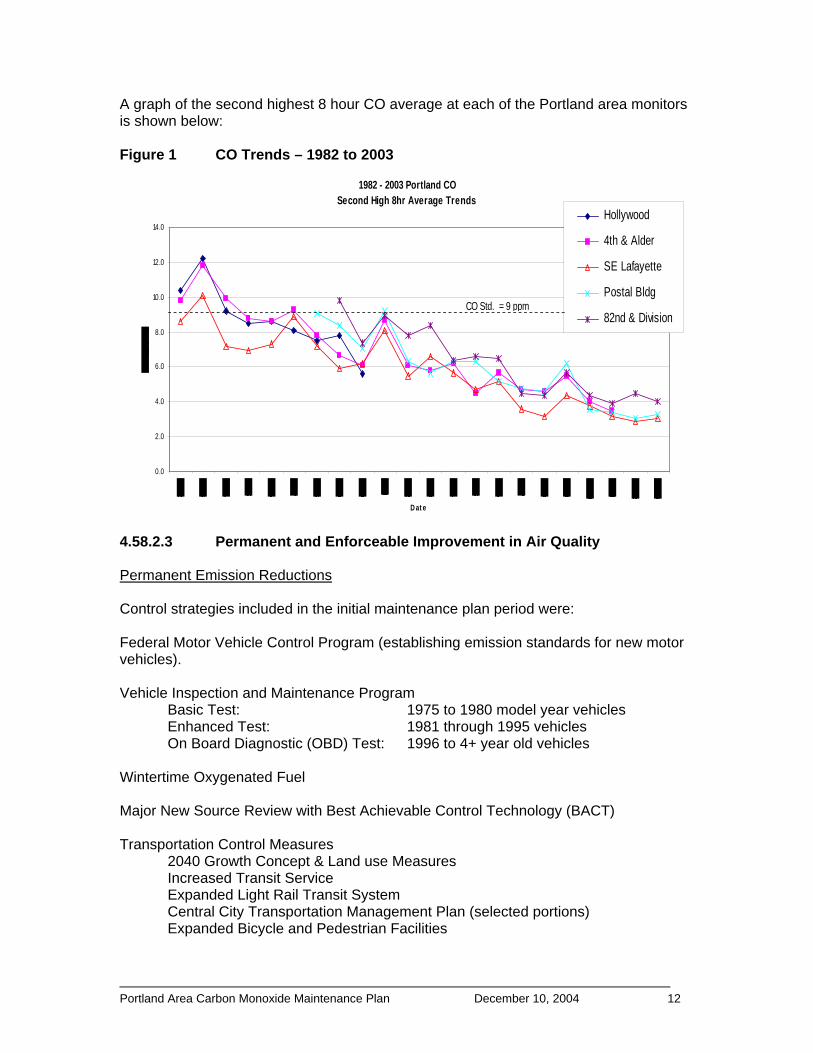

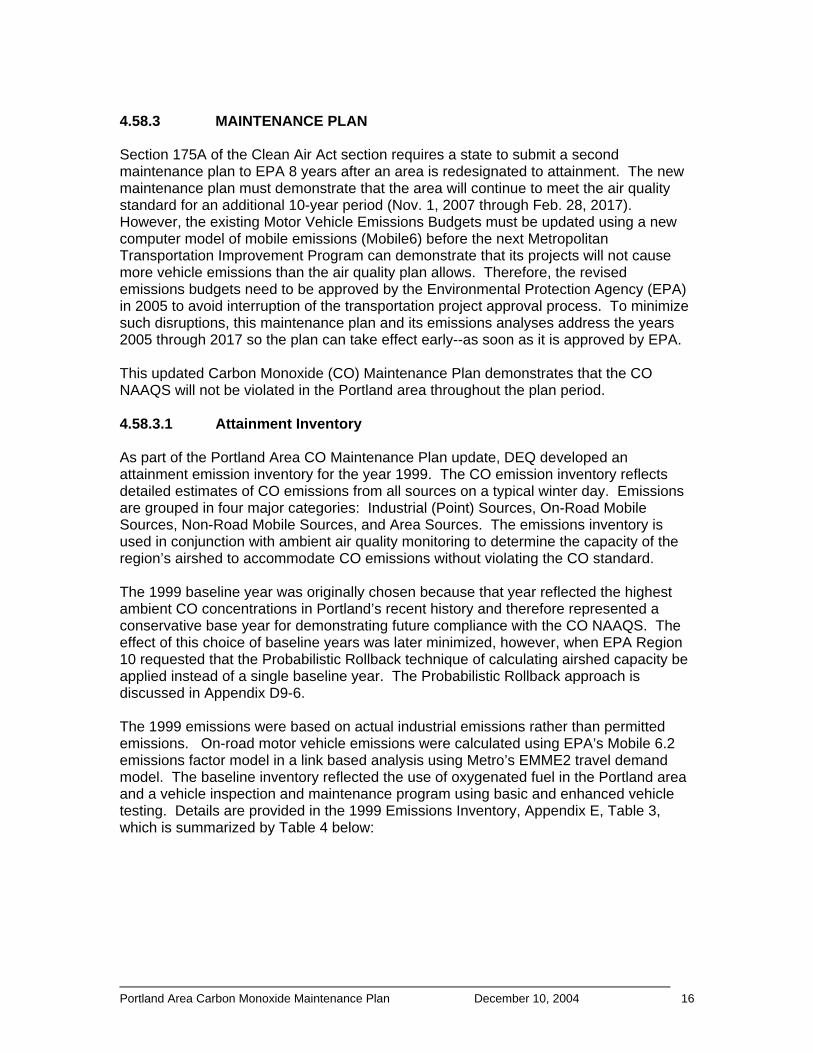
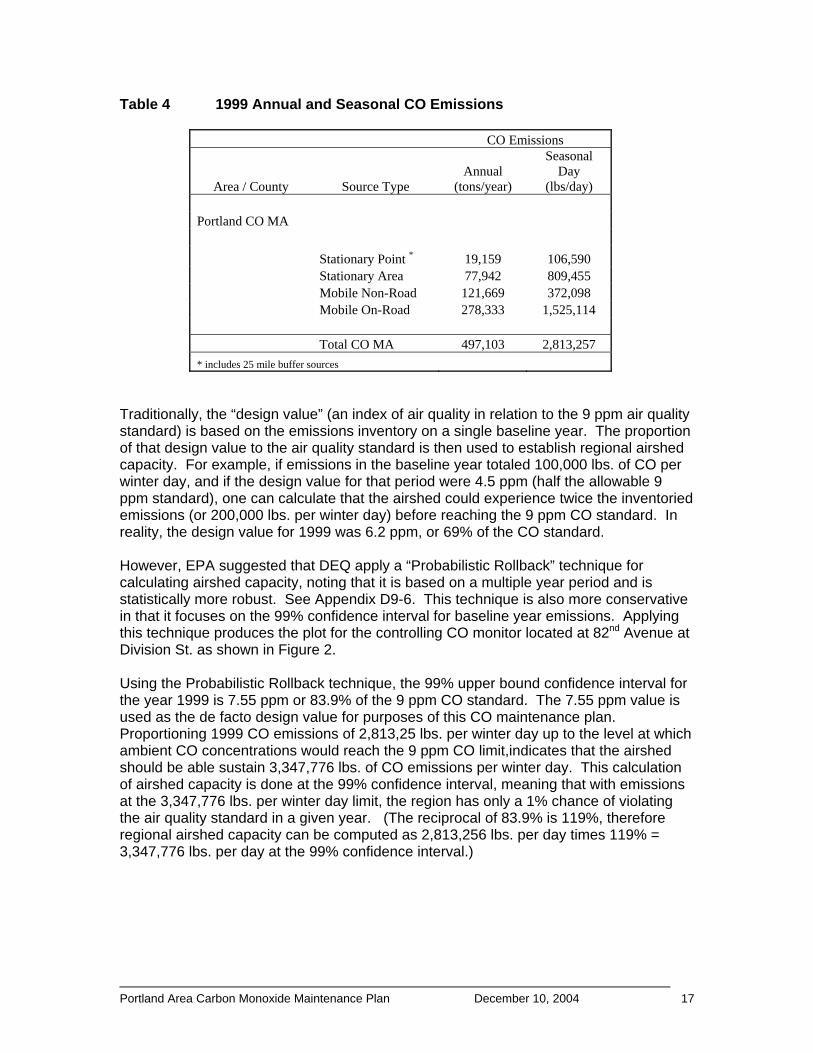
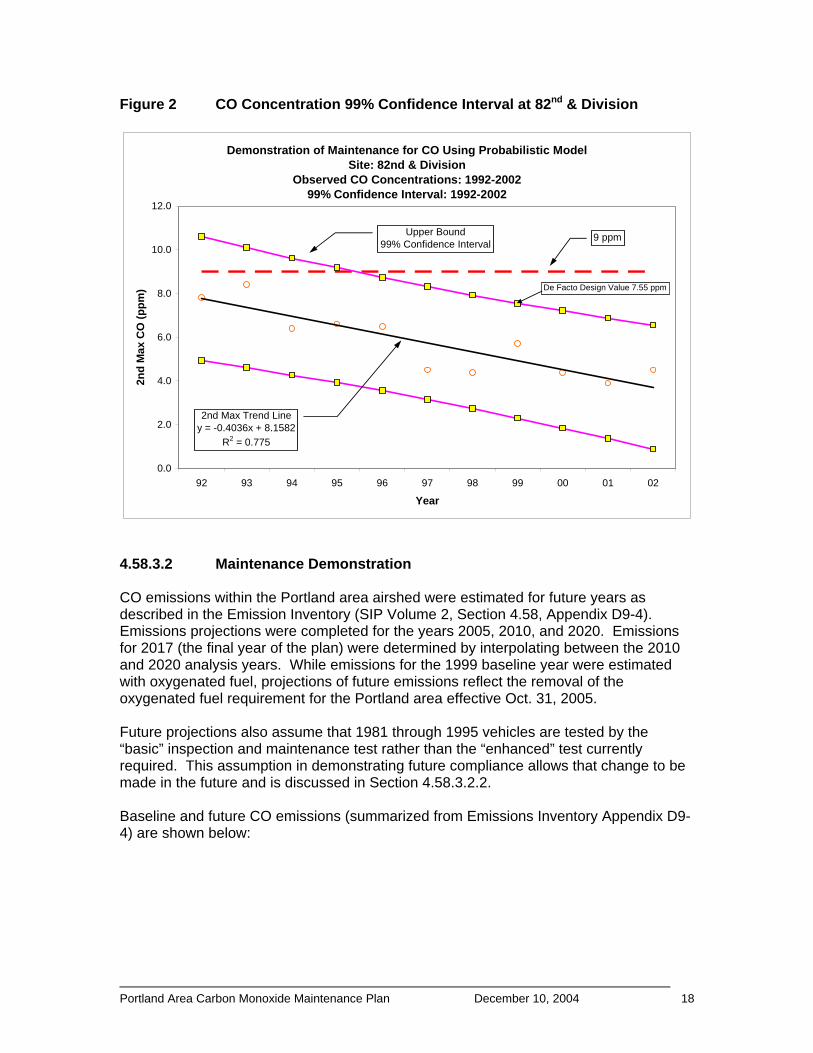
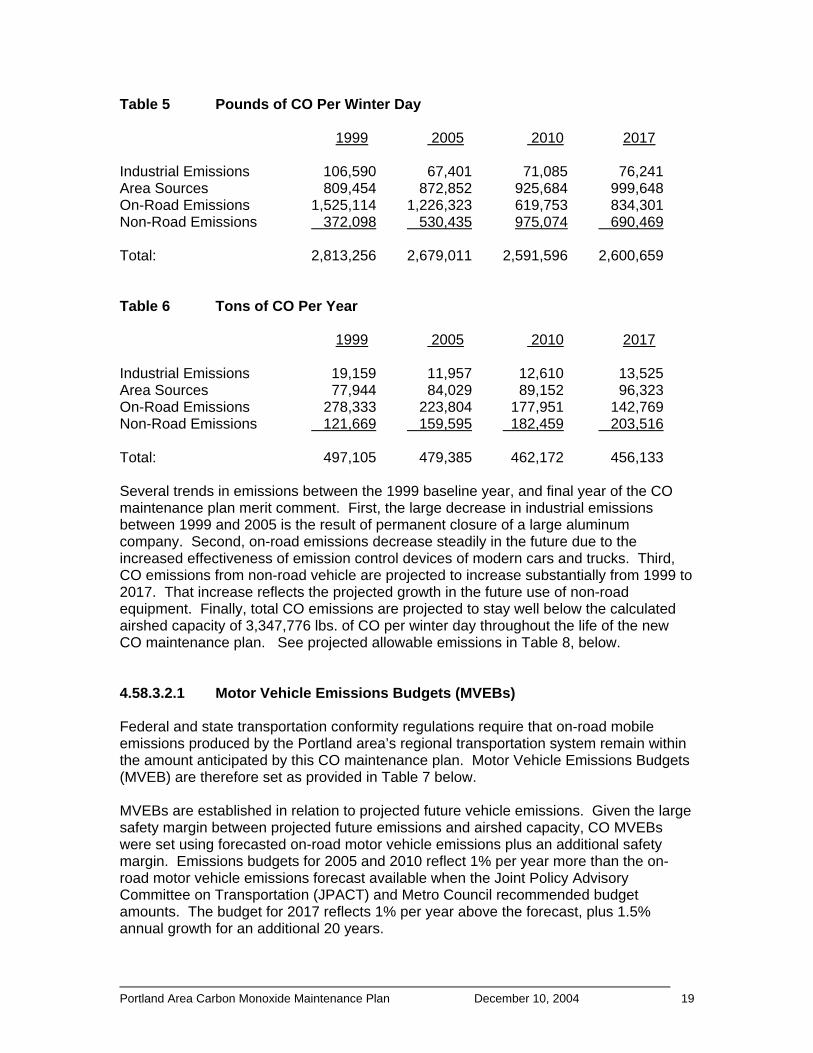

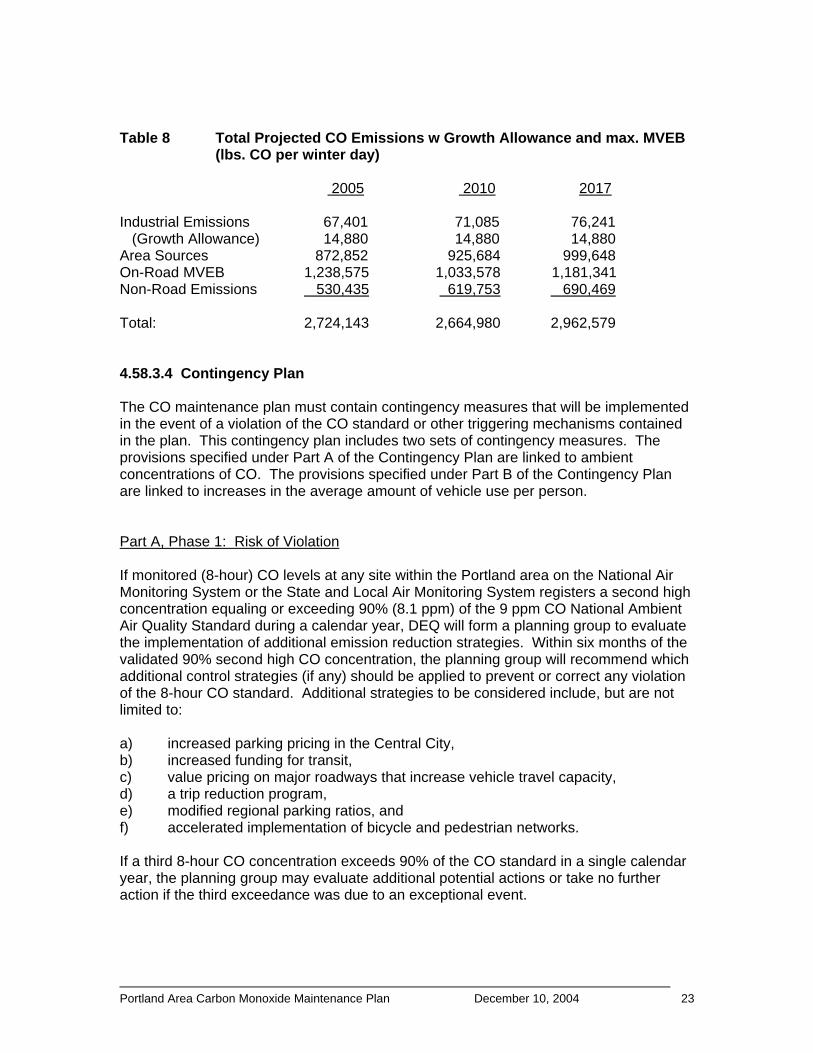


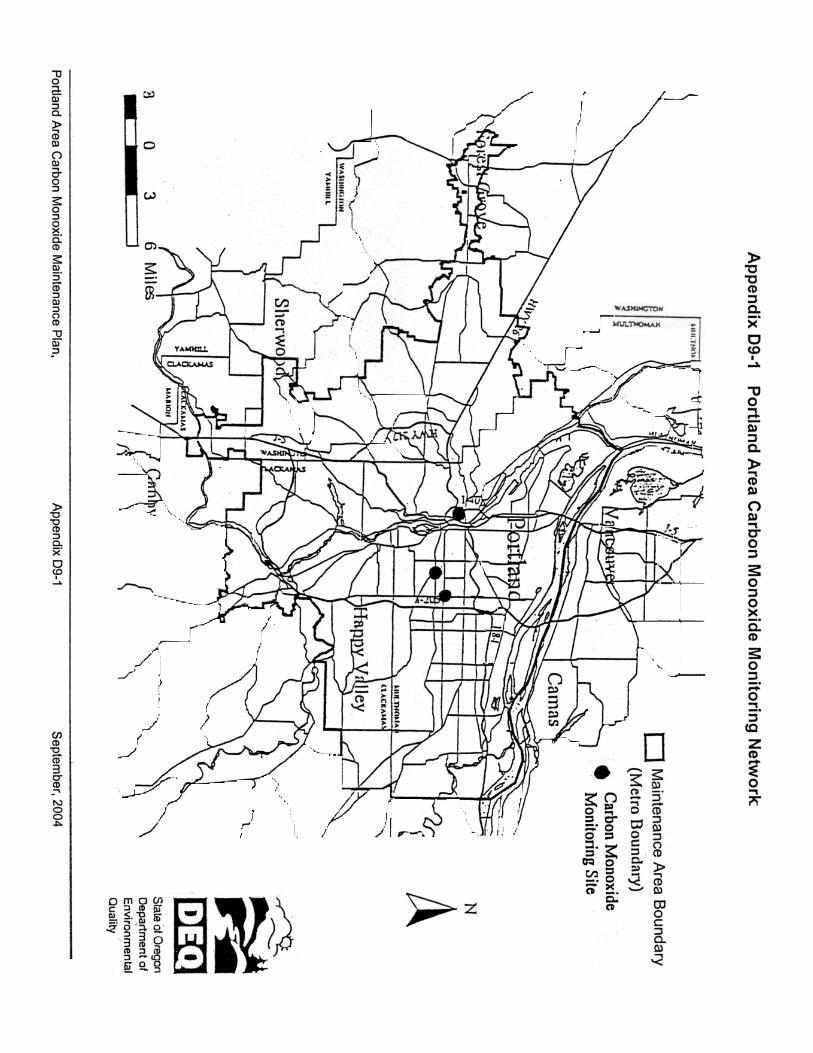

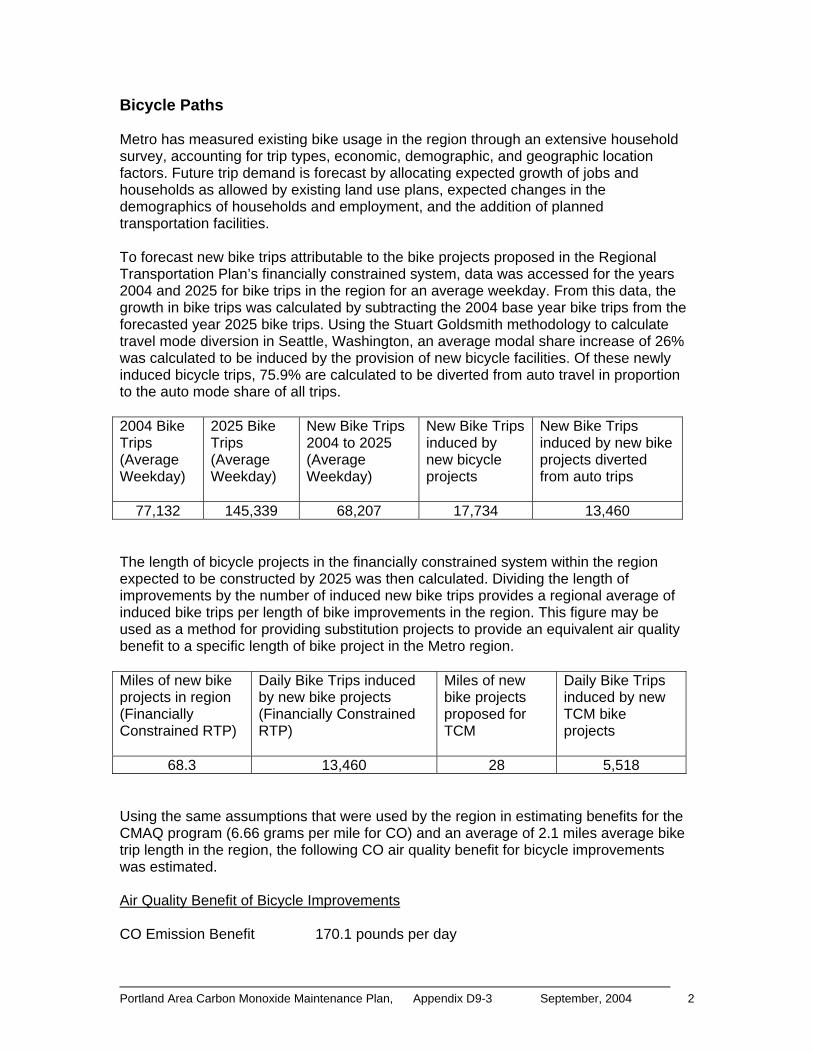

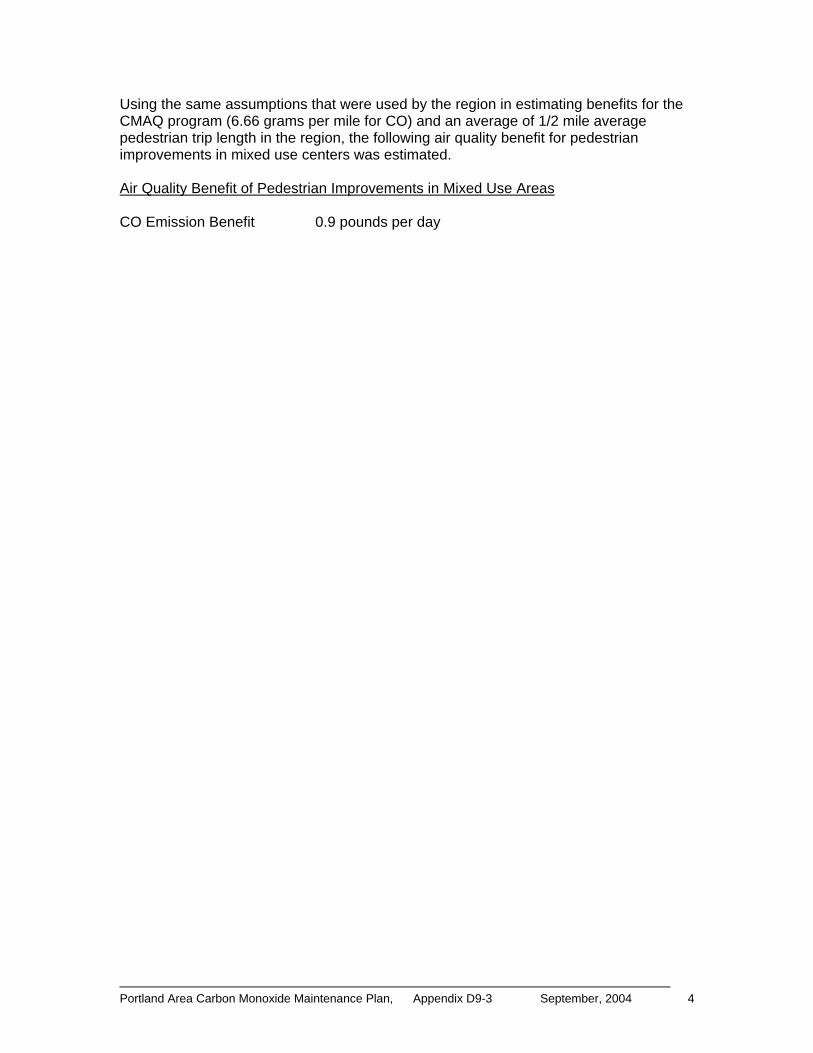
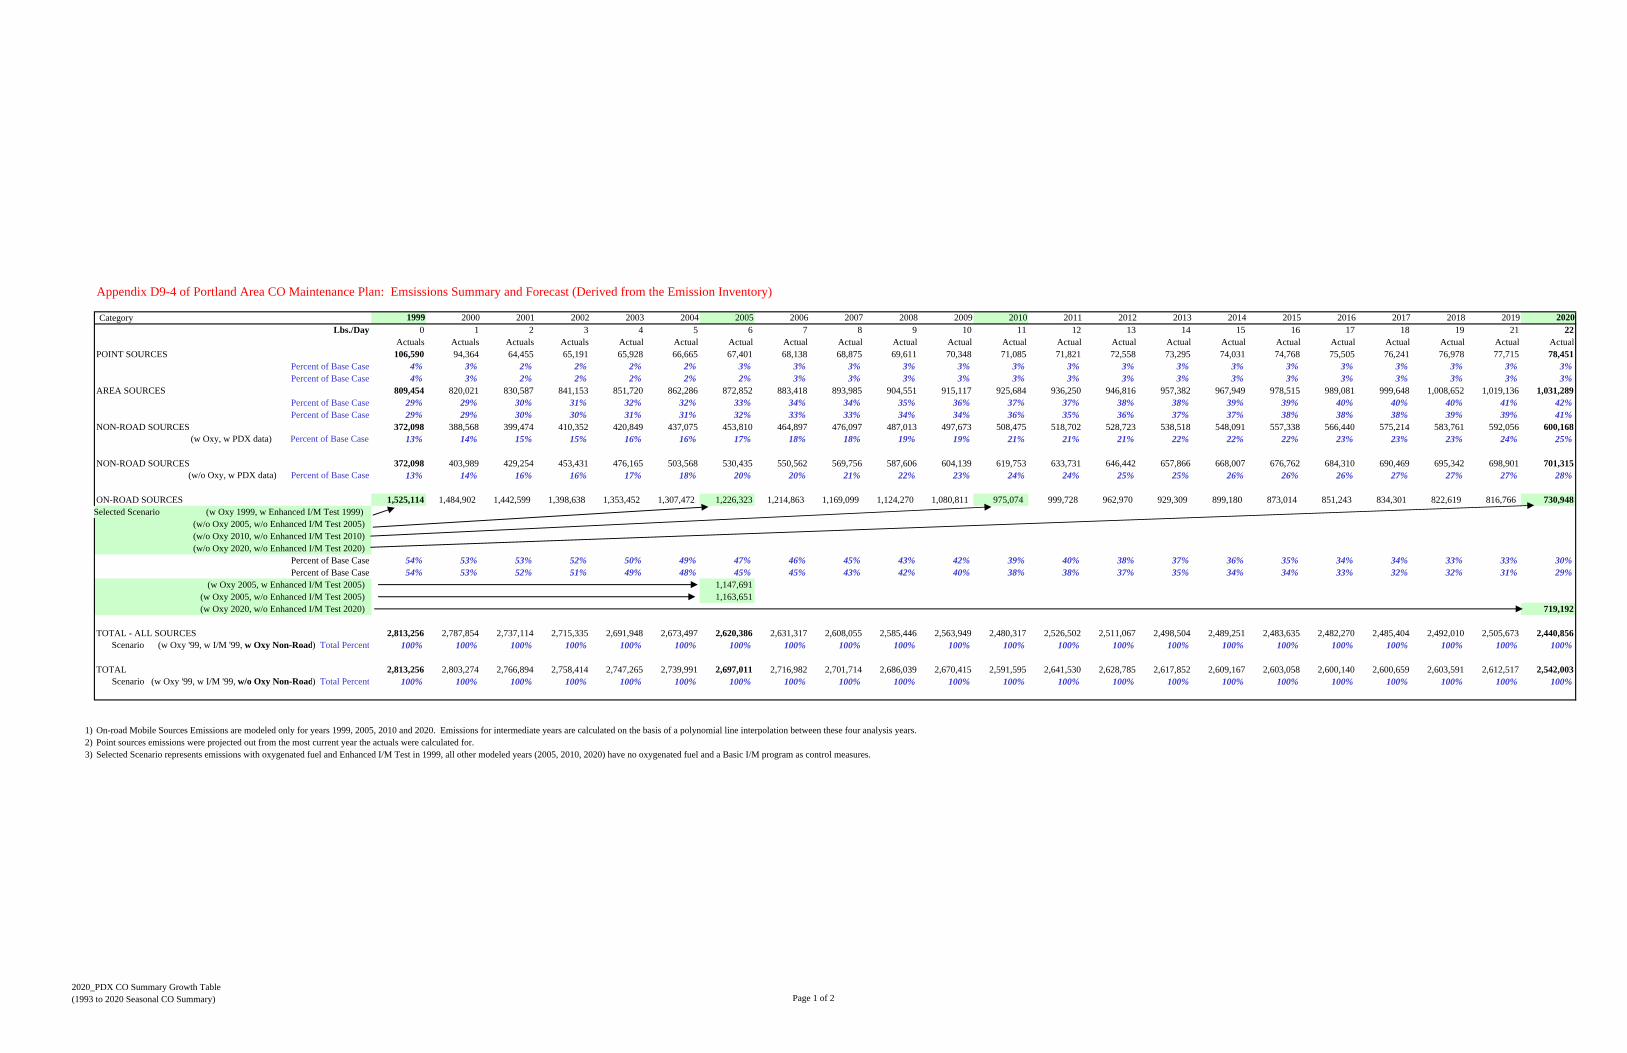
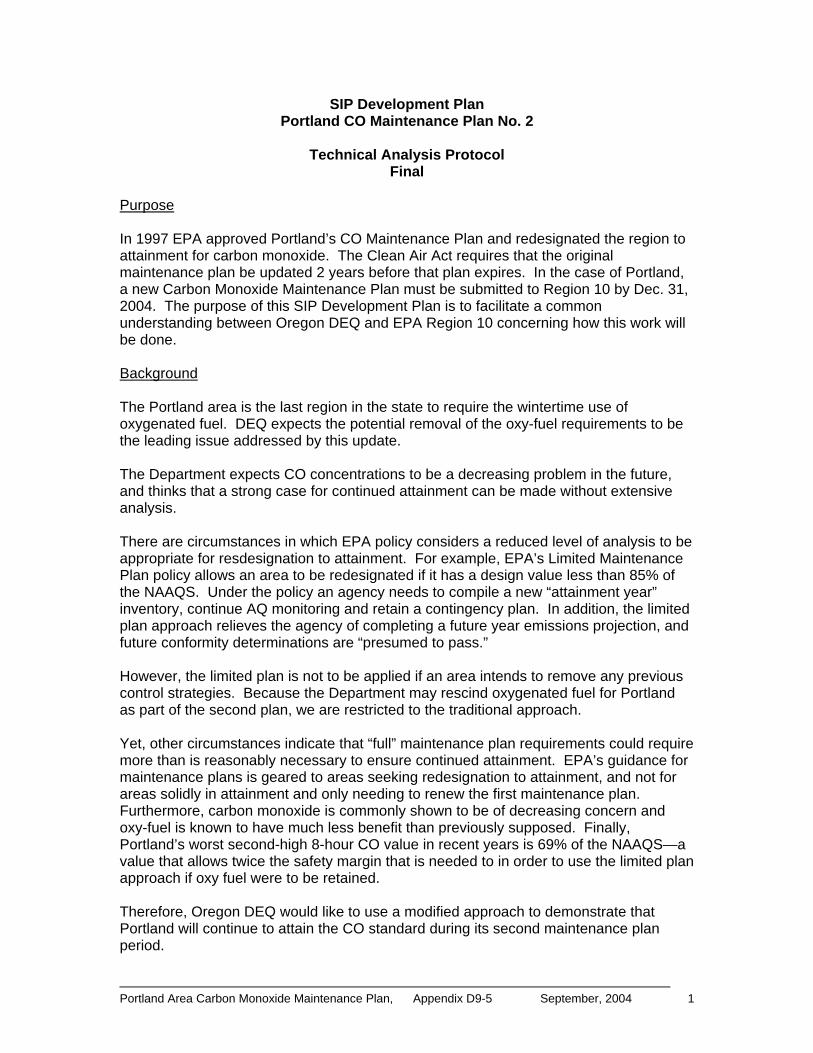

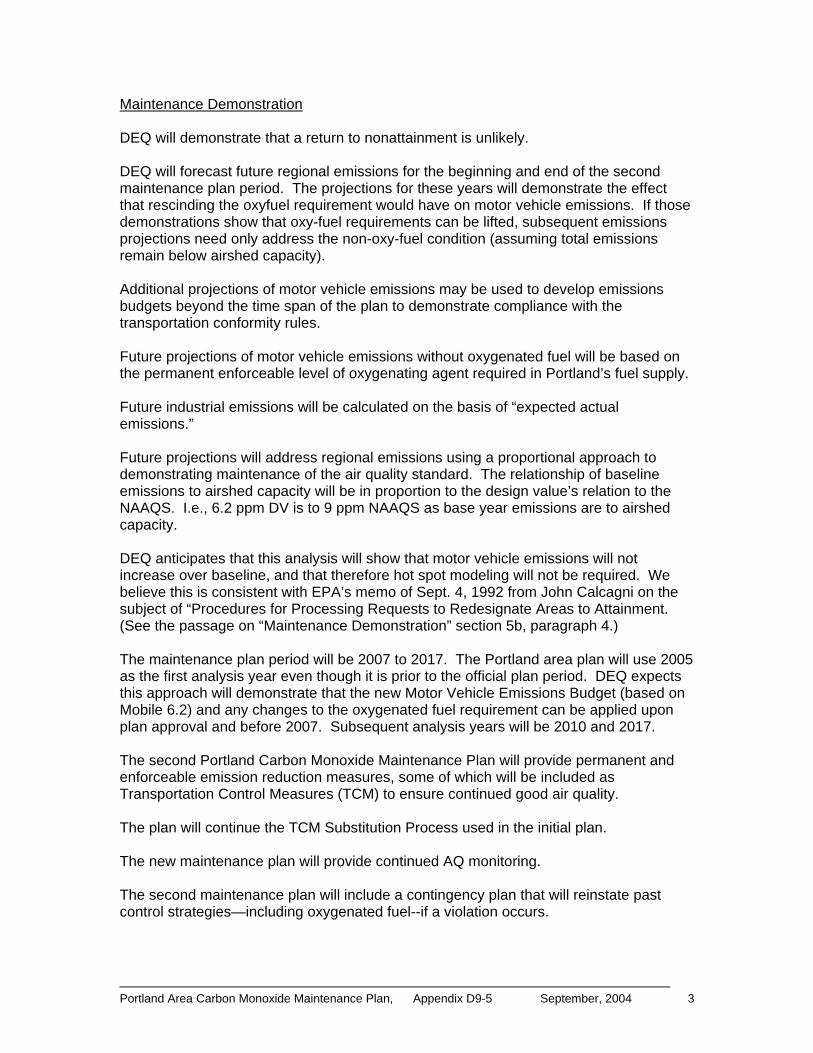

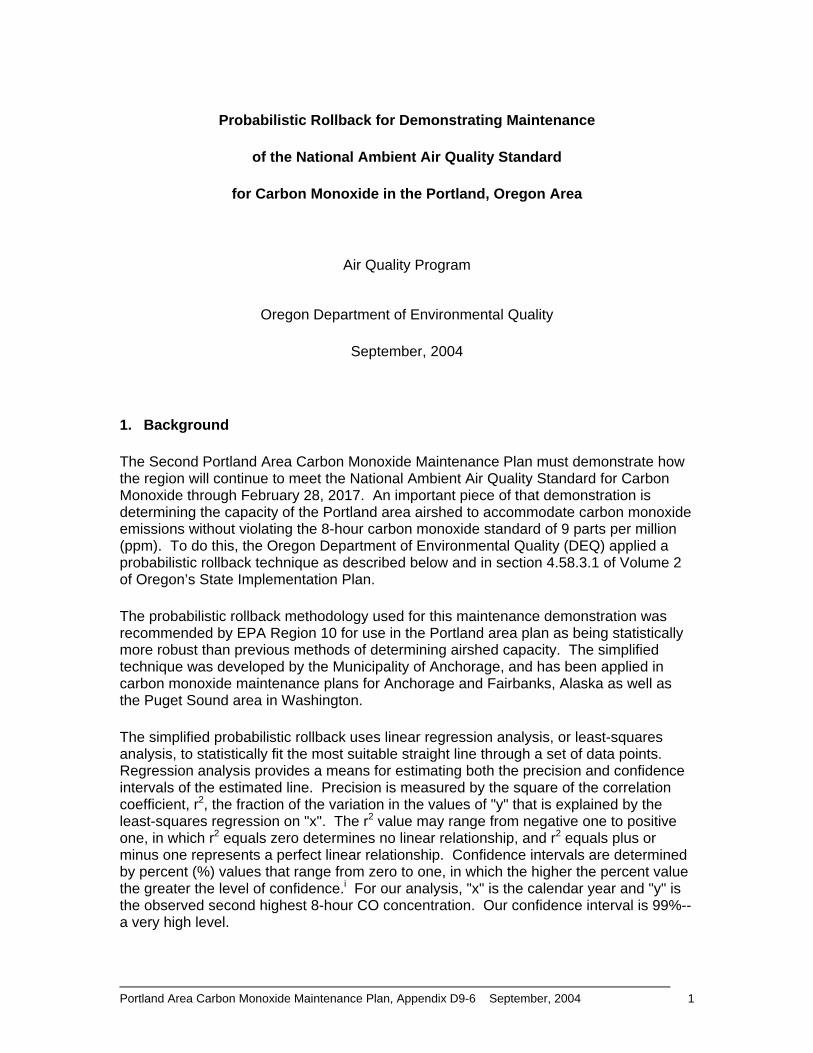
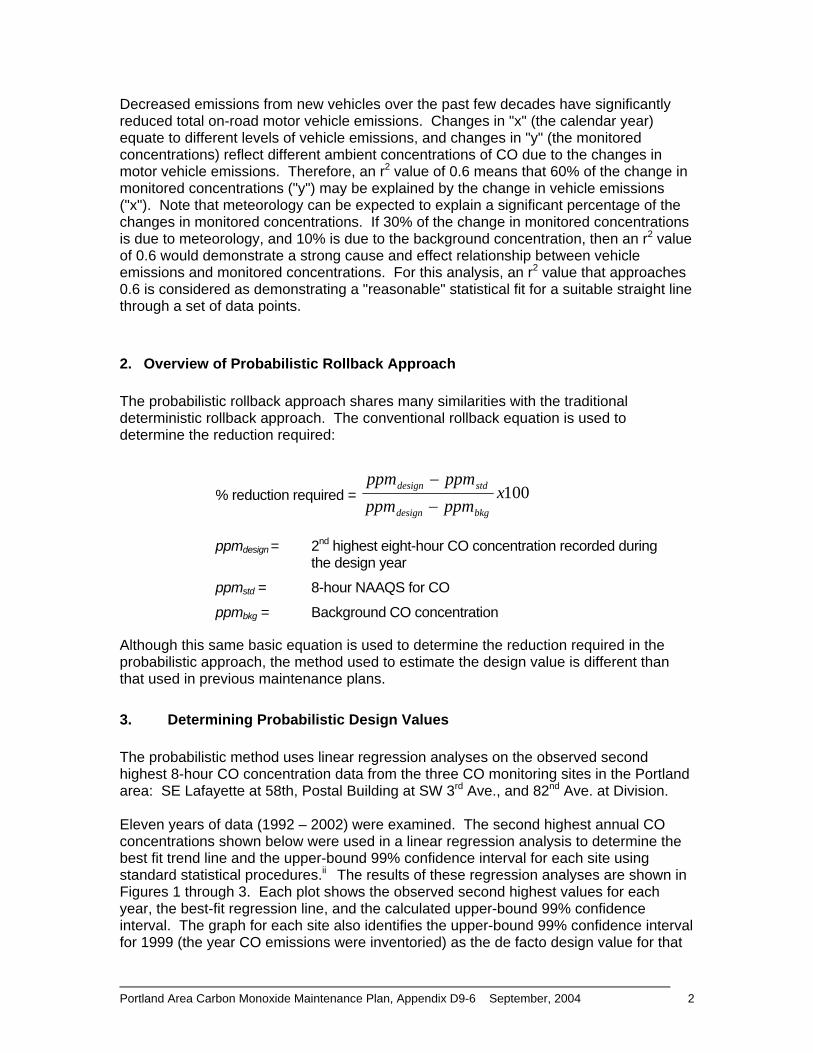
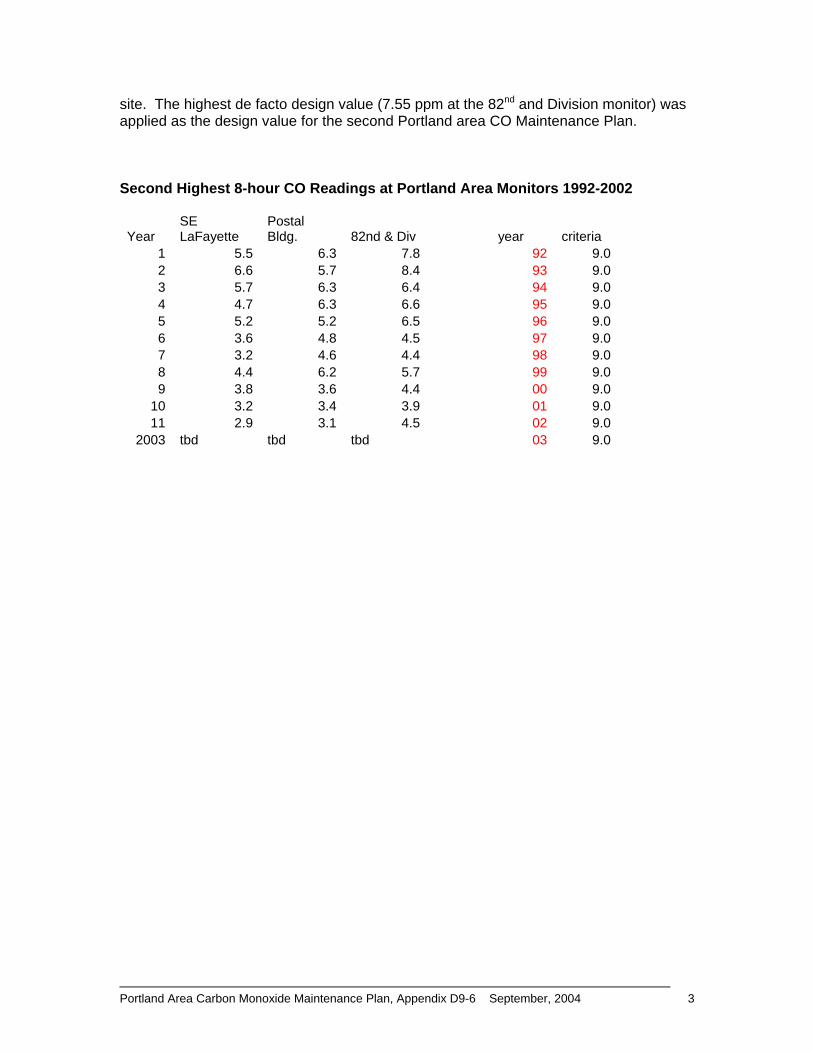
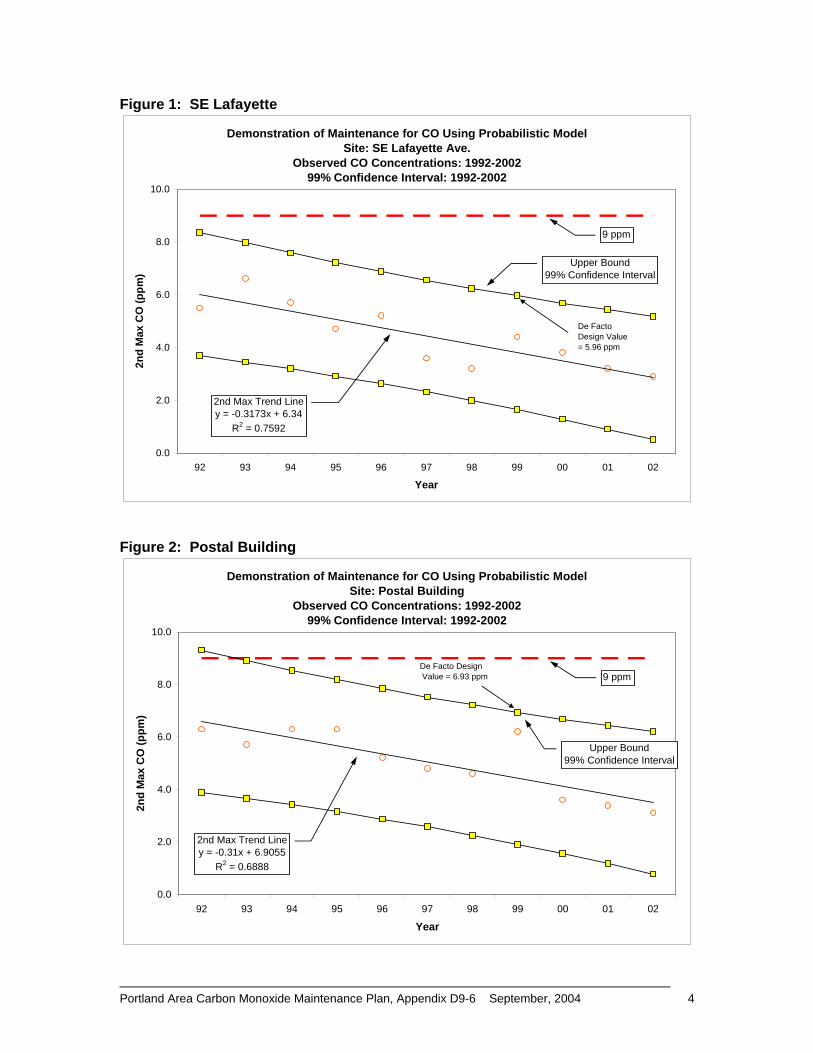
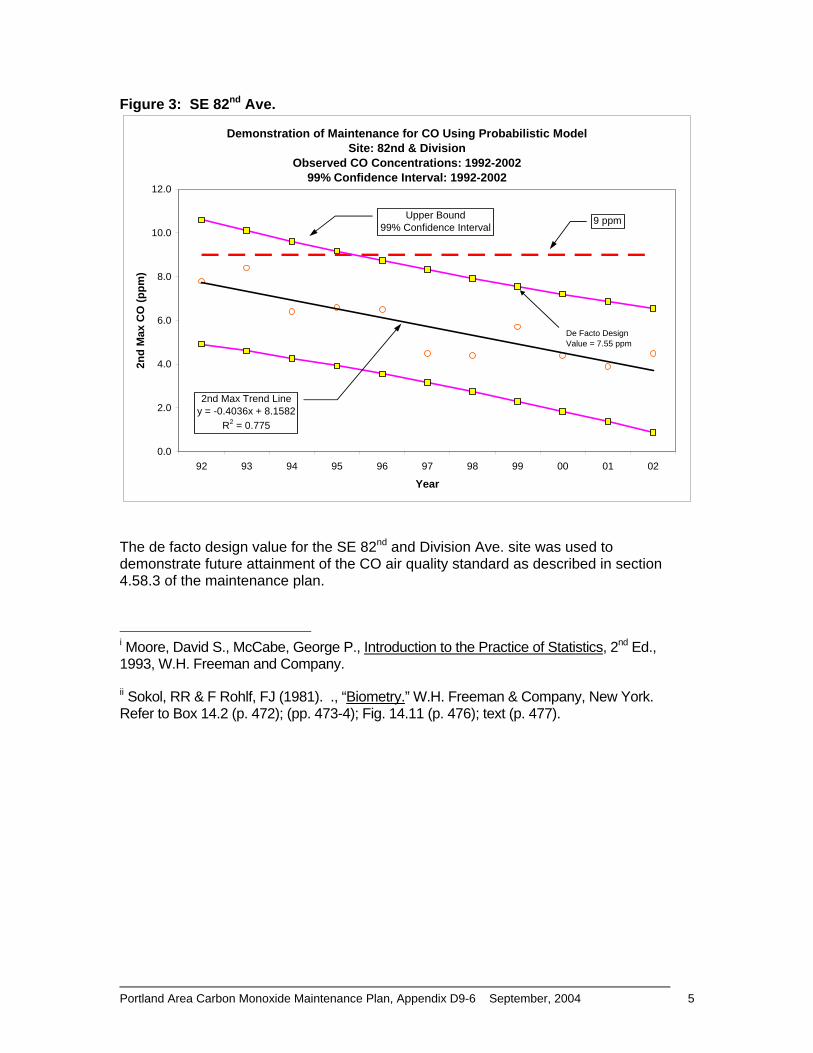


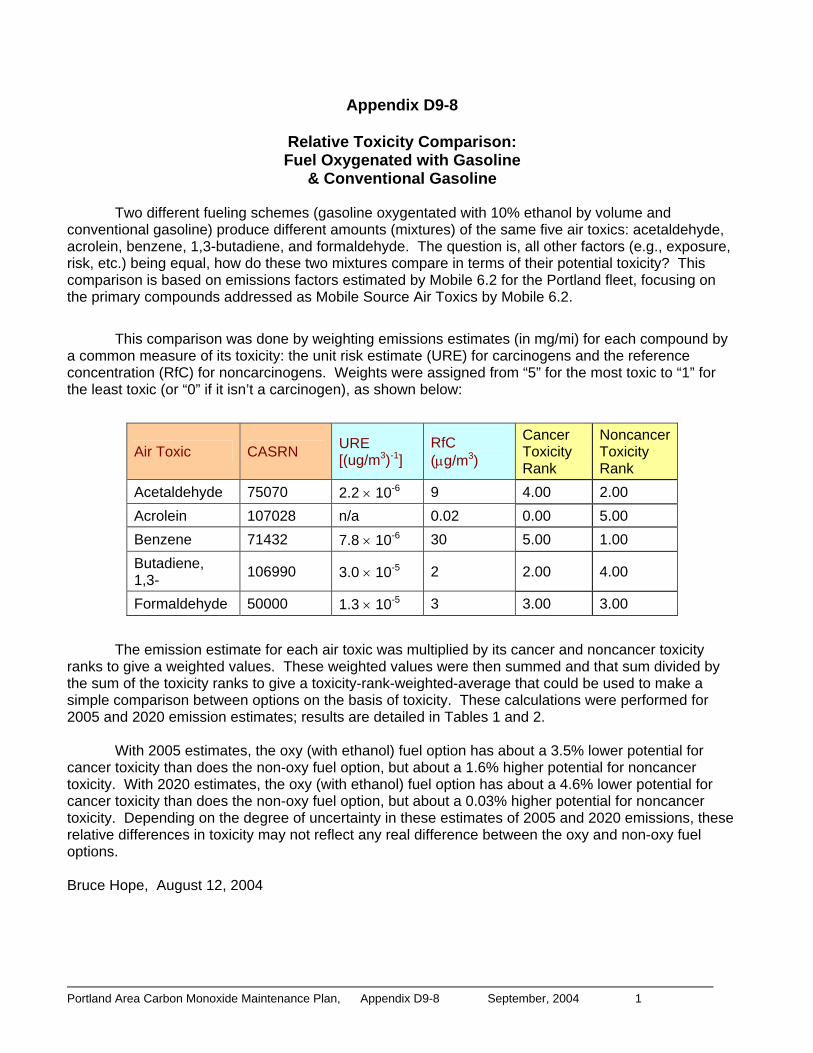
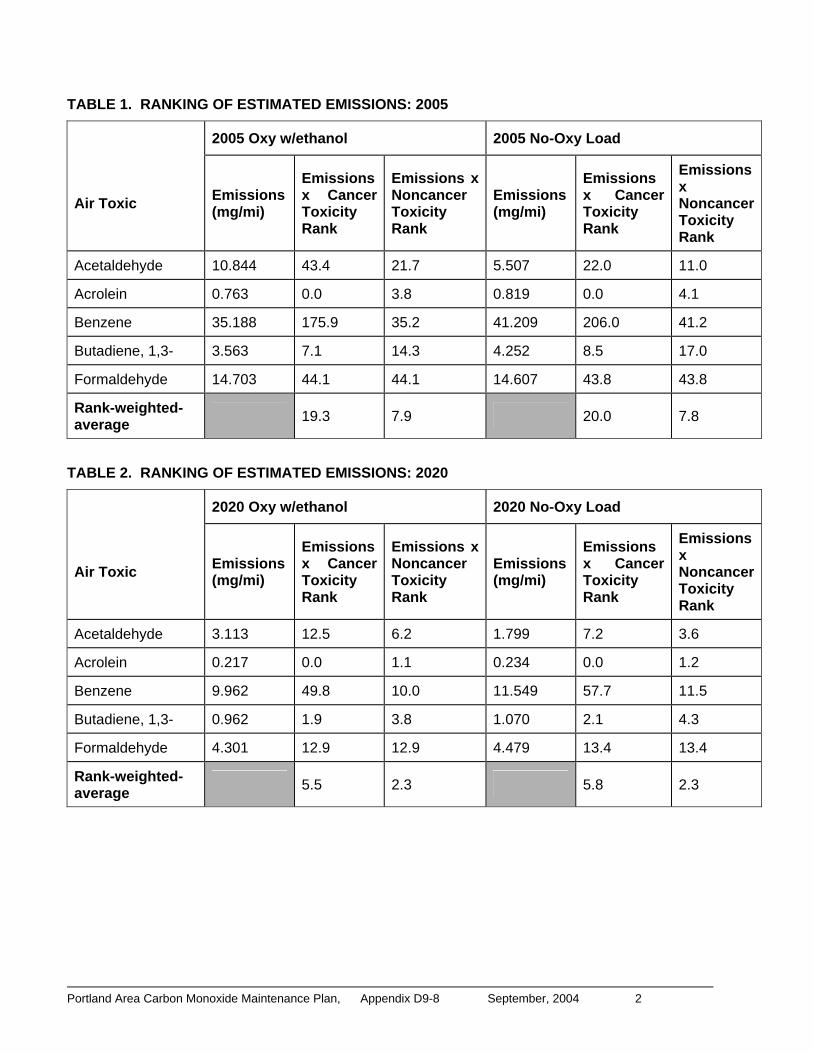


![Detecting Carbon Monoxide Poisoning Detecting Carbon ...2].pdf · Detecting Carbon Monoxide Poisoning Detecting Carbon Monoxide Poisoning. Detecting Carbon Monoxide Poisoning C arbon](https://static.documents.pub/doc/80x56/5f551747b859172cd56bb119/detecting-carbon-monoxide-poisoning-detecting-carbon-2pdf-detecting-carbon.jpg)


![Detecting Carbon Monoxide Poisoning Detecting Carbon ...2].pdf · Detecting Carbon Monoxide Poisoning Detecting Carbon Monoxide Poisoning. ... the patient’s SpO2 when he noticed](https://static.documents.pub/doc/80x56/5a78e09b7f8b9a21538eab58/detecting-carbon-monoxide-poisoning-detecting-carbon-2pdfdetecting-carbon.jpg)


