23
GreenDividend Green Dividend Joseph Cortright, Impresa September 2007 Cities facilitate less driving, saving money and stimulating the local economy
| Date post: | 16-Jul-2015 |
| Category: |
Documents |
| Upload: | trec-at-psu |
| View: | 132 times |
| Download: | 1 times |

GreenDividend
GreenDividendJoseph Cortright, Impresa
September 2007
Cities facilitate less driving, saving money and stimulating the local economy

GreenDividend
20.324.3
Total savings per year $2.6B
Median commute miles per day for 33 most populous US metro areas
Average daily miles for Portland area commute
$15 per hour
$1.5B100 million hours less traveled per year saves
Estimated value of time spent commuting
2.9 B
$1.1BMiles saved compared to median
Transportation costs saved compared to median
How urban form and transit enable people to drive less, saving money that gets spent
locally, helping foster urban economic growth
Portland’sGreen Dividend

GreenDividend
Does being green pay?
Is conservation just noble self-sacrifice; • well-intentioned but un-economic?
Or does it make a difference to the local • economy?

GreenDividend
Green Portland
One of the nation’s greenest cities• City policy to limit greenhouse gases• Land use and transportation policies•
-Higher density -Transportation alternatives -Housing choices

GreenDividend
Metropolitan VMT Per Capita, Per Day
Key Measure: Vehicle Miles Traveled
0 10 20 30 40 50
P o rt la nd
M e d ia n
Source: U.S. Department of Transportation
GreenDividend
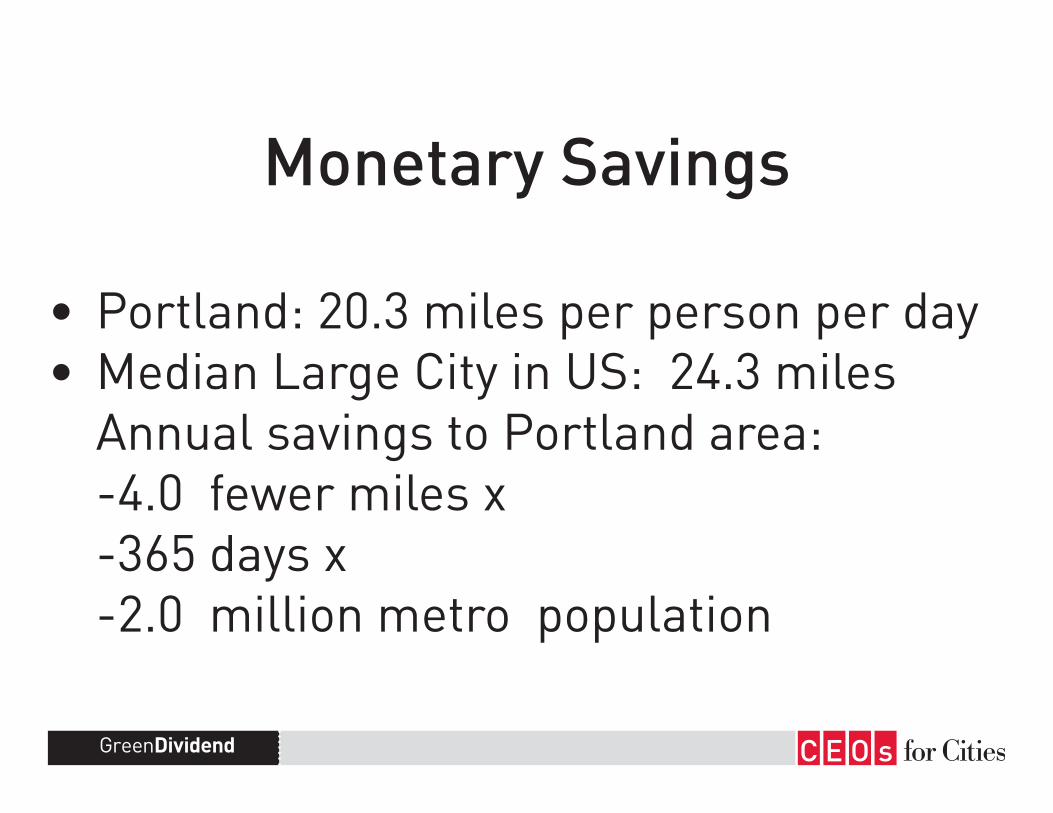
Monetary Savings
Portland: 20.3 miles per person per day• Median Large City in US: 24.3 miles•
Annual savings to Portland area: -4.0 fewer miles x -365 days x -2.0 million metro population

GreenDividend
Time SavingsTravel 2.8 billion fewer person miles per year• (2.2 million people * 365 days * 4 miles)• Value of travel time estimated at $15/hour• Savings in travel time•
-100 million hours (at 27 miles per hour) -Value of time saved: $1.5 billion
GreenDividend
Corroborating Evidence
Consumer Spending• Vehicle Purchases• Gasoline Sales•

GreenDividend
Portland spend less on transportation
0 % 5 % 1 0 % 1 5 % 2 0 % 2 5 %
(Source: Impresa analysis of Department of Labor data)
Portland15.1% of consumer expenditures
Average of 26 Largest Metro Areas19.1% of consumer expenditures

GreenDividend
Portland residents buy fewer new cars
(Source: Impresa analysis of National Automobile Dealers Association data)
Oregon 46 Vehicles per 1,000 Population
United States55 Vehicles per 1,000 population
0 1 0 2 0 3 0 4 0 5 0 6 0

GreenDividend
Portland residents buy less gasoline
(Source: Impresa analysis of Energy Information Administration data)
Oregon 53.5 million BTU per capita
United States59.6 million BTU per capita
0 2 0 4 0 6 0 8 0

GreenDividend
How Portland does itMore Compact Development•
-Urban Growth Boundary -Less Sprawl
Alternatives to Auto Travel• -Transit -Bicycling
Personal Choices•

GreenDividend
Compact Land Use
Portland’s • Urban Growth Boundary
Limits on • exclusionary zoning

GreenDividend
0 2 4 6 8 1 0 1 2
P o rt la nd--S a le m , O R --W A C M
Portland’s jobs sprawl less than most US metros
Job Sprawl Index:Ratio of Jobs 10 to 25 miles From CBD to Jobs less than 3 miles from CBD
(Source: Impresa calculations from County Business Pattern data)

GreenDividend
Less Economic Segregation
Economic Segregation Index:(Percent of High income households that would have to move to balance high and low income households to regional average in each neighborhood)
Source: Lewis Mumford Institute)
0 2 0 4 0 6 0 8 0 1 0 0
P o rt la nd-Va nco uve r, O R -W A P M S A

GreenDividend
Portland residents ride transit more
(Source: American Community Survey, 2005)
Portland 13.3% Commute by Transit
United States6.5% Commute by Transit
0 % 5 % 1 0 % 1 5 %

GreenDividend
Portland residents seven times as likely to bicycle to work
(Source: Census Bureau, American Community Survey, 2005)
Portland 3.5% of commuters bicycle to work
Average for Cities of 85,000 plus0.4% of commuters bicycle to work
0 % 1 % 2 % 3 % 4 %

GreenDividend
Most Hybrids Per Capita
0 2 4 6 8 1 0 1 2
P o rt la nd, O RS a n F ra nc isco ,
M o nte re y , C AS a nta B a rba ra ,
L o s Ange le sB e nd, O R
W a shingto n, D CS a n D ie go
C ha rlo tte sv ille , VA
E uge neS e a tt le
H o no luluE ure ka
S a cra m e nto
D e nve r
Source: http://www.hybridcars.com/market-dashboard/feb07-regional.html
Hybrids per 1,000 Households, 2006

GreenDividend
Happier Citizen Commuters
(Source: Impresa analysis of Riley Research survey data)
Portland 60% rate transportation system “good or excellent”
Average of Metro Areas35% rate transportation system “good or excellent”
0 % 2 0 % 4 0 % 6 0 % 8 0 %

GreenDividend
More Local SpendingSpending on cars and fuel leaves the •
regional economyOther spending has less leakage• $1 billion in additional local purchasing •
power for all other industries
GreenDividend
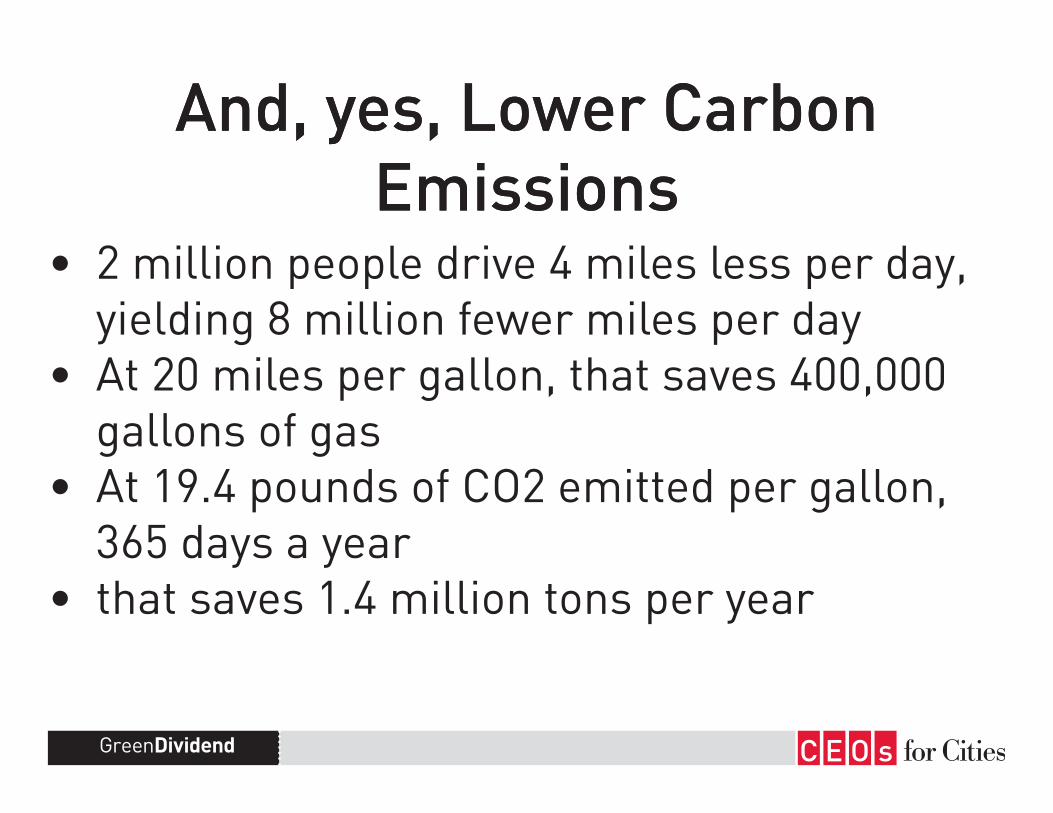
And, yes, Lower Carbon Emissions
2 million people drive 4 miles less per day, • yielding 8 million fewer miles per day
At 20 miles per gallon, that saves 400,000 • gallons of gas
At 19.4 pounds of CO2 emitted per gallon, • 365 days a year
that saves 1.4 million tons per year•
And, yes, Lower Carbon Emissions

GreenDividend
Next Steps
Apply to Other Cities• Identify Possible Gains• Quantify Local Economic Impacts•