205
POSCO and Subsidiaries Consolidated Financial Statements December 31, 2013 and 2012 (With Independent Auditors’ Report Thereon)

POSCO and Subsidiaries Consolidated Financial Statements December 31, 2013 and 2012 (With Independent Auditors’ Report Thereon)
Table of Contents
Page
Independent Auditors’ Report ............................................................................................................. 1
Consolidated Financial Statements
Consolidated Statements of Financial Position ................................................................................. 3
Consolidated Statements of Comprehensive Income ........................................................................ 5
Consolidated Statements of Changes in Equity ................................................................................ 6
Consolidated Statements of Cash Flows ........................................................................................... 8
Notes to the Consolidated Financial Statements ............................................................................. 10

Independent Auditors’ Report
Based on a report originally issued in Korean
The Board of Directors and Shareholders POSCO: We have audited the accompanying consolidated statements of financial position of POSCO and subsidiaries (the “Company”) as of December 31, 2013 and 2012 and the related consolidated statements of comprehensive income, changes in equity and cash flows for the years then ended. Management is responsible for the presentation of these consolidated financial statements in accordance with Korean International Financial Standards. Our responsibility is to express an opinion on these consolidated financial statements based on our audits.
We conducted our audits in accordance with auditing standards generally accepted in the Republic of Korea. Those standards require that we plan and perform the audit to obtain reasonable assurance about whether the consolidated financial statements are free of material misstatement. An audit includes examining, on a test basis, evidence supporting the amounts and disclosures in the consolidated financial statements. An audit also includes assessing the accounting principles used and significant estimates made by management, as well as evaluating the overall financial statement presentation. We believe that the audit evidence we have obtained is sufficient and appropriate to provide a basis for our opinion. In our opinion, the consolidated financial statements referred to above present fairly, in all material respects, the financial position of the Company as of December 31, 2013 and 2012 and its financial performance and its cash flows for the years then ended, in conformity with Korean International Financial Reporting Standards.

2
Without qualifying our opinion, we draw attention to the following: The procedures and practices utilized in the Republic of Korea to audit such consolidated financial statements may differ from those generally accepted and applied in other countries. Accordingly, this report and the accompanying consolidated financial statements are for use by those knowledgeable about Korean auditing standards and their application in practice. Seoul, Korea February 25, 2014
This report is effective as of February 25, 2014, the audit report date. Certain subsequent events or circumstances, which may occur between the audit report date and the time of reading this report, could have a material impact on the accompanying consolidated financial statements and notes thereto. Accordingly, the readers of the audit report should understand that the above audit report has not been updated to reflect the impact of such subsequent events or circumstances, if any.
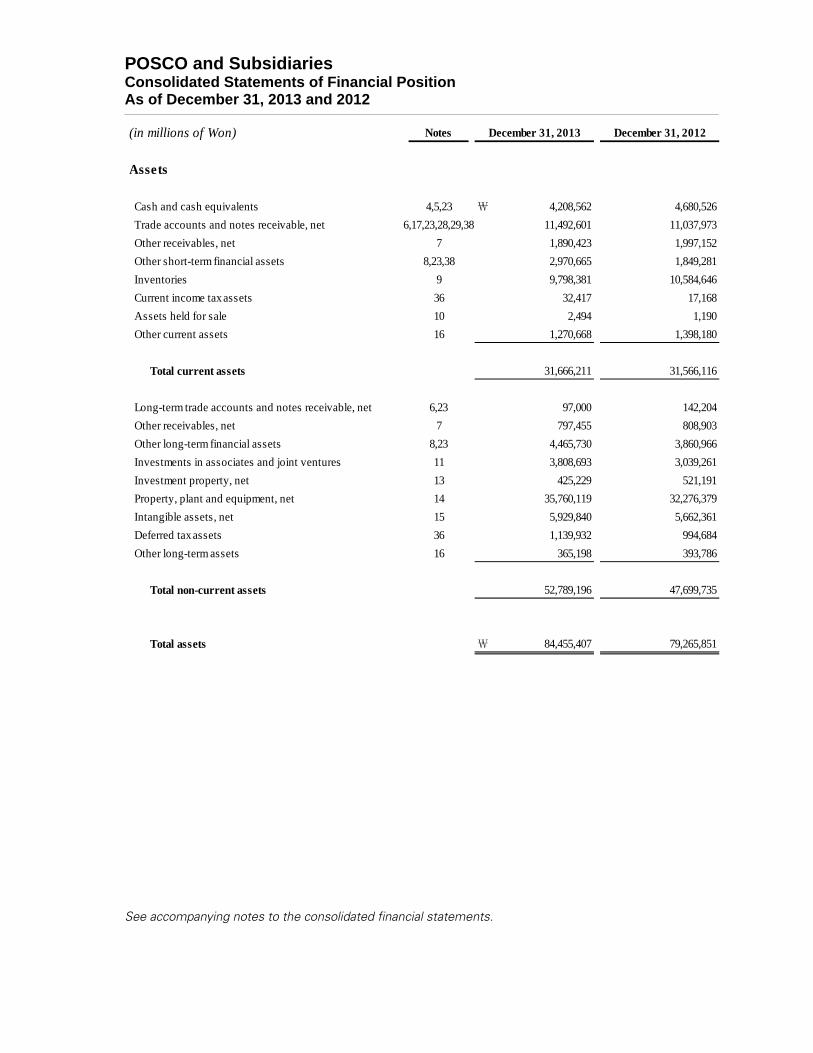
POSCO and Subsidiaries Consolidated Statements of Financial Position As of December 31, 2013 and 2012
See accompanying notes to the consolidated financial statements.
(in millions of Won) Notes
Assets
Cash and cash equivalents 4,5,23 ₩ 4,208,562 4,680,526
Trade accounts and notes receivable, net 6,17,23,28,29,38 11,492,601 11,037,973
Other receivables, net 7 1,890,423 1,997,152
Other short-term financial assets 8,23,38 2,970,665 1,849,281
Inventories 9 9,798,381 10,584,646
Current income tax assets 36 32,417 17,168
Assets held for sale 10 2,494 1,190
Other current assets 16 1,270,668 1,398,180
Total current assets 31,666,211 31,566,116
Long-term trade accounts and notes receivable, net 6,23 97,000 142,204
Other receivables, net 7 797,455 808,903
Other long-term financial assets 8,23 4,465,730 3,860,966
Investments in associates and joint ventures 11 3,808,693 3,039,261
Investment property, net 13 425,229 521,191
Property, plant and equipment, net 14 35,760,119 32,276,379
Intangible assets, net 15 5,929,840 5,662,361
Deferred tax assets 36 1,139,932 994,684
Other long-term assets 16 365,198 393,786
Total non-current assets 52,789,196 47,699,735
Total assets ₩ 84,455,407 79,265,851
December 31, 2013 December 31, 2012
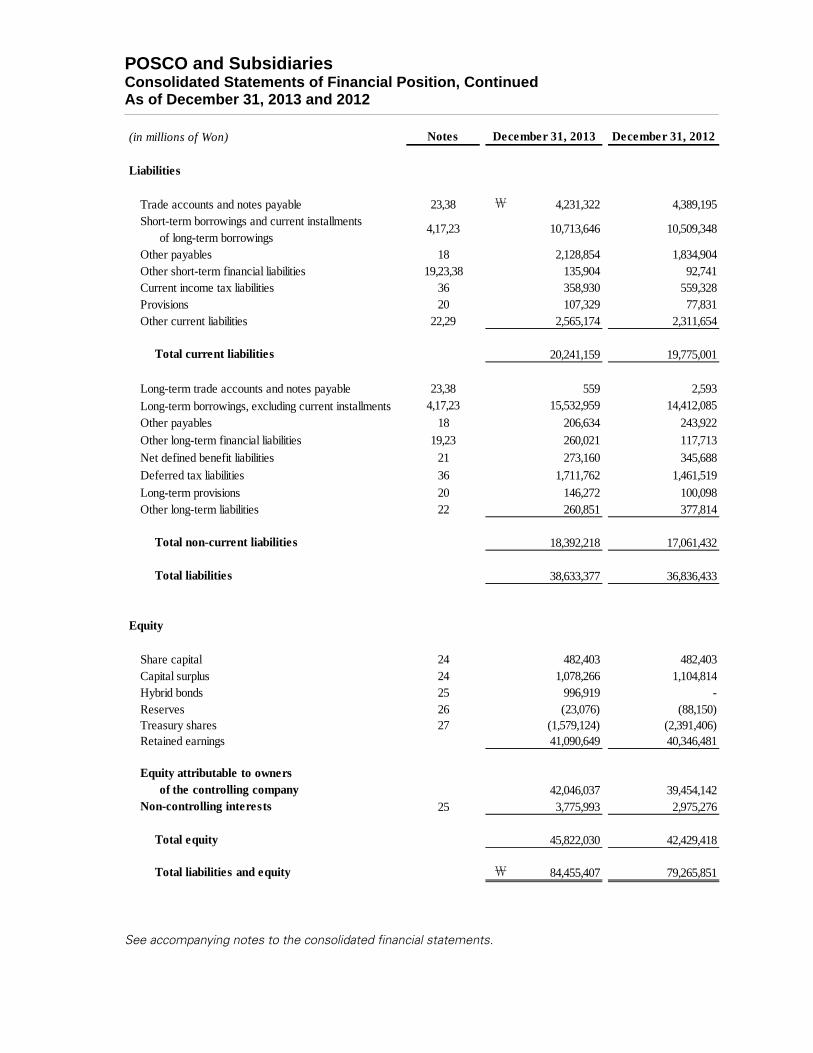
POSCO and Subsidiaries Consolidated Statements of Financial Position, Continued As of December 31, 2013 and 2012
See accompanying notes to the consolidated financial statements.
(in millions of Won) Notes
Liabilities
Trade accounts and notes payable 23,38 ₩ 4,231,322 4,389,195 Short-term borrowings and current installments
of long-term borrowingsOther payables 18 2,128,854 1,834,904 Other short-term financial liabilities 19,23,38 135,904 92,741 Current income tax liabilities 36 358,930 559,328 Provisions 20 107,329 77,831 Other current liabilities 22,29 2,565,174 2,311,654
Total current liabilities 20,241,159 19,775,001
Long-term trade accounts and notes payable 23,38 559 2,593
Long-term borrowings, excluding current installments 4,17,23 15,532,959 14,412,085
Other payables 18 206,634 243,922
Other long-term financial liabilities 19,23 260,021 117,713
Net defined benefit liabilities 21 273,160 345,688
Deferred tax liabilities 36 1,711,762 1,461,519
Long-term provisions 20 146,272 100,098 Other long-term liabilities 22 260,851 377,814
Total non-current liabilities 18,392,218 17,061,432
Total liabilities 38,633,377 36,836,433
Equity
Share capital 24 482,403 482,403 Capital surplus 24 1,078,266 1,104,814 Hybrid bonds 25 996,919 -Reserves 26 (23,076) (88,150)Treasury shares 27 (1,579,124) (2,391,406)Retained earnings 41,090,649 40,346,481
Equity attributable to owners of the controlling company 42,046,037 39,454,142
Non-controlling interests 25 3,775,993 2,975,276
Total equity 45,822,030 42,429,418
Total liabilities and equity ₩ 84,455,407 79,265,851
4,17,23 10,713,646 10,509,348
December 31, 2013 December 31, 2012

POSCO and Subsidiaries Consolidated Statements of Comprehensive Income For the years ended December 31, 2013 and 2012
See accompanying notes to the consolidated financial statements.
(in millions of Won, except per share information) Notes
Revenue 28,29,38 ₩ 61,864,650 63,604,151Cost of sales 29,31,35,38 (55,004,591) (56,142,892)
Gross profit 6,860,059 7,461,259
Selling and administrative expenses 30,35Administrative expenses 31 (2,231,805) (2,129,463)Selling expenses (1,632,120) (1,678,688)
Operating profit 32 2,996,134 3,653,108
Share of loss of equity-accounted investees, net 11 (179,809) (22,702)
Finance income and costs 23,33Finance income 2,380,838 2,897,063Finance costs (2,829,253) (2,797,638)
Other non-operating income and expenses 34,38Other non-operating income 229,073 448,120Other non-operating expenses 35 (650,806) (809,465)
Profit before income tax 1,946,177 3,368,486Income tax expense 36 (590,997) (982,879)
Profit for the period 1,355,180 2,385,607
Other comprehensive income (loss)Items that will not be reclassified subsequently to profit or loss :
Remeasurements of defined benefit pension plans 21 6,224 (62,527)Items that are or may be reclassified subsequently to profit or loss :
Capital adjustment arising from investments in equity-method investees (183,836) (130,836)Net changes in the unrealized fair value of available-for-sale investments 23 412,346 (81,471)Foreign currency translation differences (220,464) (363,088)
Other comprehensive income (loss), net of tax 14,270 (637,922)
Total comprehensive income for the period ₩ 1,369,450 1,747,685
Profit (loss) attributable to:Owners of the controlling company ₩ 1,376,396 2,462,081Non-controlling interests (21,216) (76,474)
Profit for the period ₩ 1,355,180 2,385,607
Total comprehensive income (loss) attributable to: Owners of the controlling company ₩ 1,444,262 1,911,506Non-controlling interests (74,812) (163,821)
Total comprehensive income for the period ₩ 1,369,450 1,747,685
Basic and diluted earnings per share 37 ₩ 17,409 31,874
December 31, 2012December 31, 2013
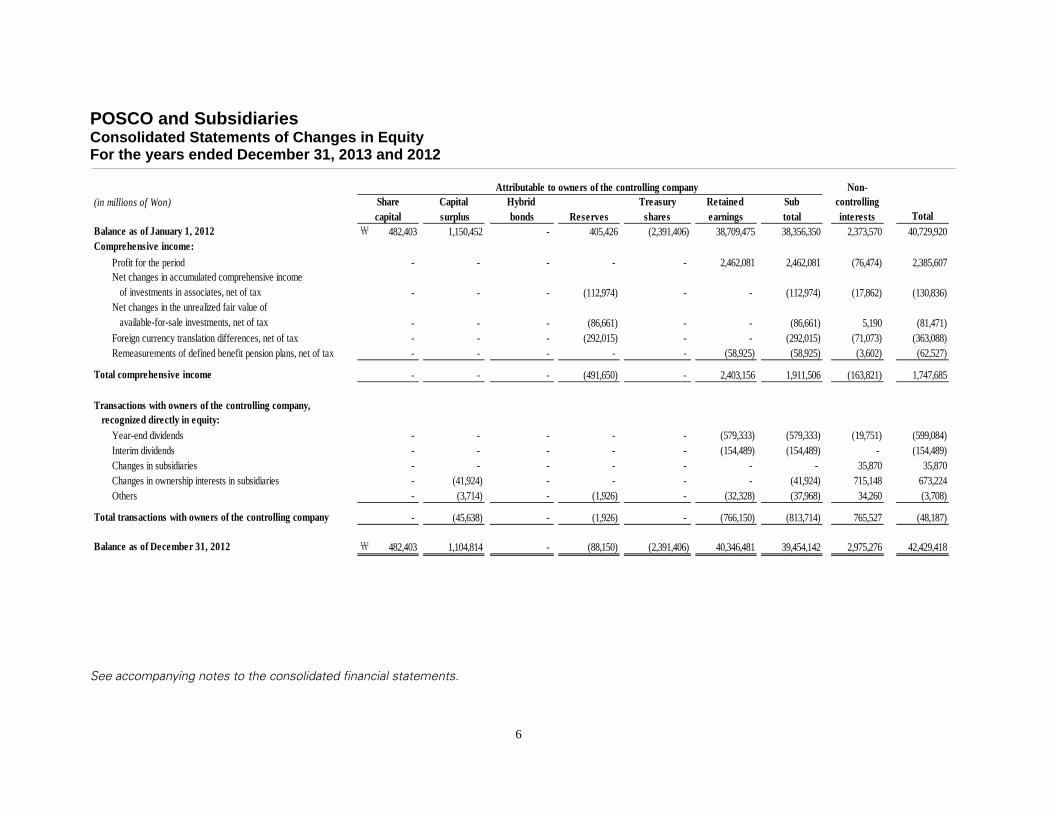
POSCO and Subsidiaries Consolidated Statements of Changes in Equity For the years ended December 31, 2013 and 2012
6
See accompanying notes to the consolidated financial statements.
Attributable to owners of the controlling company Non-(in millions of Won) controlling
interestsBalance as of January 1, 2012 ₩ 482,403 1,150,452 - 405,426 (2,391,406) 38,709,475 38,356,350 2,373,570 40,729,920Comprehensive income:
Profit for the period - - - - - 2,462,081 2,462,081 (76,474) 2,385,607
- - - (112,974) - - (112,974) (17,862) (130,836)
- - - (86,661) - - (86,661) 5,190 (81,471)Foreign currency translation differences, net of tax - - - (292,015) - - (292,015) (71,073) (363,088)Remeasurements of defined benefit pension plans, net of tax - - - - - (58,925) (58,925) (3,602) (62,527)
Total comprehensive income - - - (491,650) - 2,403,156 1,911,506 (163,821) 1,747,685
Year-end dividends - - - - - (579,333) (579,333) (19,751) (599,084)Interim dividends - - - - - (154,489) (154,489) - (154,489)Changes in subsidiaries - - - - - - - 35,870 35,870Changes in ownership interests in subsidiaries - (41,924) - - - - (41,924) 715,148 673,224Others - (3,714) - (1,926) - (32,328) (37,968) 34,260 (3,708)
Total transactions with owners of the controlling company - (45,638) - (1,926) - (766,150) (813,714) 765,527 (48,187)
Balance as of December 31, 2012 ₩ 482,403 1,104,814 - (88,150) (2,391,406) 40,346,481 39,454,142 2,975,276 42,429,418
TotalShare Capital Treasury Retained Subcapital surplus shares earnings total
Hybrid bonds Reserves
Net changes in accumulated comprehensive income of investments in associates, net of taxNet changes in the unrealized fair value of available-for-sale investments, net of tax
Transactions with owners of the controlling company, recognized directly in equity:
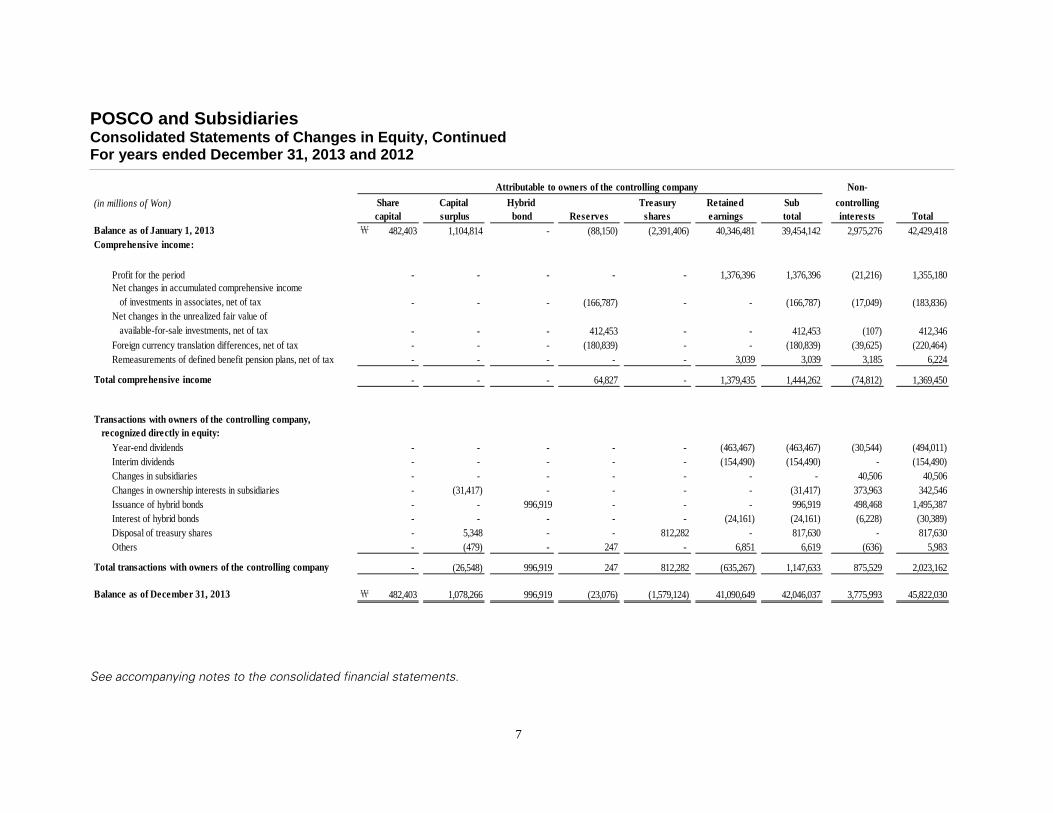
POSCO and Subsidiaries Consolidated Statements of Changes in Equity, Continued For years ended December 31, 2013 and 2012
7
See accompanying notes to the consolidated financial statements.
Attributable to owners of the controlling company Non-
(in millions of Won) controllinginterests
Balance as of January 1, 2013 ₩ 482,403 1,104,814 - (88,150) (2,391,406) 40,346,481 39,454,142 2,975,276 42,429,418Comprehensive income:
Profit for the period - - - - - 1,376,396 1,376,396 (21,216) 1,355,180
- - - (166,787) - - (166,787) (17,049) (183,836)
- - - 412,453 - - 412,453 (107) 412,346Foreign currency translation differences, net of tax - - - (180,839) - - (180,839) (39,625) (220,464)Remeasurements of defined benefit pension plans, net of tax - - - - - 3,039 3,039 3,185 6,224
Total comprehensive income - - - 64,827 - 1,379,435 1,444,262 (74,812) 1,369,450
Year-end dividends - - - - - (463,467) (463,467) (30,544) (494,011)Interim dividends - - - - - (154,490) (154,490) - (154,490)Changes in subsidiaries - - - - - - - 40,506 40,506Changes in ownership interests in subsidiaries - (31,417) - - - - (31,417) 373,963 342,546Issuance of hybrid bonds - - 996,919 - - - 996,919 498,468 1,495,387Interest of hybrid bonds - - - - - (24,161) (24,161) (6,228) (30,389)Disposal of treasury shares - 5,348 - - 812,282 - 817,630 - 817,630Others - (479) - 247 - 6,851 6,619 (636) 5,983
Total transactions with owners of the controlling company - (26,548) 996,919 247 812,282 (635,267) 1,147,633 875,529 2,023,162
Balance as of December 31, 2013 ₩ 482,403 1,078,266 996,919 (23,076) (1,579,124) 41,090,649 42,046,037 3,775,993 45,822,030
TotalShare Capital Treasury Retained capital surplus shares earnings
Subtotal
Hybrid bond Reserves
Transactions with owners of the controlling company, recognized directly in equity:
Net changes in the unrealized fair value of available-for-sale investments, net of tax
Net changes in accumulated comprehensive income of investments in associates, net of tax
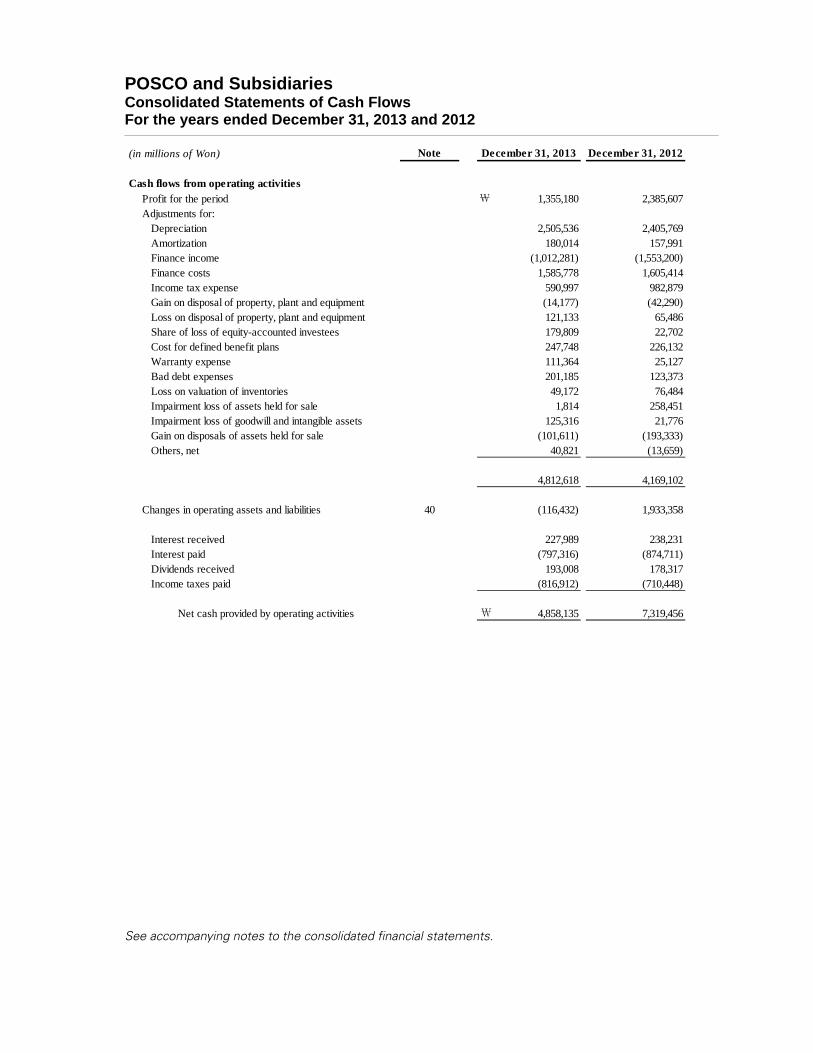
POSCO and Subsidiaries Consolidated Statements of Cash Flows For the years ended December 31, 2013 and 2012
See accompanying notes to the consolidated financial statements.
(in millions of Won) Note
Cash flows from operating activitiesProfit for the period ₩ 1,355,180 2,385,607 Adjustments for:
Depreciation 2,505,536 2,405,769 Amortization 180,014 157,991 Finance income (1,012,281) (1,553,200)Finance costs 1,585,778 1,605,414 Income tax expense 590,997 982,879 Gain on disposal of property, plant and equipment (14,177) (42,290)Loss on disposal of property, plant and equipment 121,133 65,486 Share of loss of equity-accounted investees 179,809 22,702 Cost for defined benefit plans 247,748 226,132 Warranty expense 111,364 25,127 Bad debt expenses 201,185 123,373 Loss on valuation of inventories 49,172 76,484 Impairment loss of assets held for sale 1,814 258,451 Impairment loss of goodwill and intangible assets 125,316 21,776 Gain on disposals of assets held for sale (101,611) (193,333)Others, net 40,821 (13,659)
4,812,618 4,169,102
Changes in operating assets and liabilities 40 (116,432) 1,933,358
Interest received 227,989 238,231 Interest paid (797,316) (874,711)Dividends received 193,008 178,317 Income taxes paid (816,912) (710,448)
Net cash provided by operating activities ₩ 4,858,135 7,319,456
December 31, 2013 December 31, 2012
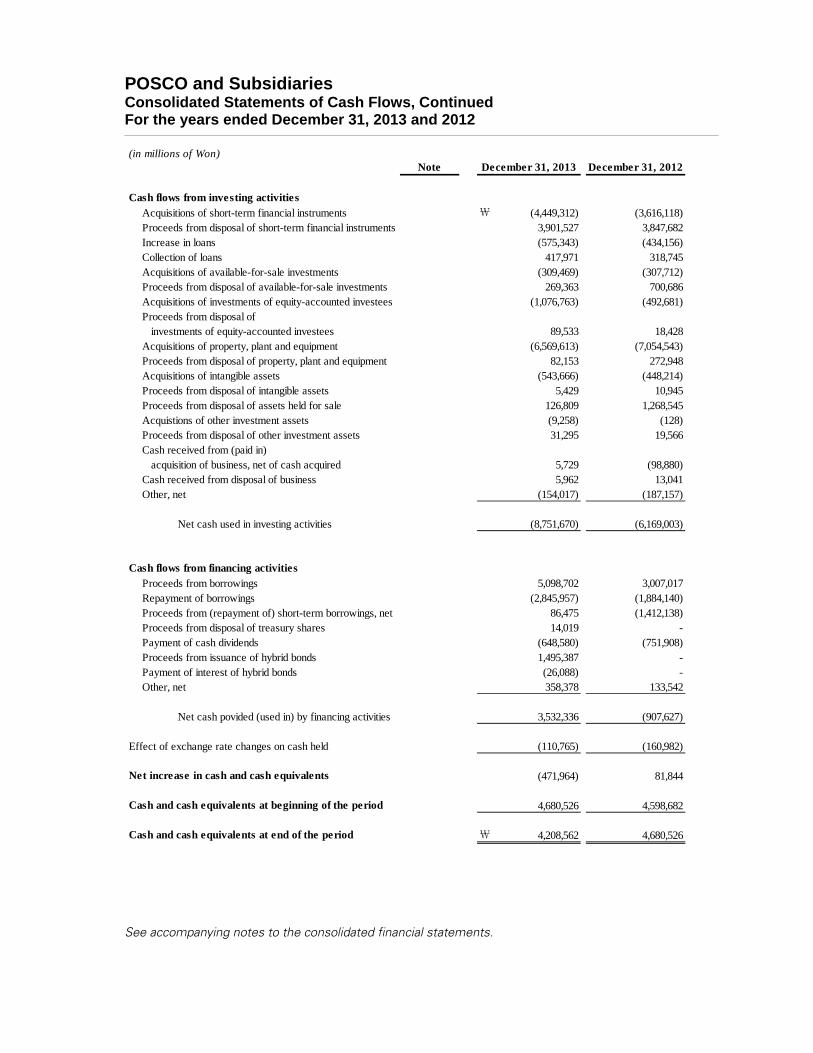
POSCO and Subsidiaries Consolidated Statements of Cash Flows, Continued For the years ended December 31, 2013 and 2012
See accompanying notes to the consolidated financial statements.
(in millions of Won)Note
Cash flows from investing activitiesAcquisitions of short-term financial instruments ₩ (4,449,312) (3,616,118)Proceeds from disposal of short-term financial instruments 3,901,527 3,847,682 Increase in loans (575,343) (434,156)Collection of loans 417,971 318,745 Acquisitions of available-for-sale investments (309,469) (307,712)Proceeds from disposal of available-for-sale investments 269,363 700,686 Acquisitions of investments of equity-accounted investees (1,076,763) (492,681)Proceeds from disposal of
investments of equity-accounted investees 89,533 18,428 Acquisitions of property, plant and equipment (6,569,613) (7,054,543)Proceeds from disposal of property, plant and equipment 82,153 272,948 Acquisitions of intangible assets (543,666) (448,214)Proceeds from disposal of intangible assets 5,429 10,945 Proceeds from disposal of assets held for sale 126,809 1,268,545 Acquistions of other investment assets (9,258) (128)Proceeds from disposal of other investment assets 31,295 19,566 Cash received from (paid in)
acquisition of business, net of cash acquired 5,729 (98,880)Cash received from disposal of business 5,962 13,041 Other, net (154,017) (187,157)
Net cash used in investing activities (8,751,670) (6,169,003)
Cash flows from financing activitiesProceeds from borrowings 5,098,702 3,007,017 Repayment of borrowings (2,845,957) (1,884,140)Proceeds from (repayment of) short-term borrowings, net 86,475 (1,412,138)Proceeds from disposal of treasury shares 14,019 -Payment of cash dividends (648,580) (751,908)Proceeds from issuance of hybrid bonds 1,495,387 -Payment of interest of hybrid bonds (26,088) -Other, net 358,378 133,542
Net cash povided (used in) by financing activities 3,532,336 (907,627)
Effect of exchange rate changes on cash held (110,765) (160,982)
Net increase in cash and cash equivalents (471,964) 81,844
Cash and cash equivalents at beginning of the period 4,680,526 4,598,682
Cash and cash equivalents at end of the period ₩ 4,208,562 4,680,526
December 31, 2012December 31, 2013
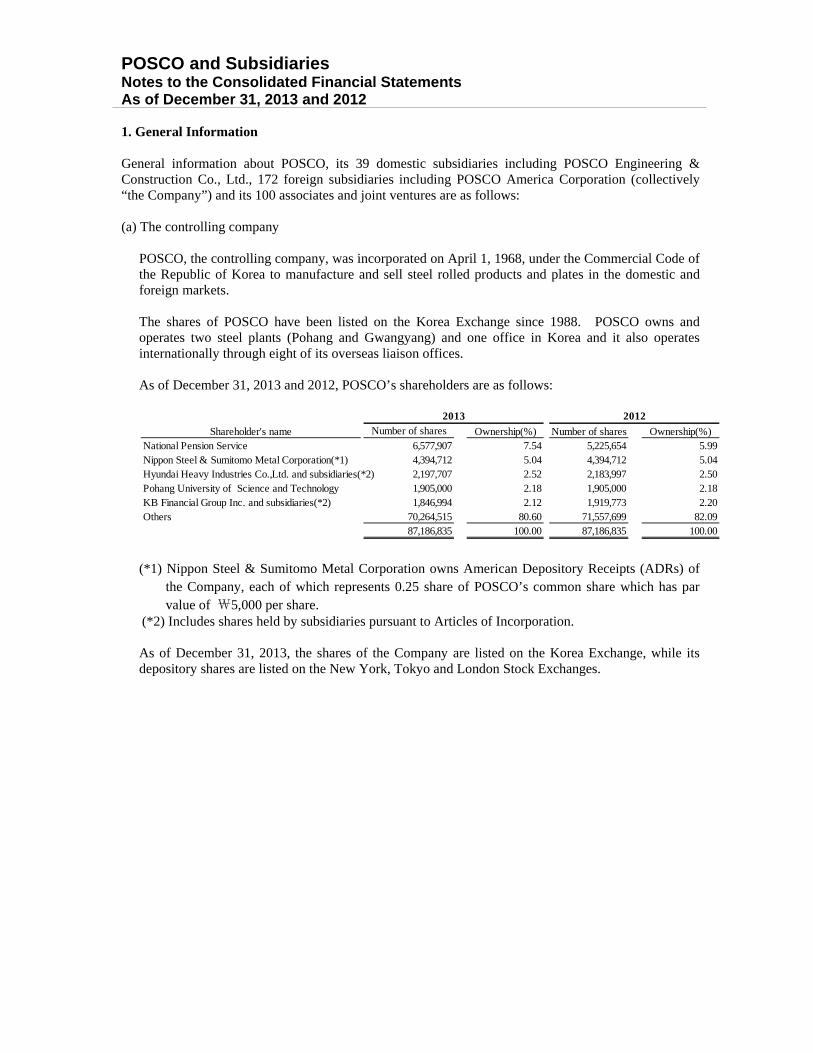
POSCO and Subsidiaries Notes to the Consolidated Financial Statements As of December 31, 2013 and 2012 1. General Information General information about POSCO, its 39 domestic subsidiaries including POSCO Engineering & Construction Co., Ltd., 172 foreign subsidiaries including POSCO America Corporation (collectively “the Company”) and its 100 associates and joint ventures are as follows: (a) The controlling company
POSCO, the controlling company, was incorporated on April 1, 1968, under the Commercial Code of the Republic of Korea to manufacture and sell steel rolled products and plates in the domestic and foreign markets.
The shares of POSCO have been listed on the Korea Exchange since 1988. POSCO owns and operates two steel plants (Pohang and Gwangyang) and one office in Korea and it also operates internationally through eight of its overseas liaison offices. As of December 31, 2013 and 2012, POSCO’s shareholders are as follows:
(*1) Nippon Steel & Sumitomo Metal Corporation owns American Depository Receipts (ADRs) of the Company, each of which represents 0.25 share of POSCO’s common share which has par value of ₩5,000 per share.
(*2) Includes shares held by subsidiaries pursuant to Articles of Incorporation. As of December 31, 2013, the shares of the Company are listed on the Korea Exchange, while its depository shares are listed on the New York, Tokyo and London Stock Exchanges.
Shareholder's name Ownership(%) Number of shares Ownership(%)National Pension Service 6,577,907 7.54 5,225,654 5.99Nippon Steel & Sumitomo Metal Corporation(*1) 4,394,712 5.04 4,394,712 5.04Hyundai Heavy Industries Co.,Ltd. and subsidiaries(*2) 2,197,707 2.52 2,183,997 2.50Pohang University of Science and Technology 1,905,000 2.18 1,905,000 2.18KB Financial Group Inc. and subsidiaries(*2) 1,846,994 2.12 1,919,773 2.20Others 70,264,515 80.60 71,557,699 82.09
87,186,835 100.00 87,186,835 100.00
20122013Number of shares

POSCO and Subsidiaries Notes to the Consolidated Financial Statements, Continued As of December 31, 2013 and 2012
(b) Consolidated subsidiaries Details of consolidated subsidiaries as of December 31, 2013 and 2012 are as follows :
POSCO Subsidiaries Total POSCO Subsidiaries Total Region[Domestic]
POSCO ENGINEERING & CONSTRUCTION CO., LTD. Engineering and construction 89.53 - 89.53 89.53 - 89.53 PohangPOSCO Processing&Service Steel sales and service 95.31 - 95.31 95.31 - 95.31 SeoulPOSCO COATED & COLOR STEEL Co., Ltd. Coated steel manufacturing 56.87 - 56.87 56.87 - 56.87 Pohang
POSCO PLANTEC Co., Ltd.Steel work maintenance and machinery installation
- - - 100.00 - 100.00 Pohang
POSCO ICTComputer hardware and software distribution
65.38 - 65.38 72.54 - 72.54 Seongnam
POSCO Research Institute Economic research and consulting 100.00 - 100.00 100.00 - 100.00 SeoulPOSMATE (former Seoung Gwang Co., Ltd.) Business facility maintenance 54.46 11.77 66.23 69.38 30.62 100.00 SuncheonPOSCO A&C Architecture and consulting 100.00 - 100.00 100.00 - 100.00 SeoulPOSCO Specialty Steel Co., Ltd. Steel manufacturing and sales 72.09 - 72.09 94.74 - 94.74 ChangwonPOSTECH Venture Capital Co., Ltd. Investment in venture companies 95.00 - 95.00 95.00 - 95.00 PohangeNtoB Corporation Electronic commerce 32.19 30.20 62.39 32.19 30.20 62.39 Seoul
POSCO CHEMTECHManufacturing and sellings of refractories
60.00 - 60.00 60.00 - 60.00 Pohang
POSCO-Terminal Co., Ltd. Transporting and warehousing 51.00 - 51.00 51.00 - 51.00 Gwangyang
POSCO M-TECH(*1) Packing materials manufacturing 48.85 - 48.85 48.85 - 48.85 Pohang
POSCO ENERGY CO., LTD. Generation of electricity 89.02 - 89.02 89.02 - 89.02 SeoulPostech 2006 Energy Fund(*2) Investment in new technologies - - - - 22.11 22.11 SeoulPOSCO TMC Co., Ltd. Component manufacturing 34.20 40.36 74.56 34.20 33.56 67.76 CheonanPOSCO NIPPON STEEL RHF JOINT VENTURE.CO.,Ltd. Steel manufacturing and sales 70.00 - 70.00 70.00 - 70.00 PohangMegaAsset Co.,Ltd. Real estate rental and sales - 100.00 100.00 - 100.00 100.00 CheonanPOSCO Engineering CO.,Ltd Construction and engneering service - 95.56 95.56 - 95.56 95.56 SeongnamPohang SPFC Co., Ltd. Steel manufacturing - - - - 90.00 90.00 PohangPOSWITH Co., Ltd. Industrial clean service - - - 100.00 - 100.00 PohangPOSCO AST Steel manufacturing and sales 100.00 - 100.00 100.00 - 100.00 AnsanPOSHIMETAL Co., Ltd. Steel manufacturing and sales 65.00 - 65.00 65.00 - 65.00 GwangyangPoscoene Handling & disposal of waste matter - 100.00 100.00 - 100.00 100.00 SeoulPOSFINE Co., Ltd. Non metallic minerals manufacturing 69.23 - 69.23 69.23 - 69.23 GwangyangPOSCO Humans Construction 90.30 - 90.30 85.25 - 85.25 PohangMapo Hibroad Parking co., Ltd. Construction - 71.00 71.00 - 71.00 71.00 SeoulDakos Co., Ltd. Railway equipment manufacturing - - - - 81.00 81.00 SeongnamSteel Processing and Fabricating Center Co.,LTD Steel manufacturing - 70.52 70.52 - 65.84 65.84 GwangyangPOSCALCIUM Company, Ltd. Non metallic minerals manufacturing - - - - 86.87 86.87 PohangPlant Engineering service Technology Co., Ltd. Engineering service - 100.00 100.00 - 100.00 100.00 Pohang9Digit Co., Ltd. Steel manufacturing - - - - 86.48 86.48 IncheonPostech Early Stage Fund(*2) Financial investment - - - - 10.00 10.00 PohangBusan E&E Co,. Ltd. Handling & disposal of waste matter 70.00 - 70.00 70.00 - 70.00 BusanPOSCO Family Strategy Fund Financial investment 60.79 39.21 100.00 60.79 39.21 100.00 PohangPOREKA Co., Ltd. Advertising agency 100.00 - 100.00 100.00 - 100.00 Seoul
Daewoo International CorporationTrading and Energy & Resource development
60.31 - 60.31 60.31 - 60.31 Seoul
POSCO LED Co., Ltd. LED lightening 16.70 63.30 80.00 16.70 63.30 80.00 SeongnamGunsan SPFC Co., Ltd. Steel processing and sales - - - - 70.09 70.09 GunsanPohang Scrap Recycling Distribution Center Co., Ltd. Steel processing and sales - 51.00 51.00 - 51.00 51.00 PohangPSC Energy Global Co., Ltd. Investment in energy industry - 100.00 100.00 - 100.00 100.00 PohangSuncheon Eco Trans Co., Ltd Train manufacturing & management 100.00 - 100.00 100.00 - 100.00 SuncheonReco Metal Co., Ltd. Smelting of metal - - - - 100.00 100.00 Hwasung
New Altec Co., LtdAluminum products manufacturing and sales
- 60.10 60.10 - 60.10 60.10 Incheon
PONUTech Co.,Ltd.Nuclear power plant design and repair service
- 100.00 100.00 - 100.00 100.00 Ulsan
BLUE O&M Co., Ltd. Service - - - - 100.00 100.00 Ulsan Tamra Offshore Wind Power Co., Ltd Cogeneration plant operation - 64.00 64.00 - 64.00 64.00 Jeju
POS-HiALAluminum products manufacturing and sales
- 51.00 51.00 - 65.30 65.30 Youngam
MCM Korea Iron ore sales & mine development - - - - 100.00 100.00 SeoulTancheonene Co.,Ltd Sewage heat energy supply - - - 5.00 95.00 100.00 Seoul
IT Engineering(*2) Automotive engineering service - 17.00 17.00 - - - Seoul
Principal Operations
Ownership (%)2013 2012

POSCO and Subsidiaries Notes to the Consolidated Financial Statements, Continued As of December 31, 2013 and 2012
Principal Operations POSCO Subsidiaries Total POSCO Subsidiaries Total Region[Foreign]
POSCO America Corporation Steel trading 99.45 0.55 100.00 99.45 0.55 100.00 USAPOSCO AUSTRALIA PTY LTD Iron ore sales & mine development 100.00 - 100.00 100.00 - 100.00 AustraliaPOSCO Canada Ltd. Coal sales - 100.00 100.00 - 100.00 100.00 CanadaPOSCAN Elkveiw Coal Ltd. Coal sales - 100.00 100.00 - 100.00 100.00 CanadaPOSCO Asia Co., Ltd. Steel and raw material trading 100.00 - 100.00 100.00 - 100.00 HongKongDalian POSCO Steel Co., Ltd Steel manufacturing - - - 30.00 55.00 85.00 ChinaPOSCO-CTPC Co., Ltd. Steel manufacturing 56.60 43.40 100.00 56.60 43.40 100.00 ChinaPOSCO-JKPC Co., Ltd. Steel manufacturing - 95.00 95.00 - 95.00 95.00 JapanINTERNATIONAL BUSINESS CENTER CORPORATION
Leasing service - 60.00 60.00 - 60.00 60.00 Vietnam
POSCO E&C Vietnam Co., Ltd. Steel manufacturing - 100.00 100.00 - 100.00 100.00 VietnamZhangjiagang Pohang Stainless Steel Co., Ltd.
Stainless steel manufacturing 58.60 23.88 82.48 58.60 23.88 82.48 China
POSCO (Guangdong) Steel Co., Ltd. Plating steel sheet manufacturing 87.04 10.04 97.08 87.04 10.04 97.08 ChinaPOSCO (Thailand) Company Limited Steel manufacturing 85.62 14.38 100.00 85.62 14.38 100.00 ThailandMyanmar POSCO Steel Co., Ltd Zinc relief manufacturing 70.00 - 70.00 70.00 - 70.00 MyanmarPOSCO-JOPC Co., Ltd. Steel manufacturing - 56.84 56.84 - 56.84 56.84 JapanPOSCO Investment Co., Ltd. Financial Service 100.00 - 100.00 100.00 - 100.00 HongKongPOSCO-MKPC SDN BHD Steel manufacturing 44.69 25.31 70.00 44.69 25.31 70.00 Malaysia Qingdao Pohang Stainless Steel Co., Ltd.
Stainless steel manufacturing 70.00 30.00 100.00 70.00 30.00 100.00 China
POSCO (Suzhou) Automotive Processing Center Co., Ltd.
Steel manufacturing 90.00 10.00 100.00 90.00 10.00 100.00 China
POSCO BIOVENTURES I, L.P. Bio tech Industry - 100.00 100.00 - 100.00 100.00 USA PT. POSNESIA Stainless Steel Industry
Steel manufacturing 70.00 - 70.00 70.00 - 70.00 Indonesia
POSEC Hawaii, Inc. Real estate Industry - 100.00 100.00 - 100.00 100.00 USAPOSCO-China Qingdao Processing Center Co., Ltd.
Steel manufacturing - 100.00 100.00 - 100.00 100.00 China
POS-ORE PTY LTD Iron ore sales & mine development - 100.00 100.00 - 100.00 100.00 AustraliaPOSCO-China Holding Corp. Holding company 100.00 - 100.00 100.00 - 100.00 ChinaPOSCO JAPAN Co., Ltd. Steel trading 100.00 - 100.00 100.00 - 100.00 JapanPOS-CD PTY LTD Coal sales - 100.00 100.00 - 100.00 100.00 AustraliaPOS-GC PTY LTD Coal sales - 100.00 100.00 - 100.00 100.00 AustraliaPOSCO-India Private Limited Steel manufacturing 100.00 - 100.00 100.00 - 100.00 IndiaPOSCO-India Pune Processing Center. Pvt. Ltd.
Steel manufacturing 65.00 - 65.00 65.00 - 65.00 India
POSCO-JEPC Co., Ltd. Steel manufacturing - 88.02 88.02 - 88.02 88.02 JapanPOSCO-CFPC Co., Ltd. Steel manufacturing 39.60 60.40 100.00 39.60 60.40 100.00 ChinaPOSCO E&C CHINA Co., Ltd. Construction and civil engineering - 100.00 100.00 - 100.00 100.00 ChinaPOSCO MPPC S.A. de C.V. Steel manufacturing - 95.00 95.00 - 95.00 95.00 MexicoZhangjigang Pohang Port Co., Ltd. Loading and unloading service - 100.00 100.00 - 100.00 100.00 ChinaQingdao Pos-metal Co., Ltd. Steel manufacturing - 100.00 100.00 - 100.00 100.00 ChinaPOSCO-VIETNAM Co., Ltd. Steel manufacturing 85.00 - 85.00 85.00 - 85.00 Vietnam
POSCO MEXICO S.A. DE C.V.Automotive steel sheet manufacturing
84.84 15.16 100.00 84.84 15.16 100.00 Mexico
POSCO India Delhi Steel Processing Centre Private Limited
Steel manufacturing 66.40 10.00 76.40 66.40 10.00 76.40 India
POSCO-Poland Wroclaw Processing Center Sp. z o. o.
Steel manufacturing 60.00 - 60.00 60.00 - 60.00 Poland
POS-NP PTY LTD Coal sales - 100.00 100.00 - 100.00 100.00 AustraliaPOSCO-Vietnam Processing Center Co., Ltd.
Steel manufacturing 91.63 - 91.63 91.63 - 91.63 Vietnam
POSCO(Chongqing) Automotive Processing Center Co., Ltd.
Steel manufacturing 90.00 10.00 100.00 90.00 10.00 100.00 China
SUZHOU POSCO-CORE TECHNOLOGY CO., LTD.
Component manufacturing - 100.00 100.00 - 100.00 100.00 China
POSCO-Malaysia SDN. BHD. Steel manufacturing 80.07 13.34 93.41 80.07 13.34 93.41 Malaysia POS-Minerals Corporation Mine development & sales - 100.00 100.00 - 100.00 100.00 USAPOSCO(Wuhu) Automotive Processing Center Co., Ltd.
Steel manufacturing 68.57 31.43 100.00 68.57 31.43 100.00 China
POSCO Engineering and Construction India Private Limited
Construction and engineering - 100.00 100.00 - 100.00 100.00 India
POSCO E&C SMART S DE RL DE CV Construction and engineering - 100.00 100.00 - 100.00 100.00 Mexico
POSCO Philippine Manila Processing Center, Inc.
Steel manufacturing - 100.00 100.00 - 100.00 100.00 Philippines
POSCO Gulf SFC LLC Steel manufacturing - 81.93 81.93 - 81.93 81.93 UAEDalian POSCO ICT-DONGFANG Engineering Co., Ltd.
Electric control equipment manufacturing
- 100.00 100.00 - 100.00 100.00 China
SANPU TRADING Co., Ltd. Raw material trading - 70.00 70.00 - 70.00 70.00 ChinaZhangjiagang BLZ Pohang International Trading
Steel transit trading - 100.00 100.00 - 100.00 100.00 China
POSCO MEXICO HUMAN TECH S.A. de C.V.
Service 80.00 20.00 100.00 80.00 20.00 100.00 Mexico
POSCO MESDC S.A. DE C.V. Steel product sales - 56.80 56.80 - 56.80 56.80 Mexico
December 31, 2013 December 31, 2012Ownership (%)

POSCO and Subsidiaries Notes to the Consolidated Financial Statements, Continued As of December 31, 2013 and 2012
Principal Operations POSCO Subsidiaries Total POSCO Subsidiaries Total Region[Foreign]
POSCO ICT-China IT service and DVR business - 100.00 100.00 - 100.00 100.00 ChinaDWEMEX, S.A.DE.C.V. Construction - 99.00 99.00 - 99.00 99.00 MexicoPOSCO MPC Servicios S.A. de C.V. Steel manufacturing - 61.00 61.00 - 61.00 61.00 MexicoPOSCO-Uruguay S.A Lumber manufacturing & sales 98.00 - 98.00 98.00 - 98.00 UruguayPos-Sea Pte Ltd Steel transit trading - 67.54 67.54 - 67.54 67.54 SingaporePOSCO Europe Steel Distribution Center
Steel product sales 50.00 20.00 70.00 50.00 20.00 70.00 Slovenia
VECTUS LIMITED PRT test track construction - 99.57 99.57 - 99.57 99.57 England
Zeus(Cayman) Service 100.00 - 100.00 100.00 - 100.00CaymanIslands
POSCO VST CO., LTD. Stainless steel manufacturing 95.65 - 95.65 95.65 - 95.65 VietnamPOSCO Maharashtra Steel Private Limited
Steel manufacturing 100.00 - 100.00 100.00 - 100.00 India
POSCO India Chennai Steel Processing Centre Pvt.Ltd.
Steel manufacturing 100.00 - 100.00 100.00 - 100.00 India
POSCO TNPC Otomotiv Celik San. Ve Tic. A.S
Steel manufacturing 100.00 - 100.00 100.00 - 100.00 Turkey
POSCO Vietnam Ha Noi Processing Center Co., Ltd.
Steel manufacturing 70.00 - 70.00 70.00 - 70.00 Vietnam
POSCO(Liaoning) Automotive Processing Center Co., Ltd.
Steel manufacturing 90.00 10.00 100.00 90.00 10.00 100.00 China
POSCO-Indonesia Jakarta Processing Center
Steel manufacturing 65.00 20.00 85.00 65.00 20.00 85.00 Indonesia
POSCO E&C VENEZUELA C.A. Construction and engineering - 100.00 100.00 - 100.00 100.00 VenezuelaMotta Resources Indonesia Mine development 65.00 - 65.00 65.00 - 65.00 IndonesiaPOSCO TMC INDIA PRIVATE LIMITED
Steel manufacturing - 100.00 100.00 - 100.00 100.00 India
POSCO America Alabama Processing Center Co., Ltd.
Steel manufacturing - 100.00 100.00 - 100.00 100.00 USA
PT PEN INDONESIA Construction - 95.00 95.00 - 95.00 95.00 IndonesiaPOSCO(Yantai)Automotive Processing Center Co., Ltd.
Steel manufacturing 90.00 10.00 100.00 90.00 10.00 100.00 China
POSCO India Steel Distribution Center Private Ltd.
Steel logistics - 100.00 100.00 - 100.00 100.00 India
POSCO China Dalian Plate Processing Center Co., Ltd.
Steel manufacturing 80.00 10.00 90.00 80.00 10.00 90.00 China
POSCO-South Asia Company Limited
Steel product sales 100.00 - 100.00 100.00 - 100.00 Thailand
POSCO SS-VINA Steel manufacturing - 100.00 100.00 - 100.00 100.00 VietnamPOSCO-NCR Coal Ltd. Coal sales - 100.00 100.00 - 100.00 100.00 CanadaPOSCO WA PTY LTD Iron ore sales & mine development 100.00 - 100.00 100.00 - 100.00 AustraliaPOSCO Engineering and Construction - UZ
Construction - 100.00 100.00 - 100.00 100.00 Uzbekistan
POSCO AUSTRALIA GP PTY LIMITED
Resource development - 100.00 100.00 - 100.00 100.00 Australia
Daewoo International (America) Corp. Trading business - 100.00 100.00 - 100.00 100.00 USADaewoo International (Deutschland) GmbH.
Trading business - 100.00 100.00 - 100.00 100.00 Germany
Daewoo International Japan Corp. Trading business - 100.00 100.00 - 100.00 100.00 JapanDAEWOO INTERNATIONAL SINGAPORE PTE. LTD.
Trading business - 100.00 100.00 - 100.00 100.00 Singapore
Daewoo Italia S.r.l. Trading business - 100.00 100.00 - 100.00 100.00 ItalyDaewoo (China) Co., Ltd. Trading business - 100.00 100.00 - 100.00 100.00 ChinaDAEWOO TEXTILE FERGANA LLC Textile manufacturing - 100.00 100.00 - 100.00 100.00 UzbekistanDAEWOO TEXTILE BUKHARA LLC Textile manufacturing - 100.00 100.00 - 100.00 100.00 UzbekistanDAEWOO INTERNATIONAL AUSTRALIA HOLDINGS PTY LTD
Resource development - 100.00 100.00 - 100.00 100.00 Australia
Daewoo Paper Manufacturing Co., Ltd. Paper manufacturing - 66.70 66.70 - 66.70 66.70 ChinaTianjin Daewoo Paper Manufacturing Co., Ltd. Paper manufacturing - 68.30 68.30 - 68.30 68.30 ChinaPOSCO MAURITIUS LIMITED Mine development & sales - 100.00 100.00 - 100.00 100.00 MauritiusPT. KRAKATAU POSCO Steel manufacturing 70.00 - 70.00 70.00 - 70.00 IndonesiaMyanmar Daewoo Limited Trading business - 100.00 100.00 - 100.00 100.00 MyanmarDAEWOO INTERNATIONAL MEXICO S.A. DE C.V.
Trading business - 100.00 100.00 - 100.00 100.00 Mexico
Daewoo International Guangzhou Corp. Trading business - 100.00 100.00 - 100.00 100.00 ChinaDAEWOO STC VINA LTD. Textile manufacturing - - - - 100.00 100.00 VietnamDaewoo (M) SDN. BHD. Trading business - 100.00 100.00 - 100.00 100.00 Malaysia Daewoo CANADA LTD. Trading business - - - - 100.00 100.00 Canada
Daewoo EL SALVADOR S.A. DE C.V. Trading business - 88.00 88.00 - 88.00 88.00 El Salvador
GEZIRA TANNERY CO., LTD. Leather manufacturing - - - - 60.00 60.00 Sudan
Ownership (%)December 31, 2013 December 31, 2012
POSCO and Subsidiaries Notes to the Consolidated Financial Statements, Continued As of December 31, 2013 and 2012
Principal Operations POSCO Subsidiaries Total POSCO Subsidiaries Total Region[Foreign]
POSCO (Zhangjiagang) STS Processing Center Co., Ltd
Steel manufacturing - 100.00 100.00 - 100.00 100.00 China
Daewoo International (M) SDN BHD Trading business - 100.00 100.00 - 100.00 100.00 Malaysia Daewoo International SHANGHAI CO., LTD.
Trading business - 100.00 100.00 - 100.00 100.00 China
DAEWOO POWER AND INFRA (PTY) LTD. Electricity - 100.00 100.00 - - -Republic ofSouth Africa
PGSF, L.P. Investment in Bio tech Industry - 100.00 100.00 - 100.00 100.00 USA
Xenesys Inc.Power generation equipment manufacturing
29.58 21.35 50.93 29.58 21.35 50.93 Japan
Daewoo International INDIA Private Ltd.
Trading business - 100.00 100.00 - 100.00 100.00 India
TECHREN Solar, LLC Electrical Industry - 99.92 99.92 - 99.92 99.92 USAPT. POSCO E&C INDONESIA Construction - 100.00 100.00 - 100.00 100.00 IndonesiaHUME COAL PTY LTD Raw material manufacturing - 100.00 100.00 - 70.00 70.00 AustraliaDaewoo HANDELS GmbH Trading business - - - - 100.00 100.00 GermanyPOSCO FOUNDATION Non-profit charitable organization - 100.00 100.00 - 100.00 100.00 IndiaEPC EQUITIES LLP Construction - 70.00 70.00 - 70.00 70.00 EnglandSANTOS CMI CONSTRUCTION TRADING LLP
Construction - 99.90 99.90 - 99.90 99.90 England
SANTOS CMI INC. USA Construction - 100.00 100.00 - 100.00 100.00 USASANTOS CMI ENGENHARIA E CONSTRUCOES LTDA
Construction - 99.98 99.98 - 99.98 99.98 Brazil
SANTOS CMI PERU S.A. Construction - 99.99 99.99 - 99.99 99.99 PeruSANTOS CMI COSTA RICA S.A. Construction - - - - 100.00 100.00 Coasta RicaSANTOS CMI CONSTRUCCIONES S.A.
Construction - 100.00 100.00 - 100.00 100.00 Uruguay
GENTECH INTERNATIONAL INC. Construction - 90.00 90.00 - 90.00 90.00 PanamaEPC INVESTMENTS C.V. Construction - 99.99 99.99 - 99.99 99.99 NetherlandsINGENIERiA Y CONSTRUCCION HOLAND CO S.A.
Construction - - - - 99.90 99.90 Ecuador
ASESORiA Y SERVICIOS EPC S.A CHILE
Construction - - - - 99.00 99.00 Chile
SANTOSCMI S.A. Construction - 70.00 70.00 - 70.00 70.00 EcuadorSANTOSCMI CONSTRUCCIONES DE CHILE S.A.
Construction - 99.00 99.00 - 99.00 99.00 Chile
S&K -SANTOSCMI S.A. DE C.V. Construction - 99.00 99.00 - 99.00 99.00 Mexico
COMPANIADEAUTOMATIZACION& CONTROL, GENESYS S.A.
Construction - 90.00 90.00 - 90.00 90.00 Ecuador
VAUTIDAMERICAS S.A. Construction - 51.00 51.00 - 51.00 51.00 EcuadorSANTOS CMI Constructions Argentina S.A.
Construction - - - - 95.00 95.00 Argentina
POSCO ENGINEERING & CONSTRUCTION DO BRAZIL LTDA.
Construction - 100.00 100.00 - 100.00 100.00 Brazil
POSCO Electrical Steel India Private Limited
Electrical Steel manufacturing 100.00 - 100.00 100.00 - 100.00 India
Daewoo International Cameroon S.A.
Resource Development - 100.00 100.00 - 100.00 100.00 Cameroon
POSCO ASSAN TST STEEL INDUSTRY
Steel manufacturing 60.00 10.00 70.00 60.00 10.00 70.00 Turkey
HONG KONG POSCO E&C (CHINA) INVESTMENT Co., Ltd.
Investment - 100.00 100.00 - 100.00 100.00 HongKong
POSCO Klappan Coal Ltd. Coal sales - 100.00 100.00 - 100.00 100.00 Canada
DAESAN (CAMBODIA) Co., Ltd. Investment - 100.00 100.00 - 100.00 100.00 CambodiaBrazil Sao Paulo Steel Processing Center
Steel manufacturing - 76.00 76.00 - 76.00 76.00 Brazil
POSCO(Dalian) IT Center Development Co., Ltd.
Investment - 100.00 100.00 - 100.00 100.00 China
PT. POSCO RESOURCES INDONESIA
Mine development 100.00 - 100.00 100.00 - 100.00 Indonesia
PT.POSCO ICT INDONESIAIT service and Electric Control Engineering
- 66.99 66.99 - 66.99 66.99 Indonesia
PT. POSCO MTECH INDONESIA Steel manufacturing - 60.00 60.00 - 60.00 60.00 IndonesiaPT. KRAKATAU POSCO ENERGY Manufacturing & management - 90.00 90.00 - 90.00 90.00 IndonesiaPOSCO RUS LLC Trading business 90.00 10.00 100.00 90.00 10.00 100.00 RussiaPOSCO Thainox Public Company Limited
Steel manufacturing 84.93 - 84.93 84.93 - 84.93 Thailand
DAEWOO INTERNATIONAL SHANGHAI WAIGAOQIAO CO., LTD.
Merchandising trade - 100.00 100.00 - 100.00 100.00 China
PT. Bio Inti Agrindo Forest resources development - 85.00 85.00 - 85.00 85.00 IndonesiaPOSCO ENGINEERING AND CONSTRUCTION AUSTRALIA (POSCO E&C AUSTRALIA) PTY LTD
Iron ore sales - 100.00 100.00 - 100.00 100.00 Australia
POSCO-TISCO (JILIN) PROCESSING CENTER Co., Ltd. Steel manufacturing 50.00 10.00 60.00 50.00 10.00 60.00 ChinaHunchun Posco Hyundai International Logistics Complex Development Co., Ltd
Logistics - 72.93 72.93 - 78.15 78.15 China
USA-SRDC Scrap sales - 100.00 100.00 - 100.00 100.00 USADaewoo International Vietnam Co., Ltd.
Trading business - 100.00 100.00 - 100.00 100.00 Vietnam
PT.Krakatau Posco Chemtech Calcination
Manufacturing and selling of quicklime
- 80.00 80.00 - 80.00 80.00 Indonesia
Ownership (%)December 31, 2013 December 31, 2012
POSCO and Subsidiaries Notes to the Consolidated Financial Statements, Continued As of December 31, 2013 and 2012
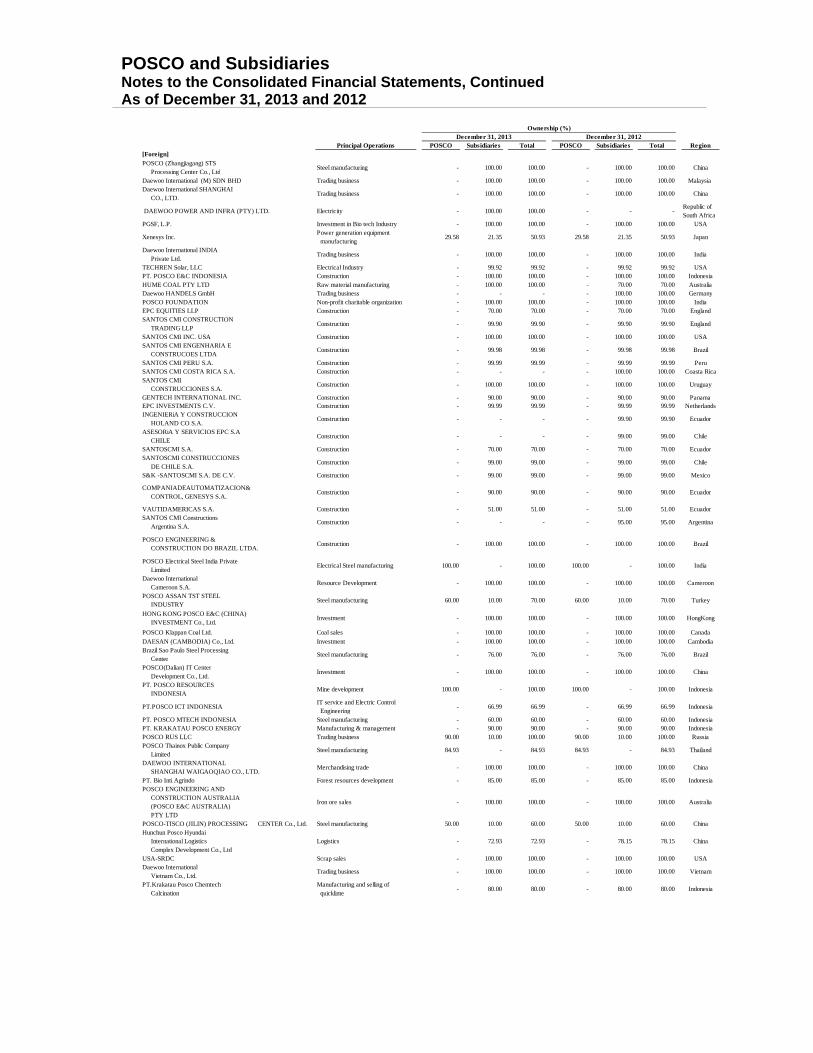
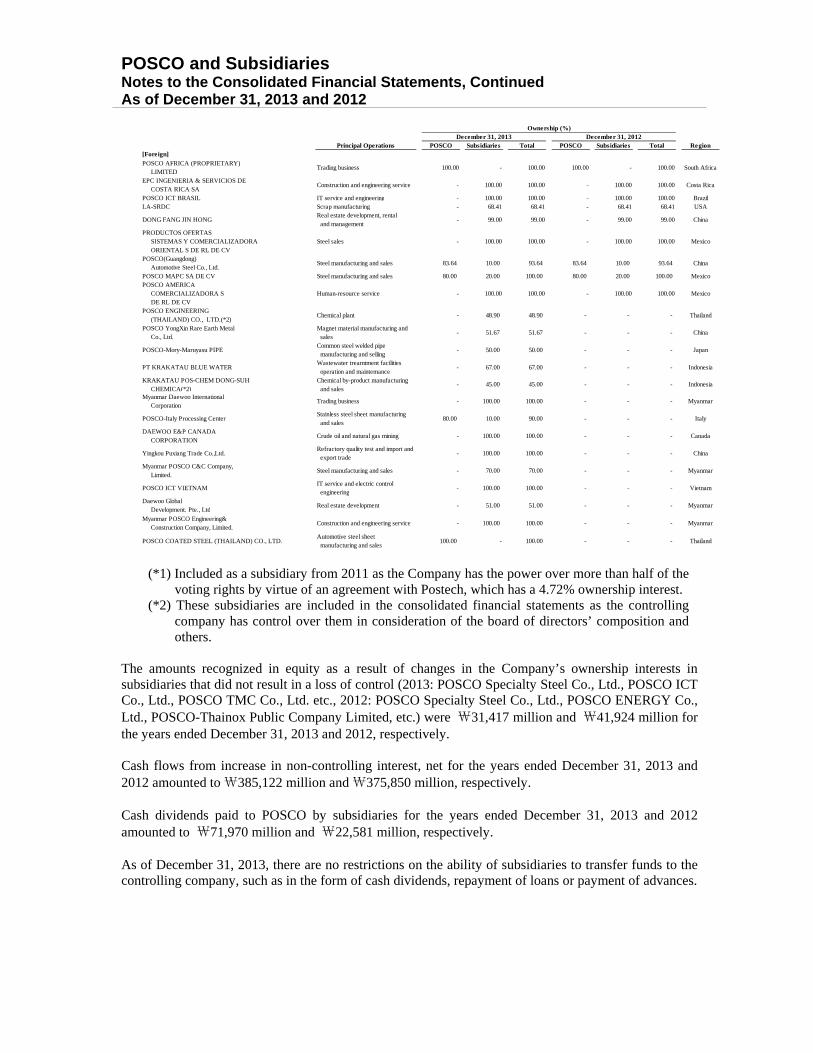
(*1) Included as a subsidiary from 2011 as the Company has the power over more than half of the voting rights by virtue of an agreement with Postech, which has a 4.72% ownership interest.
(*2) These subsidiaries are included in the consolidated financial statements as the controlling company has control over them in consideration of the board of directors’ composition and others.
The amounts recognized in equity as a result of changes in the Company’s ownership interests in subsidiaries that did not result in a loss of control (2013: POSCO Specialty Steel Co., Ltd., POSCO ICT Co., Ltd., POSCO TMC Co., Ltd. etc., 2012: POSCO Specialty Steel Co., Ltd., POSCO ENERGY Co., Ltd., POSCO-Thainox Public Company Limited, etc.) were ₩31,417 million and ₩41,924 million for the years ended December 31, 2013 and 2012, respectively. Cash flows from increase in non-controlling interest, net for the years ended December 31, 2013 and 2012 amounted to ₩385,122 million and ₩375,850 million, respectively. Cash dividends paid to POSCO by subsidiaries for the years ended December 31, 2013 and 2012 amounted to ₩71,970 million and ₩22,581 million, respectively. As of December 31, 2013, there are no restrictions on the ability of subsidiaries to transfer funds to the controlling company, such as in the form of cash dividends, repayment of loans or payment of advances.
Principal Operations POSCO Subsidiaries Total POSCO Subsidiaries Total Region[Foreign]
POSCO AFRICA (PROPRIETARY) LIMITED
Trading business 100.00 - 100.00 100.00 - 100.00 South Africa
EPC INGENIERIA & SERVICIOS DE COSTA RICA SA
Construction and engineering service - 100.00 100.00 - 100.00 100.00 Costa Rica
POSCO ICT BRASIL IT service and engineering - 100.00 100.00 - 100.00 100.00 BrazilLA-SRDC Scrap manufacturing - 68.41 68.41 - 68.41 68.41 USA
DONG FANG JIN HONGReal estate development, rental and management
- 99.00 99.00 - 99.00 99.00 China
PRODUCTOS OFERTAS SISTEMAS Y COMERCIALIZADORA ORIENTAL S DE RL DE CV
Steel sales - 100.00 100.00 - 100.00 100.00 Mexico
POSCO(Guangdong) Automotive Steel Co., Ltd.
Steel manufacturing and sales 83.64 10.00 93.64 83.64 10.00 93.64 China
POSCO MAPC SA DE CV Steel manufacturing and sales 80.00 20.00 100.00 80.00 20.00 100.00 MexicoPOSCO AMERICA COMERCIALIZADORA S DE RL DE CV
Human-resource service - 100.00 100.00 - 100.00 100.00 Mexico
POSCO ENGINEERING (THAILAND) CO., LTD.(*2)
Chemical plant - 48.90 48.90 - - - Thailand
POSCO YongXin Rare Earth Metal Co., Ltd.
Magnet material manufacturing and sales
- 51.67 51.67 - - - China
POSCO-Mory-Maruyasu PIPECommon steel welded pipe manufacturing and selling
- 50.00 50.00 - - - Japan
PT KRAKATAU BLUE WATERWastewater treamtment facilities operation and maintemance
- 67.00 67.00 - - - Indonesia
KRAKATAU POS-CHEM DONG-SUH CHEMICA(*2)
Chemical by-product manufacturing and sales
- 45.00 45.00 - - - Indonesia
Myanmar Daewoo International Corporation
Trading business - 100.00 100.00 - - - Myanmar
POSCO-Italy Processing CenterStainless steel sheet manufacturing and sales
80.00 10.00 90.00 - - - Italy
DAEWOO E&P CANADA CORPORATION
Crude oil and natural gas mining - 100.00 100.00 - - - Canada
Yingkou Puxiang Trade Co.,Ltd.Refractory quality test and import and export trade
- 100.00 100.00 - - - China
Myanmar POSCO C&C Company, Limited.
Steel manufacturing and sales - 70.00 70.00 - - - Myanmar
POSCO ICT VIETNAMIT service and electric control engineering
- 100.00 100.00 - - - Vietnam
Daewoo Global Development. Pte., Ltd
Real estate development - 51.00 51.00 - - - Myanmar
Myanmar POSCO Engineering& Construction Company, Limited.
Construction and engineering service - 100.00 100.00 - - - Myanmar
POSCO COATED STEEL (THAILAND) CO., LTD.Automotive steel sheet manufacturing and sales
100.00 - 100.00 - - - Thailand
December 31, 2013 December 31, 2012Ownership (%)

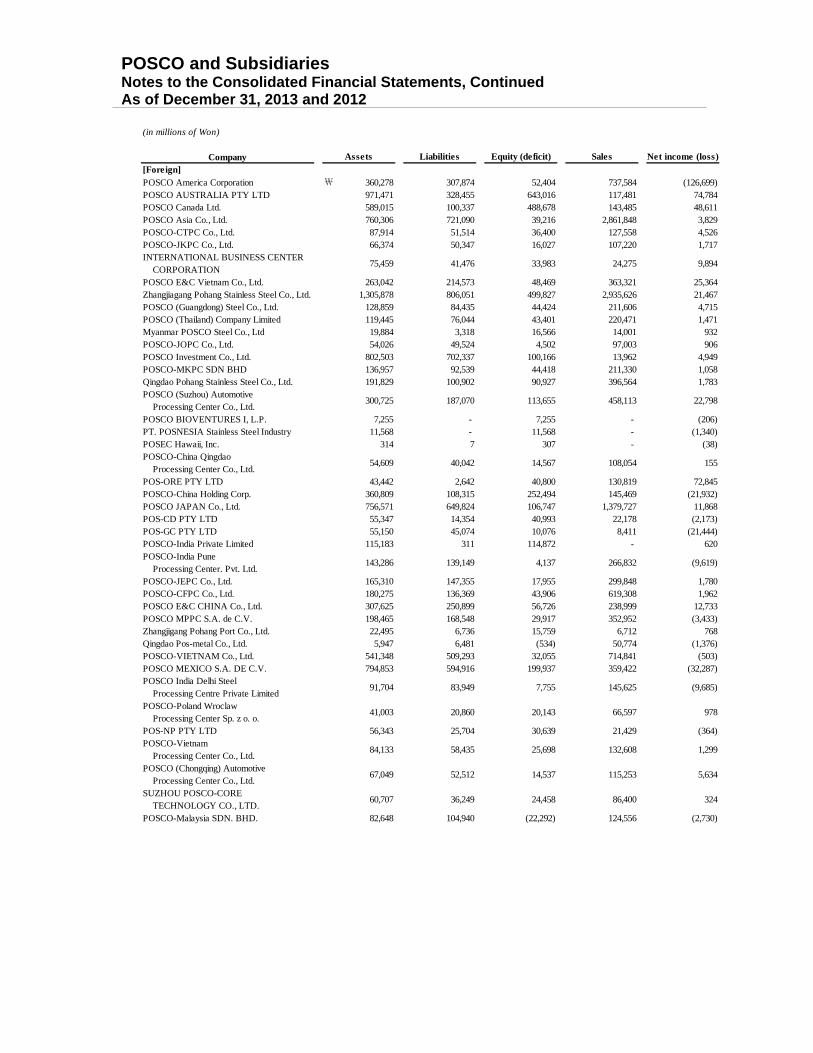
POSCO and Subsidiaries Notes to the Consolidated Financial Statements, Continued As of December 31, 2013 and 2012 (c) Summarized financial information of subsidiaries as of December 31, 2013 and 2012 are as follows:
1) December 31, 2013
(in millions of Won)
Company[Domestic]POSCO ENGINEERING & CONSTRUCTION., LTD.
₩ 6,853,318 3,885,127 2,968,191 8,028,269 98,714
POSCO Processing&Service 1,061,686 367,791 693,895 2,745,727 35,941POSCO COATED & COLOR STEEL Co., Ltd.
449,661 280,097 169,564 821,183 (5,173)
POSCO ICT 733,968 327,728 406,240 1,050,747 33,796POSCO Research Institute 36,841 10,051 26,790 58,519 1,167POSMATE 214,286 56,247 158,039 118,489 8,501POSCO A&C 98,502 56,578 41,924 154,053 (6,076)POSCO Specialty Steel Co., Ltd. 1,792,904 533,797 1,259,107 1,316,781 31,703POSTECH Venture Capital Co., Ltd. 118,603 11,186 107,417 11,506 3,506eNtoB Corporation 89,371 56,789 32,582 648,761 1,414POSCO CHEMTECH 588,671 139,399 449,272 1,280,591 59,953POSCO-Terminal Co., Ltd. 134,787 9,443 125,344 104,586 22,152POSCO M-TECH 346,577 193,375 153,202 902,541 (10,649)POSCO ENERGY CO., LTD. 4,022,984 2,433,704 1,589,280 2,901,117 143,976POSCO TMC Co., Ltd. 209,745 117,890 91,855 319,580 447POSCO NIPPON STEEL RHF JOINT VENTURE.CO.,Ltd.
139,612 92,134 47,478 56,789 2,601
MegaAsset Co.,Ltd. 136,387 87,750 48,637 83,809 183POSCO Engineering CO.,Ltd 608,624 435,380 173,244 1,013,115 10,286POSCO AST 508,189 354,591 153,598 611,458 (3,006)POSHIMETAL Co., Ltd. 359,240 350,158 9,082 179,550 (12,109)Poscoene 22,447 91 22,356 - 66POSFINE Co., Ltd. 58,252 44,852 13,400 28,974 1,560POSCO Humans 13,691 4,179 9,512 33,116 286Mapo Hibroad Parking co., Ltd. 1,544 300 1,244 - (36)Steel Processing and Fabricating Center Co.,LTD
169,437 136,488 32,949 194,018 (2,558)
Plant Engineering service Technology Co., Ltd.
6,754 2,970 3,784 10,731 1,385
Busan E&E Co,. Ltd. 113,287 73,609 39,678 136,279 (1,820)POSCO Family Strategy Fund 61,033 7 61,026 1,082 (5,298)POREKA Co., Ltd. 19,403 15,468 3,935 23,961 69Daewoo International Corporation 7,739,676 5,524,030 2,215,646 16,601,358 132,541POSCO LED Co., Ltd. 57,561 50,419 7,142 60,693 (7,029)Pohang Scrap Recycling Distribution Center Co., Ltd.
17,072 511 16,561 5,530 734
PSC Energy Global Co., Ltd. 96,058 - 96,058 - (13,890)Suncheon Eco Trans Co., Ltd 67,768 46,467 21,301 - (1,065)New Altec Co., Ltd 131,244 34,473 96,771 81,318 (1,366)PONUTech Co.,Ltd. 117,033 80,881 36,152 56,151 (560)Tamra Offshore Wind Power Co., Ltd 26,728 - 26,728 - (12)POS-HiAL 59,836 43,460 16,376 - (2,521)IT Engineering 7,026 3,349 3,677 11,293 133
Assets Liabilities Equity (deficit) Sales Net income (loss)
POSCO and Subsidiaries Notes to the Consolidated Financial Statements, Continued As of December 31, 2013 and 2012
(in millions of Won)
Company[Foreign]POSCO America Corporation ₩ 360,278 307,874 52,404 737,584 (126,699)POSCO AUSTRALIA PTY LTD 971,471 328,455 643,016 117,481 74,784POSCO Canada Ltd. 589,015 100,337 488,678 143,485 48,611POSCO Asia Co., Ltd. 760,306 721,090 39,216 2,861,848 3,829POSCO-CTPC Co., Ltd. 87,914 51,514 36,400 127,558 4,526POSCO-JKPC Co., Ltd. 66,374 50,347 16,027 107,220 1,717INTERNATIONAL BUSINESS CENTER CORPORATION
75,459 41,476 33,983 24,275 9,894
POSCO E&C Vietnam Co., Ltd. 263,042 214,573 48,469 363,321 25,364Zhangjiagang Pohang Stainless Steel Co., Ltd. 1,305,878 806,051 499,827 2,935,626 21,467POSCO (Guangdong) Steel Co., Ltd. 128,859 84,435 44,424 211,606 4,715POSCO (Thailand) Company Limited 119,445 76,044 43,401 220,471 1,471Myanmar POSCO Steel Co., Ltd 19,884 3,318 16,566 14,001 932POSCO-JOPC Co., Ltd. 54,026 49,524 4,502 97,003 906POSCO Investment Co., Ltd. 802,503 702,337 100,166 13,962 4,949POSCO-MKPC SDN BHD 136,957 92,539 44,418 211,330 1,058Qingdao Pohang Stainless Steel Co., Ltd. 191,829 100,902 90,927 396,564 1,783POSCO (Suzhou) Automotive Processing Center Co., Ltd.
300,725 187,070 113,655 458,113 22,798
POSCO BIOVENTURES I, L.P. 7,255 - 7,255 - (206)PT. POSNESIA Stainless Steel Industry 11,568 - 11,568 - (1,340)POSEC Hawaii, Inc. 314 7 307 - (38)POSCO-China Qingdao Processing Center Co., Ltd.
54,609 40,042 14,567 108,054 155
POS-ORE PTY LTD 43,442 2,642 40,800 130,819 72,845POSCO-China Holding Corp. 360,809 108,315 252,494 145,469 (21,932)POSCO JAPAN Co., Ltd. 756,571 649,824 106,747 1,379,727 11,868POS-CD PTY LTD 55,347 14,354 40,993 22,178 (2,173)POS-GC PTY LTD 55,150 45,074 10,076 8,411 (21,444)POSCO-India Private Limited 115,183 311 114,872 - 620POSCO-India Pune Processing Center. Pvt. Ltd.
143,286 139,149 4,137 266,832 (9,619)
POSCO-JEPC Co., Ltd. 165,310 147,355 17,955 299,848 1,780POSCO-CFPC Co., Ltd. 180,275 136,369 43,906 619,308 1,962POSCO E&C CHINA Co., Ltd. 307,625 250,899 56,726 238,999 12,733POSCO MPPC S.A. de C.V. 198,465 168,548 29,917 352,952 (3,433)Zhangjigang Pohang Port Co., Ltd. 22,495 6,736 15,759 6,712 768Qingdao Pos-metal Co., Ltd. 5,947 6,481 (534) 50,774 (1,376)POSCO-VIETNAM Co., Ltd. 541,348 509,293 32,055 714,841 (503)POSCO MEXICO S.A. DE C.V. 794,853 594,916 199,937 359,422 (32,287)POSCO India Delhi Steel Processing Centre Private Limited
91,704 83,949 7,755 145,625 (9,685)
POSCO-Poland Wroclaw Processing Center Sp. z o. o.
41,003 20,860 20,143 66,597 978
POS-NP PTY LTD 56,343 25,704 30,639 21,429 (364)POSCO-Vietnam Processing Center Co., Ltd.
84,133 58,435 25,698 132,608 1,299
POSCO (Chongqing) Automotive Processing Center Co., Ltd.
67,049 52,512 14,537 115,253 5,634
SUZHOU POSCO-CORE TECHNOLOGY CO., LTD.
60,707 36,249 24,458 86,400 324
POSCO-Malaysia SDN. BHD. 82,648 104,940 (22,292) 124,556 (2,730)
Assets Liabilities Equity (deficit) Sales Net income (loss)

POSCO and Subsidiaries Notes to the Consolidated Financial Statements, Continued As of December 31, 2013 and 2012
(in millions of Won)
Company[Foreign]POS-Minerals Corporation ₩ 217,664 119,701 97,963 - (5,815)POSCO (Wuhu) Automotive Processing Center Co., Ltd.
69,625 44,536 25,089 113,011 2,758
POSCO Engineering and Construction India Private Limited
18,098 11,083 7,015 76,805 1,034
POSCO E&C SMART S DE RL DE CV 20,993 17,054 3,939 21,562 2,194POSCO Philippine Manila Processing Center, Inc.
29,045 19,037 10,008 32,582 726
POSCO Gulf SFC LLC 53,831 48,441 5,390 23,585 (1,951)Dalian POSCO ICT-DONGFANG Engineering Co., Ltd.
7,630 5,037 2,593 7,564 318
SANPU TRADING Co., Ltd. 1,806 3 1,803 70 24Zhangjiagang BLZ Pohang International Trading
10,036 5,050 4,986 52,649 187
POSCO MEXICO HUMAN TECH S.A. de C.V.
1,035 908 127 9,267 101
POSCO MESDC S.A. DE C.V. 12,574 491 12,083 4,784 203POSCO ICT-China 2,566 1,742 824 6,957 163DWEMEX, S.A.DE.C.V. 183 19 164 - (12)POSCO MPC Servicios S.A. de C.V. 1,152 875 277 6,591 57POSCO-Uruguay S.A 22,805 120 22,685 1 (891)Pos-Sea Pte Ltd 12,724 9,855 2,869 122,439 675POSCO Europe Steel Distribution Center 7,564 1,205 6,359 13,769 458POSCO ENGINEERING (THAILAND) CO., LTD.
21,082 20,357 725 23,492 741
VECTUS LIMITED 954 15,565 (14,611) 5,240 (5,155)POSCO VST CO., LTD. 399,242 371,409 27,833 377,478 (24,136)POSCO Maharashtra Steel Private Limited 942,836 832,247 110,589 224,385 (111,675)POSCO India Chennai Steel Processing Centre Pvt.Ltd.
93,623 89,043 4,580 183,304 (4,247)
POSCO TNPC Otomotiv Celik San. Ve Tic. A.S
41,597 34,336 7,261 64,185 (1,923)
POSCO Vietnam Ha Noi Processing Center Co., Ltd.
56,855 50,358 6,497 110,108 995
POSCO (Liaoning) Automotive Processing Center Co., Ltd.
73,083 46,710 26,373 113,971 3,297
POSCO-Indonesia Jakarta Processing Center
106,838 89,768 17,070 80,534 (5,110)
POSCO E&C VENEZUELA C.A. 126 - 126 - - Motta Resources Indonesia 4,264 18,259 (13,995) - (5,522)POSCO TMC INDIA PRIVATE LIMITED 9,095 7,211 1,884 18,376 (29)POSCO America Alabama Processing Center Co., Ltd.
46,816 34,958 11,858 107,780 339
PT PEN INDONESIA 4,681 3,707 974 20,037 (1,289)POSCO (Yantai) Automotive Processing Center Co., Ltd.
45,863 27,874 17,989 64,784 2,124
POSCO India Steel Distribution Center Private Ltd.
6,063 4,413 1,650 5,526 (144)
POSCO China Dalian Plate Processing Center Co., Ltd.
88,337 67,680 20,657 29,843 (10,876)
POSCO-South Asia Company Limited 13,061 235 12,826 10,214 1,049POSCO SS-VINA 505,785 264,716 241,069 - (1,586)POSCO WA PTY LTD 317,250 38 317,212 - (6,338)POSCO Engineering and Construction - UZ 3,964 3,039 925 2,690 406POSCO AUSTRALIA GP PTY LIMITED 38,786 4 38,782 - (18,523)POSCO YongXin Rare Earth Metal Co., Ltd. 23,925 33,715 (9,790) 3,962 (9,194)
Assets Liabilities Equity (deficit) Sales Net income (loss)
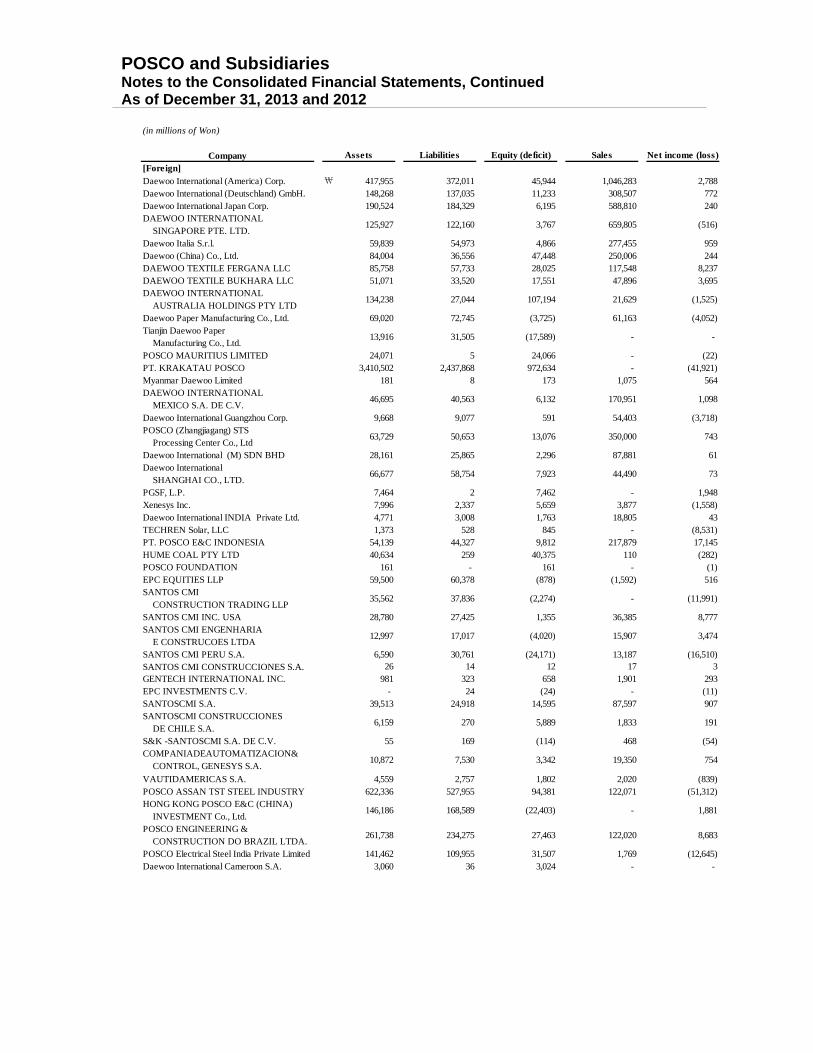
POSCO and Subsidiaries Notes to the Consolidated Financial Statements, Continued As of December 31, 2013 and 2012
(in millions of Won)
Company[Foreign]Daewoo International (America) Corp. ₩ 417,955 372,011 45,944 1,046,283 2,788Daewoo International (Deutschland) GmbH. 148,268 137,035 11,233 308,507 772Daewoo International Japan Corp. 190,524 184,329 6,195 588,810 240DAEWOO INTERNATIONAL SINGAPORE PTE. LTD.
125,927 122,160 3,767 659,805 (516)
Daewoo Italia S.r.l. 59,839 54,973 4,866 277,455 959Daewoo (China) Co., Ltd. 84,004 36,556 47,448 250,006 244DAEWOO TEXTILE FERGANA LLC 85,758 57,733 28,025 117,548 8,237DAEWOO TEXTILE BUKHARA LLC 51,071 33,520 17,551 47,896 3,695DAEWOO INTERNATIONAL AUSTRALIA HOLDINGS PTY LTD
134,238 27,044 107,194 21,629 (1,525)
Daewoo Paper Manufacturing Co., Ltd. 69,020 72,745 (3,725) 61,163 (4,052)Tianjin Daewoo Paper Manufacturing Co., Ltd.
13,916 31,505 (17,589) - -
POSCO MAURITIUS LIMITED 24,071 5 24,066 - (22)PT. KRAKATAU POSCO 3,410,502 2,437,868 972,634 - (41,921)Myanmar Daewoo Limited 181 8 173 1,075 564DAEWOO INTERNATIONAL MEXICO S.A. DE C.V.
46,695 40,563 6,132 170,951 1,098
Daewoo International Guangzhou Corp. 9,668 9,077 591 54,403 (3,718)POSCO (Zhangjiagang) STS Processing Center Co., Ltd
63,729 50,653 13,076 350,000 743
Daewoo International (M) SDN BHD 28,161 25,865 2,296 87,881 61Daewoo International SHANGHAI CO., LTD.
66,677 58,754 7,923 44,490 73
PGSF, L.P. 7,464 2 7,462 - 1,948Xenesys Inc. 7,996 2,337 5,659 3,877 (1,558)Daewoo International INDIA Private Ltd. 4,771 3,008 1,763 18,805 43TECHREN Solar, LLC 1,373 528 845 - (8,531)PT. POSCO E&C INDONESIA 54,139 44,327 9,812 217,879 17,145HUME COAL PTY LTD 40,634 259 40,375 110 (282)POSCO FOUNDATION 161 - 161 - (1)EPC EQUITIES LLP 59,500 60,378 (878) (1,592) 516SANTOS CMI CONSTRUCTION TRADING LLP
35,562 37,836 (2,274) - (11,991)
SANTOS CMI INC. USA 28,780 27,425 1,355 36,385 8,777SANTOS CMI ENGENHARIA E CONSTRUCOES LTDA
12,997 17,017 (4,020) 15,907 3,474
SANTOS CMI PERU S.A. 6,590 30,761 (24,171) 13,187 (16,510)SANTOS CMI CONSTRUCCIONES S.A. 26 14 12 17 3GENTECH INTERNATIONAL INC. 981 323 658 1,901 293EPC INVESTMENTS C.V. - 24 (24) - (11)SANTOSCMI S.A. 39,513 24,918 14,595 87,597 907SANTOSCMI CONSTRUCCIONES DE CHILE S.A.
6,159 270 5,889 1,833 191
S&K -SANTOSCMI S.A. DE C.V. 55 169 (114) 468 (54)COMPANIADEAUTOMATIZACION& CONTROL, GENESYS S.A.
10,872 7,530 3,342 19,350 754
VAUTIDAMERICAS S.A. 4,559 2,757 1,802 2,020 (839)POSCO ASSAN TST STEEL INDUSTRY 622,336 527,955 94,381 122,071 (51,312)HONG KONG POSCO E&C (CHINA) INVESTMENT Co., Ltd.
146,186 168,589 (22,403) - 1,881
POSCO ENGINEERING & CONSTRUCTION DO BRAZIL LTDA.
261,738 234,275 27,463 122,020 8,683
POSCO Electrical Steel India Private Limited 141,462 109,955 31,507 1,769 (12,645)Daewoo International Cameroon S.A. 3,060 36 3,024 - -
Assets Liabilities Equity (deficit) Sales Net income (loss)
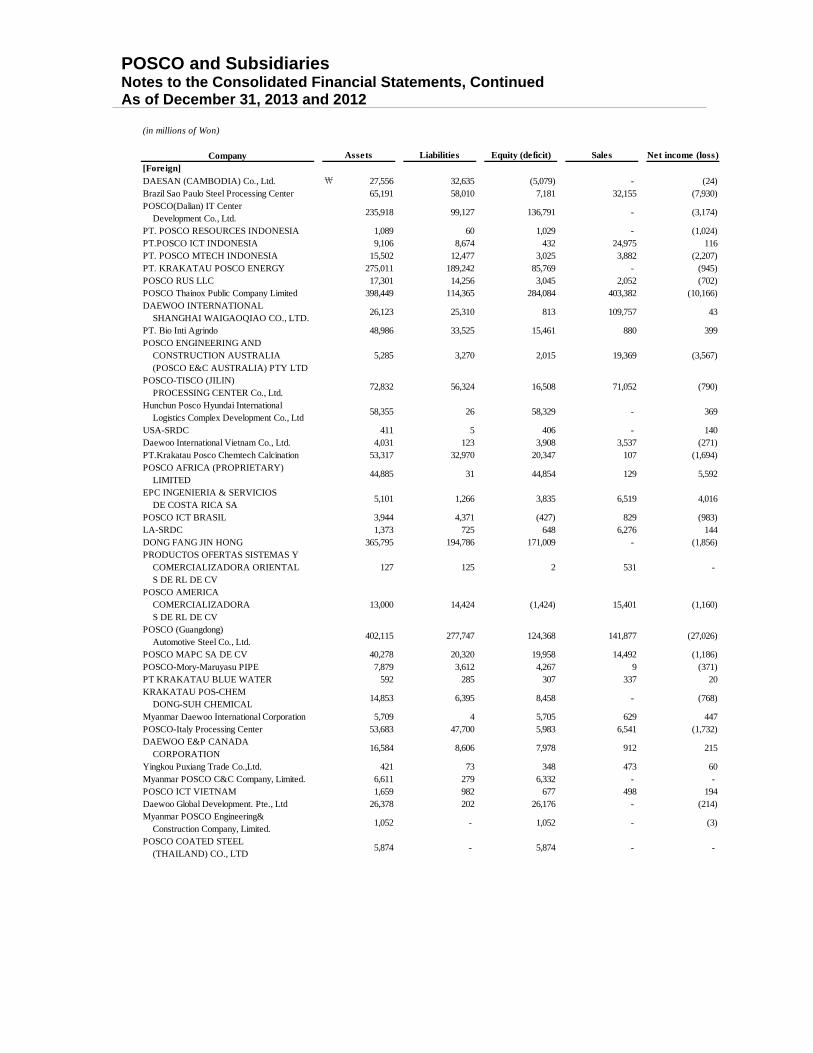
POSCO and Subsidiaries Notes to the Consolidated Financial Statements, Continued As of December 31, 2013 and 2012
(in millions of Won)
Company[Foreign]DAESAN (CAMBODIA) Co., Ltd. ₩ 27,556 32,635 (5,079) - (24)Brazil Sao Paulo Steel Processing Center 65,191 58,010 7,181 32,155 (7,930)POSCO(Dalian) IT Center Development Co., Ltd.
235,918 99,127 136,791 - (3,174)
PT. POSCO RESOURCES INDONESIA 1,089 60 1,029 - (1,024)PT.POSCO ICT INDONESIA 9,106 8,674 432 24,975 116PT. POSCO MTECH INDONESIA 15,502 12,477 3,025 3,882 (2,207)PT. KRAKATAU POSCO ENERGY 275,011 189,242 85,769 - (945)POSCO RUS LLC 17,301 14,256 3,045 2,052 (702)POSCO Thainox Public Company Limited 398,449 114,365 284,084 403,382 (10,166)DAEWOO INTERNATIONAL SHANGHAI WAIGAOQIAO CO., LTD.
26,123 25,310 813 109,757 43
PT. Bio Inti Agrindo 48,986 33,525 15,461 880 399POSCO ENGINEERING AND CONSTRUCTION AUSTRALIA (POSCO E&C AUSTRALIA) PTY LTD
5,285 3,270 2,015 19,369 (3,567)
POSCO-TISCO (JILIN) PROCESSING CENTER Co., Ltd.
72,832 56,324 16,508 71,052 (790)
Hunchun Posco Hyundai International Logistics Complex Development Co., Ltd
58,355 26 58,329 - 369
USA-SRDC 411 5 406 - 140Daewoo International Vietnam Co., Ltd. 4,031 123 3,908 3,537 (271)PT.Krakatau Posco Chemtech Calcination 53,317 32,970 20,347 107 (1,694)POSCO AFRICA (PROPRIETARY) LIMITED
44,885 31 44,854 129 5,592
EPC INGENIERIA & SERVICIOS DE COSTA RICA SA
5,101 1,266 3,835 6,519 4,016
POSCO ICT BRASIL 3,944 4,371 (427) 829 (983)LA-SRDC 1,373 725 648 6,276 144DONG FANG JIN HONG 365,795 194,786 171,009 - (1,856)PRODUCTOS OFERTAS SISTEMAS Y COMERCIALIZADORA ORIENTAL S DE RL DE CV
127 125 2 531 -
POSCO AMERICA COMERCIALIZADORA S DE RL DE CV
13,000 14,424 (1,424) 15,401 (1,160)
POSCO (Guangdong) Automotive Steel Co., Ltd.
402,115 277,747 124,368 141,877 (27,026)
POSCO MAPC SA DE CV 40,278 20,320 19,958 14,492 (1,186)POSCO-Mory-Maruyasu PIPE 7,879 3,612 4,267 9 (371)PT KRAKATAU BLUE WATER 592 285 307 337 20KRAKATAU POS-CHEM DONG-SUH CHEMICAL
14,853 6,395 8,458 - (768)
Myanmar Daewoo International Corporation 5,709 4 5,705 629 447POSCO-Italy Processing Center 53,683 47,700 5,983 6,541 (1,732)DAEWOO E&P CANADA CORPORATION
16,584 8,606 7,978 912 215
Yingkou Puxiang Trade Co.,Ltd. 421 73 348 473 60Myanmar POSCO C&C Company, Limited. 6,611 279 6,332 - - POSCO ICT VIETNAM 1,659 982 677 498 194Daewoo Global Development. Pte., Ltd 26,378 202 26,176 - (214)Myanmar POSCO Engineering& Construction Company, Limited.
1,052 - 1,052 - (3)
POSCO COATED STEEL (THAILAND) CO., LTD
5,874 - 5,874 - -
Assets Liabilities Equity (deficit) Sales Net income (loss)

POSCO and Subsidiaries Notes to the Consolidated Financial Statements, Continued As of December 31, 2013 and 2012
2) December 31, 2012
(in millions of Won)
Company[Domestic]POSCO ENGINEERING & CONSTRUCTION., LTD.
₩ 7,893,306 5,007,149 2,886,157 7,041,300 346,107
POSCO Processing&Service 1,084,473 456,338 628,135 2,770,764 8,087POSCO COATED & COLOR STEEL Co., Ltd.
468,910 294,718 174,192 853,499 (47,444)
POSCO Plant Engineering Co., Ltd. 255,831 162,662 93,169 523,227 2,121POSCO ICT 802,675 527,641 275,034 1,017,662 40,089POSCO Research Institute 34,138 9,239 24,899 46,340 535POSMATE 83,439 33,998 49,441 12,667 685POSCO A&C 87,019 40,382 46,637 160,667 (6,227)POSCO Specialty Steel Co., Ltd. 1,496,939 484,585 1,012,354 1,405,667 69,091POSTECH Venture Capital Co., Ltd. 107,796 501 107,295 6,475 1,438eNtoB Corporation 103,000 71,712 31,288 607,230 1,839POSCO CHEMTECH 533,402 134,298 399,104 1,292,356 78,554POSCO-Terminal Co., Ltd. 120,483 14,806 105,677 111,275 25,796POSCO M-TECH 340,877 169,150 171,727 618,316 14,737POSCO ENERGY CO., LTD. 3,315,742 2,374,622 941,120 2,805,208 177,796Postech 2006 Energy Fund 26,000 950 25,050 6,141 385POSCO TMC Co., Ltd. 253,987 163,175 90,812 268,574 152POSCO NIPPON STEEL RHF JOINT VENTURE.CO.,Ltd.
149,117 104,272 44,845 72,607 13,380
MegaAsset Co.,Ltd. 112,729 64,252 48,477 14,274 1,402POSCO Engineering CO.,Ltd 562,645 383,154 179,491 881,279 1,141Pohang SPFC Co., Ltd. 29,514 22,941 6,573 75,513 816POSWITH Co., Ltd. 5,140 2,366 2,774 14,873 105POSCO AST 453,410 298,192 155,218 372,185 4,564POSHIMETAL Co., Ltd. 341,640 321,197 20,443 155,274 (19,369)Poscoene 22,787 52 22,735 - 407POSFINE Co., Ltd. 58,480 46,640 11,840 19,651 (2,304)POSCO Humans 8,274 1,822 6,452 14,513 108Mapo Hibroad Parking co., Ltd. 1,561 281 1,280 - (285)Dakos Co., Ltd. 670 191 479 245 16Steel Processing and Fabricating Center Co.,LTD
85,814 76,909 8,905 39,472 (6,539)
POSCALCIUM Company, Ltd. 7,637 6,528 1,109 155 (1,790)Plant Engineering service Technology Co., Ltd.
3,620 1,316 2,304 8,332 477
9Digit Co., Ltd. 27,458 22,798 4,660 289,912 (431)Postech Early Stage Fund 9,869 - 9,869 163 (100)Busan E&E Co,. Ltd. 79,054 37,470 41,584 67,419 (745)POSCO Family Strategy Fund 66,390 - 66,390 1,368 362POREKA Co., Ltd. 16,785 12,967 3,818 40,560 1,389Daewoo International Corporation 6,989,140 4,866,242 2,122,898 17,011,373 306,041POSCO LED Co., Ltd. 37,735 23,523 14,212 41,278 (8,205)Gunsan SPFC Co., Ltd. 61,683 41,606 20,077 70,443 (692)Pohang Scrap Recycling Distribution Center Co., Ltd.
19,435 3,207 16,228 5,657 1,270
PSC Energy Global Co., Ltd. 61,168 - 61,168 - (3,060)Suncheon Eco Trans Co., Ltd 49,496 27,118 22,378 - (251)Reco Mteal Co., Ltd. 32,959 35,547 (2,588) 42,482 (4,736)New Altec Co., Ltd 126,527 28,488 98,039 95,474 1,376PONUTech Co.,Ltd. 133,854 97,105 36,749 53,662 (5,825)BLUE O&M Co., Ltd. 900 21 879 232 (110)Tamra Offshore Wind Power Co., Ltd 20,074 2 20,072 - (56)POS-HiAL 47,314 32,852 14,462 - (1,158)MCM Korea 50 - 50 - -Tancheonene Co.,Ltd 5,606 17 5,589 - (165)
Assets Liabilities Equity (deficit) Sales Net income (loss)

POSCO and Subsidiaries Notes to the Consolidated Financial Statements, Continued As of December 31, 2013 and 2012
(in millions of Won)
Company[Foreign]POSCO America Corporation ₩ 510,392 333,246 177,146 803,368 (1,338)POSCO AUSTRALIA PTY LTD 1,195,398 477,894 717,504 118,874 23,634POSCO Canada Ltd. 555,972 47,925 508,047 205,885 62,584POSCO Asia Co., Ltd. 586,971 550,913 36,058 2,616,390 2,148Dalian POSCO Steel Co., Ltd. 29,078 47,280 (18,202) 18,615 (9,958)POSCO-CTPC Co., Ltd. 82,206 50,391 31,815 132,510 1,481POSCO-JKPC Co., Ltd. 79,788 61,793 17,995 115,531 3,108INTERNATIONAL BUSINESS CENTER CORPORATION
81,465 46,210 35,255 25,340 10,987
POSCO E&C Vietnam Co., Ltd. 127,161 102,831 24,330 187,325 14,331Zhangjiagang Pohang Stainless Steel Co., Ltd. 1,340,336 867,576 472,760 2,786,474 (79,016)POSCO (Guangdong) Steel Co., Ltd. 141,727 102,418 39,309 221,738 (20,980)POSCO (Thailand) Company Limited 155,836 110,059 45,777 255,611 5,611Myanmar POSCO Steel Co., Ltd 23,699 7,810 15,889 19,484 2,569POSCO-JOPC Co., Ltd. 78,402 73,817 4,585 114,432 647POSCO Investment Co., Ltd. 718,078 621,268 96,810 13,461 6,000POSCO-MKPC SDN BHD 159,191 111,749 47,442 232,088 107Qingdao Pohang Stainless Steel Co., Ltd. 206,941 117,753 89,188 514,354 (17,445)POSCO (Suzhou) Automotive Processing Center Co., Ltd.
284,046 195,684 88,362 407,513 8,425
POSCO BIOVENTURES I, L.P. 7,571 - 7,571 - (1,301)PT. POSNESIA Stainless Steel Industry 14,978 1,926 13,052 - (55)POSEC Hawaii, Inc. 350 2 348 - (35)POSCO-China Qingdao Processing Center Co., Ltd.
47,351 33,119 14,232 111,017 (623)
POS-ORE PTY LTD 59,784 11,043 48,741 163,407 75,389POSCO-China Holding Corp. 438,538 184,127 254,411 138,067 3,055POSCO JAPAN Co., Ltd. 852,406 735,583 116,823 1,659,045 16,218POS-CD PTY LTD 68,681 17,931 50,750 12,869 (9,603)POS-GC PTY LTD 83,998 49,598 34,400 20,160 (10,905)POSCO-India Private Limited 131,409 306 131,103 - (768)POSCO-India Pune Processing Center. Pvt. Ltd.
179,112 164,386 14,726 252,296 (6,061)
POSCO-JEPC Co., Ltd. 221,086 200,769 20,317 351,377 4,769POSCO-CFPC Co., Ltd. 218,881 177,426 41,455 515,773 727POSCO E&C CHINA Co., Ltd. 145,448 101,733 43,715 169,956 8,459POSCO MPPC S.A. de C.V. 204,770 178,108 26,662 359,768 (7,137)Zhangjigang Pohang Port Co., Ltd. 23,889 9,070 14,819 6,542 255Qingdao Pos-metal Co., Ltd. 10,429 9,628 801 59,165 (1,313)POSCO-VIETNAM Co., Ltd. 572,453 539,426 33,027 805,214 (46,619)POSCO MEXICO S.A. DE C.V. 772,518 538,907 233,611 430,986 (12,354)POSCO India Delhi Steel Processing Centre Private Limited
100,153 81,218 18,935 142,038 977
POSCO-Poland Wroclaw Processing Center Sp. z o. o.
56,394 37,399 18,995 97,381 5,875
POS-NP PTY LTD 62,868 26,259 36,609 28,872 (4,363)POSCO-Vietnam Processing Center Co., Ltd. 64,551 39,418 25,133 137,641 58POSCO (Chongqing) Automotive Processing Center Co., Ltd.
63,038 54,523 8,515 93,615 (729)
SUZHOU POSCO-CORE TECHNOLOGY CO., LTD.
52,746 29,180 23,566 83,910 (1,055)
POSCO-Malaysia SDN. BHD. 74,431 96,028 (21,597) 153,122 1,529
Assets Liabilities Equity (deficit) Sales Net income (loss)
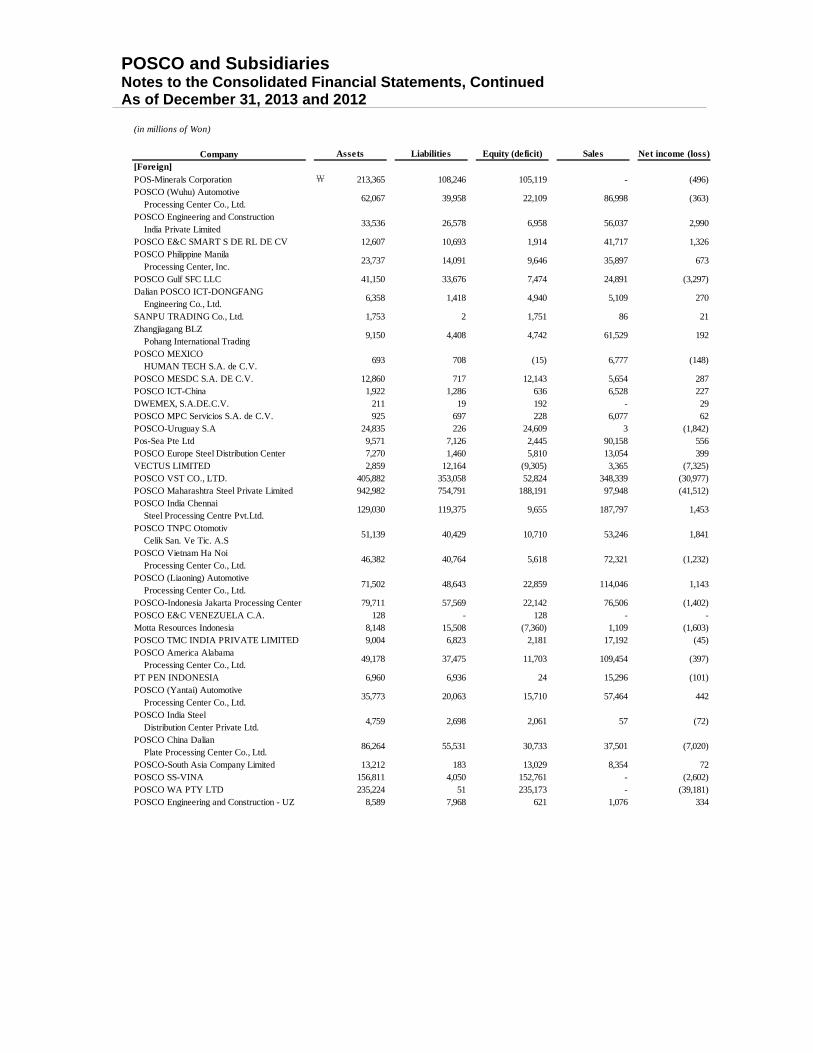
POSCO and Subsidiaries Notes to the Consolidated Financial Statements, Continued As of December 31, 2013 and 2012
(in millions of Won)
Company[Foreign]POS-Minerals Corporation ₩ 213,365 108,246 105,119 - (496)POSCO (Wuhu) Automotive Processing Center Co., Ltd.
62,067 39,958 22,109 86,998 (363)
POSCO Engineering and Construction India Private Limited
33,536 26,578 6,958 56,037 2,990
POSCO E&C SMART S DE RL DE CV 12,607 10,693 1,914 41,717 1,326POSCO Philippine Manila Processing Center, Inc.
23,737 14,091 9,646 35,897 673
POSCO Gulf SFC LLC 41,150 33,676 7,474 24,891 (3,297)Dalian POSCO ICT-DONGFANG Engineering Co., Ltd.
6,358 1,418 4,940 5,109 270
SANPU TRADING Co., Ltd. 1,753 2 1,751 86 21Zhangjiagang BLZ Pohang International Trading
9,150 4,408 4,742 61,529 192
POSCO MEXICO HUMAN TECH S.A. de C.V.
693 708 (15) 6,777 (148)
POSCO MESDC S.A. DE C.V. 12,860 717 12,143 5,654 287POSCO ICT-China 1,922 1,286 636 6,528 227DWEMEX, S.A.DE.C.V. 211 19 192 - 29POSCO MPC Servicios S.A. de C.V. 925 697 228 6,077 62POSCO-Uruguay S.A 24,835 226 24,609 3 (1,842)Pos-Sea Pte Ltd 9,571 7,126 2,445 90,158 556POSCO Europe Steel Distribution Center 7,270 1,460 5,810 13,054 399VECTUS LIMITED 2,859 12,164 (9,305) 3,365 (7,325)POSCO VST CO., LTD. 405,882 353,058 52,824 348,339 (30,977)POSCO Maharashtra Steel Private Limited 942,982 754,791 188,191 97,948 (41,512)POSCO India Chennai Steel Processing Centre Pvt.Ltd.
129,030 119,375 9,655 187,797 1,453
POSCO TNPC Otomotiv Celik San. Ve Tic. A.S
51,139 40,429 10,710 53,246 1,841
POSCO Vietnam Ha Noi Processing Center Co., Ltd.
46,382 40,764 5,618 72,321 (1,232)
POSCO (Liaoning) Automotive Processing Center Co., Ltd.
71,502 48,643 22,859 114,046 1,143
POSCO-Indonesia Jakarta Processing Center 79,711 57,569 22,142 76,506 (1,402)POSCO E&C VENEZUELA C.A. 128 - 128 - -Motta Resources Indonesia 8,148 15,508 (7,360) 1,109 (1,603)POSCO TMC INDIA PRIVATE LIMITED 9,004 6,823 2,181 17,192 (45)POSCO America Alabama Processing Center Co., Ltd.
49,178 37,475 11,703 109,454 (397)
PT PEN INDONESIA 6,960 6,936 24 15,296 (101)POSCO (Yantai) Automotive Processing Center Co., Ltd.
35,773 20,063 15,710 57,464 442
POSCO India Steel Distribution Center Private Ltd.
4,759 2,698 2,061 57 (72)
POSCO China Dalian Plate Processing Center Co., Ltd.
86,264 55,531 30,733 37,501 (7,020)
POSCO-South Asia Company Limited 13,212 183 13,029 8,354 72POSCO SS-VINA 156,811 4,050 152,761 - (2,602)POSCO WA PTY LTD 235,224 51 235,173 - (39,181)POSCO Engineering and Construction - UZ 8,589 7,968 621 1,076 334
Assets Liabilities Equity (deficit) Sales Net income (loss)
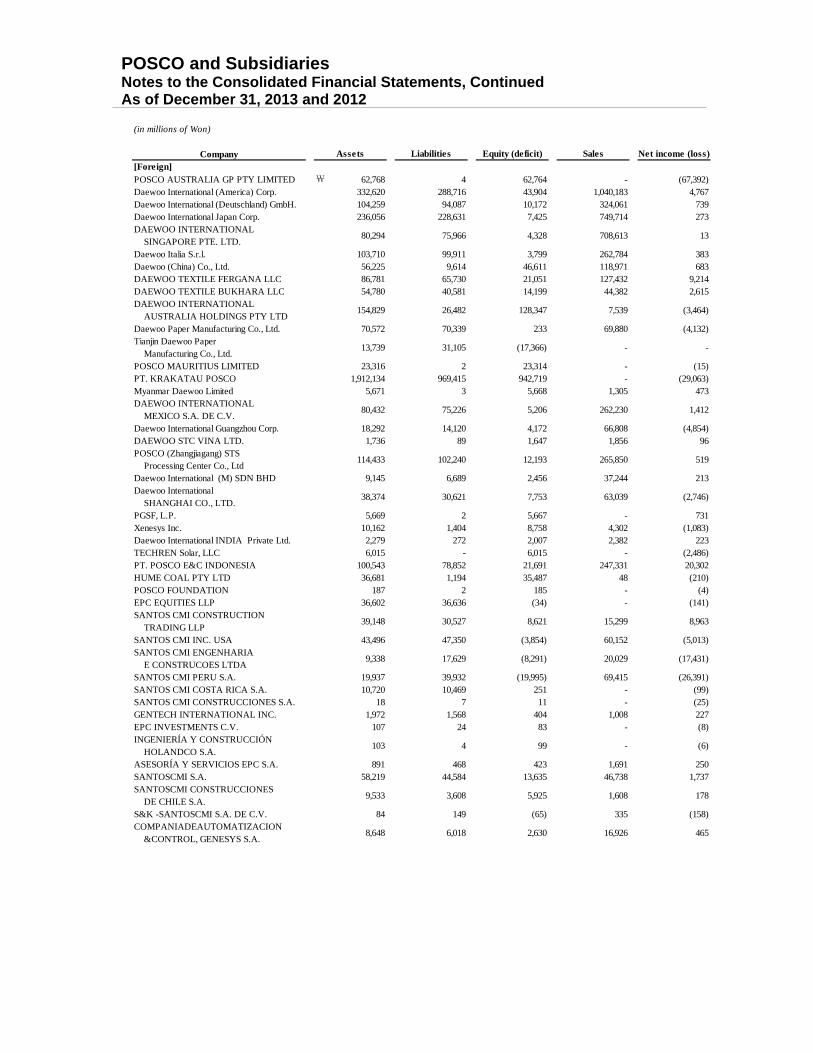
POSCO and Subsidiaries Notes to the Consolidated Financial Statements, Continued As of December 31, 2013 and 2012
(in millions of Won)
Company[Foreign]POSCO AUSTRALIA GP PTY LIMITED ₩ 62,768 4 62,764 - (67,392)Daewoo International (America) Corp. 332,620 288,716 43,904 1,040,183 4,767Daewoo International (Deutschland) GmbH. 104,259 94,087 10,172 324,061 739Daewoo International Japan Corp. 236,056 228,631 7,425 749,714 273DAEWOO INTERNATIONAL SINGAPORE PTE. LTD.
80,294 75,966 4,328 708,613 13
Daewoo Italia S.r.l. 103,710 99,911 3,799 262,784 383Daewoo (China) Co., Ltd. 56,225 9,614 46,611 118,971 683DAEWOO TEXTILE FERGANA LLC 86,781 65,730 21,051 127,432 9,214DAEWOO TEXTILE BUKHARA LLC 54,780 40,581 14,199 44,382 2,615DAEWOO INTERNATIONAL AUSTRALIA HOLDINGS PTY LTD
154,829 26,482 128,347 7,539 (3,464)
Daewoo Paper Manufacturing Co., Ltd. 70,572 70,339 233 69,880 (4,132)Tianjin Daewoo Paper Manufacturing Co., Ltd.
13,739 31,105 (17,366) - -
POSCO MAURITIUS LIMITED 23,316 2 23,314 - (15)PT. KRAKATAU POSCO 1,912,134 969,415 942,719 - (29,063)Myanmar Daewoo Limited 5,671 3 5,668 1,305 473DAEWOO INTERNATIONAL MEXICO S.A. DE C.V.
80,432 75,226 5,206 262,230 1,412
Daewoo International Guangzhou Corp. 18,292 14,120 4,172 66,808 (4,854)DAEWOO STC VINA LTD. 1,736 89 1,647 1,856 96POSCO (Zhangjiagang) STS Processing Center Co., Ltd
114,433 102,240 12,193 265,850 519
Daewoo International (M) SDN BHD 9,145 6,689 2,456 37,244 213Daewoo International SHANGHAI CO., LTD.
38,374 30,621 7,753 63,039 (2,746)
PGSF, L.P. 5,669 2 5,667 - 731Xenesys Inc. 10,162 1,404 8,758 4,302 (1,083)Daewoo International INDIA Private Ltd. 2,279 272 2,007 2,382 223TECHREN Solar, LLC 6,015 - 6,015 - (2,486)PT. POSCO E&C INDONESIA 100,543 78,852 21,691 247,331 20,302HUME COAL PTY LTD 36,681 1,194 35,487 48 (210)POSCO FOUNDATION 187 2 185 - (4)EPC EQUITIES LLP 36,602 36,636 (34) - (141)SANTOS CMI CONSTRUCTION TRADING LLP
39,148 30,527 8,621 15,299 8,963
SANTOS CMI INC. USA 43,496 47,350 (3,854) 60,152 (5,013)SANTOS CMI ENGENHARIA E CONSTRUCOES LTDA
9,338 17,629 (8,291) 20,029 (17,431)
SANTOS CMI PERU S.A. 19,937 39,932 (19,995) 69,415 (26,391)SANTOS CMI COSTA RICA S.A. 10,720 10,469 251 - (99)SANTOS CMI CONSTRUCCIONES S.A. 18 7 11 - (25)GENTECH INTERNATIONAL INC. 1,972 1,568 404 1,008 227EPC INVESTMENTS C.V. 107 24 83 - (8)INGENIERÍA Y CONSTRUCCIÓN HOLANDCO S.A.
103 4 99 - (6)
ASESORÍA Y SERVICIOS EPC S.A. 891 468 423 1,691 250SANTOSCMI S.A. 58,219 44,584 13,635 46,738 1,737SANTOSCMI CONSTRUCCIONES DE CHILE S.A.
9,533 3,608 5,925 1,608 178
S&K -SANTOSCMI S.A. DE C.V. 84 149 (65) 335 (158)COMPANIADEAUTOMATIZACION &CONTROL, GENESYS S.A.
8,648 6,018 2,630 16,926 465
Assets Liabilities Equity (deficit) Sales Net income (loss)
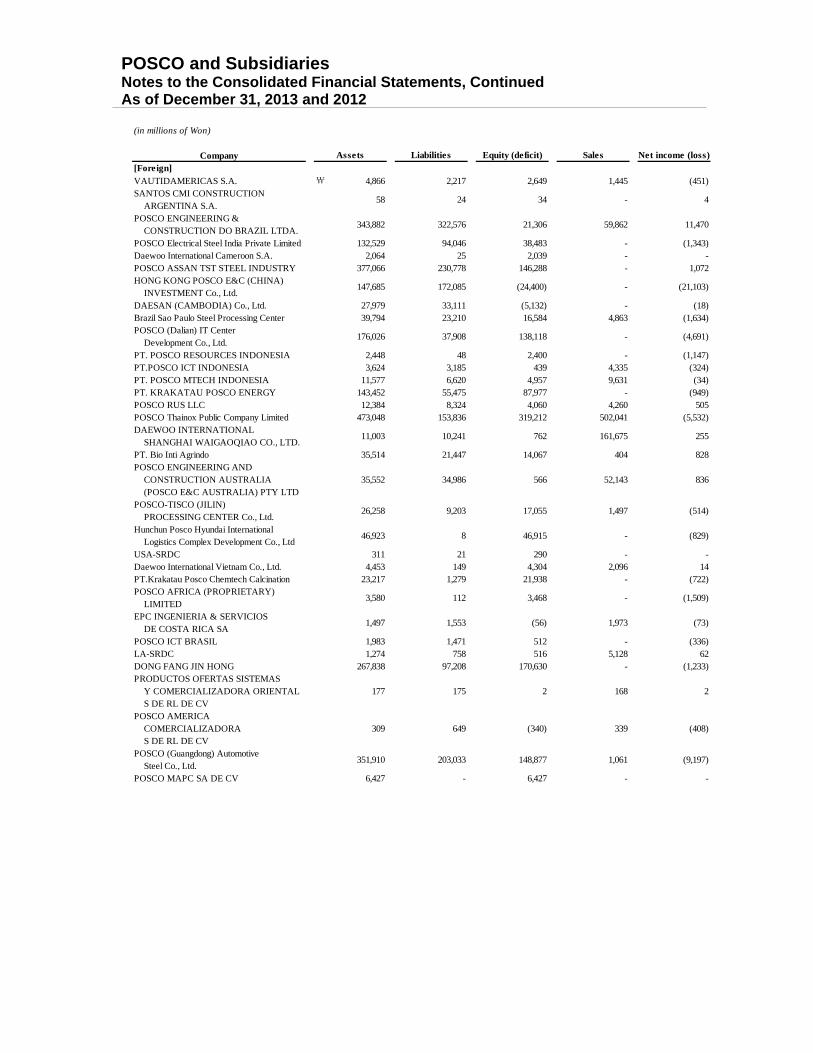
POSCO and Subsidiaries Notes to the Consolidated Financial Statements, Continued As of December 31, 2013 and 2012
(in millions of Won)
Company[Foreign]VAUTIDAMERICAS S.A. ₩ 4,866 2,217 2,649 1,445 (451)SANTOS CMI CONSTRUCTION ARGENTINA S.A.
58 24 34 - 4
POSCO ENGINEERING & CONSTRUCTION DO BRAZIL LTDA.
343,882 322,576 21,306 59,862 11,470
POSCO Electrical Steel India Private Limited 132,529 94,046 38,483 - (1,343)Daewoo International Cameroon S.A. 2,064 25 2,039 - -POSCO ASSAN TST STEEL INDUSTRY 377,066 230,778 146,288 - 1,072HONG KONG POSCO E&C (CHINA) INVESTMENT Co., Ltd.
147,685 172,085 (24,400) - (21,103)
DAESAN (CAMBODIA) Co., Ltd. 27,979 33,111 (5,132) - (18)Brazil Sao Paulo Steel Processing Center 39,794 23,210 16,584 4,863 (1,634)POSCO (Dalian) IT Center Development Co., Ltd.
176,026 37,908 138,118 - (4,691)
PT. POSCO RESOURCES INDONESIA 2,448 48 2,400 - (1,147)PT.POSCO ICT INDONESIA 3,624 3,185 439 4,335 (324)PT. POSCO MTECH INDONESIA 11,577 6,620 4,957 9,631 (34)PT. KRAKATAU POSCO ENERGY 143,452 55,475 87,977 - (949)POSCO RUS LLC 12,384 8,324 4,060 4,260 505POSCO Thainox Public Company Limited 473,048 153,836 319,212 502,041 (5,532)DAEWOO INTERNATIONAL SHANGHAI WAIGAOQIAO CO., LTD.
11,003 10,241 762 161,675 255
PT. Bio Inti Agrindo 35,514 21,447 14,067 404 828POSCO ENGINEERING AND CONSTRUCTION AUSTRALIA (POSCO E&C AUSTRALIA) PTY LTD
35,552 34,986 566 52,143 836
POSCO-TISCO (JILIN) PROCESSING CENTER Co., Ltd.
26,258 9,203 17,055 1,497 (514)
Hunchun Posco Hyundai International Logistics Complex Development Co., Ltd
46,923 8 46,915 - (829)
USA-SRDC 311 21 290 - -Daewoo International Vietnam Co., Ltd. 4,453 149 4,304 2,096 14PT.Krakatau Posco Chemtech Calcination 23,217 1,279 21,938 - (722)POSCO AFRICA (PROPRIETARY) LIMITED
3,580 112 3,468 - (1,509)
EPC INGENIERIA & SERVICIOS DE COSTA RICA SA
1,497 1,553 (56) 1,973 (73)
POSCO ICT BRASIL 1,983 1,471 512 - (336)LA-SRDC 1,274 758 516 5,128 62DONG FANG JIN HONG 267,838 97,208 170,630 - (1,233)PRODUCTOS OFERTAS SISTEMAS Y COMERCIALIZADORA ORIENTAL S DE RL DE CV
177 175 2 168 2
POSCO AMERICA COMERCIALIZADORA S DE RL DE CV
309 649 (340) 339 (408)
POSCO (Guangdong) Automotive Steel Co., Ltd.
351,910 203,033 148,877 1,061 (9,197)
POSCO MAPC SA DE CV 6,427 - 6,427 - -
Assets Liabilities Equity (deficit) Sales Net income (loss)
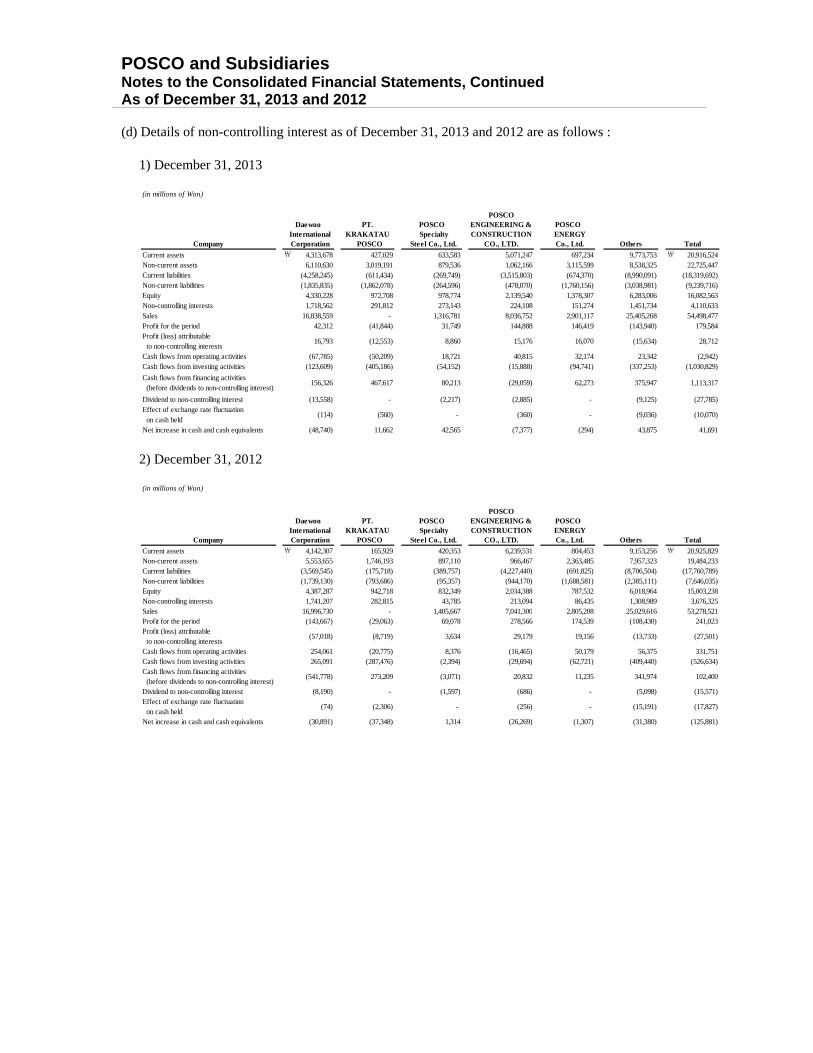
POSCO and Subsidiaries Notes to the Consolidated Financial Statements, Continued As of December 31, 2013 and 2012 (d) Details of non-controlling interest as of December 31, 2013 and 2012 are as follows :
1) December 31, 2013
2) December 31, 2012
(in millions of Won)
Company
Current assets ₩ 4,313,678 427,029 633,583 5,071,247 697,234 9,773,753 ₩ 20,916,524Non-current assets 6,110,630 3,019,191 879,536 1,062,166 3,115,599 8,538,325 22,725,447Current liabilities (4,258,245) (611,434) (269,749) (3,515,803) (674,370) (8,990,091) (18,319,692)Non-current liabilities (1,835,835) (1,862,078) (264,596) (478,070) (1,760,156) (3,038,981) (9,239,716)Equity 4,330,228 972,708 978,774 2,139,540 1,378,307 6,283,006 16,082,563Non-controlling interests 1,718,562 291,812 273,143 224,108 151,274 1,451,734 4,110,633Sales 16,838,559 - 1,316,781 8,036,752 2,901,117 25,405,268 54,498,477Profit for the period 42,312 (41,844) 31,749 144,888 146,419 (143,940) 179,584Profit (loss) attributable to non-controlling interests
16,793 (12,553) 8,860 15,176 16,070 (15,634) 28,712
Cash flows from operating activities (67,785) (50,209) 18,721 40,815 32,174 23,342 (2,942)Cash flows from investing activities (123,609) (405,186) (54,152) (15,888) (94,741) (337,253) (1,030,829)
Cash flows from financing activities (before dividends to non-controlling interest)
156,326 467,617 80,213 (29,059) 62,273 375,947 1,113,317
Dividend to non-controlling interest (13,558) - (2,217) (2,885) - (9,125) (27,785)Effect of exchange rate fluctuation on cash held
(114) (560) - (360) - (9,036) (10,070)
Net increase in cash and cash equivalents (48,740) 11,662 42,565 (7,377) (294) 43,875 41,691
Total
Daewoo International Corporation
PT.KRAKATAU
POSCO
POSCO Specialty
Steel Co., Ltd.
POSCOENGINEERING &CONSTRUCTION
CO., LTD.
POSCO ENERGY Co., Ltd. Others
(in millions of Won)
Company
Current assets ₩ 4,142,307 165,929 420,353 6,239,531 804,453 9,153,256 ₩ 20,925,829Non-current assets 5,553,655 1,746,193 897,110 966,467 2,363,485 7,957,323 19,484,233Current liabilities (3,569,545) (175,718) (389,757) (4,227,440) (691,825) (8,706,504) (17,760,789)Non-current liabilities (1,739,130) (793,686) (95,357) (944,170) (1,688,581) (2,385,111) (7,646,035)Equity 4,387,287 942,718 832,349 2,034,388 787,532 6,018,964 15,003,238Non-controlling interests 1,741,207 282,815 43,785 213,094 86,435 1,308,989 3,676,325Sales 16,996,730 - 1,405,667 7,041,300 2,805,208 25,029,616 53,278,521Profit for the period (143,667) (29,063) 69,078 278,566 174,539 (108,430) 241,023Profit (loss) attributable to non-controlling interests
(57,018) (8,719) 3,634 29,179 19,156 (13,733) (27,501)
Cash flows from operating activities 254,061 (20,775) 8,376 (16,465) 50,179 56,375 331,751Cash flows from investing activities 265,091 (287,476) (2,394) (29,694) (62,721) (409,440) (526,634)Cash flows from financing activities (before dividends to non-controlling interest)
(541,778) 273,209 (3,071) 20,832 11,235 341,974 102,400
Dividend to non-controlling interest (8,190) - (1,597) (686) - (5,098) (15,571)Effect of exchange rate fluctuation on cash held
(74) (2,306) - (256) - (15,191) (17,827)
Net increase in cash and cash equivalents (30,891) (37,348) 1,314 (26,269) (1,307) (31,380) (125,881)
Daewoo International Corporation
PT.KRAKATAU
POSCO
POSCO Specialty
Steel Co., Ltd.
POSCOENGINEERING &CONSTRUCTION
CO., LTD.
POSCO ENERGY Co., Ltd. Others Total
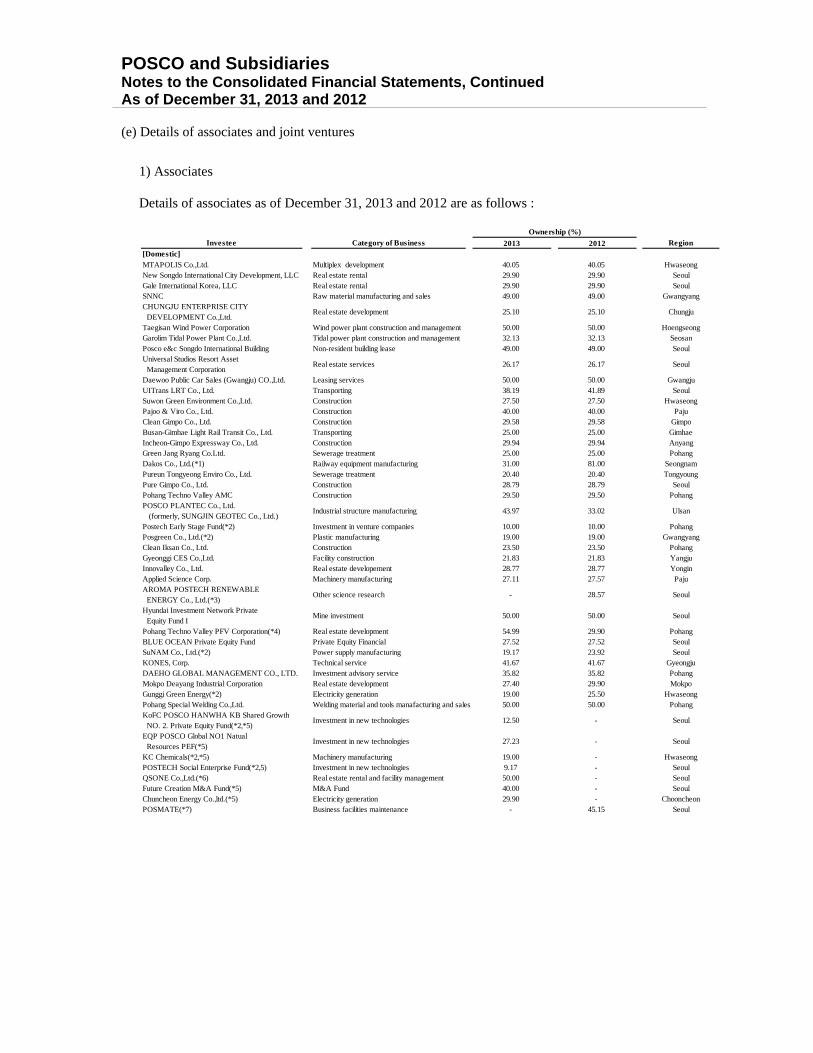
POSCO and Subsidiaries Notes to the Consolidated Financial Statements, Continued As of December 31, 2013 and 2012 (e) Details of associates and joint ventures
1) Associates
Details of associates as of December 31, 2013 and 2012 are as follows :
2013 2012[Domestic]MTAPOLIS Co.,Ltd. Multiplex development 40.05 40.05 HwaseongNew Songdo International City Development, LLC Real estate rental 29.90 29.90 SeoulGale International Korea, LLC Real estate rental 29.90 29.90 SeoulSNNC Raw material manufacturing and sales 49.00 49.00 GwangyangCHUNGJU ENTERPRISE CITY DEVELOPMENT Co.,Ltd.
Real estate development 25.10 25.10 Chungju
Taegisan Wind Power Corporation Wind power plant construction and management 50.00 50.00 HoengseongGarolim Tidal Power Plant Co.,Ltd. Tidal power plant construction and management 32.13 32.13 SeosanPosco e&c Songdo International Building Non-resident building lease 49.00 49.00 SeoulUniversal Studios Resort Asset Management Corporation
Real estate services 26.17 26.17 Seoul
Daewoo Public Car Sales (Gwangju) CO.,Ltd. Leasing services 50.00 50.00 GwangjuUITrans LRT Co., Ltd. Transporting 38.19 41.89 SeoulSuwon Green Environment Co.,Ltd. Construction 27.50 27.50 HwaseongPajoo & Viro Co., Ltd. Construction 40.00 40.00 PajuClean Gimpo Co., Ltd. Construction 29.58 29.58 GimpoBusan-Gimhae Light Rail Transit Co., Ltd. Transporting 25.00 25.00 GimhaeIncheon-Gimpo Expressway Co., Ltd. Construction 29.94 29.94 AnyangGreen Jang Ryang Co.Ltd. Sewerage treatment 25.00 25.00 PohangDakos Co., Ltd.(*1) Railway equipment manufacturing 31.00 81.00 SeongnamPureun Tongyeong Enviro Co., Ltd. Sewerage treatment 20.40 20.40 TongyoungPure Gimpo Co., Ltd. Construction 28.79 28.79 SeoulPohang Techno Valley AMC Construction 29.50 29.50 PohangPOSCO PLANTEC Co., Ltd. (formerly, SUNGJIN GEOTEC Co., Ltd.)
Industrial structure manufacturing 43.97 33.02 Ulsan
Postech Early Stage Fund(*2) Investment in venture companies 10.00 10.00 PohangPosgreen Co., Ltd.(*2) Plastic manufacturing 19.00 19.00 GwangyangClean Iksan Co., Ltd. Construction 23.50 23.50 PohangGyeonggi CES Co.,Ltd. Facility construction 21.83 21.83 YangjuInnovalley Co., Ltd. Real estate developement 28.77 28.77 YonginApplied Science Corp. Machinery manufacturing 27.11 27.57 PajuAROMA POSTECH RENEWABLE ENERGY Co., Ltd.(*3)
Other science research - 28.57 Seoul
Hyundai Investment Network Private Equity Fund I
Mine investment 50.00 50.00 Seoul
Pohang Techno Valley PFV Corporation(*4) Real estate development 54.99 29.90 PohangBLUE OCEAN Private Equity Fund Private Equity Financial 27.52 27.52 SeoulSuNAM Co., Ltd.(*2) Power supply manufacturing 19.17 23.92 SeoulKONES, Corp. Technical service 41.67 41.67 GyeongjuDAEHO GLOBAL MANAGEMENT CO., LTD. Investment advisory service 35.82 35.82 PohangMokpo Deayang Industrial Corporation Real estate development 27.40 29.90 MokpoGunggi Green Energy(*2) Electricity generation 19.00 25.50 HwaseongPohang Special Welding Co.,Ltd. Welding material and tools manafacturing and sales 50.00 50.00 PohangKoFC POSCO HANWHA KB Shared Growth NO. 2. Private Equity Fund(*2,*5)
Investment in new technologies 12.50 - Seoul
EQP POSCO Global NO1 Natual Resources PEF(*5)
Investment in new technologies 27.23 - Seoul
KC Chemicals(*2,*5) Machinery manufacturing 19.00 - HwaseongPOSTECH Social Enterprise Fund(*2,5) Investment in new technologies 9.17 - SeoulQSONE Co.,Ltd.(*6) Real estate rental and facility management 50.00 - SeoulFuture Creation M&A Fund(*5) M&A Fund 40.00 - SeoulChuncheon Energy Co.,ltd.(*5) Electricity generation 29.90 - ChooncheonPOSMATE(*7) Business facilities maintenance - 45.15 Seoul
Investee Category of Business
Ownership (%)
Region

POSCO and Subsidiaries Notes to the Consolidated Financial Statements, Continued As of December 31, 2013 and 2012
(*1) Reclassified to associate from subsidiary due to decrease in ownership percentage during the
year ended December 31, 2013. (*2) The Company is able to exercise significant influence even though the Company’s percentage of
ownership is below 20%. (*3) Excluded from associates due to the disposal during the year ended December 31, 2013. (*4)The Company is not able to exercise control over the investee even though the Company’s
percentage of ownership is above 50%. (*5) These associates were newly established or acquired in 2013. (*6) This entity split off from POSCO Processing & Service during the year ended December 31, 2013. (*7) Reclassified to subsidiary from associate due to the merger with Seoung Gwang Co., Ltd., a
subsidiary of the Company. (*8) Reclassified to associate from subsidiary due to a decrease in ownership percentage during the
year ended December 31, 2013.
2013 2012[Foreign]VSC POSCO Steel Corporation Steel manufacturing and sales 50.00 50.00 VietnamPOSCHROME (PROPRIETARY) LIMITED Raw material manufacturing and sales 50.00 50.00 South AfricaPOSVINA Co., Ltd.(*11) Plating steel sheet manufacturing and sales - 50.00 VietnamCAML RESOURCES PTY LTD. Raw material manufacturing and sales 33.34 33.34 AustrailiaNickel Mining Company SAS Raw material manufacturing and sales 49.00 49.00 New Caledonia POSK(Pinghu) Steel Processing Center Co., Ltd. Steel processing and sales 20.00 20.00 ChinaAN KHANH NEW CITY DEVELOPMENT J.V CO., LTD.
Highway construction and new town development 50.00 50.00 Vietnam
Zhongyue POSCO (Qinhuangdao) Tinplate Industrial Co., Ltd.
Tinplate manufacturing and sales 34.00 34.00 China
POSCO-SAMSUNG Suzhou Processing Center Co., Ltd.
Steel processing and sales 30.00 30.00 China
Eureka Moly LLC Steel processing and sales 20.00 20.00 USAPOSCO SeAH Steel Wire (Nantong) Co., Ltd. Steel processing and sales 25.00 25.00 ChinaYingkou Posrec Refractories Co., Ltd. Refractory manufacturing 25.00 25.00 ChinaSebang Steel Scrap sales 49.00 49.00 JapanNCR LLC Coal sales 29.41 29.41 CanadaAMCI (WA) PTY LTD. Iron ore sales & mine development 49.00 49.00 AustrailiaSHANGHAI LANSHENG DAEWOO CORP. Trading 49.00 49.00 ChinaSHANGHAI WAIGAOQIAO FREE TRADE ZONE LANSHENG DAEWOO IN'L TRADING CO., LTD.
Trading 49.00 49.00 China
Hanjung Power Pty., Ltd. Electric power manufacturing and sales 49.00 49.00 Papua New Guinea General Medicines Company Ltd. Medicine manufacturing and sales 33.00 33.00 SudanKOREA LNG LTD. Gas production and sales 20.00 20.00 EnglandKG Power (M) SDN. BHD Energy & resource development 20.00 20.00 MalaysiaDaewoo (THAILAND) CO., LTD. Trading 49.00 49.00 ThailandN.I.CO., LTD. Trading 50.00 50.00 North KoreaSouth-East Asia Gas Pipeline Company Ltd. Pipeline construction 25.04 25.04 MyanmarGLOBAL KOMSCO Daewoo LLC Mintage 35.00 35.00 UzbekistanPOSCO-Poggenamp Electrical Steel Pvt. Ltd. Steel manufacturing 26.00 26.00 IndiaArctos Anthracite Joint Venture Coal sales 20.00 20.00 CanadaAES-VCM Mong Duong Power Company Limited Electricity generation 30.00 30.00 VietnamPT.INDONESIA POS CHEMTECH CHOSUN Ref Refractory manufacturing and sales 30.19 30.00 IndonesiaNS-Thainox Auto Co., Ltd. Steel manufacturing and sales 49.00 49.00 VietnamPT. Tanggamus Electric Power Construction and engneering service 20.00 20.00 IndonesiaPT. Wampu Electric Power Construction and engneering service 20.00 20.00 IndonesiaBoulder Solar Power, LLC Electric power manufacturing 21.74 25.00 USALLP POSUK Titanium Titanium manufacturing and sales 36.83 50.00 KazahstanLI3 ENERGY INC Energy & resource development 26.06 26.06 PeruFifth Combined Heat and Power Plant LLC Thermal power generation 30.00 30.00 MongoliaIMFA ALLOYS FINLEASE LTD. Raw material manufacturing and sales 24.00 24.00 India7623704 Canada Inc.(*2,*5) Investments management 10.40 0.00 CanadaBaganuur Energy Corporation(*5) Refined oil manufacturing 50.00 0.00 MongoliaHamparan Mulia(*5) Resource development 45.00 0.00 IndonesiaBGC-POS PTY LTD.(*5) Construction 49.00 0.00 AustrailiaPOS-SEAHSTEELWIRE(TIANJIN)CO.,Ltd.(*5) Steel manufacturing and sales 25.00 0.00 ChinaPOS-Hyundai Steel Manufacturing India Private Ltd.(*8)
Steel manufacturing and sales - 29.50 India
Liaoning Rongyuan Posco Refractories Co., Ltd.(*3)
Refractory manufacturing and sales - 35.00 China
Daewoo Engineering (THAILAND) Co., Ltd.(*9) Development and contract business - 48.90 ThailandPOSCO YongXin Rare Earth Metal Co., Ltd.(*9) Resource development - 31.00 ChinaMyanmar Korea Timber International Ltd.(*10) Plywood manufacturing - 45.00 Myanmar
Investee Category of Business
Ownership (%)
Region

POSCO and Subsidiaries Notes to the Consolidated Financial Statements, Continued As of December 31, 2013 and 2012
(*9) Reclassified to subsidiary from associate due to an increase in ownership percentage during the
year ended December 31, 2013. (*10) Excluded from associates due to the liquidation during the year ended December 31, 2013. (*11) Reclassified to assets held for sale in 2013.
As of December 31, 2013, there are no restrictions on the ability of associates to transfer funds to the Company, such as in the form of cash dividends, repayment of loans or payment of advances.
2) Joint ventures
Details of joint ventures as of December 31, 2013 and 2012 are as follows :
(f) Newly included subsidiaries
1) Consolidated subsidiaries acquired or newly established during the year ended December 31,
2013 are as follows:
(*1) These subsidiaries are included in the consolidated financial statements as the controlling company has control over them in consideration of the board of directors’ composition and others.
2013 2012[Domestic]POSCO ES MATERIALS Secondary battery manufacturing 50.00 50.00 GumiPOSCO MITSUBISHI CARBON TECHNOLOGY Steel processing and sales 60.00 60.00 Gwangyang[Foreign]KOBRASCO Facility lease 50.00 50.00 BrazilUSS-POSCO Industries Cold rolled coil manufacturing and sales 50.00 50.00 USAPT. POSMI Steel Indonesia Steel processing and sale 36.69 36.69 IndonesiaHenan Tsingpu Ferro AlloyCo., Ltd. Raw material manufacturing and sales 49.00 49.00 ChinaUnited Spiral Pipe, LLC Material manufacturing and sales 35.00 35.00 USABX STEEL POSCO Cold Rolled Sheet Co., Ltd. Steel processing and sales 25.00 25.00 ChinaPOSCO-SAMSUNG-Slovakia Processing Center Steel processing and sales 30.00 30.00 SlovakiaZhangjiagang Pohang Refractories Co., Ltd. Refractory manufacturing 50.00 50.00 ChinaDMSA, AMSA Energy & resource development 4.00 4.00 MadagascarPOSCO-NPS Niobium LLC Mine development 50.00 50.00 USACSP - Compania Siderurgica do Pecem Steel manufacturing and sales 20.00 20.00 BrazilKorea Siberia Wood CJSC Forest resource development 50.00 50.00 RussiaRoy Hill Holdings Pty Ltd. Energy & resource development 12.50 12.50 Austrailia
Investee Category of Business
Ownership (%)
Region
Company Date of acquisition Ownership (%)
POSCO ENGINEERING (THAILAND) CO., LTD.(*1) January 2013 48.90 Reclassification from associatePOSMATE Co.,Ltd. January 2013 66.23 Reclassification from associatePOSCO-Mory-Maruyasu PIPE(*1) February 2013 50.00 New establishmentPT KRAKATAU BLUE WATER February 2013 67.00 New establishmentKRAKATAU POS-CHEM DONG-SUH CHEMICAL(*1) March 2013 45.00 New establishmentMAX STEEL Co., Ltd. March 2013 100.00 New acquisitionsMyanmar Daewoo International Corporation March 2013 100.00 New establishmentPOSCO YongXin Rare Earth Metal Co., Ltd. March 2013 51.67 Reclassification from associatePOSCO-Italy Processing Center July 2013 90.00 New establishmentNEW POWER TECH Co., Ltd. August 2013 100.00 Split off from POSCO Engineering Co.,Ltd.DAEWOO E&P CANADA CORPORATION August 2013 100.00 New establishmentIT Engineering(*1) August 2013 17.00 New acquisitionsYingkou Puxiang Trade Co.,Ltd. September 2013 100.00 New establishmentPOSCO ICT VIETNAM October 2013 100.00 New establishmentDaewoo Global Development. Pte., Ltd October 2013 51.00 New establishmentMyanmar POSCO Engineering&Construction Company, Limited. November 2013 100.00 New establishmentMyanmar POSCO C&C Company, Limited. December 2013 70.00 New establishmentPOSCO COATED STEEL (THAILAND) Co., Ltd. December 2013 100.00 New establishmentDAEWOO POWER AND INFRA (PTY) LTD. December 2013 100.00 New establishment
Reason

POSCO and Subsidiaries Notes to the Consolidated Financial Statements, Continued As of December 31, 2013 and 2012
2) Cash outflows (inflows) caused by the acquisitions for the year ended December 31, 2013.
(g) Excluded subsidiaries Subsidiaries that were excluded from consolidation during the year ended December 31, 2013 are as
follows:
(in millions of Won)
Consideration transferred ₩ 4,359Less: Cash and cash equivalent acquired (10,088)
Total ₩ (5,729)
Amounts
(in millions of Won)
Company Date of disposal
Postech 2006 Energy Fund January 2013 Reclassification from subsidiary to associatePostech Early Stage Fund January 2013 Reclassification from subsidiary to associate
Pohang SPFC Co., Ltd. January 2013
Gunsan SPFC Co., Ltd. January 2013
POSCALCIUM Company, Ltd. January 2013 Statutory merger by POSCO CHEMTECHReco Metal Co., Ltd. January 2013 Statutory merger by POSCO M-TECH 9Digit Co., Ltd. January 2013 Statutory merger by POSCO M-TECH SeungGwang Co., Ltd. January 2013 Statutory merger by POSMATE
POSWITH Co., Ltd. January 2013
MCM Korea March 2013 Exclusion by liquidationDAEWOO CANADA LTD. March 2013 Exclusion by liquidationDAEWOO HANDELS GmbH March 2013 Exclusion by liquidationDalian POSCO Steel Co., Ltd. March 2013 Disposal
MAX STEEL Co., LTD. April 2013
POSCO PLANTEC Co., Ltd. July 2013
Dakos Co., Ltd. October 2013 Disposal
BLUE O&M Co., Ltd December 2013
NEW POWER TECH CO., LTD December 2013Statutory merger by POSCO ENGINEERING & CONSTRUCTION CO., LTD.
Tancheonene Co.,Ltd December 2013 Statutory merger by PoscoeneSANTOS CMI COSTA RICA S.A. December 2013 Exclusion by liquidationINGENIERIA Y CONSTRUCCION HOLANDCO S.A. December 2013 Exclusion by liquidation
ASESORIA Y SERVICIOS EPC S.A. CHILE December 2013
SANTOS CMI CONSTRUCTION ARGENTINA S.A. December 2013 Exclusion by liquidationDAEWOO STC VINA LTD. December 2013 DisposalGEZIRA TANNERY Co., Ltd. December 2013 Exclusion by liquidation
Reason
Statutory merger by SPFC Co.,LTD. (formerly, Gwangyang SPFC Co.,LTD.)
Statutory merger by SPFC Co.,LTD. (formerly, Gwangyang SPFC Co.,LTD.)
Statutory merger by POSCO Humans Co., Ltd. (formerly, POS ECO HOUSING Co., LTD.)
Statutory merger by POSCO-Vietnam Processing Center Co., Ltd.
Statutory merger by Sungjin Geotec Co., Ltd. (currently, POSCO PLANTEC Co., Ltd. by changing its name)
Statutory merger by Plant Engineering Service Technology Co., Ltd.
Statutory merger by SANTOSCMI CONSTRUCCIONES DE CHILE S.A.

POSCO and Subsidiaries Notes to the Consolidated Financial Statements, Continued As of December 31, 2013 and 2012
31
2. Statement of Compliance Statement of compliance The consolidated financial statements have been prepared in accordance with Korean International Financial Reporting Standards (“K-IFRS”), as prescribed in the Act on External Audits of Corporations in the Republic of Korea. Basis of measurement The consolidated financial statements have been prepared on the historical cost basis, except for the following material items in the statement of financial position, as described in the accounting policy below. (a) Derivatives instruments are measured at fair value (b) Financial instruments at fair value through profit or loss (FVTPL) are measured at fair value (c) Available-for-sale financial assets are measured at fair value (d) Defined benefit liabilities are measured at the present value of the defined benefit obligation less the fair value of the plan assets Functional and presentation currency These consolidated financial statements are presented in Korean won, which is POSCO’s functional currency and the currency of the primary economic environment in which POSCO operates.
Use of estimates and judgements The preparation of the consolidated financial statements in conformity with K-IFRS requires management to make judgements, estimates and assumptions that affect the application of accounting policies and the reported amounts of assets, liabilities, income and expenses. Actual results may differ from these estimates. Estimates and underlying assumptions are reviewed on an ongoing basis. Revisions to accounting estimates are recognized in the period in which the estimates are revised and in any future periods affected. (a) Judgements
Information about critical judgements in applying accounting policies that have the most significant effect on the amounts recognized in the consolidated financial statements is included in the following notes:
• Note1 - Subsidiaries, associates and joint venture • Note 8 - Other financial assets • Note 12 - Joint operations • Note 13 - Investment property, net • Note 14 - Property, plant and equipment, net • Note 15 - Goodwill and other intangibles
POSCO and Subsidiaries Notes to the Consolidated Financial Statements, Continued As of December 31, 2013 and 2012
32
(b) Assumptions and estimation uncertainties
Information about assumptions and estimation uncertainties that have a significant risk of resulting in a material adjustment within the next financial year is included in the following notes:
• Note 20 - Provisions • Note 21 - Employee benefits • Note 29 - Construction contracts • Note 39 - Commitments and contingencies
(c) Measurement of fair value
The Company’s accounting policies and disclosures require the measurement of fair values, for both financial and non-financial assets and liabilities. The Company has an established control framework with respect to the measurement of fair values. This includes a valuation team that has overall responsibility for overseeing all significant fair value measurements, including Level 3 fair values, and reports directly to the financial officer.
The valuation team regularly reviews significant unobservable inputs and valuation adjustments. If third party information, such as broker quotes or pricing services, is used to measure fair values, then the valuation team assesses the evidence obtained from the third parties to support the conclusion that such valuations meet the requirements of K-IFRS including the level in the fair value hierarchy in which such valuation techniques should be classified. When measuring the fair value of an asset or a liability, the Company uses market observable data as far as possible. Fair values are categorized into different levels in a fair value hierarchy based on the inputs used in the valuation techniques as follows.
• Level 1 - quoted prices (unadjusted) in active markets for identical assets or liabilities. • Level 2 - inputs other than quoted prices included in Level 1 that are observable for the
assets or liability, either directly (i.e. as prices) or indirectly (i.e. derived from prices).
• Level 3 - inputs for the assets or liability that are not based on observable market data (that is, unobservable inputs).
If the inputs used to measure the fair value of an asset or a liability might be categorized in different levels of the fair value hierarchy, then the fair value measurement is categorized in its entirety in the same level of the fair value hierarchy as the lowest level input that is significant to the entire measurement. The Company recognizes transfers between levels of the fair value hierarchy at the end of the reporting period during which the change has occurred.
Information about the assumptions made in measuring fair values is included in the following notes:
• Note 23 – Financial instruments

POSCO and Subsidiaries Notes to the Consolidated Financial Statements, Continued As of December 31, 2013 and 2012
33
Changes in accounting policies Except for the changes below, the Company has consistently applied the accounting policies set out in note 3 to all periods presented in these consolidated financial statements. The Company has adopted the following new standards and amendments to standards with a date of initial application of January 1, 2013. (a) K-IFRS No. 1001, “Presentation of Financial Statements” (b) K-IFRS No. 1019, “Employee Benefits” (c) K-IFRS No. 1107, “Financial Instruments: Disclosures” (d) K-IFRS No. 1110, “Consolidated Financial Statements” (e) K-IFRS No. 1111, “Joint Arrangements” (f) K-IFRS No. 1112, “Disclosure of Interests in Other Entities” (g) K-IFRS No. 1113, “Fair Value Measurement” The details of changes in accounting policies are as follows: (a) Classification of other comprehensive income
As a result of the amendments to K-IFRS No. 1001, the Company has modified the presentation of items of other comprehensive income in its statement of comprehensive income to present separately items that would be reclassified to profit or loss from those that would never be reclassified to profit or loss. Comparative information has been re-presented accordingly.
(b) Post-employment defined benefit plan
As a result of the amendments to K-IFRS No. 1019, the Company has changed its accounting policy with respect the basis for determining the income or expense related to its post-employment defined benefit plans. Under the amendments to K-IFRS No. 1019, the Company determines the net interest expense (income) on the net defined benefit liability (asset) for the period by applying the discount rate used to measure the defined benefit obligation at the beginning of the annual period to the then-net defined benefit liability (asset), taking into account any changes in the net defined benefit liability (asset) during the period as a result of contributions and benefit payments. Consequently, the net interest on the net defined benefit liability (asset) now comprises: interest cost on the defined benefit obligation, interest income on plan assets, and interest on the effect on the asset ceiling. Previously, the Company determined interest income on plan assets based on their long-term rate of expected return.
(c) Offsetting of financial assets and financial liabilities
As a result of the amendments to K-IFRS No. 1107, the Company has expanded its disclosures about the offsetting of financial assets and financial liabilities (Note 23).
(d) Subsidiaries
As a result of K-IFRS No. 1110, the Company has changed its accounting policy for determining whether it has control over and consequently whether it consolidates its investees. K-IFRS No. 1110 introduces a new control model that focuses on whether the Company has power over an investee, exposure or rights to variable returns from its involvement with the investee and ability to use its power to affect those returns.
POSCO and Subsidiaries Notes to the Consolidated Financial Statements, Continued As of December 31, 2013 and 2012
34
In accordance with the transitional provisions of K-IFRS No. 1110, the Company reassessed the control conclusion for its investees at January 1, 2013. As a consequence, the Company changed its control conclusion with the following investees :
(e) Joint arrangements
As a result of K-IFRS No. 1111, the Company has changed its accounting policy for its interests in joint arrangements. Under K-IFRS No. 1111, the Company has classified its interests in joint arrangements as either joint operations (if the Company has rights to the assets, and obligations for the liabilities, relating to an arrangement) or joint ventures (if the Company has rights only to the net assets of an arrangement). When making this assessment, the Company considered the structure of the arrangements, the legal form of any separate vehicles, the contractual terms of the arrangements and other facts and circumstances. Previously, the structure of the arrangement was the sole focus of classification.
The Company has re-evaluated its involvement in its only joint arrangement and has reclassified the investment from a jointly controlled entity to a joint venture. Notwithstanding the reclassification, the investment continues to be recognized by applying the equity method and there has been no impact on the recognized assets, liabilities and comprehensive income of the Company.
(f) Disclosure of interests in other entities
As a result of K-IFRS No. 1112, the Company has expanded its disclosures about its interests in subsidiaries (see Note 1) and equity-accounted investees (Note 11).
(g) Fair value measurement
K-IFRS No. 1113, establishes a single framework for measuring fair value and making disclosures about fair value measurements when such measurements are required or permitted by other K-IFRSs. It unifies the definition of fair value as the price that would be received to sell an asset or paid to transfer a liability in an orderly transaction between market participants at the measurement date. It replaces and expands the disclosure requirements about fair value measurements in other K-IFRSs, including K-IFRS No. 1107. As a result, the Company has included additional disclosures in this regard (Note 23).
In accordance with the transitional provisions of K-IFRS No. 1113, the Company has applied the new fair value measurement guidance prospectively and has not provided any comparative information for new disclosures. Notwithstanding the above, the change had no significant impact on the measurements of the Company’s assets and liabilities.
Newly included subsidiaries POSCO Engineering (Thailand) Co., Ltd.Excluded subsidiaries Postech 2006 Energy Fund, Postech Early Stage Fund
Company
POSCO and Subsidiaries Notes to the Consolidated Financial Statements, Continued As of December 31, 2013 and 2012
35
Impact of changes in accounting policies As management believes the impact of the amendments to K-IFRS No. 1019, No. 1110 and No. 1113 on the Company’s prior year’s consolidated financial statement is not significant, the comparative period’s consolidated financial statements are not restated. Approval of financial statements The consolidated financial statements were authorized for issue by the Board of Directors on January 29, 2014, and will be submitted for approval at the shareholders’ meeting to be held on March 14, 2014. 3. Summary of Significant Accounting Policies The significant accounting policies applied by the Company in preparation of its consolidated financial statements are included below. The accounting policies set out below have been applied consistently to all periods presented in these financial statements, except for those as disclosed in note 2. The comparative amounts in consolidated statements of comprehensive income have been re-presented as a result of a change in the accounting policy regarding the presentation of items of other comprehensive income. Basis of consolidation (a) Business combinations
The Company accounts for business combinations using the acquisition method when control is transferred to the Company.
The consideration transferred in the acquisition is generally measured at fair value, as are the identifiable net assets acquired. Any goodwill that arises is tested annually for impairment. Any gain on bargain purchase is recognized in profit or loss immediately. Transaction costs are expensed as incurred, except if related to the issue of debt or equity securities. The consideration transferred does not include amounts related to the settlement of pre-existing relationships. Such amounts are generally recognized in profit or loss.
Any contingent consideration payable is measured at fair value at the acquisition date. If the contingent consideration is classified as equity, then it is not remeasured and settlement is accounted for within equity. Otherwise, subsequent changes in the fair value of the contingent consideration are recognized in profit or loss. If share-based payment awards (replacement awards) are required to be exchanged for awards held by the acquiree’s employees (acquiree’s awards), then all or a portion of the amount of the acquirer’s replacement awards is included in measuring the consideration transferred in the business combination. This determination is based on the market-based measure of the replacement awards compared with the market-based measure of the acquiree’s awards and the extent to which the replacement awards relate to pre-combination service.
POSCO and Subsidiaries Notes to the Consolidated Financial Statements, Continued As of December 31, 2013 and 2012
36
(b) Non-controlling interests
Non-controlling interests are measured at their proportionate share of the acquiree’s identifiable net assets at the acquisition date. Changes in the Company’s interest in a subsidiary that do not result in a loss of control are accounted for as equity transactions.
(c) Subsidiaries
Subsidiaries are entities controlled by the Company. The Company controls an entity when it is exposed to, or has rights to, variable returns from its involvement with the entity and has the ability to affect those returns through its power over the entity. The financial statements of subsidiaries are included in the consolidated financial statements from the date on which control commences until the date on which control ceases.
(d) Loss of control
When the Company loses control over a subsidiary, it derecognises the assets and liabilities of the subsidiary, and any related non-controlling interests and other components of equity. Any resulting gain or loss is recognized in profit or loss. Any interest retained in the former subsidiary is measured at fair value when control is lost.
(e) Interests in equity-accounted investees
The Company’s interests in equity-control investees comprise interests in associates and joint ventures. Associates are those entities in which the Company has significant influence, but not control or joint control, over the financial and operating policies. A joint venture is an arrangement in which the Company has joint control, whereby the Company has rights to the net assets of the arrangement, rather than rights to its assets and obligations for its liabilities. Interests in associates and joint ventures are accounted for using the equity method. They are recognized initially at cost, which includes transaction costs. Subsequent to initial recognition, the consolidated financial statements include the Company’s share of the profit or loss and other comprehensive income of equity-accounted investees, until the date on which significant influence or joint control ceases.
(f) Transactions eliminated on consolidation
Intra-group balances and transactions, and any unrealized income and expenses arising from intra-group transactions, are eliminated. Unrealized gains arising from transactions with equity-accounted investees are eliminated against the investment to the extent of the Company’s interest in the investee. Unrealized losses are eliminated in the same way as unrealized gains, but only to the extent that there is no evidence of impairment.
POSCO and Subsidiaries Notes to the Consolidated Financial Statements, Continued As of December 31, 2013 and 2012
37
Foreign currency transactions and translation 1) Foreign currency transactions
Foreign currency transactions are initially recorded using the spot exchange rate between the functional currency and the foreign currency at the date of the transaction. At the end of each reporting period, foreign currency monetary items are translated using the closing rate. Non-monetary items that are measured in terms of historical cost in a foreign currency are translated using the exchange rate at the date of the original transaction. Non-monetary items that are measured at fair value in a foreign currency are translated using the exchange rate at the date fair value was initially determined. Exchange differences arising on the settlement of monetary items or on translating monetary items at rates different from those at which they were translated on initial recognition during the period or in previous financial statements are recognized in profit or loss in the period in which they arise. When gains or losses on non-monetary items are recognized in other comprehensive income, exchange components of those gains or losses are recognized in other comprehensive income. Conversely, when gains or losses on non-monetary items are recognized in profit or loss, exchange components of those gains or losses are recognized in profit or loss.
2) Foreign operations
If the presentation currency of the Company is different from a foreign operation’s functional currency, the financial statements of the foreign operation are translated into the presentation currency using the following methods: The assets and liabilities of foreign operations, whose functional currency is not the currency of a hyperinflationary economy, are translated to presentation currency at exchange rates at the reporting date. The income and expenses of foreign operations are translated to functional currency at exchange rates at the dates of the transactions. Foreign currency differences are recognized in other comprehensive income. Any goodwill arising on the acquisition of a foreign operation and any fair value adjustments to the carrying amounts of assets and liabilities arising on the acquisition of that foreign operation are treated as assets and liabilities of the foreign operation. Thus they are expressed in the functional currency of the foreign operation and translated at the closing rate. When a foreign operation is disposed of, the relevant amount in the translation is transferred to profit or loss as part of the profit or loss on disposal. On the partial disposal of a subsidiary that includes a foreign operation, the relevant proportion of such cumulative amount is reattributed to non-controlling interest. In any other partial disposal of a foreign operation, the relevant proportion is reclassified to profit or loss. Foreign exchange gains or losses arising from a monetary item receivable from or payable to a foreign operation, the settlement of which is neither planned nor likely to occur in the foreseeable future and which in substance is considered to form part of the net investment in the foreign operation, are recognized in other comprehensive income in the translation reserve.
POSCO and Subsidiaries Notes to the Consolidated Financial Statements, Continued As of December 31, 2013 and 2012
38
Cash and cash equivalents Cash and cash equivalents comprise cash on hand, demand deposits, and short-term investments in highly liquid securities that are readily convertible to known amounts of cash with maturities of three months or less from the acquisition date and which are subject to an insignificant risk of changes in value. Equity investments are excluded from cash and cash equivalents. Non-derivative financial assets
The Company recognizes and measures non-derivative financial assets by the following four categories: financial assets at fair value through profit or loss, held-to-maturity financial assets, loans and receivables and available-for-sale financial assets. The Company recognizes financial assets in the consolidated statement of financial position when the Company becomes a party to the contractual provisions of the instrument. Upon initial recognition, non-derivative financial assets are measured at their fair value plus, in the case of a financial asset not at fair value through profit or loss, transaction costs that are directly attributable to the asset’s acquisition or issuance. (a) Financial assets at fair value through profit or loss
Financial assets are classified at fair value through profit or loss if they are held for trading or designated as such upon initial recognition. Upon initial recognition, transaction costs are recognized in profit or loss when incurred. Financial assets at fair value through profit or loss are measured at fair value, and changes therein are recognized in profit or loss.
(b) Held-to-maturity financial assets
A non-derivative financial asset with a fixed or determinable payment and fixed maturity, for which the Company has the positive intention and ability to hold to maturity, is classified as held-to-maturity. Subsequent to initial recognition, held-to-maturity financial assets are measured at amortized cost using the effective interest rate method.
(c) Loans and receivables
Loans and receivables are non-derivative financial assets with fixed or determinable payments that are not quoted in an active market. Subsequent to initial recognition, loans and receivables are measured at amortized cost using the effective interest method unless the effect of discounting is immaterial.

POSCO and Subsidiaries Notes to the Consolidated Financial Statements, Continued As of December 31, 2013 and 2012
39
(d) Available-for-sale financial assets
Available-for-sale financial assets are those non-derivative financial assets that are designated as available-for-sale or are not classified as financial assets at fair value through profit or loss, held-to-maturity financial assets or loans and receivables. Subsequent to initial recognition, they are measured at fair value, with changes in fair value, net of any tax effect, recorded in other comprehensive income in equity. Investments in equity instruments that do not have a quoted market price in an active market and whose fair value cannot be reliably measured and derivatives that are linked to and must be settled by delivery of such unquoted equity instruments are measured at cost. When a financial asset is derecognized or impairment losses are recognized, the cumulative gain or loss previously recognized in other comprehensive income is reclassified from equity to profit or loss. Dividends on an available-for-sale equity instrument are recognized in profit or loss when the Company’s right to receive payment is established.
(e) Derecognition of non-derivative financial assets
The Company derecognizes non-derivative financial assets when the contractual rights to the cash flows from the financial asset expire, or the Company transfers the rights to receive the contractual cash flows from the financial asset as well as substantially all the risks and rewards of ownership of the financial asset. Any interest in a transferred financial asset that is created or retained by the Company is recognized as a separate asset or liability.
If the Company retains substantially all the risks and rewards of ownership of the transferred financial assets, the Company continues to recognize the transferred financial assets and recognizes financial liabilities for the consideration received.
(f) Offsetting a financial asset and a financial liability
Financial assets and financial liabilities are offset and the net amount is presented in the consolidated statement of financial position only when the Company currently has a legally enforceable right to offset the recognized amounts, and there is the intention to settle on a net basis or to realize the asset and settle the liability simultaneously.
Inventories
Inventories are measured at the lower of cost and net realizable value. Costs are determined by using the moving-weighted average method. The cost of inventories comprise all costs of purchase, costs of conversion and other costs incurred in bringing the inventories to their present location and condition. The allocation of fixed production overheads to the costs of finished goods or work in progress are based on the normal capacity of the production facilities.
POSCO and Subsidiaries Notes to the Consolidated Financial Statements, Continued As of December 31, 2013 and 2012
40
When inventories are sold, the carrying amount of those inventories is recognized as cost of goods sold in the period in which the related revenue is recognized. Inventories are measured at the lower of cost and net realizable value. The amount of any write-down of inventories to net realizable value and all losses of inventories are recognized as an expense in the period the write-down or loss occurs. The amount of any reversal of any write-down of inventories arising from an increase in net realizable value is recognized as a reduction in the amount of inventories recognized as a cost of goods sold in the period in which the reversal occurs. Non-current assets held for sale Non-current assets or disposal groups comprising assets and liabilities, that are expected to be recovered primarily through sale rather than through continuing use, are classified as held for sale. In order to be classified as held for sale, the assets or disposal groups must be available for immediate sale in their present condition and their sale must be highly probable. The assets or disposal groups that are classified as non-current assets held for sale are measured at the lower of their carrying amount and fair value less cost to sell. The Company recognizes an impairment loss for any initial or subsequent write-down of an asset or disposal group to fair value less costs to sell, and a gain for any subsequent increase in fair value less costs to sell, up to the cumulative impairment loss previously recognized in accordance with K-IFRS No. 1036 “Impairment of Assets”. A non-current asset that is classified as held for sale or part of a disposal group classified as held for sale is not depreciated (or amortized). Investment property Property held to earn rentals or for capital appreciation or both is classified as investment property. Investment property is measured initially at its cost. Transaction costs are included in the initial measurement. Subsequently, investment property is carried at depreciated cost less any accumulated impairment losses. Subsequent costs are recognized in the carrying amount of investment property at cost or, if appropriate, as separate items if it is probable that future economic benefits associated with the item will flow to the Company and the cost of the item can be measured reliably. The carrying amount of the replaced part is derecognized. The costs of the day-to-day servicing are recognized in profit or loss as incurred. Depreciation methods, useful lives and residual values are reviewed at the end of each reporting date and adjusted, if appropriate. The change is accounted for as a change in an accounting estimate.

POSCO and Subsidiaries Notes to the Consolidated Financial Statements, Continued As of December 31, 2013 and 2012
41
Property, plant and equipment
Property, plant and equipment are initially measured at cost and after initial recognition, are carried at cost less accumulated depreciation and any accumulated impairment losses. The cost of property, plant and equipment includes expenditures arising directly from the construction or acquisition of the asset, any costs directly attributable to bringing the asset to the location and condition necessary for it to be capable of operating in the manner intended by management and, when the Company has an obligation to remove the asset or restore the site, an estimate of the costs of dismantling and removing the item and restoring the site on which it is located. The cost of replacing a part of an item is recognized in the carrying amount of the item of property, plant and equipment, if the following recognition criteria are met: (a) it is probable that future economic benefits associated with the item will flow to the Company;
and (b) the cost can be measured reliably. The carrying amount of the replaced part is derecognized at the time the replacement part is recognized. The costs of the day-to-day servicing of the item are recognized in profit or loss as incurred. Items of property, plant and equipment are depreciated from the date they are available for use or, in respect of self-constructed assets, from the date that the asset is completed and ready for use. Other than land, the costs of an asset less its estimated residual value are depreciated. Depreciation of property, plant and equipment is recognized in profit or loss on a straight-line basis, which most closely reflects the expected pattern of consumption of the future economic benefits embodied in the asset, over the estimated useful lives of each component of an item of property, plant and equipment. Leased assets are depreciated over the shorter of the lease term and their useful lives unless it is reasonably certain that the Company will obtain ownership by the end of the lease term. Land is not depreciated. Each part of an item of property, plant and equipment with a cost that is significant in relation to the total cost of the item is depreciated separately. The gain or loss arising from the derecognition of an item of property, plant and equipment is included in profit or loss when the item is derecognized. The estimated useful lives for the current and comparative periods are as follows:
Buildings 10-60 yearsStructures 4-50 yearsMachinery and equipment 2-25 yearsVehicles 3-10 yearsTools 4-10 yearsFurniture and fixtures 3-10 yearsLease assets 3-18 years
POSCO and Subsidiaries Notes to the Consolidated Financial Statements, Continued As of December 31, 2013 and 2012
42
The estimated residual value, useful lives and the depreciation method are reviewed at least at the end of each reporting period and, if expectations differ from previous estimates, the changes are accounted for as changes in accounting estimates. Borrowing costs The Company capitalizes borrowing costs directly attributable to the acquisition, construction or production of a qualifying asset as part of the cost of that asset. Other borrowing costs are recognized in expense as incurred. A qualifying asset is an asset that requires a substantial period of time to get ready for its intended use or sale. Financial assets and inventories that are manufactured or otherwise produced over a short period of time are not qualifying assets. Assets that are ready for their intended use or sale when acquired are not qualifying assets. To the extent that the Company borrows funds specifically for the purpose of obtaining a qualifying asset, the Company determines the amount of borrowing costs eligible for capitalization as the actual borrowing costs incurred on that borrowing during the period less any investment income on the temporary investment of those borrowings. The Company immediately recognizes other borrowing costs as an expense. To the extent that the Company borrows funds generally and uses them for the purpose of obtaining a qualifying asset, the Company shall determine the amount of borrowing costs eligible for capitalization by applying a capitalization rate to the expenditures on that asset. The capitalization rate shall be the weighted average of the borrowing costs applicable to the borrowings of the Company that are outstanding during the period, other than borrowings made specifically for the purpose of obtaining a qualifying asset. The amount of borrowing costs that the Company capitalizes during a period shall not exceed the amount of borrowing costs incurred during that period. Intangible assets
Intangible assets are measured initially at cost and, subsequently, are carried at cost less accumulated amortization and accumulated impairment losses. Amortization of intangible assets except for goodwill is calculated on a straight-line basis over the estimated useful lives of intangible assets from the date that they are available for use. The residual value of intangible assets is zero. However, as there are no foreseeable limits to the periods over which club memberships are expected to be available for use, this intangible asset is determined as having an indefinite useful life and not amortized.
Intellectual property rights 5-10 yearsDevelopment costs 3-10 yearsPort facilities usage rights 5-75 yearsOther intangible assets 2-25 years
Amortization periods and the amortization methods for intangible assets with finite useful lives are reviewed at the end of each reporting period. The useful lives of intangible assets that are not being amortized are reviewed at the end of each reporting period to determine whether events and circumstances continue to support indefinite useful life assessments for those assets. Changes are accounted for as changes in accounting estimates.
POSCO and Subsidiaries Notes to the Consolidated Financial Statements, Continued As of December 31, 2013 and 2012
43
Expenditures on research activities, undertaken with the prospect of gaining new scientific or technical knowledge and understanding, are recognized in profit or loss as incurred. Development expenditures are capitalized only if development costs can be measured reliably, the product or process is technically and commercially feasible, future economic benefits are probable, and the Company intends to and has sufficient resources to complete development and to use or sell the asset. Other development expenditures are recognized in profit or loss as incurred.
Subsequent expenditures are capitalized only when they increase the future economic benefits embodied in the specific asset to which they relate. All other expenditures, including expenditures on internally generated goodwill and brands, are recognized in profit or loss as incurred. Exploration for and evaluation of mineral resources POSCO is engaged in exploration projects for mineral resources through subsidiaries, associates and joint ventures in the mines or other contractual arrangements. Expenditures related to the development of mineral resources are recognized as exploration or development intangible assets. The nature of these intangible assets are as follows: (a) Exploration and evaluation assets
Exploration and evaluation assets consist of expenditures for topographical studies, geophysical studies and trenching. These assets are reclassified as development assets when it is proved that the exploration has identified an economically feasible mine.
(b) Development assets
Development assets consist of expenditures for the evaluation of oil fields, facility construction, drilling for viability and others. These development assets are reclassified as industrial rights (mining rights) at inception of the extraction when the technical feasibility and commercial viability of extracting mineral resources are demonstrable. When proved reserves of oil and natural gas are determined and development is sanctioned, the relevant expenditure is transferred to property, plant and equipment and depreciation is computed by the unit of production method.
Government grants
Government grants are not recognized unless there is reasonable assurance that the Company will comply with the grant’s conditions and that the grant will be received.
(a) Grants related to assets
Government grants whose primary condition is that the Company purchase, construct or otherwise acquire long-term assets are deducted from the carrying amount of the assets and recognized in profit or loss on a systematic and rational basis over the life of the depreciable assets.
(b) Grants related to income
Government grants which are intended to compensate the Company for expenses incurred are deducted from the related expenses.
POSCO and Subsidiaries Notes to the Consolidated Financial Statements, Continued As of December 31, 2013 and 2012
44
Leases
The Company classifies and accounts for leases as either a finance or operating lease, depending on the terms. Leases where the Company assumes substantially all of the risks and rewards of ownership are classified as finance leases. All other leases are classified as operating leases. (a) Finance leases
At the commencement of the lease term, the Company recognizes as finance assets and finance liabilities the lower amount of the fair value of the leased property and the present value of the minimum lease payments, each determined at the inception of the lease. Any initial direct costs are added to the amount recognized as an asset. Minimum lease payments are apportioned between the finance charge and the reduction of the outstanding liability. The finance charge is allocated to each period during the lease term so as to produce a constant periodic rate of interest on the remaining balance of the liability. Contingent rents are charged as expenses in the periods in which they are incurred. The depreciable amount of a leased asset is allocated to each accounting period during the period of expected use on a systematic basis consistent with the depreciation policy the Company adopts for similar depreciable assets that are owned. If there is no reasonable certainty that the Company will obtain ownership by the end of the lease term, the asset is fully depreciated over the shorter of the lease term and its useful life.
(b) Operating leases
Lease obligations under operating leases are recognized as an expense on a straight-line basis over the lease term. Contingent rents are charged as expenses in the periods in which they are incurred.
(c) Determining whether an arrangement contains a lease
Determining whether an arrangement is, or contains, a lease is based on the substance of the arrangement and requires an assessment of whether fulfillment of the arrangement is dependent on the use of a specific asset or assets (the asset) and the arrangement conveys a right to use the asset. At inception or reassessment of the arrangement, management of the Company separates payments and other consideration required by such an arrangement into those for the lease and those for other elements on the basis of their relative fair values. If management of the Company concludes for a financial lease that it is impracticable to separate the payments reliably, the Company recognizes an asset and a liability at an amount equal to the fair value of the underlying asset that was identified as the subject of the lease. Subsequently, the liability shall be reduced as payments are made and an imputed finance charge on the liability recognized using the purchaser's incremental borrowing rate of interest.
POSCO and Subsidiaries Notes to the Consolidated Financial Statements, Continued As of December 31, 2013 and 2012
45
Impairment for financial assets A financial asset not carried at fair value through profit or loss is assessed at each reporting date to determine whether there is objective evidence that it is impaired. A financial asset is impaired if objective evidence indicates that a loss event has occurred after the initial recognition of the asset, and that the loss event had a negative effect on the estimated future cash flows of that asset that can be estimated reliably. However, losses expected as a result of future events, regardless of likelihood, are not recognized.
Objective evidence that a financial asset or group of assets are impaired includes:
(a) significant financial difficulty of the issuer or obligor; (b) a breach of contract, such as a default or delinquency in interest or principal payments; (c) the lender, for economic or legal reasons relating to the borrower's financial difficulty, granting to
the borrower a concession that the lender would not otherwise consider; (d) it becoming probable that the borrower will enter bankruptcy or other financial reorganization; (e) the disappearance of an active market for that financial asset because of financial difficulties; or (f) observable data indicating that there is a measurable decrease in the estimated future cash flows
from a group of financial assets since the initial recognition of those assets, although the decrease cannot yet be identified with the individual financial assets in the group.
In addition, for an equity instrument classified as available-for-sale, a significant or prolonged decline in its fair value below its cost is objective evidence of impairment. If financial assets have objective evidence that they are impaired, impairment losses are measured and recognized. (a) Financial assets measured at amortized cost
An impairment loss in respect of a financial asset measured at amortized cost is calculated as the difference between its carrying amount and the present value of its estimated future cash flows discounted at the asset’s original effective interest rate. If it is not practicable to obtain the instrument’s estimated future cash flows, impairment losses would be measured by using prices from any observable current market transactions. The Company can recognize impairment losses directly or establish a provision to cover impairment losses. If, in a subsequent period, the amount of the impairment loss decreases and the decrease can be related objectively to an event occurring after the impairment was recognized, the previously recognized impairment loss shall be reversed either directly or by adjusting an allowance account.
(b) Financial assets carried at cost
If there is objective evidence that an impairment loss has occurred on an unquoted equity instrument that is not carried at fair value because its fair value cannot be reliably measured, or on a derivative asset that is linked to and must be settled by delivery of such an unquoted equity instrument, the amount of the impairment loss is measured as the difference between the carrying amount of the financial asset and the present value of estimated future cash flows discounted at the current market rate of return for a similar financial asset. Such impairment losses are not reversed.
POSCO and Subsidiaries Notes to the Consolidated Financial Statements, Continued As of December 31, 2013 and 2012
46
(c) Available-for-sale financial assets
When a decline in the fair value of an available-for-sale financial asset has been recognized in other comprehensive income and there is objective evidence that the asset is impaired, the cumulative loss that had been recognized in other comprehensive income shall be reclassified from equity to profit or loss as a reclassification adjustment even though the financial asset has not been derecognized. Impairment losses recognized in profit or loss for an investment in an equity instrument classified as available-for-sale are not reversed through profit or loss. If, in a subsequent period, the fair value of a debt instrument classified as available-for-sale increases and the increase can be objectively related to an event occurring after the impairment loss was recognized in profit or loss, the impairment loss shall be reversed, with the amount of the reversal recognized in profit or loss.
Impairment for non-financial assets
The carrying amounts of the Company’s non-financial assets, other than assets arising from construction contracts, employee benefits, inventories, deferred tax assets and non-current assets held for sale, are reviewed at the end of the reporting period to determine whether there is any indication of impairment. If any such indication exists, then the asset’s recoverable amount is estimated. Goodwill and intangible assets that have indefinite useful lives or that are not yet available for use, irrespective of whether there is any indication of impairment, are tested for impairment annually by comparing their recoverable amount to their carrying amount. Management estimates the recoverable amount of an individual asset. If it is impossible to measure the individual recoverable amount of an asset, then management estimates the recoverable amount of cash-generating unit (“CGU”). A CGU is the smallest identifiable group of assets that generates cash inflows that are largely independent of the cash inflows from other assets or groups of assets. The recoverable amount of an asset or CGU is the greater of its value-in-use and its fair value less costs to sell. The Company determined that individual operating entities are CGUs. The recoverable amount of an asset or CGU is the greater of its value-in-use and its fair value less costs to sell. The value-in-use is estimated by applying a pre-tax discount rate that reflects current market assessments of the time value of money and the risks specific to the asset or CGU for which estimated future cash flows have not been adjusted, to the estimated future cash flows expected to be generated by the asset or CGU. An impairment loss is recognized if the carrying amount of an asset or a CGU exceeds its recoverable amount. Impairment losses are recognized in profit or loss. Goodwill acquired in a business combination is allocated to each CGU that is expected to benefit from the synergies arising from the goodwill acquired. Any impairment identified at the CGU level will first reduce the carrying value of goodwill and then be used to reduce the carrying amount of the other assets in the CGU on a pro rata basis. Except for impairment losses in respect of goodwill which are never reversed, an impairment loss is reversed if there has been a change in the estimates used to determine the recoverable amount. An impairment loss is reversed only to the extent that the asset’s carrying amount does not exceed the carrying amount that would have been determined, net of depreciation or amortization, if no impairment loss had been recognized.
POSCO and Subsidiaries Notes to the Consolidated Financial Statements, Continued As of December 31, 2013 and 2012
47
Derivative financial instruments and hedges
Derivatives are initially recognized at fair value. Subsequent to initial recognition, derivatives are measured at fair value, and changes therein are recognized in profit or loss.
(a) Embedded derivatives
Embedded derivatives are separated from the host contract and accounted for separately only if the following criteria have been met: (a) the economic characteristics and risks of the host contract and the embedded derivatives are not clearly and closely related to a separate instrument with the same terms as the embedded derivative that would meet the definition of a derivative, and (b) the hybrid (combined) instrument is not measured at fair value through profit or loss. Changes in the fair value of separable embedded derivatives from the host contract are recognized immediately in profit or loss. However, convertible rights of convertible bonds are not separated from the host contract and the compound financial instruments of bonds and convertible rights are designated and measured at fair value through profit and loss.
(b) Other derivatives
Changes in the fair value of a derivative that is not designated as a hedging instrument are recognized immediately in profit or loss.
Non-derivative financial liabilities
The Company classifies non-derivative financial liabilities into financial liabilities at fair value through
profit or loss or other financial liabilities in accordance with the substance of the contractual arrangement and the definitions of financial liabilities. The Company recognizes financial liabilities in the consolidated statement of financial position when the Company becomes a party to the contractual provisions of the financial liability.
(a) Financial liabilities at fair value through profit or loss
Financial liabilities at fair value through profit or loss include financial liabilities held for trading or designated as such upon initial recognition. Subsequent to initial recognition, financial liabilities at fair value through profit or loss are measured at fair value, and changes therein are recognized in profit or loss. Upon initial recognition, transaction costs that are directly attributable to the acquisition are recognized in profit or loss as incurred.
(b) Other financial liabilities
Non-derivative financial liabilities other than financial liabilities at fair value through profit or loss are classified as other financial liabilities.
POSCO and Subsidiaries Notes to the Consolidated Financial Statements, Continued As of December 31, 2013 and 2012
48
Financial guarantee liabilities are initially measured at their fair values and, if not designated as financial liabilities at fair value through profit or loss, they are subsequently measured at the higher of:
• the amount of the best estimate of the expenditure required to settle the present obligation at the end of the reporting period; and
• the amount initially recognized less, cumulative amortization recognized on a straight-line basis over the guarantee period
At the date of initial recognition, other financial liabilities are measured at fair value minus transaction costs that are directly attributable to the acquisition. Subsequent to initial recognition, other financial liabilities are measured at amortized cost using the effective interest method. The Company derecognizes a financial liability from the consolidated statement of financial position when it is extinguished (i.e. when the obligation specified in the contract is discharged, cancelled or expires). Construction work in progress Construction work in progress represents the gross unbilled amount expected to be collected from customers for contract work performed to date. It is measured at cost plus profit recognized to date less progress billings and recognized losses. Cost includes all expenditures related directly to specific projects and an allocation of fixed and variable overheads incurred in the Company’s contract activities based on normal operating capacity. Construction work in progress is presented as part of trade accounts and notes receivable in the consolidated statement of financial position for all contracts in which costs incurred plus recognized profits exceed progress billings. If progress billings exceed costs incurred plus recognized profits, then the difference is presented as amounts due to customers for contract work in the consolidated statement of financial position. Employee benefits
(a) Short-term employee benefits
Short-term employee benefits are employee benefits that are due to be settled within twelve months after the end of the period in which the employees render the related service. When an employee has rendered service to the Company during an accounting period, the Company recognizes the undiscounted amount of short-term employee benefits expected to be paid in exchange for that service as profit or loss. If the Company has a legal or constructive obligation which can be reliably measured, the Company recognizes the amount of expected payment for profit-sharing and bonuses payable as liabilities.
POSCO and Subsidiaries Notes to the Consolidated Financial Statements, Continued As of December 31, 2013 and 2012
49
(b) Other long-term employee benefits
Other long-term employee benefits include employee benefits that are settled beyond 12 months after the end of the period in which the employees render the related service, and are calculated at the present value of the amount of future benefit that employees have earned in return for their service in the current and prior periods, less the fair value of any related assets. The present value is determined by discounting the expected future cash flows using the interest rate of corporate bonds that have maturity dates approximating the terms of the Company’s obligations and that are denominated in the same currency in which the benefits are expected to be paid. Any actuarial gains and losses are recognized in profit or loss in the period in which they arise.
(c) Retirement benefits: Defined contribution plans
For defined contribution plans, when an employee has rendered service to the Company during a period, the Company recognizes the contribution payable to a defined contribution plan in exchange for that service as an accrued expense, after deducting any contributions already paid. If the contributions already paid exceed the contribution due for service before the end of the reporting period, the Company recognizes that excess as an asset (prepaid expense) to the extent that the prepayment will lead to a reduction in future payments or a cash refund.
(d) Retirement benefits: Defined benefit plans
A defined benefit plan is a post-employment benefit plan other than a defined contribution plan. The Company’s net obligation in respect of defined benefit plans is calculated by estimating the amount of future benefit that employees have earned in return for their service in the current and prior periods; that benefit is discounted to determine its present value. The fair value of plan assets is deducted. The calculation is performed annually by an independent actuary using the projected unit credit method.
The discount rate is the yield at the reporting date on corporate bonds that have maturity dates approximating the terms of the Company’s obligations and that are denominated in the same currency in which the benefits are expected to be paid. The Company recognizes all actuarial gains and losses arising from actuarial assumption changes and experiential adjustments in other comprehensive income when incurred.
When the fair value of plan assets exceeds the present value of the defined benefit obligation, the Company recognizes an asset, to the extent of the present value of the total of cumulative any economic benefits available in the form of refunds from the plan or reduction in the future contributions to the plan.
POSCO and Subsidiaries Notes to the Consolidated Financial Statements, Continued As of December 31, 2013 and 2012
50
Remeasurements of net defined benefit liabilities, which comprise actuarial gains and losses, the return on plan assets (excluding interest) and the effect of the asset ceiling (if any, excluding interest), are recognized immediately in other comprehensive income. The Company determines the net interest expense (income) on the net defined benefit liability (asset) for the period by applying the discount rate used to measure the defined benefit obligation at the beginning of the annual period to the then-net defined benefit liability (asset), taking into account any changes in the net defined benefit liability (asset) during the period as a result of contributions and benefit payments, net interest expense and other expenses related to defined benefit plans are recognized in profit or loss.
When the benefits of a plan are changed or when a plan is curtailed, the resulting change in benefit that relates to past service or the gain or loss in curtailment is recognized immediately in profit or loss. The Company recognizes gains and losses on the settlement of a defined benefit plan when the settlement occurs.
Provisions
Provisions are recognized when the Company has a present legal or constructive obligation as a result of a past event, it is probable that an outflow of resources embodying economic benefits will be required to settle the obligation and a reliable estimate can be made of the amount of the obligation. The risks and uncertainties that inevitably surround many events and circumstances are taken into account in reaching the best estimate of a provision. Where the effect of the time value of money is material, provisions are determined at the present value of the expected future cash flows. Where some or all of the expenditures required to settle a provision are expected to be reimbursed by another party, the reimbursement shall be recognized when, and only when, it is virtually certain that reimbursement will be received if the entity settles the obligation. The reimbursement shall be treated as a separate asset. Provisions are reviewed at the end of each reporting period and adjusted to reflect the current best estimates. If it is no longer probable that an outflow of resources embodying economic benefits will be required to settle the obligation, the provision is reversed. A provision is used only for expenditures for which the provision was originally recognized. A provision for warranties is recognized when the underlying products are sold. The provision is based on historical warranty data and a weighting of all possible outcomes against their associated probabilities. Regarding provision for construction warranties, warranty period starts from the completion of construction in accordance with construction contracts. If the Company has an obligation for warranties, provision for warranties which are estimated based on historcal warranty data are recorded as cost of construction and provision for warranties during the construction period.
POSCO and Subsidiaries Notes to the Consolidated Financial Statements, Continued As of December 31, 2013 and 2012
51
Equity instruments (a) Share capital
Common stock is classified as equity and the incremental costs arising directly attributable to the issuance of common stock less their tax effects are deducted from equity.
If the Company reacquires its own equity instruments, the amount of those instruments (“treasury shares”) are presented as a contra equity account. No gain or loss is recognized in profit or loss on the purchase, sale, issuance or cancellation of its own equity instruments. When treasury shares are sold or reissued subsequently, the amount received is recognized as an increase to equity, and the resulting surplus or deficit on the transaction is recorded in capital surplus.
(b) Hybrid Bonds
Debt and equity instruments issued by the Company are classified as either financial liabilities or as equity in accordance with the substance of the contractual arrangements and the definitions of financial liability and an equity instrument. When the Company has an unconditional right to avoid delivering cash or another financial asset to settle a contractual obligation, the Company’s hybrid bond has been classified as an equity instrument.
Revenue Revenue from the sale of goods, services provided and the use of assets is measured at the fair value of the consideration received or receivable, net of returns and allowances, trade discounts and volume rebates, which are not significant for all periods presented. (a) Sale of goods
Revenue from the sale of goods in the ordinary course of activities is measured at the fair value of the consideration received or receivable, net of returns, trade discounts and volume rebates. Revenue is recognized when persuasive evidence exists, usually in the form of an executed sales agreement, that the significant risks and rewards of ownership have been transferred to the buyer, recovery of the consideration is probable, the associated costs and possible return of goods can be estimated reliably, there is no continuing management involvement with the goods, and the amount of revenue can be measured reliably. The appropriate timing for transfer of risks and rewards varies depending on the individual terms and conditions of the sales contract. For international sales, this timing depends on the type of international commercial terms of the contract.
(b) Services rendered
Revenue from services rendered is recognized in profit or loss in proportion to the stage of completion of the transaction at the reporting date. The stage of completion is assessed by reference to surveys of work performed.
POSCO and Subsidiaries Notes to the Consolidated Financial Statements, Continued As of December 31, 2013 and 2012
52
(c) Construction contracts
Construction contracts of the Company primarily consist of contracts for the construction of plants and commercial or residential buildings, and revenue recognition for different types of contracts is as follows: When the outcome of a construction contract can be estimated reliably, contract revenue is recognized in profit or loss in proportion to the stage of completion of the contract. Contract revenue includes the initial amount agreed in the contract plus any variation in contract work, claims and incentive payments, to the extent that it is probable that they will result in revenue and can be measured reliably. The stage of completion of a contract is determined based on the proportion that contract costs incurred for work performed to date bear to the estimated total contract costs. When the outcome of a construction contract cannot be estimated reliably, the revenue is recognized only to the extent of contract costs incurred that it is probable will be recoverable. An expected loss on the construction contract shall be recognized as an expense immediately.
(d) Rental income
Rental income from investment property, net of lease incentives granted, is recognized in profit or loss on a straight-line basis over the term of the lease.
Finance income and finance costs Finance income comprises interest income on funds invested (including available-for-sale financial assets), dividend income, gains on the disposal of available-for-sale financial assets and changes in the fair value of financial assets at fair value through profit or loss. Interest income is recognized as it accrues in profit or loss, using the effective interest rate method. Dividend income is recognized in profit or loss on the date that the Company’s right to receive payment is established. Finance costs comprise interest expense on borrowings and changes in the fair value of financial assets at fair value through profit or loss. Borrowing costs are recognized in profit or loss using the effective interest rate method. Income taxes
Income tax expense comprises current and deferred tax. Current tax and deferred tax are recognized in profit or loss except to the extent that it relates to a business combination, or items recognized directly in equity or in other comprehensive income. (a) Current income tax
Current income tax is the expected income tax payable or receivable on the taxable profit or loss for the year, using tax rates enacted or substantively enacted at the end of the reporting period and any adjustment to tax payable in respect of previous years. The taxable profit is different from the accounting profit for the period since the taxable profit is calculated excluding the temporary differences, which will be taxable or deductible in determining taxable profit of future periods, and non-taxable or non-deductible items from the accounting profit.

POSCO and Subsidiaries Notes to the Consolidated Financial Statements, Continued As of December 31, 2013 and 2012
53
(b) Deferred income tax
The measurement of deferred income tax liabilities and deferred tax assets reflects the tax consequences that would follow from the manner in which the Company expects, at the end of the reporting period, to recover or settle the carrying amount of its assets and liabilities. The Company recognizes a deferred income tax liability for all taxable temporary differences associated with investments in subsidiaries, associates, and joint ventures, except to the extent that the Company is able to control the timing of the reversal of the temporary difference and it is probable that the temporary difference will not reverse in the foreseeable future. The Company recognizes a deferred income tax asset for deductible temporary differences arising from investments in subsidiaries, associates and joint ventures, to the extent that it is probable that the temporary difference will reverse in the foreseeable future and taxable profit will be available against which the temporary difference can be utilized. However, deferred income tax is not recognized for the following temporary differences: taxable temporary differences arising on the initial recognition of goodwill, or the initial recognition of assets or liabilities in a transaction that is not a business combination and that affects neither accounting profit or loss nor taxable income. The carrying amount of a deferred income tax asset is reviewed at the end of each reporting period and is reduced to the extent that it is no longer probable that sufficient taxable profit will be available to allow the benefit of part or all of that deferred tax asset to be utilized.
Deferred income tax assets and liabilities are measured at the tax rates that are expected to apply to the period when the asset is realized or the liability is settled, based on tax rates (and tax laws) that have been enacted or substantively enacted by the end of the reporting period. The measurement of deferred income tax liabilities and deferred income tax assets reflects the tax consequences that would follow from the manner in which the Company expects, at the end of the reporting period to recover or settle the carrying amount of its assets and liabilities. Deferred income tax assets and liabilities are offset only if there is a legally enforceable right to offset the related current income tax liabilities and assets, and they relate to income taxes levied by the same tax authority and they intend to settle current income tax liabilities and assets on a net basis.
Earnings per share Management calculates basic earnings per share (“EPS”) data for the Company’s ordinary shares, which is presented at the end of the statement of comprehensive income. Basic EPS is calculated by dividing profit attributable to ordinary shareholders of the Company by the weighted average number of ordinary shares outstanding during the period, adjusted for own shares held.
POSCO and Subsidiaries Notes to the Consolidated Financial Statements, Continued As of December 31, 2013 and 2012
54
Operating segments An operating segment is a component of the Company that : a) engages in business activities from which it may earn revenues and incur expenditures, including revenues and expenses that relate to transactions with any of the Company`s other components, b) whose operating results are regularly reviewed by the Company’s chief operating decision maker (“CODM”) to make decisions about resources to be allocated to the segment and assess its performance and for which discrete financial information is available. Management has determined that the CODM of the Company is the CEO. Segment profit and loss is determined the same way that consolidated net after tax profit for the period is determined under K-IFRS without any adjustment for corporate allocations. The accounting policies used by each segment are consistent with the accounting policies used in the preparation of the consolidated financial statements. Segment assets and liabilities are measured based on total assets and liabilities in accordance with K-IFRS without any adjustment for corporate allocations. Also, segment assets and liabilities are based on the separate financial statements of the entities instead of on consolidated basis. In addition, there are varying levels of transactions amongst the reportable segments. These transactions include sales of property, plant and assets, and rendering of construction service and so on. Inter-segment transactions are accounted for on an arm’s length basis. Segment results that are reported to the CEO include items directly attributable to a segment and do not include allocated items. Segment capital expenditure is the total cost incurred during the period to acquire property, plant and equipment, and intangible assets other than goodwill. New standards and interpretations not yet adopted The following new standards, interpretations and amendments to existing standards have been published and are mandatory for the Company for annual periods beginning after January 1, 2013, and the Company has not early adopted them. Management believes the impact of the amendments on the Company’s consolidated financial statements is not significant. (a) Amendments to K-IFRS No. 1032 “Financial Instruments : Presentation” The amendments clarified application guidance related to offsetting of a financial asset and a financial liability. The amendments are mandatorily effective for annual periods beginning on or after January 1, 2014 with earlier adoption permitted.

POSCO and Subsidiaries Notes to the Consolidated Financial Statements, Continued As of December 31, 2013 and 2012
55
4. Financial risk management The Company has exposure to the following risks from its use of financial instruments:
• credit risk • liquidity risk • market risk • capital risk
This note presents information about the Company’s exposure to each of the above risks, the Company’s objectives, policies and processes for measuring and managing risk, and the Company’s management of capital. Further quantitative disclosures are included throughout these consolidated financial statements. (a) Financial risk management
1) Risk management policy
The Board of Directors has overall responsibility for the establishment and oversight of the Company’s risk management framework. The Company’s risk management policies are established to identify and analyze the risks faced by the Company, to set appropriate risk limits and controls, and to monitor risks and adherence to limits. Risk management policies and systems are reviewed regularly to reflect changes in market conditions and the Company’s activities. The Company, through its training and management standards and procedures, aims to develop a disciplined and constructive control environment in which all employees understand their roles and obligations.
2) Credit risk
Credit risk is the risk of financial loss to the Company if a customer or counterparty to a financial instrument fails to meet its contractual obligations, and arises principally from the Company’s receivables from customers and investment securities. In addition, credit risk arises from finance guarantees. The Company implements a credit risk management policy under which the Company only transacts business with counterparties that have a certain level of credit rate evaluated based on financial condition, historical experience, and other factors. The Company’s exposure to credit risk is influenced mainly by the individual characteristics of each customer. The default risk of a nation or an industry in which a customer operates its business does not have a significant influence on credit risk. The Company has established a credit policy under which each new customer is analyzed individually for creditworthiness.

POSCO and Subsidiaries Notes to the Consolidated Financial Statements, Continued As of December 31, 2013 and 2012
56
The Company establishes an allowance for impairment that represents its estimate of incurred losses in respect of trade and other receivables. The main components of this allowance are a specific loss component that relates to individually significant exposures, and a collective loss component established for companies of similar assets in respect of losses that have been incurred but not yet identified. The collective loss allowance is determined based on historical data of payment statistics for similar financial assets. Debt securities are analyzed individually, and an expected loss shall be directly deducted from debt securities. Credit risk also arises from transactions with financial institutions, and such transactions include transactions of cash and cash equivalents, various deposits, and financial instruments such as derivative contracts. The Company manages its exposure to this credit risk by only entering into transactions with banks that have high international credit ratings. The Company’s treasury department authorizes, manages, and overseas new transactions with financial institutions with whom the Company has no previous relationship. Furthermore, the Company limits its exposure to credit risk of financial guarantee contracts by strictly evaluating their necessity based on internal decision making processes, such as the approval of the board of directors.
3) Liquidity risk management
Liquidity risk is the risk that the Company will encounter difficulty in meeting the obligations associated with its financial liabilities that are settled by delivering cash or another financial asset. The Company’s approach to managing liquidity is to ensure, as far as possible, that it will always have sufficient liquidity to meet its liabilities when due, under both normal and stressed conditions, without incurring unacceptable losses or risking damage to the Company’s reputation.
The Company's cash flow from business, borrowing or financing is sufficient to meet the cash requirements for the Company’s strategic investments. Management believes that the Company is capable of raising funds by borrowing or financing if the Company is not able to generate cash flow requirements from its operations. The Company has committed borrowing facilities with various banks.
4) Market risk management
Market risk means that the fair value or future cash flows of a financial instrument will fluctuate because of changes in market prices. The goal of market risk management is optimization of profit and controlling the exposure to market risk within acceptable limits. ① Currency risk
Each segment is influenced by a risk factor of changes in foreign currency exchange rates for the different directions due to the difference in structure of each industry regarding the cash inflows and cash outflows in foreign currency. The steel segment generally has a lack of foreign currency cash outflows, while the engineering and construction segments generally have excessive foreign currency inflows due to the nature of their respective business. Therefore, the result of the business is affected by the changes of foreign exchange rates.

POSCO and Subsidiaries Notes to the Consolidated Financial Statements, Continued As of December 31, 2013 and 2012
57
The trading segment is structured such that the cash inflows and outflows of foreign currencies are to be offset; however, the trading segment is exposed to a risk of changes in foreign currency exchange rates when there are differences in currencies on receiving and paying the foreign currency amount and time differences.
The Company’s policy in respect of foreign currency risks is a natural hedge whereby foreign currency income is offset with foreign currency expenditures. The remaining net exposures after the natural hedge have been hedged using derivative contracts such as forward exchange contracts. In addition, the Company’s derivative transactions are limited to hedging actual foreign currency transactions and speculative hedging is not permitted. Based on this policy, the Company entities have performed currency risk management specific to various characteristics of different segments. The entities in the steel industry, which has a lack of foreign currency cash flows, has foreign currency borrowings from banks and hedges foreign currency risks of the foreign currency borrowings by using foreign currency swaps. The entities in the engineering and construction segments, which have excessive foreign currency cash flows, have hedged foreign currency risks by using forward exchange contracts. Entities in the trading industry have hedged foreign currency risks by using forward exchange contracts when the foreign currencies received and paid are different.
② Interest rate risk
The Company mostly borrows at fixed interest rates. The Company’s management monitors interest rate risks regularly.
③ Other market price risk Equity price risk arises from listed equity securities among available-for-sale equity securities. Management of the Company measures regularly the fair value of listed equity securities and the risk of variance in future cash flow caused by market price fluctuations. Significant investments are managed separately and all buy and sell decisions are approved by management of the Company.
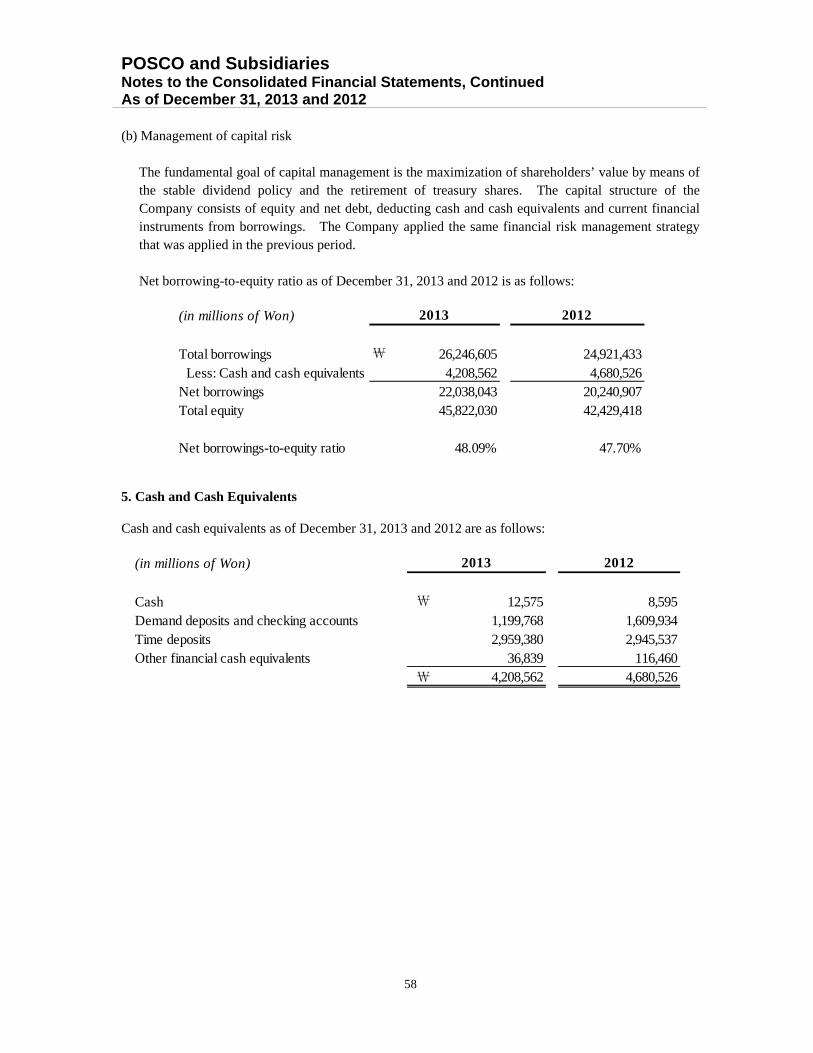
POSCO and Subsidiaries Notes to the Consolidated Financial Statements, Continued As of December 31, 2013 and 2012
58
(b) Management of capital risk
The fundamental goal of capital management is the maximization of shareholders’ value by means of the stable dividend policy and the retirement of treasury shares. The capital structure of the Company consists of equity and net debt, deducting cash and cash equivalents and current financial instruments from borrowings. The Company applied the same financial risk management strategy that was applied in the previous period.
Net borrowing-to-equity ratio as of December 31, 2013 and 2012 is as follows:
5. Cash and Cash Equivalents Cash and cash equivalents as of December 31, 2013 and 2012 are as follows:
(in millions of Won)
Total borrowings ₩ 26,246,605 24,921,433 Less: Cash and cash equivalents 4,208,562 4,680,526Net borrowings 22,038,043 20,240,907Total equity 45,822,030 42,429,418
Net borrowings-to-equity ratio 48.09% 47.70%
2013 2012
(in millions of Won)
Cash ₩ 12,575 8,595Demand deposits and checking accounts 1,199,768 1,609,934Time deposits 2,959,380 2,945,537Other financial cash equivalents 36,839 116,460
₩ 4,208,562 4,680,526
2013 2012
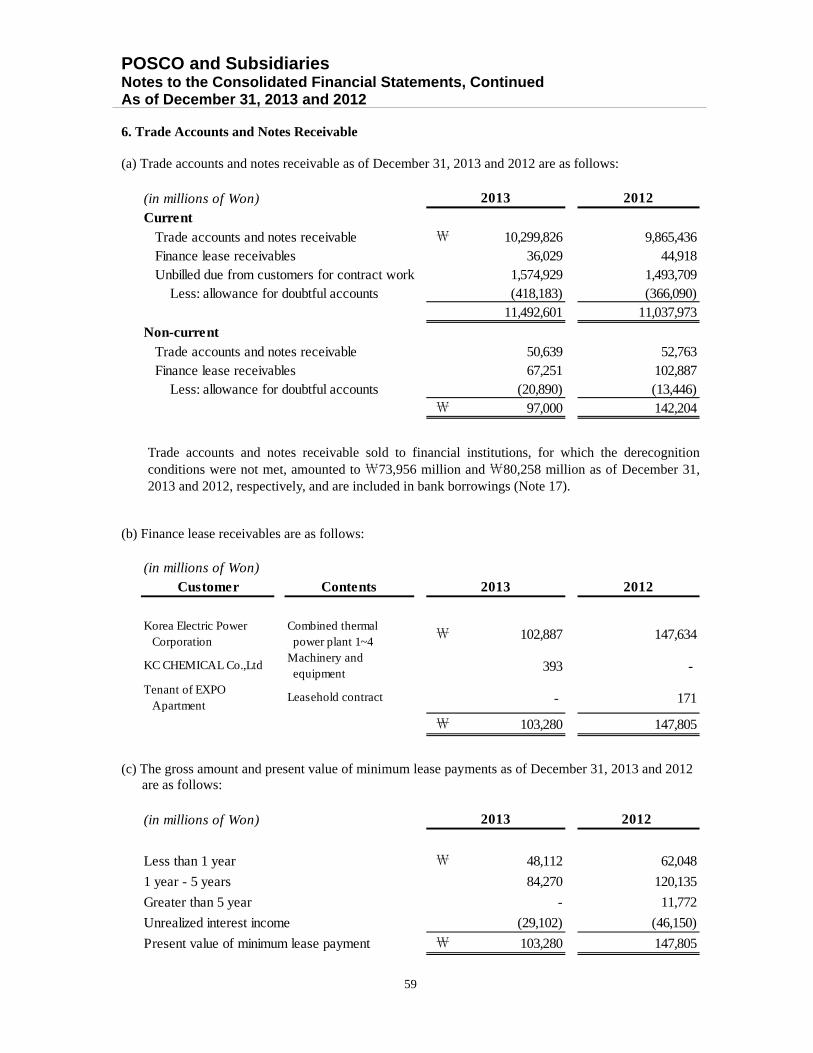
POSCO and Subsidiaries Notes to the Consolidated Financial Statements, Continued As of December 31, 2013 and 2012
59
6. Trade Accounts and Notes Receivable (a) Trade accounts and notes receivable as of December 31, 2013 and 2012 are as follows:
Trade accounts and notes receivable sold to financial institutions, for which the derecognition conditions were not met, amounted to ₩73,956 million and ₩80,258 million as of December 31, 2013 and 2012, respectively, and are included in bank borrowings (Note 17).
(b) Finance lease receivables are as follows:
(c) The gross amount and present value of minimum lease payments as of December 31, 2013 and 2012
are as follows:
(in millions of Won)Current Trade accounts and notes receivable ₩ 10,299,826 9,865,436 Finance lease receivables 36,029 44,918 Unbilled due from customers for contract work 1,574,929 1,493,709 Less: allowance for doubtful accounts (418,183) (366,090)
11,492,601 11,037,973
Non-current Trade accounts and notes receivable 50,639 52,763 Finance lease receivables 67,251 102,887 Less: allowance for doubtful accounts (20,890) (13,446)
₩ 97,000 142,204
2013 2012
(in millions of Won)Customer Contents
Korea Electric Power Corporation
Combined thermal power plant 1~4
₩ 102,887 147,634
KC CHEMICAL Co.,LtdMachinery and equipment
393 -
Tenant of EXPO Apartment
Leasehold contract - 171
₩ 103,280 147,805
2013 2012
(in millions of Won)
Less than 1 year ₩ 48,112 62,048
1 year - 5 years 84,270 120,135
Greater than 5 year - 11,772
Unrealized interest income (29,102) (46,150)
Present value of minimum lease payment ₩ 103,280 147,805
2013 2012
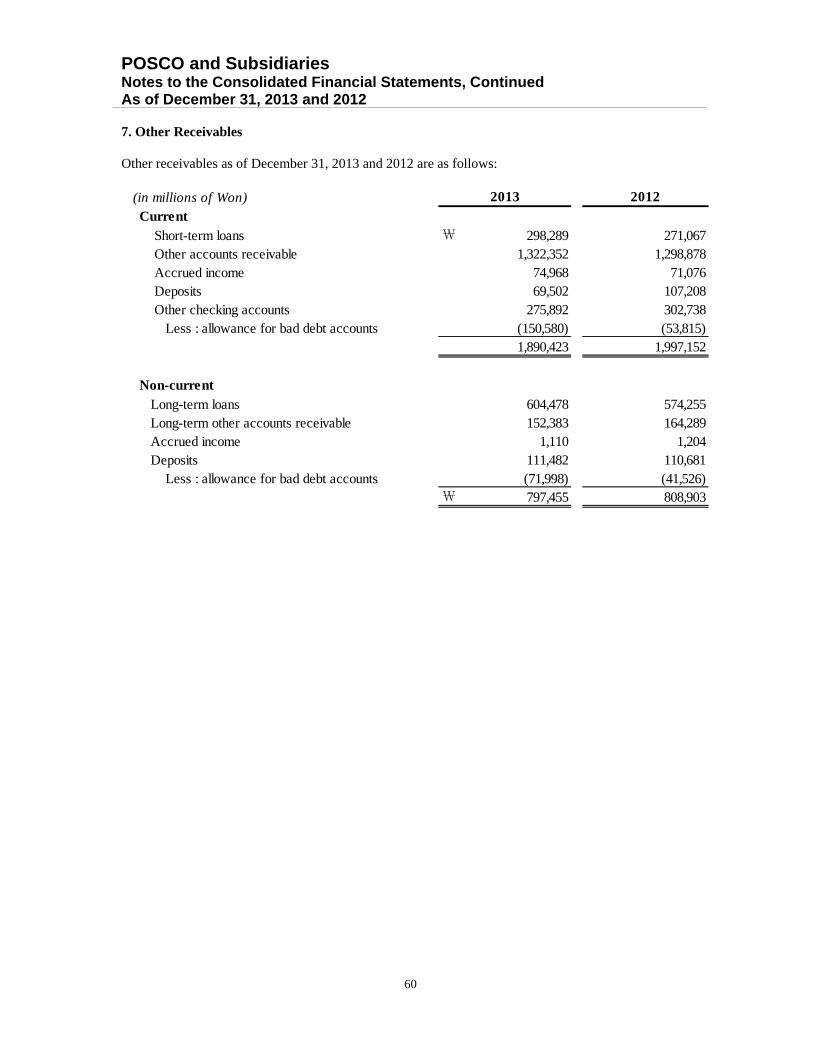
POSCO and Subsidiaries Notes to the Consolidated Financial Statements, Continued As of December 31, 2013 and 2012
60
7. Other Receivables Other receivables as of December 31, 2013 and 2012 are as follows:
(in millions of Won)Current
Short-term loans ₩ 298,289 271,067 Other accounts receivable 1,322,352 1,298,878 Accrued income 74,968 71,076 Deposits 69,502 107,208 Other checking accounts 275,892 302,738 Less : allowance for bad debt accounts (150,580) (53,815)
1,890,423 1,997,152
Non-current Long-term loans 604,478 574,255 Long-term other accounts receivable 152,383 164,289 Accrued income 1,110 1,204 Deposits 111,482 110,681 Less : allowance for bad debt accounts (71,998) (41,526)
₩ 797,455 808,903
2013 2012

POSCO and Subsidiaries Notes to the Consolidated Financial Statements, Continued As of December 31, 2013 and 2012
61
8. Other Financial Assets
(a) Other short-term financial assets as of December 31, 2013 and 2012 are as follows:
(*1) As of December 31, 2013 and 2012, short-term financial instruments amounting to ₩4,700 million and ₩3,400 million, respectively, are provided as collateral in relation to long-term borrowings from the National Forestry Cooperative Federation.
(*2) As of December 31, 2013 and 2012, ₩949 million and ₩12,699 million, respectively, are restricted for the use in a government project.
(*3) As of December 31, 2013 and 2012, short-term financial instruments amounting to ₩27,195 million and ₩7,650 million, respectively, are provided as collateral for long-term borrowings.
(*4) As of December 31, 2013 and 2012, short-term financial instruments amounting to ₩261,034 million and ₩153,251 million, respectively, are restricted for use in financial arrangements, pledge and others.
(b) Other long-term financial assets as of December 31, 2013 and 2012 are as follows:
(*1) As of December 31, 2013, 1,795,860 shares equivalent to 16,162,743 American Depository Receipts (“ADRs”) of SK Telecom Co., Ltd. have been pledged as collateral for exchangeable bonds issued.
(*2) During the year ended December 31, 2013, there was a significant decline in the fair value of shares of KB Financial Group Inc. and others for a prolonged period, which was considered as objective evidence of impairment. As a result, an impairment loss of ₩280,237 million was recognized in profit or loss during the year ended December 31, 2013.
(*3) As of December 31, 2013 and 2012, ₩229,052 million and ₩167,100 million of long-term available-for-sale securities, respectively, have been provided as collateral for construction projects of CHUNGJU ENTERPRISE CITY DEVELOPMENT Co., Ltd. and others.
(in millions of Won)
Derivatives assets held for trading ₩ 44,082 62,720Short-term available-for-sale securities 10,772 133,656Current portion of held-to-maturity securities (bonds) 2,232 31,237Short-term financial instruments(*1,2,3,4) 2,913,579 1,621,668
₩ 2,970,665 1,849,281
2013 2012
(in millions of Won)
Derivatives asstes held for trading ₩ 34,140 8,634Long-term available-for-sale securities (equity instruments)(*1,2,3) 4,068,766 3,711,169Long-term available-for-sale securities (bonds) 32,456 26,430Long-term available-for-sale securities (others) 54,390 43,267Held-to-maturity securities (bonds) 1,602 3,251Long-term financial instruments 274,376 68,215
₩ 4,465,730 3,860,966
2013 2012
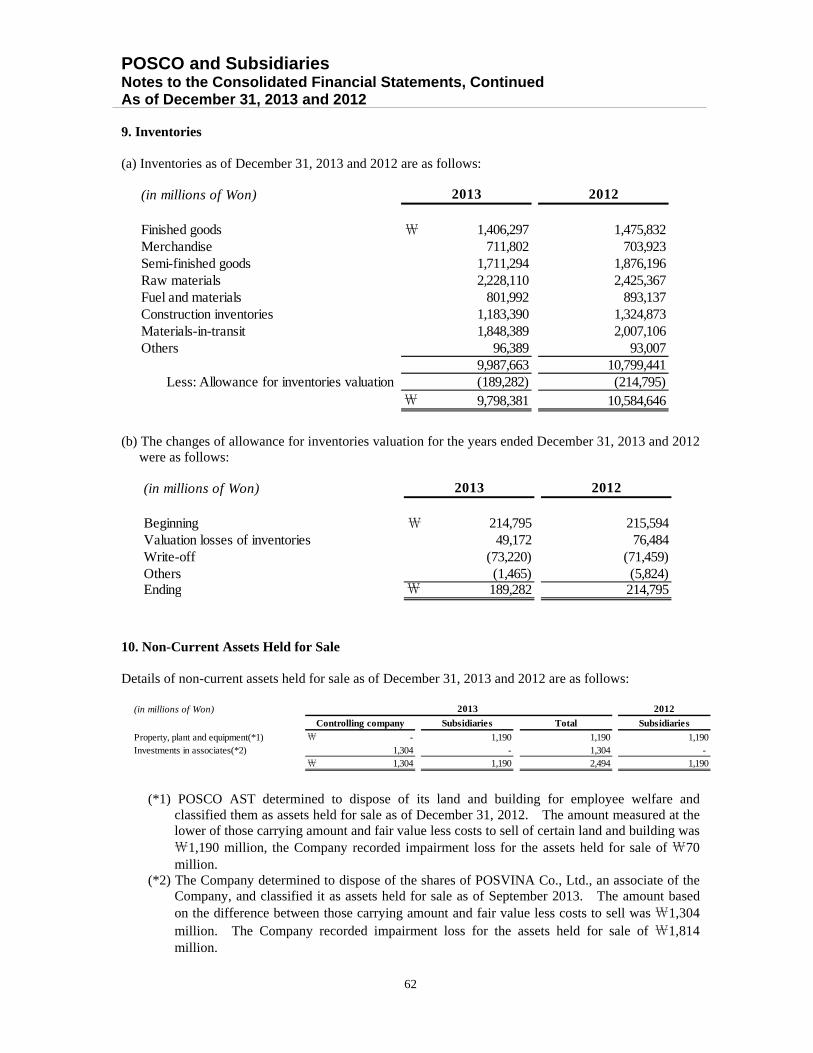
POSCO and Subsidiaries Notes to the Consolidated Financial Statements, Continued As of December 31, 2013 and 2012
62
9. Inventories (a) Inventories as of December 31, 2013 and 2012 are as follows:
(b) The changes of allowance for inventories valuation for the years ended December 31, 2013 and 2012 were as follows:
10. Non-Current Assets Held for Sale Details of non-current assets held for sale as of December 31, 2013 and 2012 are as follows:
(*1) POSCO AST determined to dispose of its land and building for employee welfare and classified them as assets held for sale as of December 31, 2012. The amount measured at the lower of those carrying amount and fair value less costs to sell of certain land and building was ₩1,190 million, the Company recorded impairment loss for the assets held for sale of ₩70 million.
(*2) The Company determined to dispose of the shares of POSVINA Co., Ltd., an associate of the Company, and classified it as assets held for sale as of September 2013. The amount based on the difference between those carrying amount and fair value less costs to sell was ₩1,304 million. The Company recorded impairment loss for the assets held for sale of ₩1,814 million.
(in millions of Won)
Finished goods ₩ 1,406,297 1,475,832Merchandise 711,802 703,923Semi-finished goods 1,711,294 1,876,196Raw materials 2,228,110 2,425,367Fuel and materials 801,992 893,137Construction inventories 1,183,390 1,324,873Materials-in-transit 1,848,389 2,007,106Others 96,389 93,007
9,987,663 10,799,441 Less: Allowance for inventories valuation (189,282) (214,795)
₩ 9,798,381 10,584,646
2013 2012
(in millions of Won)
Beginning ₩ 214,795 215,594Valuation losses of inventories 49,172 76,484Write-off (73,220) (71,459)Others (1,465) (5,824)Ending ₩ 189,282 214,795
2013 2012
(in millions of Won) 2012
Subsidiaries Total Subsidiaries
Property, plant and equipment(*1) ₩ - 1,190 1,190 1,190Investments in associates(*2) 1,304 - 1,304 -
₩ 1,304 1,190 2,494 1,190
2013
Controlling company
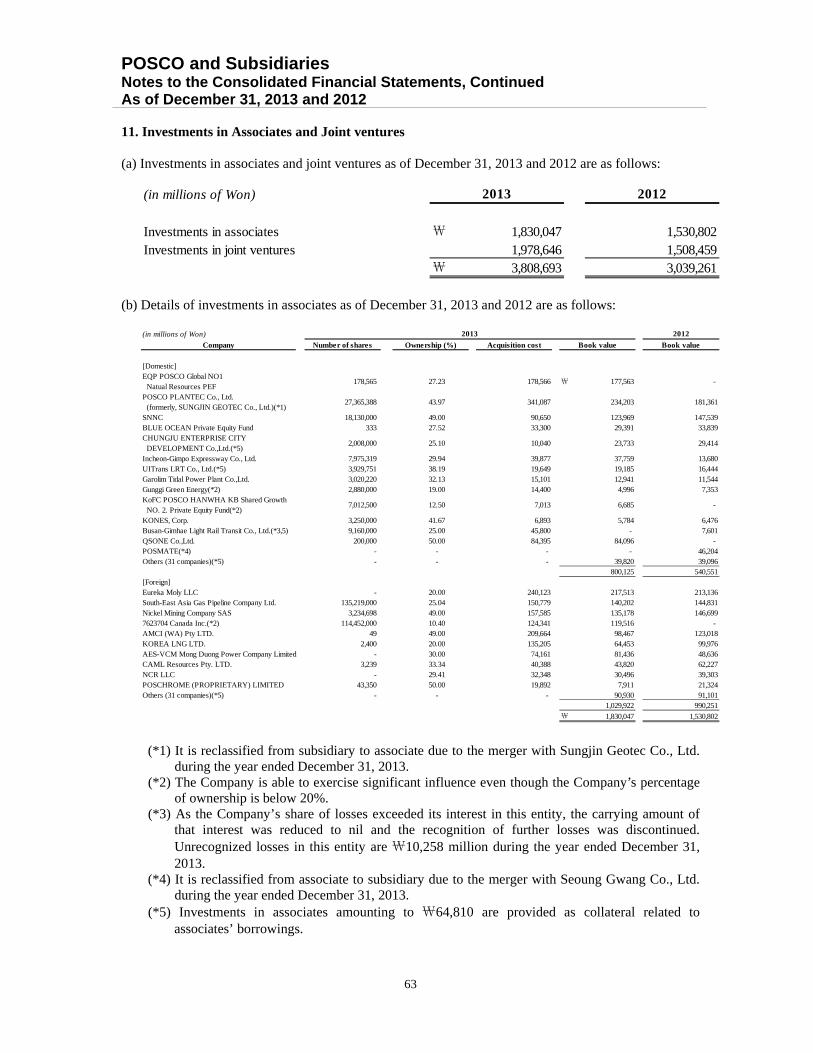
POSCO and Subsidiaries Notes to the Consolidated Financial Statements, Continued As of December 31, 2013 and 2012
63
11. Investments in Associates and Joint ventures (a) Investments in associates and joint ventures as of December 31, 2013 and 2012 are as follows:
(b) Details of investments in associates as of December 31, 2013 and 2012 are as follows:
(*1) It is reclassified from subsidiary to associate due to the merger with Sungjin Geotec Co., Ltd. during the year ended December 31, 2013.
(*2) The Company is able to exercise significant influence even though the Company’s percentage of ownership is below 20%.
(*3) As the Company’s share of losses exceeded its interest in this entity, the carrying amount of that interest was reduced to nil and the recognition of further losses was discontinued. Unrecognized losses in this entity are ₩10,258 million during the year ended December 31, 2013.
(*4) It is reclassified from associate to subsidiary due to the merger with Seoung Gwang Co., Ltd. during the year ended December 31, 2013.
(*5) Investments in associates amounting to ₩64,810 are provided as collateral related to associates’ borrowings.
(in millions of Won)
Investments in associates ₩ 1,830,047 1,530,802Investments in joint ventures 1,978,646 1,508,459
₩ 3,808,693 3,039,261
2013 2012
(in millions of Won)
Company
[Domestic]EQP POSCO Global NO1 Natual Resources PEF
178,565 27.23 178,566 ₩ 177,563 -
27,365,388 43.97 341,087 234,203 181,361
SNNC 18,130,000 49.00 90,650 123,969 147,539BLUE OCEAN Private Equity Fund 333 27.52 33,300 29,391 33,839CHUNGJU ENTERPRISE CITY DEVELOPMENT Co.,Ltd.(*5)
2,008,000 25.10 10,040 23,733 29,414
Incheon-Gimpo Expressway Co., Ltd. 7,975,319 29.94 39,877 37,759 13,680UITrans LRT Co., Ltd.(*5) 3,929,751 38.19 19,649 19,185 16,444Garolim Tidal Power Plant Co.,Ltd. 3,020,220 32.13 15,101 12,941 11,544Gunggi Green Energy(*2) 2,880,000 19.00 14,400 4,996 7,353KoFC POSCO HANWHA KB Shared Growth NO. 2. Private Equity Fund(*2)
7,012,500 12.50 7,013 6,685 -
KONES, Corp. 3,250,000 41.67 6,893 5,784 6,476Busan-Gimhae Light Rail Transit Co., Ltd.(*3,5) 9,160,000 25.00 45,800 - 7,601QSONE Co.,Ltd. 200,000 50.00 84,395 84,096 - POSMATE(*4) - - - - 46,204Others (31 companies)(*5) - - - 39,820 39,096
800,125 540,551[Foreign]Eureka Moly LLC - 20.00 240,123 217,513 213,136South-East Asia Gas Pipeline Company Ltd. 135,219,000 25.04 150,779 140,202 144,831Nickel Mining Company SAS 3,234,698 49.00 157,585 135,178 146,6997623704 Canada Inc.(*2) 114,452,000 10.40 124,341 119,516 - AMCI (WA) Pty LTD. 49 49.00 209,664 98,467 123,018KOREA LNG LTD. 2,400 20.00 135,205 64,453 99,976AES-VCM Mong Duong Power Company Limited - 30.00 74,161 81,436 48,636CAML Resources Pty. LTD. 3,239 33.34 40,388 43,820 62,227NCR LLC - 29.41 32,348 30,496 39,303POSCHROME (PROPRIETARY) LIMITED 43,350 50.00 19,892 7,911 21,324Others (31 companies)(*5) - - - 90,930 91,101
1,029,922 990,251₩ 1,830,047 1,530,802
2013 2012
Number of shares Ownership (%) Acquisition cost Book value Book value
POSCO PLANTEC Co., Ltd. (formerly, SUNGJIN GEOTEC Co., Ltd.)(*1)
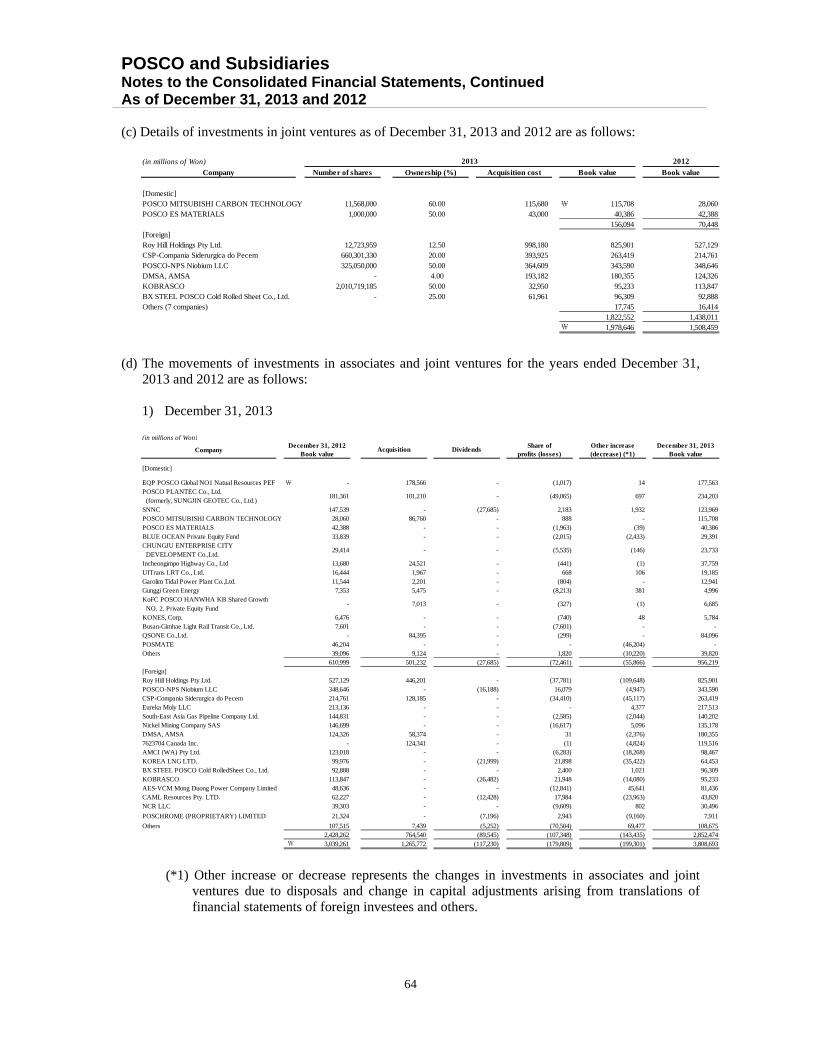
POSCO and Subsidiaries Notes to the Consolidated Financial Statements, Continued As of December 31, 2013 and 2012
64
(c) Details of investments in joint ventures as of December 31, 2013 and 2012 are as follows:
(d) The movements of investments in associates and joint ventures for the years ended December 31,
2013 and 2012 are as follows:
1) December 31, 2013
(*1) Other increase or decrease represents the changes in investments in associates and joint ventures due to disposals and change in capital adjustments arising from translations of financial statements of foreign investees and others.
(in millions of Won)
Company
[Domestic]POSCO MITSUBISHI CARBON TECHNOLOGY 11,568,000 60.00 115,680 ₩ 115,708 28,060POSCO ES MATERIALS 1,000,000 50.00 43,000 40,386 42,388
156,094 70,448[Foreign]Roy Hill Holdings Pty Ltd. 12,723,959 12.50 998,180 825,901 527,129CSP-Compania Siderurgica do Pecem 660,301,330 20.00 393,925 263,419 214,761POSCO-NPS Niobium LLC 325,050,000 50.00 364,609 343,590 348,646DMSA, AMSA - 4.00 193,182 180,355 124,326KOBRASCO 2,010,719,185 50.00 32,950 95,233 113,847BX STEEL POSCO Cold Rolled Sheet Co., Ltd. - 25.00 61,961 96,309 92,888Others (7 companies) 17,745 16,414
1,822,552 1,438,011₩ 1,978,646 1,508,459
Acquisition costOwnership (%)
2013
Number of shares
2012
Book value Book value
(in millions of Won)
Company
[Domestic]
EQP POSCO Global NO1 Natual Resources PEF ₩ - 178,566 - (1,017) 14 177,563
181,361 101,210 - (49,065) 697 234,203
SNNC 147,539 - (27,685) 2,183 1,932 123,969POSCO MITSUBISHI CARBON TECHNOLOGY 28,060 86,760 - 888 - 115,708POSCO ES MATERIALS 42,388 - - (1,963) (39) 40,386BLUE OCEAN Private Equity Fund 33,839 - - (2,015) (2,433) 29,391CHUNGJU ENTERPRISE CITY DEVELOPMENT Co.,Ltd.
29,414 - - (5,535) (146) 23,733
Incheongimpo Highway Co., Ltd 13,680 24,521 - (441) (1) 37,759UITrans LRT Co., Ltd. 16,444 1,967 - 668 106 19,185Garolim Tidal Power Plant Co.,Ltd. 11,544 2,201 - (804) - 12,941Gunggi Green Energy 7,353 5,475 - (8,213) 381 4,996KoFC POSCO HANWHA KB Shared Growth NO. 2. Private Equity Fund
- 7,013 - (327) (1) 6,685
KONES, Corp. 6,476 - - (740) 48 5,784Busan-Gimhae Light Rail Transit Co., Ltd. 7,601 - - (7,601) - - QSONE Co.,Ltd. - 84,395 - (299) - 84,096POSMATE 46,204 - - - (46,204) - Others 39,096 9,124 - 1,820 (10,220) 39,820
610,999 501,232 (27,685) (72,461) (55,866) 956,219[Foreign]Roy Hill Holdings Pty Ltd. 527,129 446,201 - (37,781) (109,648) 825,901POSCO-NPS Niobium LLC 348,646 - (16,188) 16,079 (4,947) 343,590CSP-Compania Siderurgica do Pecem 214,761 128,185 - (34,410) (45,117) 263,419Eureka Moly LLC 213,136 - - - 4,377 217,513South-East Asia Gas Pipeline Company Ltd. 144,831 - - (2,585) (2,044) 140,202Nickel Mining Company SAS 146,699 - - (16,617) 5,096 135,178DMSA, AMSA 124,326 58,374 - 31 (2,376) 180,3557623704 Canada Inc. - 124,341 - (1) (4,824) 119,516AMCI (WA) Pty Ltd. 123,018 - - (6,283) (18,268) 98,467KOREA LNG LTD. 99,976 - (21,999) 21,898 (35,422) 64,453BX STEEL POSCO Cold RolledSheet Co., Ltd. 92,888 - - 2,400 1,021 96,309KOBRASCO 113,847 - (26,482) 21,948 (14,080) 95,233AES-VCM Mong Duong Power Company Limited 48,636 - - (12,841) 45,641 81,436CAML Resources Pty. LTD. 62,227 - (12,428) 17,984 (23,963) 43,820NCR LLC 39,303 - - (9,609) 802 30,496
POSCHROME (PROPRIETARY) LIMITED 21,324 - (7,196) 2,943 (9,160) 7,911
Others 107,515 7,439 (5,252) (70,504) 69,477 108,6752,428,262 764,540 (89,545) (107,348) (143,435) 2,852,474
₩ 3,039,261 1,265,772 (117,230) (179,809) (199,301) 3,808,693
December 31, 2013Book value
POSCO PLANTEC Co., Ltd. (formerly, SUNGJIN GEOTEC Co., Ltd.)
December 31, 2012Book value
Acquisition DividendsShare of
profits (losses)Other increase(decrease) (*1)
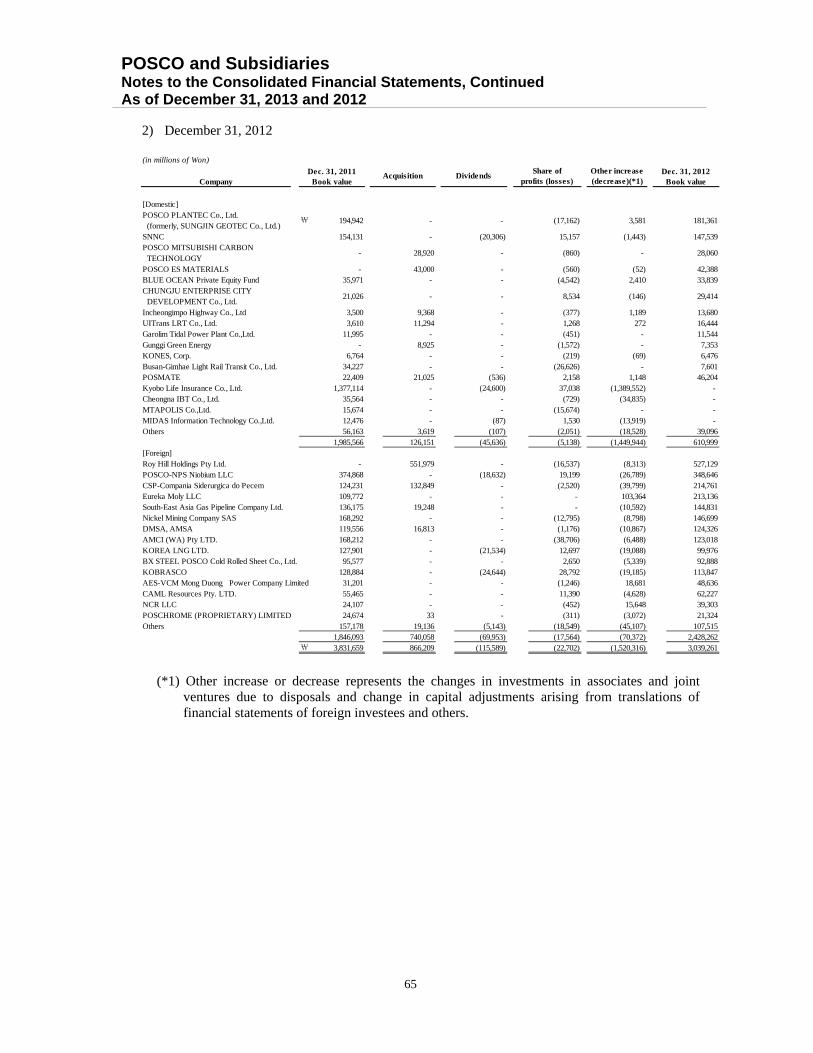
POSCO and Subsidiaries Notes to the Consolidated Financial Statements, Continued As of December 31, 2013 and 2012
65
2) December 31, 2012
(*1) Other increase or decrease represents the changes in investments in associates and joint ventures due to disposals and change in capital adjustments arising from translations of financial statements of foreign investees and others.
(in millions of Won)
Company
[Domestic]POSCO PLANTEC Co., Ltd. (formerly, SUNGJIN GEOTEC Co., Ltd.)
₩ 194,942 - - (17,162) 3,581 181,361
SNNC 154,131 - (20,306) 15,157 (1,443) 147,539POSCO MITSUBISHI CARBON TECHNOLOGY
- 28,920 - (860) - 28,060
POSCO ES MATERIALS - 43,000 - (560) (52) 42,388BLUE OCEAN Private Equity Fund 35,971 - - (4,542) 2,410 33,839CHUNGJU ENTERPRISE CITY DEVELOPMENT Co., Ltd.
21,026 - - 8,534 (146) 29,414
Incheongimpo Highway Co., Ltd 3,500 9,368 - (377) 1,189 13,680UITrans LRT Co., Ltd. 3,610 11,294 - 1,268 272 16,444Garolim Tidal Power Plant Co.,Ltd. 11,995 - - (451) - 11,544Gunggi Green Energy - 8,925 - (1,572) - 7,353KONES, Corp. 6,764 - - (219) (69) 6,476Busan-Gimhae Light Rail Transit Co., Ltd. 34,227 - - (26,626) - 7,601POSMATE 22,409 21,025 (536) 2,158 1,148 46,204Kyobo Life Insurance Co., Ltd. 1,377,114 - (24,600) 37,038 (1,389,552) - Cheongna IBT Co., Ltd. 35,564 - - (729) (34,835) - MTAPOLIS Co.,Ltd. 15,674 - - (15,674) - - MIDAS Information Technology Co.,Ltd. 12,476 - (87) 1,530 (13,919) - Others 56,163 3,619 (107) (2,051) (18,528) 39,096
1,985,566 126,151 (45,636) (5,138) (1,449,944) 610,999[Foreign]Roy Hill Holdings Pty Ltd. - 551,979 - (16,537) (8,313) 527,129POSCO-NPS Niobium LLC 374,868 - (18,632) 19,199 (26,789) 348,646CSP-Compania Siderurgica do Pecem 124,231 132,849 - (2,520) (39,799) 214,761Eureka Moly LLC 109,772 - - - 103,364 213,136South-East Asia Gas Pipeline Company Ltd. 136,175 19,248 - - (10,592) 144,831Nickel Mining Company SAS 168,292 - - (12,795) (8,798) 146,699DMSA, AMSA 119,556 16,813 - (1,176) (10,867) 124,326AMCI (WA) Pty LTD. 168,212 - - (38,706) (6,488) 123,018KOREA LNG LTD. 127,901 - (21,534) 12,697 (19,088) 99,976BX STEEL POSCO Cold Rolled Sheet Co., Ltd. 95,577 - - 2,650 (5,339) 92,888KOBRASCO 128,884 - (24,644) 28,792 (19,185) 113,847
AES-VCM Mong Duong Power Company Limited 31,201 - - (1,246) 18,681 48,636CAML Resources Pty. LTD. 55,465 - - 11,390 (4,628) 62,227NCR LLC 24,107 - - (452) 15,648 39,303POSCHROME (PROPRIETARY) LIMITED 24,674 33 - (311) (3,072) 21,324Others 157,178 19,136 (5,143) (18,549) (45,107) 107,515
1,846,093 740,058 (69,953) (17,564) (70,372) 2,428,262₩ 3,831,659 866,209 (115,589) (22,702) (1,520,316) 3,039,261
Dec. 31, 2011Book value
Acquisition DividendsShare of
profits (losses)Other increase(decrease)(*1)
Dec. 31, 2012Book value
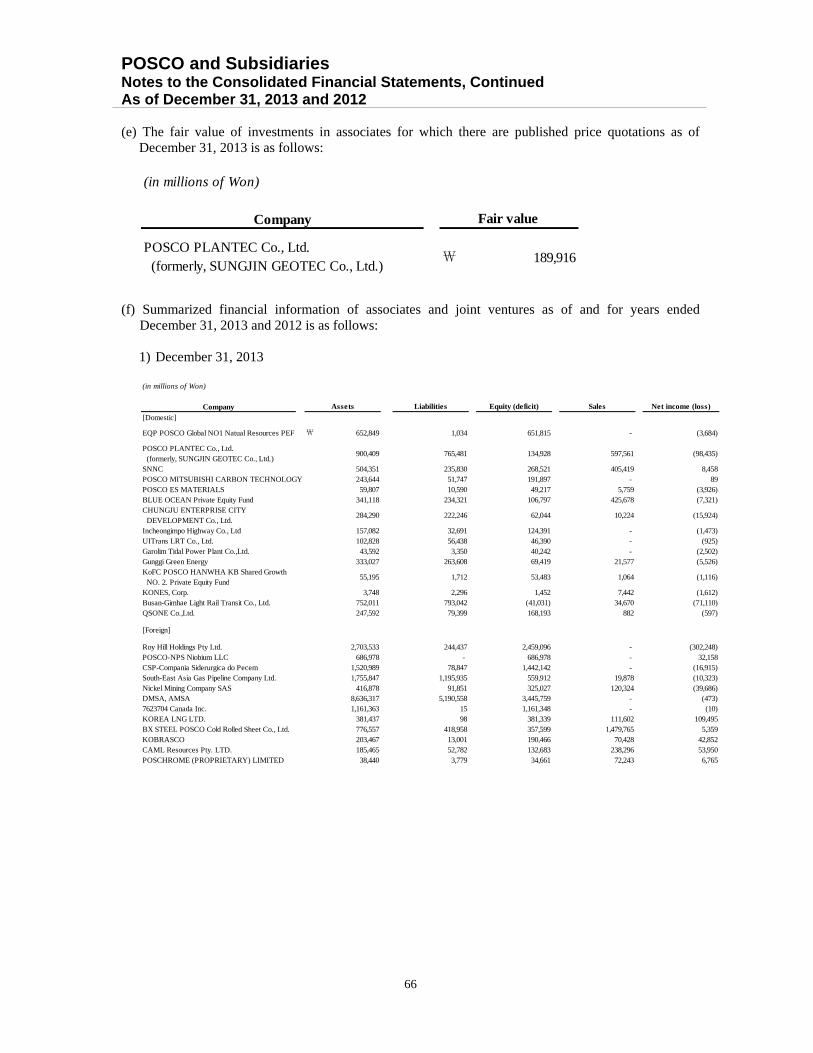
POSCO and Subsidiaries Notes to the Consolidated Financial Statements, Continued As of December 31, 2013 and 2012
66
(e) The fair value of investments in associates for which there are published price quotations as of
December 31, 2013 is as follows:
(f) Summarized financial information of associates and joint ventures as of and for years ended December 31, 2013 and 2012 is as follows:
1) December 31, 2013
(in millions of Won)
Company
₩ 189,916
Fair value
POSCO PLANTEC Co., Ltd. (formerly, SUNGJIN GEOTEC Co., Ltd.)
(in millions of Won)
Company
[Domestic]
EQP POSCO Global NO1 Natual Resources PEF ₩ 652,849 1,034 651,815 - (3,684)
900,409 765,481 134,928 597,561 (98,435)
SNNC 504,351 235,830 268,521 405,419 8,458POSCO MITSUBISHI CARBON TECHNOLOGY 243,644 51,747 191,897 - 89POSCO ES MATERIALS 59,807 10,590 49,217 5,759 (3,926)BLUE OCEAN Private Equity Fund 341,118 234,321 106,797 425,678 (7,321)CHUNGJU ENTERPRISE CITY DEVELOPMENT Co., Ltd.
284,290 222,246 62,044 10,224 (15,924)
Incheongimpo Highway Co., Ltd 157,082 32,691 124,391 - (1,473)UITrans LRT Co., Ltd. 102,828 56,438 46,390 - (925)Garolim Tidal Power Plant Co.,Ltd. 43,592 3,350 40,242 - (2,502)Gunggi Green Energy 333,027 263,608 69,419 21,577 (5,526)KoFC POSCO HANWHA KB Shared Growth NO. 2. Private Equity Fund
55,195 1,712 53,483 1,064 (1,116)
KONES, Corp. 3,748 2,296 1,452 7,442 (1,612)Busan-Gimhae Light Rail Transit Co., Ltd. 752,011 793,042 (41,031) 34,670 (71,110)QSONE Co.,Ltd. 247,592 79,399 168,193 882 (597)
[Foreign]
Roy Hill Holdings Pty Ltd. 2,703,533 244,437 2,459,096 - (302,248)POSCO-NPS Niobium LLC 686,978 - 686,978 - 32,158CSP-Compania Siderurgica do Pecem 1,520,989 78,847 1,442,142 - (16,915)South-East Asia Gas Pipeline Company Ltd. 1,755,847 1,195,935 559,912 19,878 (10,323)Nickel Mining Company SAS 416,878 91,851 325,027 120,324 (39,686)DMSA, AMSA 8,636,317 5,190,558 3,445,759 - (473)7623704 Canada Inc. 1,161,363 15 1,161,348 - (10)KOREA LNG LTD. 381,437 98 381,339 111,602 109,495BX STEEL POSCO Cold Rolled Sheet Co., Ltd. 776,557 418,958 357,599 1,479,765 5,359KOBRASCO 203,467 13,001 190,466 70,428 42,852CAML Resources Pty. LTD. 185,465 52,782 132,683 238,296 53,950POSCHROME (PROPRIETARY) LIMITED 38,440 3,779 34,661 72,243 6,765
Assets Sales Net income (loss)Equity (deficit)Liabilities
POSCO PLANTEC Co., Ltd. (formerly, SUNGJIN GEOTEC Co., Ltd.)

POSCO and Subsidiaries Notes to the Consolidated Financial Statements, Continued As of December 31, 2013 and 2012
67
2) December 31, 2012
12. Joint Operations Details of significant joint operations of the Company as of December 31, 2013 are as follows:
Company Net income (loss)
[Domestic]
POSCO PLANTEC Co., Ltd. (formerly, SUNGJIN GEOTEC Co., Ltd.)
763,581 632,999 130,582 703,236 (29,219)
SNNC 577,273 261,781 315,492 379,230 16,959POSCO MITSUBISHI CARBON TECHNOLOGY
47,014 247 46,767 - (1,433)
POSCO ES MATERIALS 69,287 16,067 53,220 - (1,422)BLUE OCEAN Private Equity Fund 347,298 224,338 122,960 429,210 (16,504)CHUNGJU ENTERPRISE CITY DEVELOPMENT Co., Ltd.
333,716 250,540 83,176 229,271 36,971
Incheongimpo Highway Co., Ltd 44,714 334 44,380 - (1,323)UITrans LRT Co., Ltd. 50,932 12,822 38,110 - (880)Garolim Tidal Power Plant Co.,Ltd. 37,476 1,546 35,930 - (1,404)Gunggi Green Energy 103,340 68,990 34,350 - (467)KONES, Corp. 6,739 3,627 3,112 8,274 (527)Busan-Gimhae Light Rail Transit Co., Ltd. 787,011 756,606 30,405 16,811 (106,668)POSMATE 118,077 14,580 103,497 104,705 9,587MTAPOLIS Co., Ltd. 521,942 512,720 9,222 21,063 (35,244)
[Foreign]Roy Hill Holdings Pty Ltd. 1,404,336 105,340 1,298,996 - (146,321)POSCO-NPS Niobium LLC 697,431 140 697,291 - 38,412CSP-Compania Siderurgica do Pecem 1,088,105 16,551 1,071,554 - (12,622)South-East Asia Gas Pipeline Company Ltd. 1,341,510 763,116 578,394 - - Nickel Mining Company SAS 445,344 91,266 354,078 120,224 (33,981)DMSA, AMSA 7,935,489 5,906,301 2,029,188 - (29,407)KOREA LNG LTD. 545,841 64 545,777 109,992 107,953BX STEEL POSCO Cold RolledSheet Co., Ltd. 922,932 579,140 343,792 1,506,012 2,296KOBRASCO 231,524 3,831 227,693 121,619 56,282CAML Resources Pty. LTD. 209,717 70,502 139,215 284,134 34,162POSCHROME (PROPRIETARY) LIMITED 53,900 3,582 50,318 89,962 (899)
Assets Liabilities Equity Sales
Ownership (% )
Myanmar A-1/A-3 mine Mine development 51.00 MyanmarOffshore midstream Mine development 51.00 MyanmarGleenhills mine Mine development 20.00 CanadaActos Anthracite coal project Mine development 20.00 CanadaMt. Thorley J/V Mine development 20.00 AustrailiaPOSMAC J/V Mine development 20.00 AustrailiaCD J/V Mine development 5.00 AustrailiaIntergra Coal J/V Mine development 5.95 AustrailiaRUM J/V Mine development 10.00 Austrailia
Jonint operations Operation Location
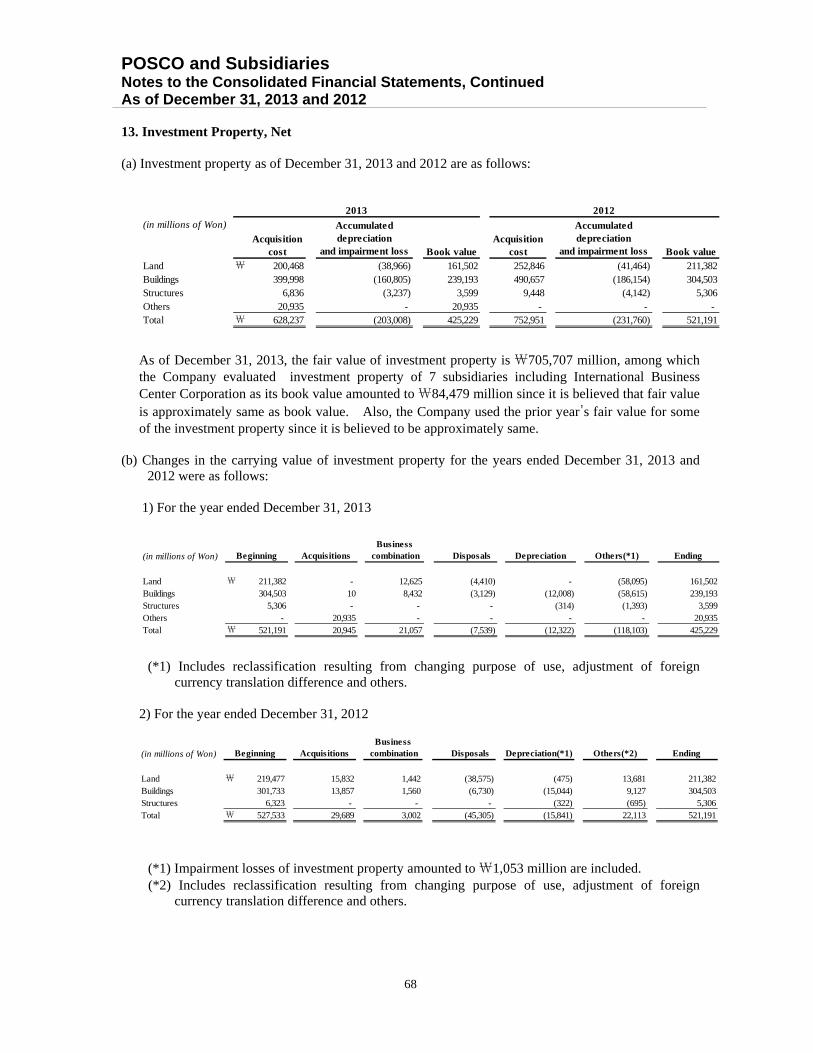
POSCO and Subsidiaries Notes to the Consolidated Financial Statements, Continued As of December 31, 2013 and 2012
68
13. Investment Property, Net (a) Investment property as of December 31, 2013 and 2012 are as follows:
As of December 31, 2013, the fair value of investment property is ₩705,707 million, among which the Company evaluated investment property of 7 subsidiaries including International Business Center Corporation as its book value amounted to ₩84,479 million since it is believed that fair value is approximately same as book value. Also, the Company used the prior year’s fair value for some of the investment property since it is believed to be approximately same.
(b) Changes in the carrying value of investment property for the years ended December 31, 2013 and
2012 were as follows:
1) For the year ended December 31, 2013
(*1) Includes reclassification resulting from changing purpose of use, adjustment of foreign currency translation difference and others.
2) For the year ended December 31, 2012
(*1) Impairment losses of investment property amounted to ₩1,053 million are included. (*2) Includes reclassification resulting from changing purpose of use, adjustment of foreign
currency translation difference and others.
(in millions of Won)
Acquisitioncost
Accumulateddepreciation
and impairment loss Book valueAcquisition
cost
Accumulateddepreciation
and impairment loss Book valueLand ₩ 200,468 (38,966) 161,502 252,846 (41,464) 211,382Buildings 399,998 (160,805) 239,193 490,657 (186,154) 304,503Structures 6,836 (3,237) 3,599 9,448 (4,142) 5,306Others 20,935 - 20,935 - - - Total ₩ 628,237 (203,008) 425,229 752,951 (231,760) 521,191
2013 2012
(in millions of Won) Disposals
Land ₩ 211,382 - 12,625 (4,410) - (58,095) 161,502Buildings 304,503 10 8,432 (3,129) (12,008) (58,615) 239,193Structures 5,306 - - - (314) (1,393) 3,599Others - 20,935 - - - - 20,935Total ₩ 521,191 20,945 21,057 (7,539) (12,322) (118,103) 425,229
Beginning AcquisitionsBusiness
combination Depreciation Others(*1) Ending
(in millions of Won) Disposals
Land ₩ 219,477 15,832 1,442 (38,575) (475) 13,681 211,382Buildings 301,733 13,857 1,560 (6,730) (15,044) 9,127 304,503Structures 6,323 - - - (322) (695) 5,306Total ₩ 527,533 29,689 3,002 (45,305) (15,841) 22,113 521,191
EndingBeginning AcquisitionsBusiness
combination Depreciation(*1) Others(*2)
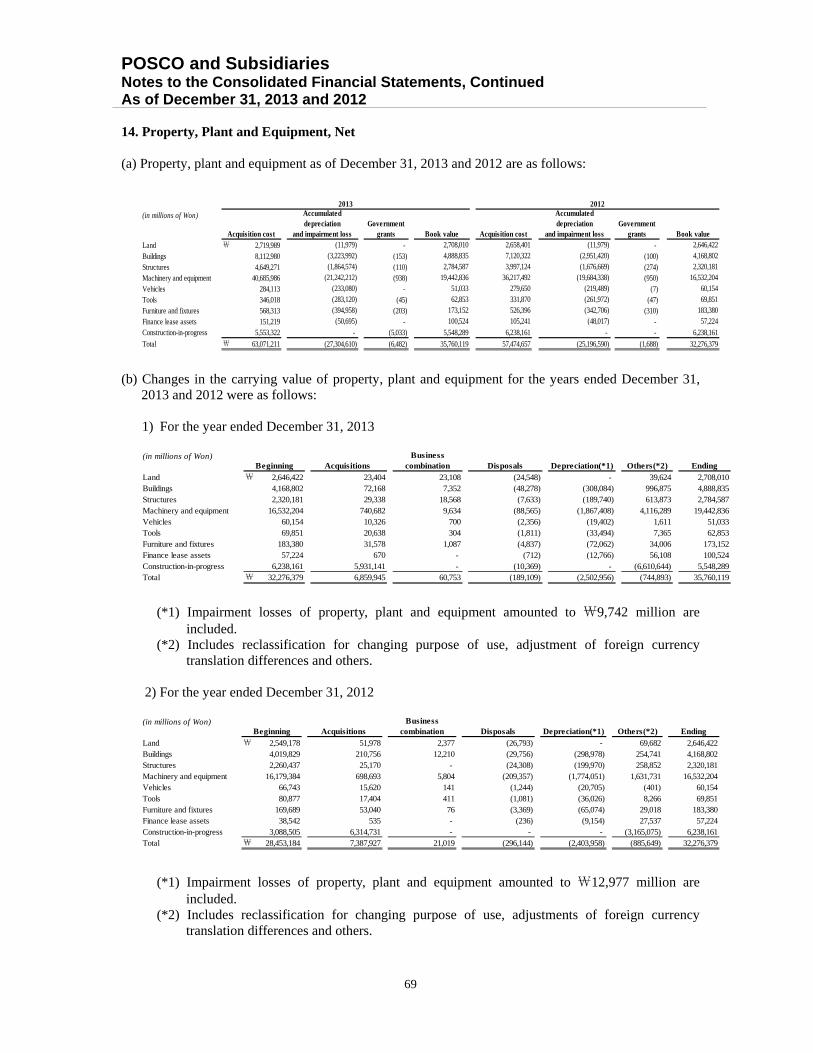
POSCO and Subsidiaries Notes to the Consolidated Financial Statements, Continued As of December 31, 2013 and 2012
69
14. Property, Plant and Equipment, Net (a) Property, plant and equipment as of December 31, 2013 and 2012 are as follows:
(b) Changes in the carrying value of property, plant and equipment for the years ended December 31,
2013 and 2012 were as follows:
1) For the year ended December 31, 2013
(*1) Impairment losses of property, plant and equipment amounted to ₩9,742 million are included.
(*2) Includes reclassification for changing purpose of use, adjustment of foreign currency translation differences and others.
2) For the year ended December 31, 2012
(*1) Impairment losses of property, plant and equipment amounted to ₩12,977 million are
included. (*2) Includes reclassification for changing purpose of use, adjustments of foreign currency
translation differences and others.
(in millions of Won)Government
grantsGovernment
grantsLand ₩ 2,719,989 - - Buildings 8,112,980 (153) (100)Structures 4,649,271 (110) (274)Machinery and equipment 40,685,986 (938) (950)Vehicles 284,113 - (7)Tools 346,018 (45) (47)Furniture and fixtures 568,313 (203) (310)Finance lease assets 151,219 - - Construction-in-progress 5,553,322 (5,033) -
Total ₩ 63,071,211 (6,482) (1,688) 32,276,379
(50,695) 100,524 105,241 (48,017) 57,224
- 5,548,289 6,238,161 - 6,238,161
(27,304,610) 35,760,119 57,474,657 (25,196,590)
(283,120) 62,853 331,870 (261,972) 69,851(394,958) 173,152 526,396 (342,706) 183,380
(21,242,212) 19,442,836 36,217,492 (19,684,338) 16,532,204(233,080) 51,033 279,650 (219,489) 60,154
2,646,422
(1,864,574) 2,784,587 3,997,124 (1,676,669) 2,320,181(3,223,992) 4,888,835 7,120,322 (2,951,420) 4,168,802
2013 2012
Acquisition cost
Accumulateddepreciation
and impairment loss Book value Acquisition cost
Accumulateddepreciation
and impairment loss Book value(11,979) 2,708,010 2,658,401 (11,979)
(in millions of Won)
Land ₩ 2,646,422 23,404 23,108 (24,548) - 39,624 2,708,010Buildings 4,168,802 72,168 7,352 (48,278) (308,084) 996,875 4,888,835Structures 2,320,181 29,338 18,568 (7,633) (189,740) 613,873 2,784,587Machinery and equipment 16,532,204 740,682 9,634 (88,565) (1,867,408) 4,116,289 19,442,836Vehicles 60,154 10,326 700 (2,356) (19,402) 1,611 51,033Tools 69,851 20,638 304 (1,811) (33,494) 7,365 62,853Furniture and fixtures 183,380 31,578 1,087 (4,837) (72,062) 34,006 173,152Finance lease assets 57,224 670 - (712) (12,766) 56,108 100,524Construction-in-progress 6,238,161 5,931,141 - (10,369) - (6,610,644) 5,548,289Total ₩ 32,276,379 6,859,945 60,753 (189,109) (2,502,956) (744,893) 35,760,119
Beginning Acquisitions Business
combination Disposals Depreciation(*1) Others(*2) Ending
(in millions of Won)
Land ₩ 2,549,178 51,978 2,377 (26,793) - 69,682 2,646,422Buildings 4,019,829 210,756 12,210 (29,756) (298,978) 254,741 4,168,802Structures 2,260,437 25,170 - (24,308) (199,970) 258,852 2,320,181Machinery and equipment 16,179,384 698,693 5,804 (209,357) (1,774,051) 1,631,731 16,532,204Vehicles 66,743 15,620 141 (1,244) (20,705) (401) 60,154Tools 80,877 17,404 411 (1,081) (36,026) 8,266 69,851Furniture and fixtures 169,689 53,040 76 (3,369) (65,074) 29,018 183,380Finance lease assets 38,542 535 - (236) (9,154) 27,537 57,224Construction-in-progress 3,088,505 6,314,731 - - - (3,165,075) 6,238,161Total ₩ 28,453,184 7,387,927 21,019 (296,144) (2,403,958) (885,649) 32,276,379
Beginning Acquisitions EndingBusiness
combination Disposals Depreciation(*1) Others(*2)

POSCO and Subsidiaries Notes to the Consolidated Financial Statements, Continued As of December 31, 2013 and 2012
70
(c) Borrowing costs capitalized and the capitalized interest rate for the years ended December 31, 2013
and 2012 were as follows:
(d) Property, plant and equipment and investment property pledged as collateral as of December 31,
2013 and 2012 are as follows:
(*1) Investment property is included.
15. Goodwill and Other Intangible Assets, Net (a) Goodwill and other intangible assets as of December 31, 2013 and 2012 are as follows:
(2) The changes in carrying value of goodwill and other intangible assets for the years ended December
31, 2013 and 2012 were as follows:
1) For the year ended December 31, 2013
(in millions of Won)
Weighted average expenditure ₩ 6,442,564Borrowing costs capitalized 290,117Capitalization rate 4.50%
101,7943.25%
2013 20123,131,866
(in millions of Won)
Land(*1) Korean Development Bank and others ₩ 767,004 545,654
Buildings and structures(*1) Korean Development Bank and others 1,112,855 327,757
Machinery and equipment Korean Development Bank and others 3,343,747 1,285,452
Tools Korean Development Bank 7,300 -
Construction-in-progress The Export-Import Bank of Korea 382,339 1,486,745₩ 5,613,245 3,645,608
Collateral right holder 2013 2012
(in millions of Won)Government
grantsGovernment
grants
Goodwill ₩ 1,741,562 - - Intellectual property rights 1,551,898 (1,013) (1,154)Premium in rental 148,295 - - Development expense 158,228 (1,346) (1,558)Port facilities usage rights 504,331 - - Exploratation and evaluation assets 389,601 - - Mining development assets 968,191 - - Customer relationships 856,308 - - Other intangible assets 843,705 (1) (3)
Total ₩ 7,162,119 (2,360) (2,715)(1,229,919) 5,929,840 6,679,003 (1,013,927) 5,662,361
(163,428) 692,880 862,217 (111,485) 750,732
(384,960) 458,744 921,277 (403,302) 517,972
(29,853) 359,748 509,581 (29,853) 479,728- 968,191 1,643,306 - 1,643,306
(95,780) 61,102 127,856 (65,367) 60,931(337,220) 167,111 410,023 (326,901) 83,122
(22,188) 1,713,691
(17,028) 131,267 151,116 (13,383) 137,733(76,026) 1,474,859 317,748 (41,448) 275,146
2013 2012
Acquisition cost
Accumulateddepreciation and
accumulated Book value Acquisition cost
Accumulateddepreciation and
accumulated Book value(125,624) 1,615,938 1,735,879
(in millions of Won)Business
combination Others(*3)
Goodwill(*1) ₩ 1,713,691 - 2,668 - - (103,436) 3,015 1,615,938Intellectual property rights 275,146 54,182 - (291) (35,532) (10,313) 1,191,667 1,474,859Premium in rental(*2) 137,733 4,089 1,605 (4,382) (211) (4,457) (3,110) 131,267Development expense 60,931 13,717 2,032 - (23,166) (5,675) 13,263 61,102Port facilities usage rights 83,122 - - - (10,318) - 94,307 167,111Exploratation and evaluation assets 479,728 4,669 - - - - (124,649) 359,748Mining development assets 1,643,306 289,016 - - - - (964,131) 968,191Customer relationships 750,732 - - - (51,944) - (5,908) 692,880Other intangible assets 517,971 211,627 684 (1,102) (58,843) (1,435) (210,158) 458,744
₩ 5,662,360 577,300 6,989 (5,775) (5,704) 5,929,840
Increase Decrease
Beginning Acquisitions Amortization Impairment lossDisposals Ending
(180,014) (125,316)
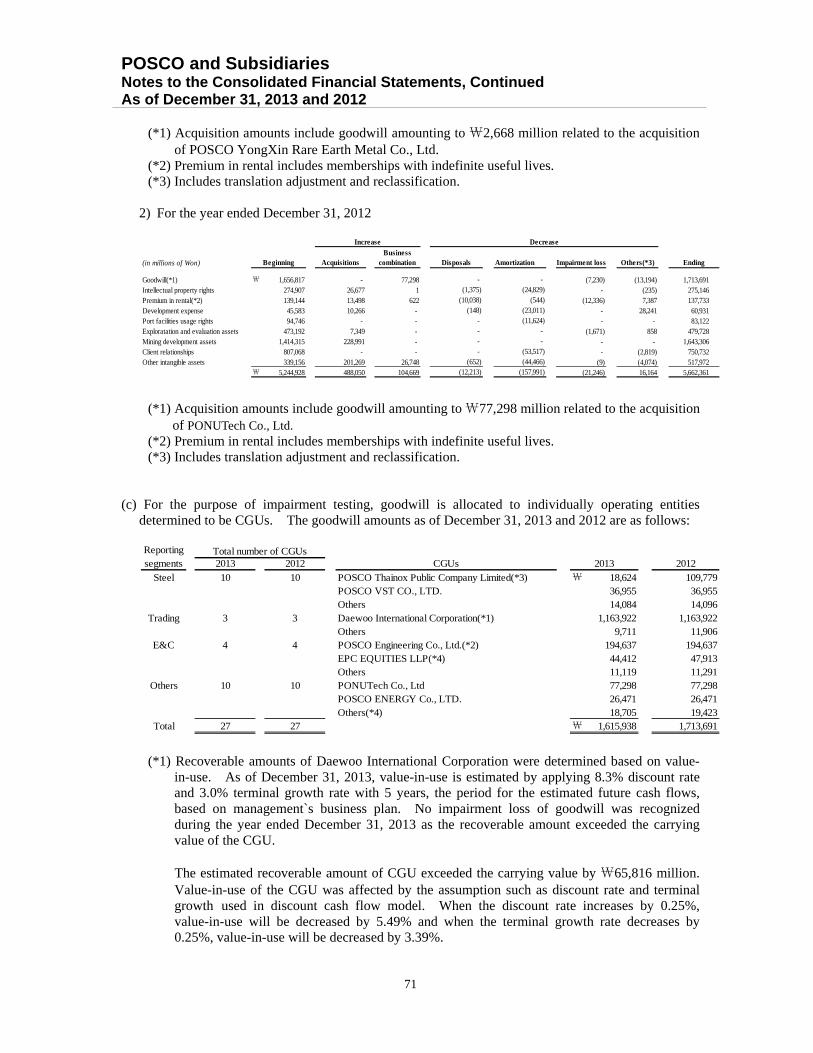
POSCO and Subsidiaries Notes to the Consolidated Financial Statements, Continued As of December 31, 2013 and 2012
71
(*1) Acquisition amounts include goodwill amounting to ₩2,668 million related to the acquisition
of POSCO YongXin Rare Earth Metal Co., Ltd. (*2) Premium in rental includes memberships with indefinite useful lives. (*3) Includes translation adjustment and reclassification.
2) For the year ended December 31, 2012
(*1) Acquisition amounts include goodwill amounting to ₩77,298 million related to the acquisition of PONUTech Co., Ltd.
(*2) Premium in rental includes memberships with indefinite useful lives. (*3) Includes translation adjustment and reclassification.
(c) For the purpose of impairment testing, goodwill is allocated to individually operating entities
determined to be CGUs. The goodwill amounts as of December 31, 2013 and 2012 are as follows:
(*1) Recoverable amounts of Daewoo International Corporation were determined based on value-in-use. As of December 31, 2013, value-in-use is estimated by applying 8.3% discount rate and 3.0% terminal growth rate with 5 years, the period for the estimated future cash flows, based on management`s business plan. No impairment loss of goodwill was recognized during the year ended December 31, 2013 as the recoverable amount exceeded the carrying value of the CGU. The estimated recoverable amount of CGU exceeded the carrying value by ₩65,816 million. Value-in-use of the CGU was affected by the assumption such as discount rate and terminal growth used in discount cash flow model. When the discount rate increases by 0.25%, value-in-use will be decreased by 5.49% and when the terminal growth rate decreases by 0.25%, value-in-use will be decreased by 3.39%.
(in millions of Won)Business
combination Amortization Impairment loss Others(*3)
Goodwill(*1) ₩ 1,656,817 - 77,298 (7,230) (13,194) 1,713,691Intellectual property rights 274,907 26,677 1 - (235) 275,146Premium in rental(*2) 139,144 13,498 622 (12,336) 7,387 137,733Development expense 45,583 10,266 - - 28,241 60,931Port facilities usage rights 94,746 - - - - 83,122Exploratation and evaluation assets 473,192 7,349 - (1,671) 858 479,728Mining development assets 1,414,315 228,991 - - - 1,643,306Client relationships 807,068 - - - (2,819) 750,732Other intangible assets 339,156 201,269 26,748 (9) (4,074) 517,972
₩ 5,244,928 488,050 104,669 (21,246) 16,164 5,662,361
Increase Decrease
Beginning Acquisitions Disposals Ending
- (1,375)
- (24,829)
(10,038)(148)
-
(544)(23,011)(11,624)
-
(12,213)
- -
(652)
- -
(53,517)(44,466)
(157,991)
2013 2012 CGUs
Steel 10 10 POSCO Thainox Public Company Limited(*3) ₩ 18,624 109,779POSCO VST CO., LTD. 36,955 36,955Others 14,084 14,096
Trading 3 3 Daewoo International Corporation(*1) 1,163,922 1,163,922Others 9,711 11,906
E&C 4 4 POSCO Engineering Co., Ltd.(*2) 194,637 194,637EPC EQUITIES LLP(*4) 44,412 47,913Others 11,119 11,291
Others 10 10 PONUTech Co., Ltd 77,298 77,298POSCO ENERGY Co., LTD. 26,471 26,471Others(*4) 18,705 19,423
Total 27 27 ₩ 1,615,938 1,713,691
2013 2012Total number of CGUsReporting
segments

POSCO and Subsidiaries Notes to the Consolidated Financial Statements, Continued As of December 31, 2013 and 2012
72
Management believes that any reasonably possible change in the key assumptions on which the recoverable amount is based would cause a change in impairment loss of goodwill.
(*2) Recoverable amounts of POSCO Engineering Company were determined based on value-in-
use. As of December 31, 2013, value-in-use is estimated by applying 12.3% discount rate and 1% terminal growth rate with 5 years. The estimated future cash flows based on management’s business plan. No impairment loss of goodwill was recognized during the year ended December 31, 2013 as the recoverable amount exceeded the carrying value of the CGU.
The estimated recoverable amounts of CGU exceeded the carrying value by ₩288,906 million.
Value-in-use of the CGU was affected by the assumption such as discount rate and terminal growth used in discount cash flow model. When the discount rate increases by 0.25%, value-in-use will be decreased by 2.69% and when the terminal growth rate decreases by 0.25%, value-in-use will be decreased by 1.84%. The change has no effect on the impairment loss of the goodwill.
Management believes that any reasonably possible change in the key assumptions on which
the recoverable amount is based would not cause the aggregate carrying amount to exceed the aggregate recoverable amount of the CGU.
(*3) Recoverable amounts of POSCO-Thainox Public Company Limited were determined based on
fair value less cost to sell, which was calculated by adding a 28.8% control premium to the current stock price as of December 31, 2013.
The Company recognized goodwill impairment loss of ₩97,245 million as the carrying value
of the CGU was higher than its recoverable amount as of December 31, 2013. (*4) The Company recognized goodwill impairment loss of ₩6,191 million as the carrying values
of the EPC EQUITIES LLP and other subsidiaries were higher than recoverable amounts as of December 31, 2013.
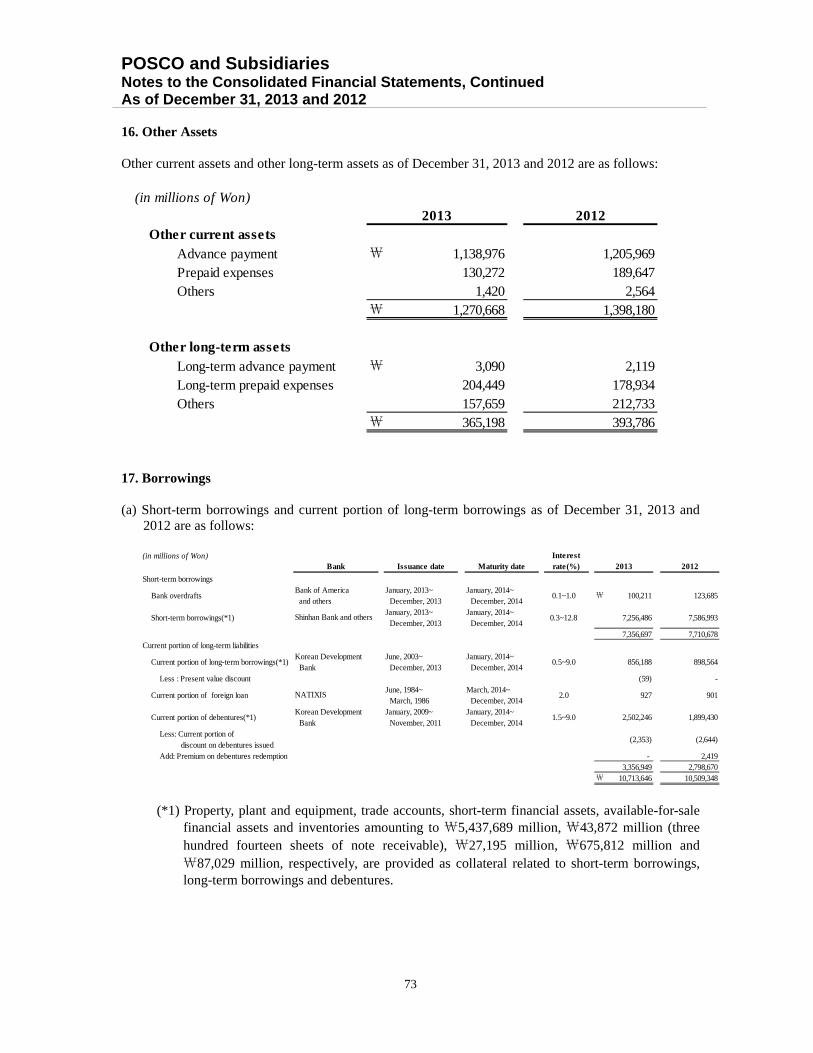
POSCO and Subsidiaries Notes to the Consolidated Financial Statements, Continued As of December 31, 2013 and 2012
73
16. Other Assets Other current assets and other long-term assets as of December 31, 2013 and 2012 are as follows:
17. Borrowings (a) Short-term borrowings and current portion of long-term borrowings as of December 31, 2013 and
2012 are as follows:
(*1) Property, plant and equipment, trade accounts, short-term financial assets, available-for-sale financial assets and inventories amounting to ₩5,437,689 million, ₩43,872 million (three hundred fourteen sheets of note receivable), ₩27,195 million, ₩675,812 million and ₩87,029 million, respectively, are provided as collateral related to short-term borrowings, long-term borrowings and debentures.
(in millions of Won)
Other current assetsAdvance payment ₩ 1,138,976 1,205,969Prepaid expenses 130,272 189,647Others 1,420 2,564
₩ 1,270,668 1,398,180
Other long-term assetsLong-term advance payment ₩ 3,090 2,119Long-term prepaid expenses 204,449 178,934Others 157,659 212,733
₩ 365,198 393,786
2013 2012
(in millions of Won)Issuance date Maturity date
Short-term borrowings
Bank overdrafts January, 2013~ December, 2013
January, 2014~ December, 2014
0.1~1.0 ₩ 100,211 123,685
Short-term borrowings(*1)January, 2013~ December, 2013
January, 2014~ December, 2014
0.3~12.8 7,256,486 7,586,993
7,356,697 7,710,678Current portion of long-term liabilities
Current portion of long-term borrowings(*1)June, 2003~ December, 2013
January, 2014~ December, 2014
0.5~9.0 856,188 898,564
Less : Present value discount (59) -
Current portion of foreign loan June, 1984~ March, 1986
March, 2014~ December, 2014
2.0 927 901
Current portion of debentures(*1)January, 2009~ November, 2011
January, 2014~ December, 2014
1.5~9.0 2,502,246 1,899,430
Less: Current portion of discount on debentures issued
(2,353) (2,644)
Add: Premium on debentures redemption - 2,4193,356,949 2,798,670
₩ 10,713,646 10,509,348
Bank of America and others
Shinhan Bank and others
NATIXIS
Korean Development Bank
Korean Development Bank
Bank 2013 2012Interestrate(%)

POSCO and Subsidiaries Notes to the Consolidated Financial Statements, Continued As of December 31, 2013 and 2012
74
(b) Long-term borrowings, excluding current portion as of December 31, 2013 and December 31, 2012
are as follows:
(*1) Property, plant and equipment, trade accounts, short-term financial assets, available-for-sale
financial assets and inventories amounting to ₩5,437,689 million, ₩43,872 million(three hundred fourteen sheets of note receivable), ₩27,195 million, ₩675,812 million and ₩87,029 million, respectively, are provided as collateral related to short-term borrowings, long-term borrowings and debentures.
(*2) Korea Development Bank has provided guarantees related to the foreign loan. (*3) POSCO issued exchangeable bonds with SK Telecom Co., Ltd. ADRs through Zeus (Cayman)
Ltd. August 2011. The Company accounted for these exchangeable bonds as long-term borrowings. The Company also provides guarantees for Zeus (Cayman) Ltd.
18. Other Payables Other payables as of December 31, 2013 and 2012 are as follows:
During the year ended December 31, 2012, a fine of ₩117,629 million was imposed on POSCO and POSCO Coated & Color Steel Co., Ltd. for price fixing galvanized steel sheets as a result of Korea Fair Trade Commission’s investigation. The Company made a payment for the fine in the first half of 2013.
(in millions of Won)Issuance date Maturity date
Long-term borrowings(*1)January, 1983~ December, 2013
February, 2015~ December, 2099
0.5~11.2 ₩ 7,017,532 5,161,711
Less : Present value discount (43,897) (44,293)Foreign loan(*2) March, 1986 March, 2017 2.0 1,140 2,009
Bonds(*1,3)August, 2006~ December, 2013
February, 2015~ December, 2021
0.0~6.3 8,590,965 9,339,966
Less: Discount on debentures issued (45,372) (62,943) Add: Premium on debentures redemption 12,591 15,635
₩ 15,532,959 14,412,085
rate(%)
NATIXIS
Korean Development Bank
Bank 2013 2012
Korean Development Bank
Interest
(in millions of Won)2012
CurrentAccounts payable ₩ 914,288 737,802Accrued expenses 873,613 868,015Dividend payable 11,709 7,487Finance lease liabilities 14,218 16,044Withholding 315,026 205,556
₩ 2,128,854 1,834,904
Non-currentAccounts payable ₩ 116,160 117,462Accrued expenses 25,358 24,950Finance lease liabilities 39,257 32,961Long-term withholding 25,859 68,549
₩ 206,634 243,922
2013

POSCO and Subsidiaries Notes to the Consolidated Financial Statements, Continued As of December 31, 2013 and 2012
75
19. Other Financial Liabilities Other financial liabilities as of December 31, 2013 and 2012 are as follows:
20. Provisions (a) Provisions as of December 31, 2013 and 2012 are as follows:
(*1) As of December 31, 2013 and 2012, the amount includes a provision of ₩23,300 million and ₩23,784 million, respectively, for potential claims in connection with the spin-off of the trading division of Daewoo International Corporation in 2000 (Note 39). In addition, a provision of ₩7,030 million and ₩7,136 million are included as of December 31, 2013 and 2012, respectively, for a payment guarantee related to borrowings incurred in the disposition of Daewoo Cement (Shandong) Co., Ltd. during the year ended December 31, 2012.
(*2) As of December 31, 2013, the amount includes a provision of ₩74,888 million for expected outflows of resources in connection with the subrogation and financial joint guarantee for the construction projects of POSCO ENGINEERING & CONSTRUCTION Co., LTD..
(b) The following are the key assumptions concerning the future and other key sources of estimation uncertainties at the end of the reporting period.
(in millions of Won)
CurrentDerivatives liabilities ₩ 128,370 84,922Financial guarantee liabilities 7,534 7,819
₩ 135,904 92,741Non-current
Derivatives liabilities ₩ 229,096 100,220Financial guarantee liabilities 30,925 17,493
₩ 260,021 117,713
2013 2012
(in millions of Won)
Provision for bonus payments ₩ 52,377 - 42,904 - Provision for construction warranties 35,027 20,669 23,489 27,227Provision for legal contingencies and claims(*1) - 30,330 - 30,920Others(*2) 19,925 95,273 11,438 41,951
₩ 107,329 146,272 77,831 100,098
2013
Current Non-current Current Non-current
2012
Provision for bonus payments Estimations based on financial performanceProvision for construction warranties Estimations based on historical warranty dataProvision for legal contingencies and claims Estimations based on the degree of probability of an unfavorable outcome
and the ability to make a sufficient reliable estimate of the amount of loss
Key assumptions for the estimation
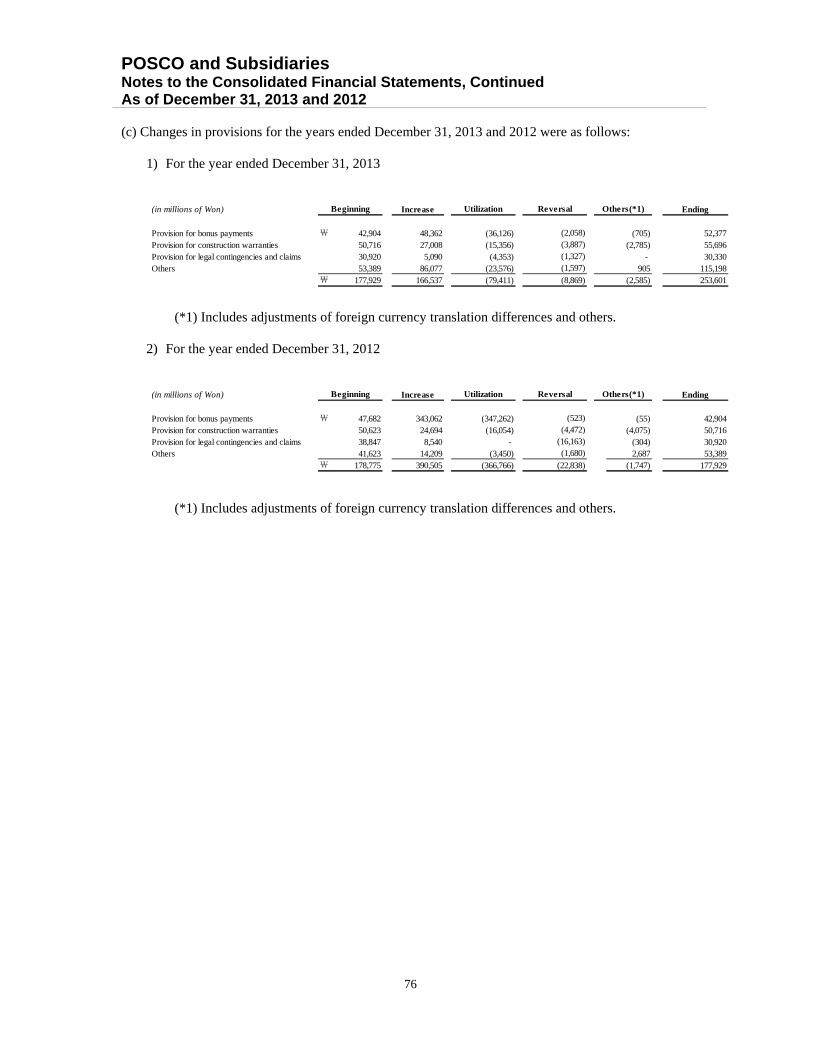
POSCO and Subsidiaries Notes to the Consolidated Financial Statements, Continued As of December 31, 2013 and 2012
76
(c) Changes in provisions for the years ended December 31, 2013 and 2012 were as follows:
1) For the year ended December 31, 2013
(*1) Includes adjustments of foreign currency translation differences and others.
2) For the year ended December 31, 2012
(*1) Includes adjustments of foreign currency translation differences and others.
(in millions of Won) Increase Ending
Provision for bonus payments ₩ 42,904 48,362 (36,126) (705) 52,377Provision for construction warranties 50,716 27,008 (15,356) (2,785) 55,696Provision for legal contingencies and claims 30,920 5,090 (4,353) - 30,330Others 53,389 86,077 (23,576) 905 115,198
₩ 177,929 166,537 (79,411) (2,585) 253,601
Beginning Utilization Others(*1)Reversal
(8,869)
(2,058)(3,887)(1,327)(1,597)
(in millions of Won) Increase Ending
Provision for bonus payments ₩ 47,682 343,062 (347,262) (55) 42,904Provision for construction warranties 50,623 24,694 (16,054) (4,075) 50,716Provision for legal contingencies and claims 38,847 8,540 - (304) 30,920Others 41,623 14,209 (3,450) 2,687 53,389
₩ 178,775 390,505 (366,766) (1,747) 177,929
Beginning Utilization
(523)(4,472)
(16,163)(1,680)
(22,838)
Others(*1)Reversal
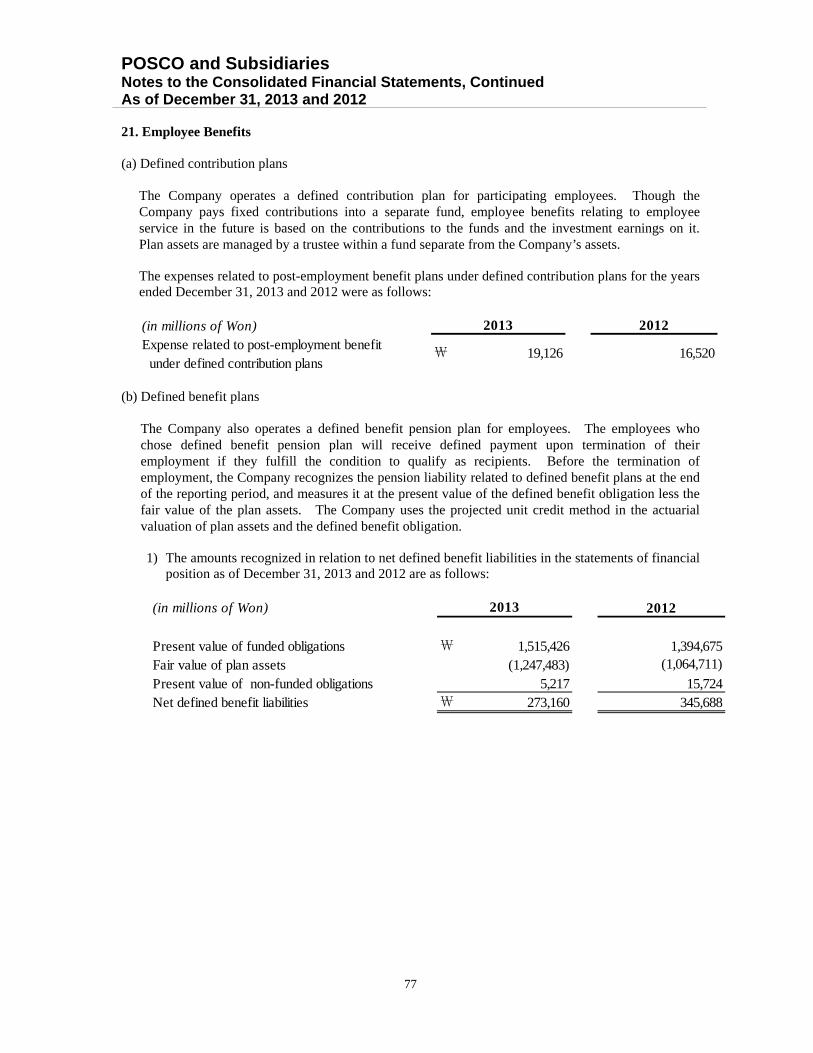
POSCO and Subsidiaries Notes to the Consolidated Financial Statements, Continued As of December 31, 2013 and 2012
77
21. Employee Benefits (a) Defined contribution plans
The Company operates a defined contribution plan for participating employees. Though the Company pays fixed contributions into a separate fund, employee benefits relating to employee service in the future is based on the contributions to the funds and the investment earnings on it. Plan assets are managed by a trustee within a fund separate from the Company’s assets.
The expenses related to post-employment benefit plans under defined contribution plans for the years ended December 31, 2013 and 2012 were as follows:
(b) Defined benefit plans
The Company also operates a defined benefit pension plan for employees. The employees who chose defined benefit pension plan will receive defined payment upon termination of their employment if they fulfill the condition to qualify as recipients. Before the termination of employment, the Company recognizes the pension liability related to defined benefit plans at the end of the reporting period, and measures it at the present value of the defined benefit obligation less the fair value of the plan assets. The Company uses the projected unit credit method in the actuarial valuation of plan assets and the defined benefit obligation.
1) The amounts recognized in relation to net defined benefit liabilities in the statements of financial
position as of December 31, 2013 and 2012 are as follows:
(in millions of Won) 2012Expense related to post-employment benefit under defined contribution plans
2013
16,520₩ 19,126
(in millions of Won) 2012
Present value of funded obligations ₩ 1,515,426 1,394,675Fair value of plan assets (1,247,483)Present value of non-funded obligations 5,217 15,724Net defined benefit liabilities ₩ 273,160 345,688
2013
(1,064,711)

POSCO and Subsidiaries Notes to the Consolidated Financial Statements, Continued As of December 31, 2013 and 2012
78
2) Changes in present value of defined benefit obligations for the years ended December 31, 2013
and 2012 were as follows:
3) Changes in fair value of plan assets for the years ended December 31, 2013 and 2012 were as follows:
(*1) The Company expects to make a contribution of ₩254,771 million to the defined benefit plan assets in 2014.
4) The fair value of plan assets as of December 31, 2013 and 2012 are as follows:
(in millions of Won) 2012
Defined benefit obligation at the beginning of period ₩ 1,410,399 1,173,238Current service costs 238,386 212,450Interest costs 47,039 51,351Remeasurements: (12,615) 83,050 - Gain from change in demograhpic assumptions (5,624) (7,842) - Loss from change in financial assumptions 7,667 85,483 - Others (14,658) 5,409Business combinations 11,379 1,684Benefits paid (129,038) (116,846)Others (44,907) 5,472Defined benefit obligation at the end of period ₩ 1,520,643 1,410,399
2013
(in millions of Won) 2012
Fair value of plan assets at the beginning of period ₩ 1,064,711 832,771Interest on plan assets 37,677Remeasurement of plan assets (1,482)Contributions to plan assets(*1) 254,771Business combinations 9,372Others (34,942)Benefits paid (82,624) (75,723)Fair value of plan assets at the end of period ₩ 1,247,483 1,064,711
2013
2,157267,420
906(489)
37,669
(in millions of Won) 2012
Equity instruments ₩ 35,364 12,002Debt instruments 98,686Deposits 958,509Others 154,924 201,522
₩ 1,247,483 1,064,711
107,303743,884
2013

POSCO and Subsidiaries Notes to the Consolidated Financial Statements, Continued As of December 31, 2013 and 2012
79
5) The amounts recognized in consolidated statements of comprehensive income for the years
ended December 31, 2013 and 2012 were as follows:
(*1)The actual return on plan assets amounted to ₩36,195 million and ₩39,826 million for the years ended December 31, 2013 and 2012, respectively.
The above expenses by function were as follows :
6) Accumulated actuarial gains (losses), net of tax recognized in other comprehensive income for the years ended December 31, 2013 and 2012 were as follows:
7) The principal actuarial assumptions as of December 31, 2013 and 2012 are as follows:
(*1) Discount rate is the yield at the end of the reporting period on high quality corporate bonds that have maturity dates approximating the terms of benefits obligations and that are denominated in the same currency in which the benefits are expected to be paid.
(*2) The expected future increase in salaries is based on the average salary increase rate for past three- years.
(in millions of Won)2012
Current service costs ₩ 238,386 212,450Net interest costs(*1) 9,362 13,682
₩ 247,748 226,132
2013
(in millions of Won) 2012
Cost of sales ₩ 180,090 164,763Selling and administrative expenses 66,327 60,457Others 1,331 912
₩ 247,748 226,132
2013
(in millions of Won) 2012
Beginning ₩ (245,229) (182,702)Current actuarial gains (losses) 6,224 (62,527)Ending ₩ (239,005) (245,229)
2013
(%) 2012
Discount rate(*1) 3.47~4.91 3.29~4.46Expected future increase in salaries(*2) 1.07~5.75 1.04~6.72
2013

POSCO and Subsidiaries Notes to the Consolidated Financial Statements, Continued As of December 31, 2013 and 2012
80
All assumptions are reviewed at the end of the reporting period. Additionally, the total estimated defined benefit obligation includes actuarial assumptions associated with the long-term characteristics of the defined benefit plan.
8) Reasonably possible changes at the reporting date to one of the relevant actuarial assumptions, holding other assumptions constant, would have affected the defined benefit obligation by the amounts shown below:
9) As of December 31, 2013 the maturity of the expected benefit payments are as follows:
The maturity analysis of the defined benefit obligation were nominal amounts of defined benefit obligations using expected remaining working lives of employees.
22. Other Liabilities Other liabilities as of December 31, 2013 and 2012 are as follows:
(*1) Includes other current liabilities amounting to ₩261,855 million, ₩274,490 million and other long-term liabilities amounting to ₩8,935 million and ₩14,939 million as of December 31, 2013 and 2012, respectively, due to proportionate consolidation of joint ventures which are owned by POSCO’s subsidiaries.
(in millions of Won)
Percentage(%) Percentage(%)
Discount rate ₩ (102,996) (6.8) ₩ 114,323 7.5
Expected future increases in salaries 112,291 7.4 (101,720) (6.7)
1% Increase 1% Decrease
Amount Amount
(in millions of Won)1 year
- 5 years5 years
- 10 years10 years
- 20 yearsLater than20 years
Benefits paid ₩ 69,334 239,632 532,724 992,760 254,495 ₩ 2,088,945
Within 1 year
Total
(in millions of Won)
Other current liabilitiesDue to customers for contract work ₩ 898,605 529,104Advances received 1,176,621 1,289,805Unearned revenue 29,217 46,963Withholdings 192,497 162,073Deferred revenue 202 235Others(*1) 268,032 283,474
₩ 2,565,174 2,311,654
Other long-term liabilities
Advances received ₩ 201,432 312,668Unearned revenue 1,465 841Others(*1) 57,954 64,305
₩ 260,851 377,814
2013 2012

POSCO and Subsidiaries Notes to the Consolidated Financial Statements, Continued As of December 31, 2013 and 2012
81
23. Financial Instruments (a) Classification of financial instruments
1) Financial assets as of December 31, 2013 and 2012 are as follows:
2) Financial liabilities as of December 31, 2013 and 2012 are as follows:
(in millions of Won)
Financial assets at fair value through profit or lossDerivatives assets held for trading ₩ 78,222 71,354
Available-for-sale financial assets 4,166,384 3,914,522Held-to-maturity investments 3,834 34,488Loans and receivables 21,206,326 19,787,951
₩ 25,454,766 23,808,315
2013 2012
(in millions of Won)
Financial liabilities at fair value through profit or lossDerivatives liabilities held for trading ₩ 357,466 185,142
Financial liabilities evaluated as amortized costTrade accounts payable 4,231,881 4,391,788Borrowings 26,246,605 24,921,433Financial guarantee liabilities 38,459 25,312Others 2,253,989 1,802,174
32,770,934 31,140,707₩ 33,128,400 31,325,849
2013 2012
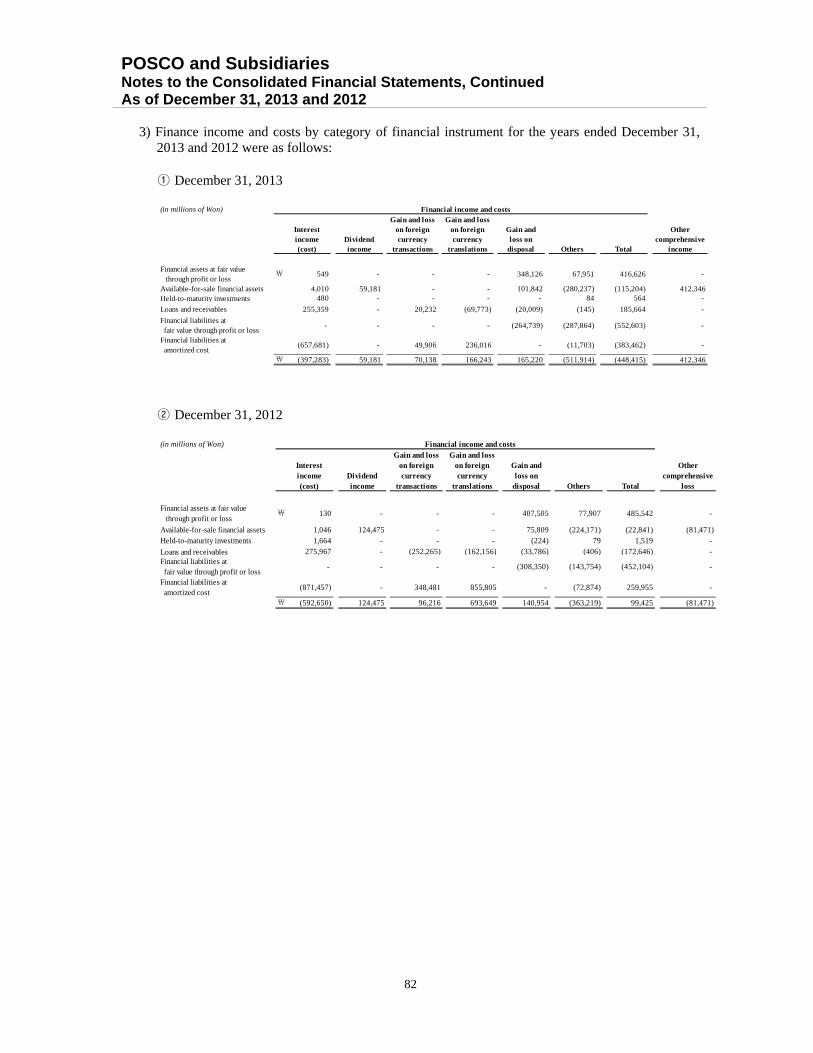
POSCO and Subsidiaries Notes to the Consolidated Financial Statements, Continued As of December 31, 2013 and 2012
82
3) Finance income and costs by category of financial instrument for the years ended December 31,
2013 and 2012 were as follows:
① December 31, 2013
② December 31, 2012
(in millions of Won)
Interestincome(cost)
Dividendincome
Gain and losson foreigncurrency
transactions
Gain and losson foreigncurrency
translations
Gain andloss on
disposal Others Total
Othercomprehensive
income
Financial assets at fair value through profit or loss
₩ 549 - - - 348,126 67,951 416,626 -
Available-for-sale financial assets 4,010 59,181 - - 101,842 (280,237) (115,204) 412,346Held-to-maturity investments 480 - - - - 84 564 -
Loans and receivables 255,359 - 20,232 (69,773) (20,009) (145) 185,664 -
Financial liabilities at fair value through profit or loss
- - - - (264,739) (287,864) (552,603) -
Financial liabilities at amortized cost
(657,681) - 49,906 236,016 - (11,703) (383,462) -
₩ (397,283) 59,181 70,138 166,243 165,220 (511,914) (448,415) 412,346
Financial income and costs
(in millions of Won)
Interestincome(cost)
Dividendincome
Gain and losson foreigncurrency
transactions
Gain and losson foreigncurrency
translations
Gain andloss on
disposal Others Total
Othercomprehensive
loss
Financial assets at fair value through profit or loss
₩ 130 - - - 407,505 77,907 485,542 -
Available-for-sale financial assets 1,046 124,475 - - 75,809 (224,171) (22,841) (81,471)Held-to-maturity investments 1,664 - - - (224) 79 1,519 -
Loans and receivables 275,967 - (252,265) (162,156) (33,786) (406) (172,646) - Financial liabilities at fair value through profit or loss
- - - - (308,350) (143,754) (452,104) -
Financial liabilities at amortized cost
(871,457) - 348,481 855,805 - (72,874) 259,955 -
₩ (592,650) 124,475 96,216 693,649 140,954 (363,219) 99,425 (81,471)
Financial income and costs
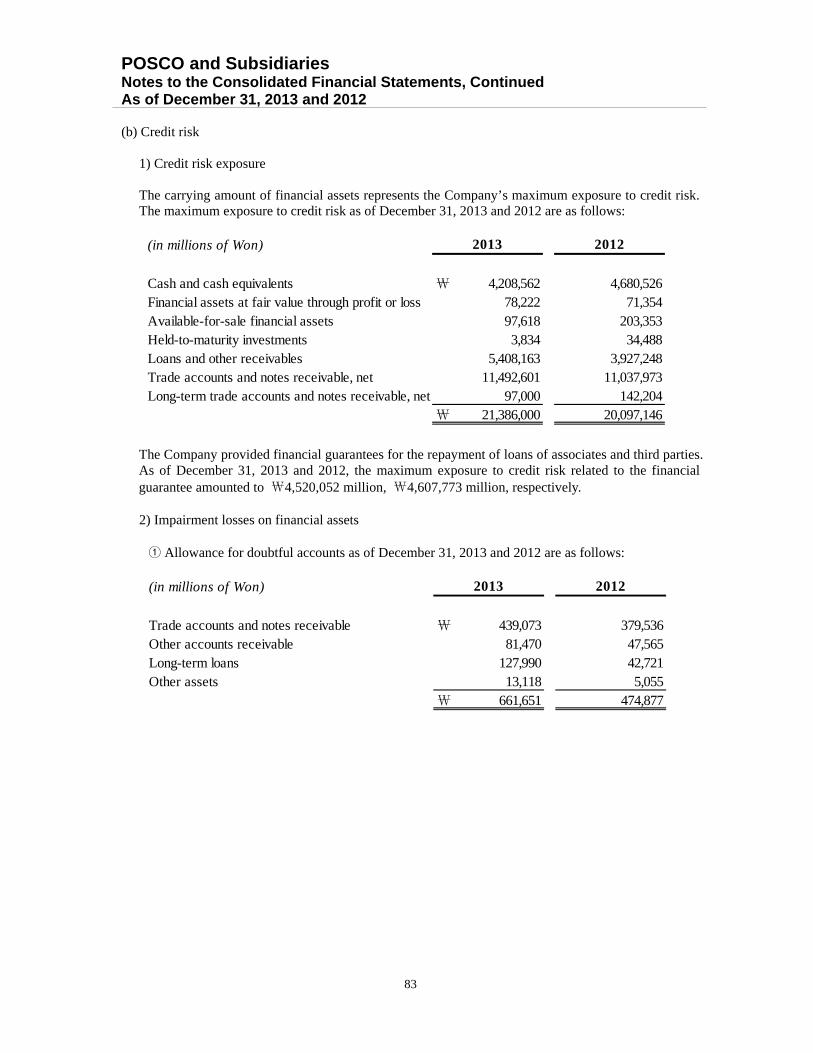
POSCO and Subsidiaries Notes to the Consolidated Financial Statements, Continued As of December 31, 2013 and 2012
83
(b) Credit risk
1) Credit risk exposure
The carrying amount of financial assets represents the Company’s maximum exposure to credit risk. The maximum exposure to credit risk as of December 31, 2013 and 2012 are as follows:
The Company provided financial guarantees for the repayment of loans of associates and third parties. As of December 31, 2013 and 2012, the maximum exposure to credit risk related to the financial guarantee amounted to ₩4,520,052 million, ₩4,607,773 million, respectively.
2) Impairment losses on financial assets
① Allowance for doubtful accounts as of December 31, 2013 and 2012 are as follows:
(in millions of Won)
Cash and cash equivalents ₩ 4,208,562 4,680,526Financial assets at fair value through profit or loss 78,222 71,354Available-for-sale financial assets 97,618 203,353Held-to-maturity investments 3,834 34,488Loans and other receivables 5,408,163 3,927,248Trade accounts and notes receivable, net 11,492,601 11,037,973Long-term trade accounts and notes receivable, net 97,000 142,204
₩ 21,386,000 20,097,146
2013 2012
(in millions of Won)
Trade accounts and notes receivable ₩ 439,073 379,536Other accounts receivable 81,470 47,565Long-term loans 127,990 42,721Other assets 13,118 5,055
₩ 661,651 474,877
2013 2012
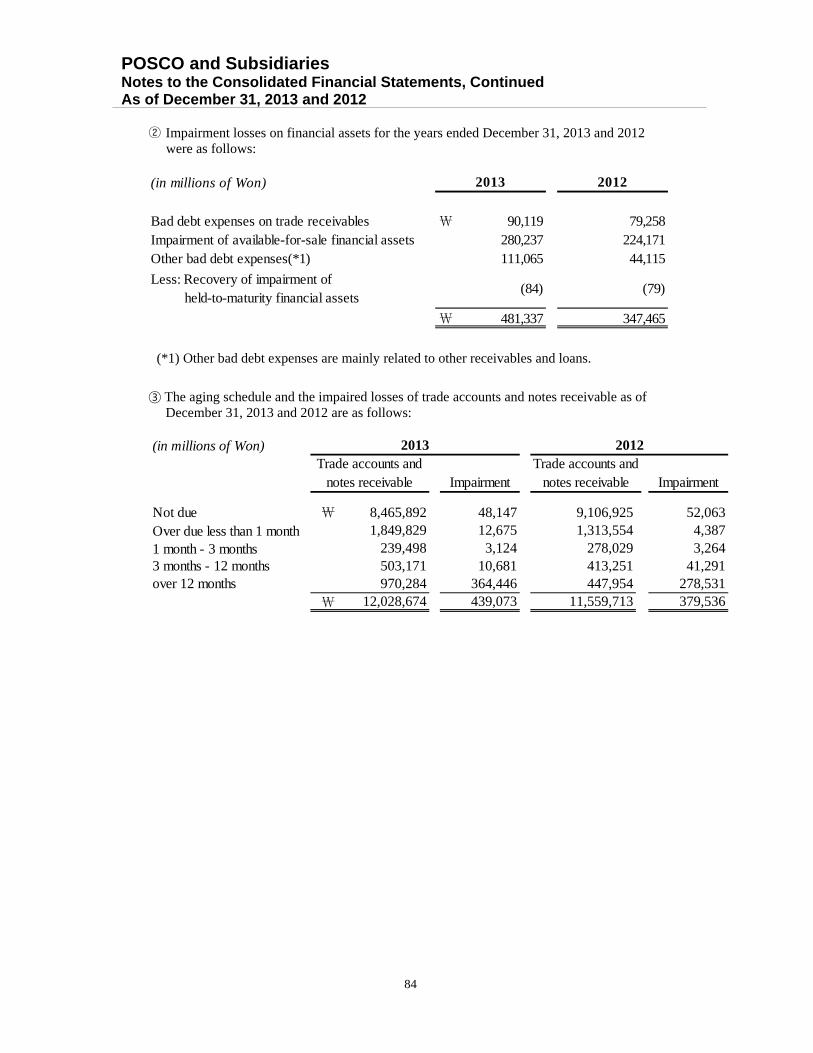
POSCO and Subsidiaries Notes to the Consolidated Financial Statements, Continued As of December 31, 2013 and 2012
84
② Impairment losses on financial assets for the years ended December 31, 2013 and 2012
were as follows:
(*1) Other bad debt expenses are mainly related to other receivables and loans.
③ The aging schedule and the impaired losses of trade accounts and notes receivable as of December 31, 2013 and 2012 are as follows:
(in millions of Won)
Bad debt expenses on trade receivables ₩ 90,119 79,258Impairment of available-for-sale financial assets 280,237 224,171Other bad debt expenses(*1) 111,065 44,115
Less: Recovery of impairment of held-to-maturity financial assets
(84) (79)
₩ 481,337 347,465
2013 2012
(in millions of Won)
Impairment Impairment
Not due ₩ 8,465,892 48,147 9,106,925 52,063Over due less than 1 month 1,849,829 12,675 1,313,554 4,3871 month - 3 months 239,498 3,124 278,029 3,2643 months - 12 months 503,171 10,681 413,251 41,291over 12 months 970,284 364,446 447,954 278,531
₩ 12,028,674 439,073 11,559,713 379,536
2013 2012Trade accounts and
notes receivableTrade accounts and
notes receivable
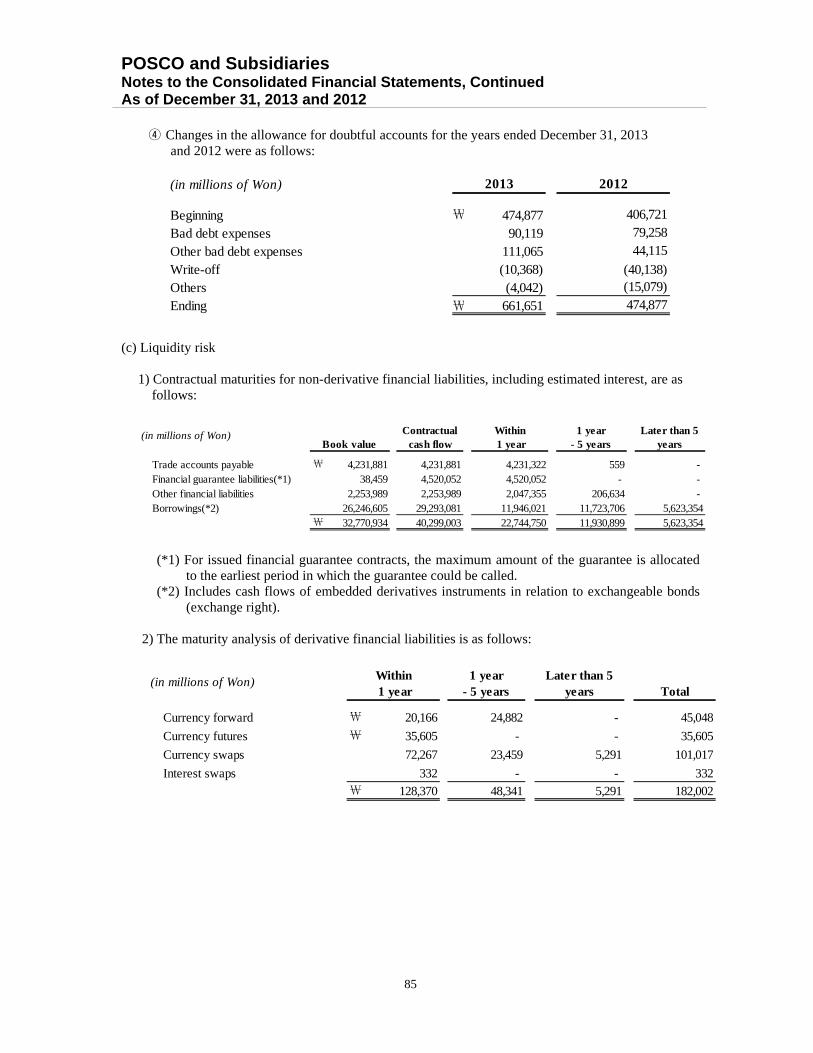
POSCO and Subsidiaries Notes to the Consolidated Financial Statements, Continued As of December 31, 2013 and 2012
85
④ Changes in the allowance for doubtful accounts for the years ended December 31, 2013 and 2012 were as follows:
(c) Liquidity risk
1) Contractual maturities for non-derivative financial liabilities, including estimated interest, are as follows:
(*1) For issued financial guarantee contracts, the maximum amount of the guarantee is allocated to the earliest period in which the guarantee could be called.
(*2) Includes cash flows of embedded derivatives instruments in relation to exchangeable bonds (exchange right).
2) The maturity analysis of derivative financial liabilities is as follows:
(in millions of Won)
Beginning ₩ 474,877Bad debt expenses 90,119Other bad debt expenses 111,065Write-off (10,368)Others (4,042)Ending ₩ 661,651
406,72179,258
(15,079)474,877
44,115
(40,138)
2013 2012
(in millions of Won) Contractualcash flow
Within 1 year
1 year- 5 years
Later than 5years
Trade accounts payable ₩ 4,231,881 4,231,881 4,231,322 559 - Financial guarantee liabilities(*1) 38,459 4,520,052 4,520,052 - - Other financial liabilities 2,253,989 2,253,989 2,047,355 206,634 - Borrowings(*2) 26,246,605 29,293,081 11,946,021 11,723,706 5,623,354
₩ 32,770,934 40,299,003 22,744,750 11,930,899 5,623,354
Book value
(in millions of Won) 1 year- 5 years
Later than 5years Total
Currency forward ₩ 20,166 24,882 - 45,048
Currency futures ₩ 35,605 - - 35,605
Currency swaps 72,267 23,459 5,291 101,017
Interest swaps 332 - - 332₩ 128,370 48,341 5,291 182,002
Within 1 year
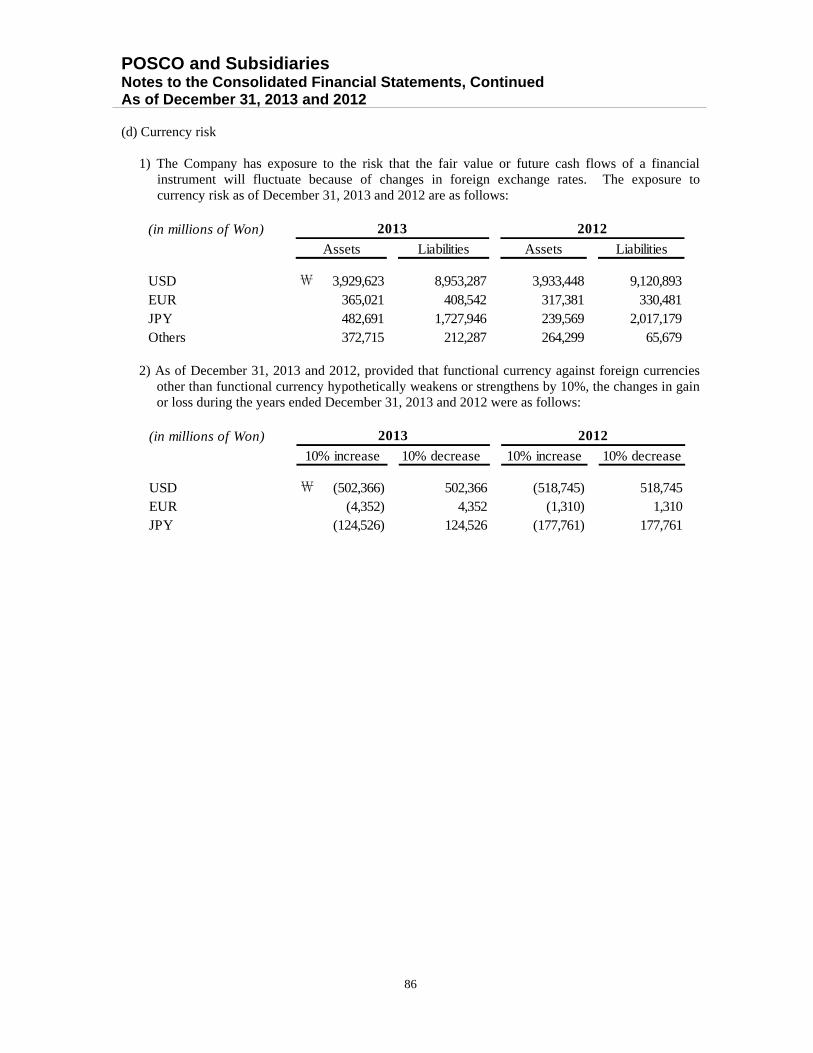
POSCO and Subsidiaries Notes to the Consolidated Financial Statements, Continued As of December 31, 2013 and 2012
86
(d) Currency risk
1) The Company has exposure to the risk that the fair value or future cash flows of a financial instrument will fluctuate because of changes in foreign exchange rates. The exposure to currency risk as of December 31, 2013 and 2012 are as follows:
2) As of December 31, 2013 and 2012, provided that functional currency against foreign currencies other than functional currency hypothetically weakens or strengthens by 10%, the changes in gain or loss during the years ended December 31, 2013 and 2012 were as follows:
(in millions of Won)
Assets Liabilities
USD ₩ 3,929,623 8,953,287 3,933,448 9,120,893EUR 365,021 408,542 317,381 330,481JPY 482,691 1,727,946 239,569 2,017,179Others 372,715 212,287 264,299 65,679
2013 2012
Assets Liabilities
(in millions of Won)
10% decrease 10% increase 10% decrease
USD ₩ (502,366) 502,366 (518,745) 518,745EUR (4,352) 4,352 (1,310) 1,310JPY (124,526) 124,526 (177,761) 177,761
10% increase
2013 2012
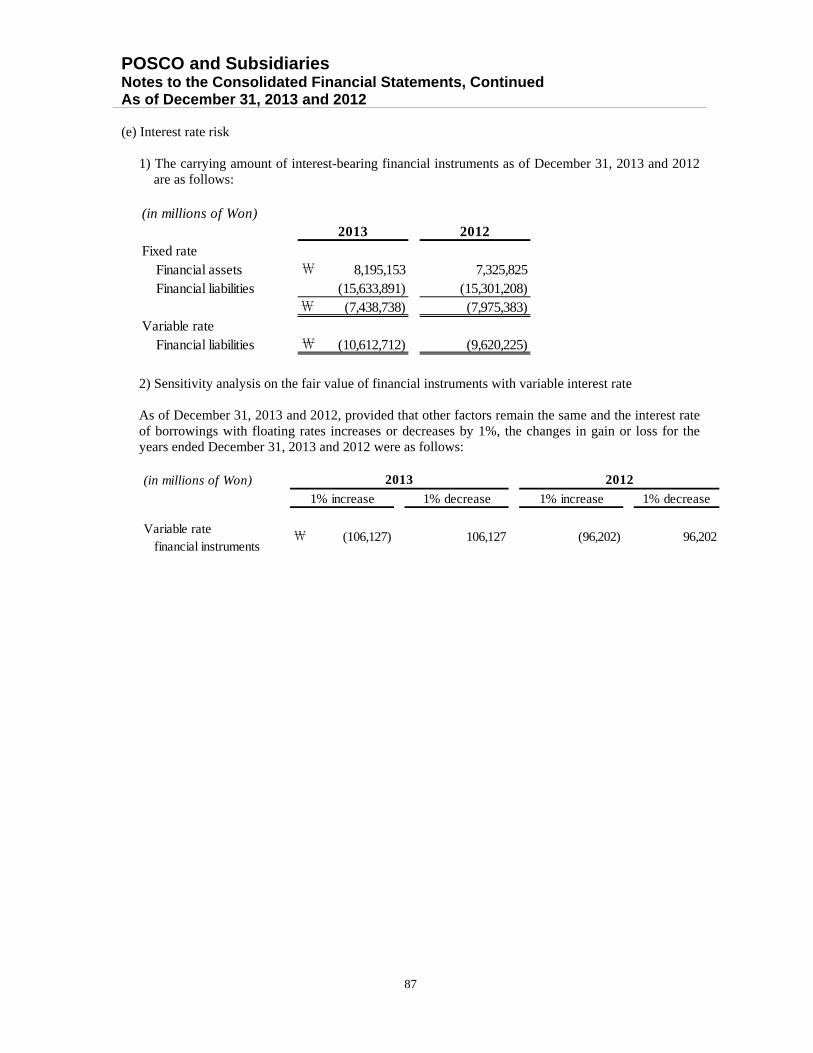
POSCO and Subsidiaries Notes to the Consolidated Financial Statements, Continued As of December 31, 2013 and 2012
87
(e) Interest rate risk
1) The carrying amount of interest-bearing financial instruments as of December 31, 2013 and 2012 are as follows:
2) Sensitivity analysis on the fair value of financial instruments with variable interest rate As of December 31, 2013 and 2012, provided that other factors remain the same and the interest rate of borrowings with floating rates increases or decreases by 1%, the changes in gain or loss for the years ended December 31, 2013 and 2012 were as follows:
(in millions of Won)
Fixed rateFinancial assets ₩ 8,195,153 7,325,825Financial liabilities (15,633,891) (15,301,208)
₩ (7,438,738) (7,975,383)Variable rate
Financial liabilities ₩ (10,612,712) (9,620,225)
2013 2012
(in millions of Won)
1% decrease
Variable rate financial instruments
₩ (106,127) 106,127 (96,202) 96,202
1% increase 1% decrease 1% increase
2013 2012
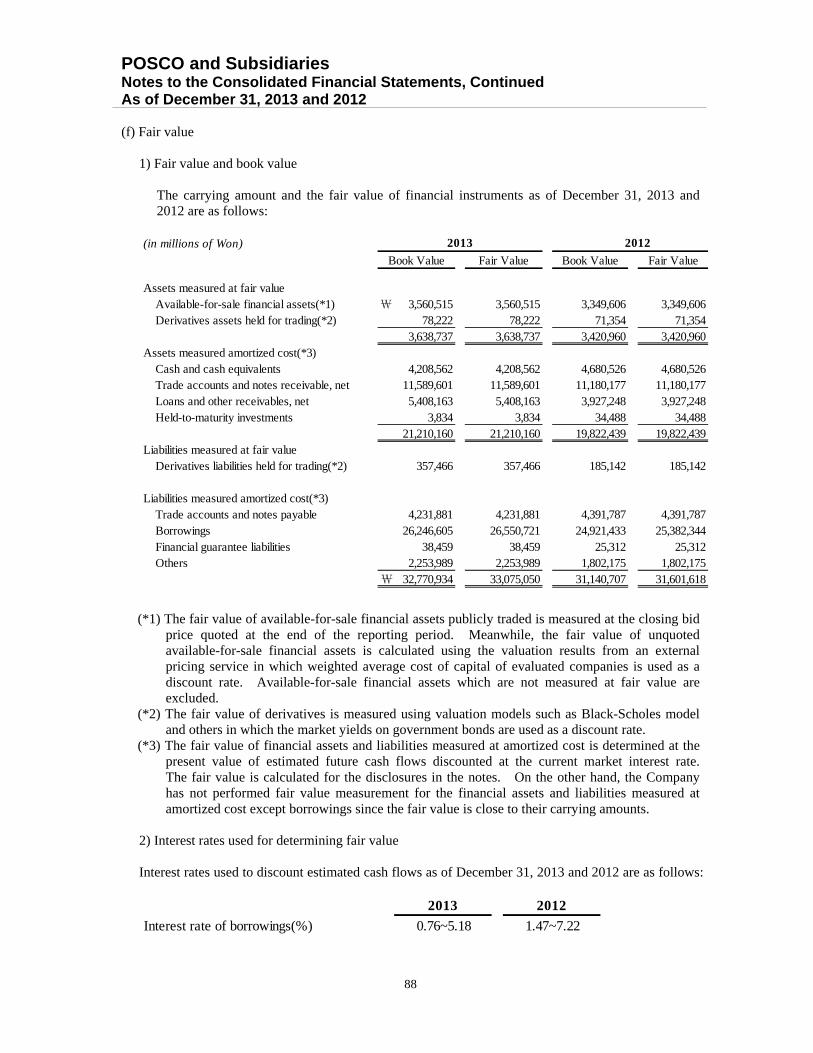
POSCO and Subsidiaries Notes to the Consolidated Financial Statements, Continued As of December 31, 2013 and 2012
88
(f) Fair value
1) Fair value and book value
The carrying amount and the fair value of financial instruments as of December 31, 2013 and 2012 are as follows:
(*1) The fair value of available-for-sale financial assets publicly traded is measured at the closing bid
price quoted at the end of the reporting period. Meanwhile, the fair value of unquoted available-for-sale financial assets is calculated using the valuation results from an external pricing service in which weighted average cost of capital of evaluated companies is used as a discount rate. Available-for-sale financial assets which are not measured at fair value are excluded.
(*2) The fair value of derivatives is measured using valuation models such as Black-Scholes model and others in which the market yields on government bonds are used as a discount rate.
(*3) The fair value of financial assets and liabilities measured at amortized cost is determined at the present value of estimated future cash flows discounted at the current market interest rate. The fair value is calculated for the disclosures in the notes. On the other hand, the Company has not performed fair value measurement for the financial assets and liabilities measured at amortized cost except borrowings since the fair value is close to their carrying amounts.
2) Interest rates used for determining fair value Interest rates used to discount estimated cash flows as of December 31, 2013 and 2012 are as follows:
(in millions of Won)
Fair Value
Assets measured at fair valueAvailable-for-sale financial assets(*1) ₩ 3,560,515 3,560,515 3,349,606 3,349,606Derivatives assets held for trading(*2) 78,222 78,222 71,354 71,354
3,638,737 3,638,737 3,420,960 3,420,960Assets measured amortized cost(*3)
Cash and cash equivalents 4,208,562 4,208,562 4,680,526 4,680,526Trade accounts and notes receivable, net 11,589,601 11,589,601 11,180,177 11,180,177Loans and other receivables, net 5,408,163 5,408,163 3,927,248 3,927,248Held-to-maturity investments 3,834 3,834 34,488 34,488
21,210,160 21,210,160 19,822,439 19,822,439Liabilities measured at fair value
Derivatives liabilities held for trading(*2) 357,466 357,466 185,142 185,142
Liabilities measured amortized cost(*3)Trade accounts and notes payable 4,231,881 4,231,881 4,391,787 4,391,787Borrowings 26,246,605 26,550,721 24,921,433 25,382,344Financial guarantee liabilities 38,459 38,459 25,312 25,312Others 2,253,989 2,253,989 1,802,175 1,802,175
₩ 32,770,934 33,075,050 31,140,707 31,601,618
2013 2012
Book Value Fair Value Book Value
Interest rate of borrowings(%) 0.76~5.18 1.47~7.22
2013 2012
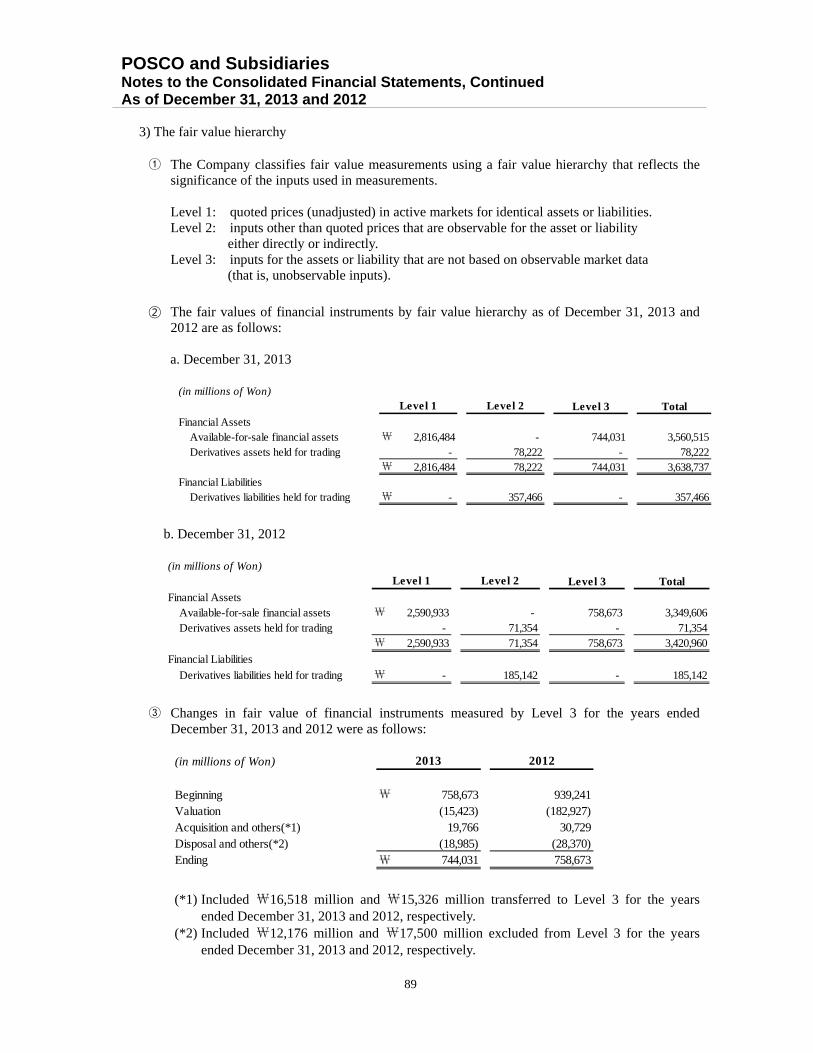
POSCO and Subsidiaries Notes to the Consolidated Financial Statements, Continued As of December 31, 2013 and 2012
89
3) The fair value hierarchy
① The Company classifies fair value measurements using a fair value hierarchy that reflects the
significance of the inputs used in measurements.
Level 1: quoted prices (unadjusted) in active markets for identical assets or liabilities. Level 2: inputs other than quoted prices that are observable for the asset or liability
either directly or indirectly. Level 3: inputs for the assets or liability that are not based on observable market data
(that is, unobservable inputs).
② The fair values of financial instruments by fair value hierarchy as of December 31, 2013 and 2012 are as follows:
a. December 31, 2013
b. December 31, 2012
③ Changes in fair value of financial instruments measured by Level 3 for the years ended December 31, 2013 and 2012 were as follows:
(*1) Included ₩16,518 million and ₩15,326 million transferred to Level 3 for the years ended December 31, 2013 and 2012, respectively.
(*2) Included ₩12,176 million and ₩17,500 million excluded from Level 3 for the years ended December 31, 2013 and 2012, respectively.
(in millions of Won)Level 3 Total
Financial AssetsAvailable-for-sale financial assets ₩ 2,816,484 - 744,031 3,560,515Derivatives assets held for trading - 78,222 - 78,222
₩ 2,816,484 78,222 744,031 3,638,737Financial Liabilities
Derivatives liabilities held for trading ₩ - 357,466 - 357,466
Level 1 Level 2
(in millions of Won)Level 3 Total
Financial AssetsAvailable-for-sale financial assets ₩ 2,590,933 - 758,673 3,349,606Derivatives assets held for trading - 71,354 - 71,354
₩ 2,590,933 71,354 758,673 3,420,960
Financial Liabilities
Derivatives liabilities held for trading ₩ - 185,142 - 185,142
Level 1 Level 2
(in millions of Won)
Beginning ₩ 758,673 939,241Valuation (15,423) (182,927)Acquisition and others(*1) 19,766 30,729Disposal and others(*2) (18,985) (28,370)Ending ₩ 744,031 758,673
2013 2012

POSCO and Subsidiaries Notes to the Consolidated Financial Statements, Continued As of December 31, 2013 and 2012
90
(g) Offsetting financial assets and financial liabilities As of December 31, 2013 and 2012, financial assets and financial liabilities subject to offsetting, enforceable master netting arrangements and similar agreements are as follows:
1) December 31, 2013
(*1) Some of derivative contract are made under International Swaps and Derivatives Association (ISDA) master netting agreements. In general, under such agreements the amounts owed by each counter party on a single day in respect of all transactions outstanding in the same currency are aggregated into a single net amount that is payable by one party to the other. In certain circumstances (i.e. when a default occurs), all standing transactions under the agreement are terminated, the termination value is assessed and only a single amount is payable in settlement of all transactions.
2) December 31, 2012
(*1) Some of derivative contract are made under International Swaps and Derivatives
Association (ISDA) master netting agreements. In general, under such agreements the amounts owed by each counter party on a single day in respect of all transactions outstanding in the same currency are aggregated into a single net amount that is payable by one party to the other. In certain circumstances (i.e. when a default occurs), all standing transactions under the agreement are terminated, the termination value is assessed and only a single amount is payable in settlement of all transactions.
(in millions of Won)
Financial assetsTrade accounts and notes receivable ₩ 73,956 - 73,956 (73,956) - - Derivatives(*1) 64,408 - 64,408 (64,408) - -
Total 138,364 - 138,364 (138,364) - -
Financial liabilitiesShort-term borrowings 73,956 - 73,956 (73,956) - - Derivatives(*1) 108,405 - 108,405 (64,408) (3,410) 40,587
Total ₩ 182,361 - 182,361 (138,364) (3,410) 40,587
Cash collateralreceived or
pledged
Related amounts not set off inthe statement of financial position
Netamount
Gross amountsof recognized
financialinstruments
Gross amounts ofrecognized
financial instrumentsset off in the
statement of financial
Net amountsof financial instruments
presented inthe statement offinancial position
Finalcialinstruments
(in millions of Won)
Financial assetsTrade accounts and notes receivable ₩ 80,258 - 80,258 (80,258) - - Derivatives(*1) 56,341 - 56,341 (56,341) - -
Total 136,599 - 136,599 (136,599) - -
Financial liabilitiesShort-term borrowings 80,258 - 80,258 (80,258) - - Derivatives(*1) 59,274 - 59,274 (56,341) (2,933) -
Total ₩ 139,532 - 139,532 (136,599) (2,933) -
Related amounts not set off inthe statement of financial position
Gross amountsof recognized
financialinstruments
Gross amounts ofrecognized
financial instrumentsset off in the
statement of financial
Net amountsof financial instruments
presented inthe statement offinancial position
Finalcialinstruments
Cash collateralreceived or
pledgedNet
amount
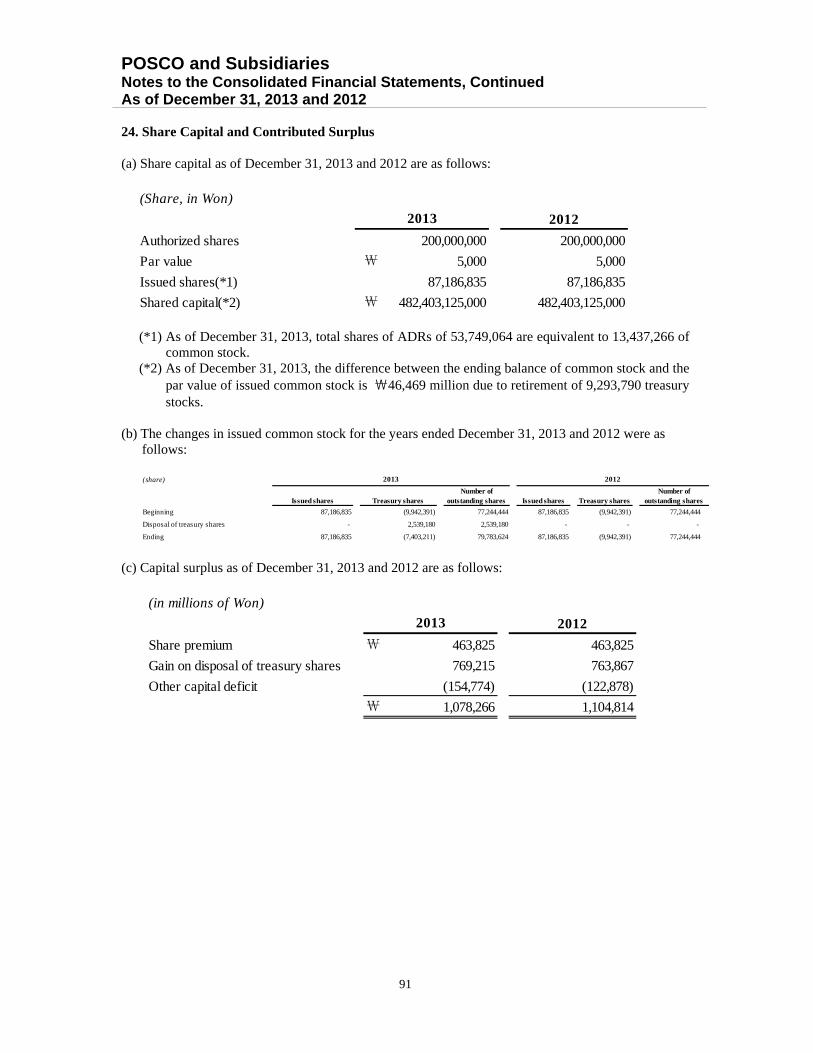
POSCO and Subsidiaries Notes to the Consolidated Financial Statements, Continued As of December 31, 2013 and 2012
91
24. Share Capital and Contributed Surplus
(a) Share capital as of December 31, 2013 and 2012 are as follows:
(*1) As of December 31, 2013, total shares of ADRs of 53,749,064 are equivalent to 13,437,266 of common stock.
(*2) As of December 31, 2013, the difference between the ending balance of common stock and the par value of issued common stock is ₩46,469 million due to retirement of 9,293,790 treasury stocks.
(b) The changes in issued common stock for the years ended December 31, 2013 and 2012 were as
follows:
(c) Capital surplus as of December 31, 2013 and 2012 are as follows:
(Share, in Won)
2012
Authorized shares 200,000,000 200,000,000
Par value ₩ 5,000 5,000
Issued shares(*1) 87,186,835 87,186,835
Shared capital(*2) ₩ 482,403,125,000 482,403,125,000
2013
(share)
Treasury sharesNumber of
outstanding shares Issued shares Treasury shares
Beginning 87,186,835 (9,942,391) 77,244,444 87,186,835 (9,942,391) 77,244,444
Disposal of treasury shares - 2,539,180 2,539,180 - - -
Ending 87,186,835 (7,403,211) 79,783,624 87,186,835 (9,942,391) 77,244,444
2013 2012
Issued sharesNumber of
outstanding shares
(in millions of Won)
2012
Share premium ₩ 463,825 463,825
Gain on disposal of treasury shares 769,215 763,867
Other capital deficit (154,774) (122,878)
₩ 1,078,266 1,104,814
2013
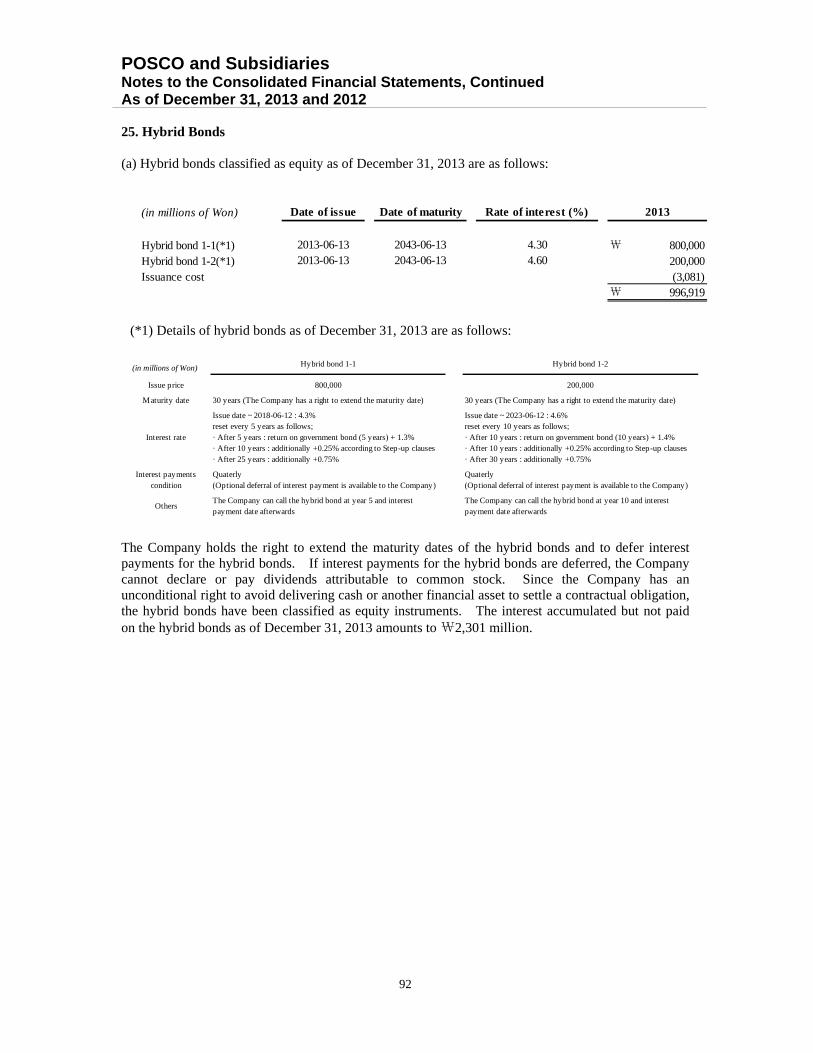
POSCO and Subsidiaries Notes to the Consolidated Financial Statements, Continued As of December 31, 2013 and 2012
92
25. Hybrid Bonds (a) Hybrid bonds classified as equity as of December 31, 2013 are as follows:
(*1) Details of hybrid bonds as of December 31, 2013 are as follows:
The Company holds the right to extend the maturity dates of the hybrid bonds and to defer interest payments for the hybrid bonds. If interest payments for the hybrid bonds are deferred, the Company cannot declare or pay dividends attributable to common stock. Since the Company has an unconditional right to avoid delivering cash or another financial asset to settle a contractual obligation, the hybrid bonds have been classified as equity instruments. The interest accumulated but not paid on the hybrid bonds as of December 31, 2013 amounts to ₩2,301 million.
(in millions of Won)
Hybrid bond 1-1(*1) ₩ 800,000Hybrid bond 1-2(*1) 200,000Issuance cost (3,081)
₩ 996,919
2013
2013-06-13 2043-06-132013-06-13 2043-06-13
Date of issue Date of maturity Rate of interest (%)
4.304.60
(in millions of Won) Hybrid bond 1-1 Hybrid bond 1-2
Issue price 800,000 200,000
Maturity date 30 years (The Company has a right to extend the maturity date) 30 years (The Company has a right to extend the maturity date)
Interest rate
Issue date ~ 2018-06-12 : 4.3%reset every 5 years as follows;· After 5 years : return on government bond (5 years) + 1.3%· After 10 years : additionally +0.25% according to Step-up clauses· After 25 years : additionally +0.75%
Issue date ~ 2023-06-12 : 4.6%reset every 10 years as follows;· After 10 years : return on government bond (10 years) + 1.4%· After 10 years : additionally +0.25% according to Step-up clauses· After 30 years : additionally +0.75%
Interest paymentscondition
Quaterly(Optional deferral of interest payment is available to the Company)
Quaterly(Optional deferral of interest payment is available to the Company)
OthersThe Company can call the hybrid bond at year 5 and interestpayment date afterwards
The Company can call the hybrid bond at year 10 and interestpayment date afterwards

POSCO and Subsidiaries Notes to the Consolidated Financial Statements, Continued As of December 31, 2013 and 2012
93
(b) POSCO ENERGY Co., Ltd., a subsidiary of the Company, issued hybrid bonds during the year ended December 31, 2013, which are classified as non-controlling interests in the consolidated financial statements. Hybrid bonds as of December 31, 2013 are as follows:
(*1) Details of hybrid bonds of POSCO ENERGY Co., Ltd .as of December 31, 2013 are as follows:
The Company holds the right to extend the maturity dates of the hybrid bonds and to defer interest payments for the hybrid bonds. If interest payments for the hybrid bonds are deferred, the Company cannot declare or pay dividends attributable to common stock. Since the Company has an unconditional right to avoid delivering cash or another financial asset to settle a contractual obligation, the hybrid bonds have been classified as equity instruments (Non-controlling interests). The interest accumulated but not paid on the hybrid bonds as of December 31, 2013 amounts to ₩2,000 million.
(in millions of Won)
Hybrid bond 1-1(*1) 4.66 ₩ 165,000Hybrid bond 1-2(*1) 4.72 165,000Hybrid bond 1-3(*1) 4.72 30,000Hybrid bond 1-4(*1) 5.21 140,000Issuance cost (1,532)
₩ 498,468
Interest rate(%) 2013
2013-08-29 2043-08-29
Date of issue Date of maturity
2013-08-29 2043-08-292013-08-29 2043-08-29
2013-08-29 2043-08-29
(in millions of Won) Hybrid bond 1-1 Hybrid bond 1-2 and 1-3 Hybrid bond 1-4
Issue price 165,000 195,000 140,000
Maturity date30 years (The Company has a right toextend the maturity date)
30 years (The Company has a right toextend the maturity date)
30 years (The Company has a right toextend the maturity date)
Interest rate
Issue date ~ 2018-08-29 : 4.66%reset every 5 years as follows;· After 5 years : returen ongovernment bond (5 years) + 1.39%· After 10 years : additionally +0.25%according to Step-up clauses· After 30 years : additionally +0.75%
Issue date ~ 2018-08-29 : 4.72%reset every 5 years as follows;· After 5 years : returen ongovernment bond (5 years) + 1.45%· After 10 years : additionally +0.25%according to Step-up clauses· After 30 years : additionally +0.75%
Issue date ~ 2018-08-29 : 5.21%reset every 5 years as follows;· After 5 years : returen ongovernment bond (5 years) + 1.55%· After 10 years : additionally +0.25%according to Step-up clauses· After 30 years : additionally +0.75%
Interest payments conditionQuaterly(Optional deferral of interest paymentis available to the Company)
Quaterly(Optional deferral of interest paymentis available to the Company)
Quaterly(Optional deferral of interest paymentis available to the Company)
OthersThe Company can call the hybridbond at year 5 and interest paymentdate afterwards
The Company can call the hybridbond at year 5 and interest paymentdate afterwards
The Company can call the hybridbond at year 5 and interest paymentdate afterwards

POSCO and Subsidiaries Notes to the Consolidated Financial Statements, Continued As of December 31, 2013 and 2012
94
26. Reserves (a) Reserves as of December 31, 2013 and 2012 are as follows:
(b) Changes in fair value of available-for-sale investments for the years ended December 31, 2013 and
2012 were as follows:
27. Treasury Shares Based on the Board of Director’s resolution, the Company holds treasury shares for the business purposes including price stabilization. The changes in treasury shares for the years ended December 31, 2013 and 2012 were as follows:
(in millions of Won)
₩ (295,946) (129,159)
Changes in the unrealized fair value
of available-for-sale investments
Currency translation differences (189,085) (8,591)
Others (18,454) (18,356)
₩ (23,076) (88,150)
2013 2012
Accumulated comprehensive loss of investments in associates and joint ventures
480,409 67,956
(in millions of Won)
Beginning balance ₩ 67,956 154,617
312,196 (189,664)
Reclassification to profit of loss upon disposal (73,848) (54,089)
Impairment of avaiable-for-sale investments 170,892 150,869
Others 3,213 6,223
Ending balance ₩ 480,409 67,956
2013 2012
Changes in the unrealized fair value of available-for-sale investments
(shares, in millions of Won)
Beginning 9,942,391 ₩ 2,391,406 9,942,391 2,391,406
Disposal of treasury shares (2,539,180) (812,282) - -
Ending 7,403,211 ₩ 1,579,124 9,942,391 2,391,406
2013 2012
Number ofshares
AmountNumber of
sharesAmount
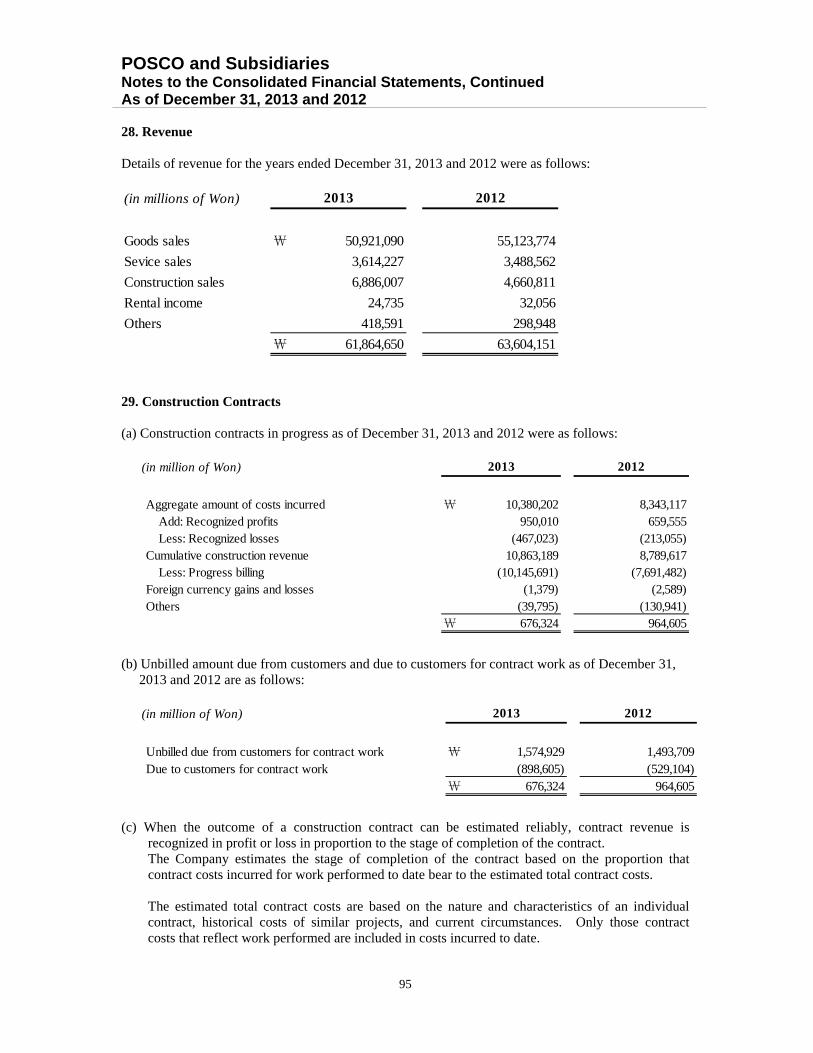
POSCO and Subsidiaries Notes to the Consolidated Financial Statements, Continued As of December 31, 2013 and 2012
95
28. Revenue Details of revenue for the years ended December 31, 2013 and 2012 were as follows:
29. Construction Contracts (a) Construction contracts in progress as of December 31, 2013 and 2012 were as follows:
(b) Unbilled amount due from customers and due to customers for contract work as of December 31, 2013 and 2012 are as follows:
(c) When the outcome of a construction contract can be estimated reliably, contract revenue is recognized in profit or loss in proportion to the stage of completion of the contract. The Company estimates the stage of completion of the contract based on the proportion that contract costs incurred for work performed to date bear to the estimated total contract costs.
The estimated total contract costs are based on the nature and characteristics of an individual contract, historical costs of similar projects, and current circumstances. Only those contract costs that reflect work performed are included in costs incurred to date.
(in millions of Won)
Goods sales ₩ 50,921,090 55,123,774
Sevice sales 3,614,227 3,488,562
Construction sales 6,886,007 4,660,811
Rental income 24,735 32,056
Others 418,591 298,948
₩ 61,864,650 63,604,151
2013 2012
(in million of Won)
Aggregate amount of costs incurred ₩ 10,380,202 8,343,117Add: Recognized profits 950,010 659,555Less: Recognized losses (467,023) (213,055)
Cumulative construction revenue 10,863,189 8,789,617Less: Progress billing (10,145,691) (7,691,482)
Foreign currency gains and losses (1,379) (2,589)Others (39,795) (130,941)
₩ 676,324 964,605
2013 2012
(in million of Won)
Unbilled due from customers for contract work ₩ 1,574,929 1,493,709Due to customers for contract work (898,605) (529,104)
₩ 676,324 964,605
2013 2012
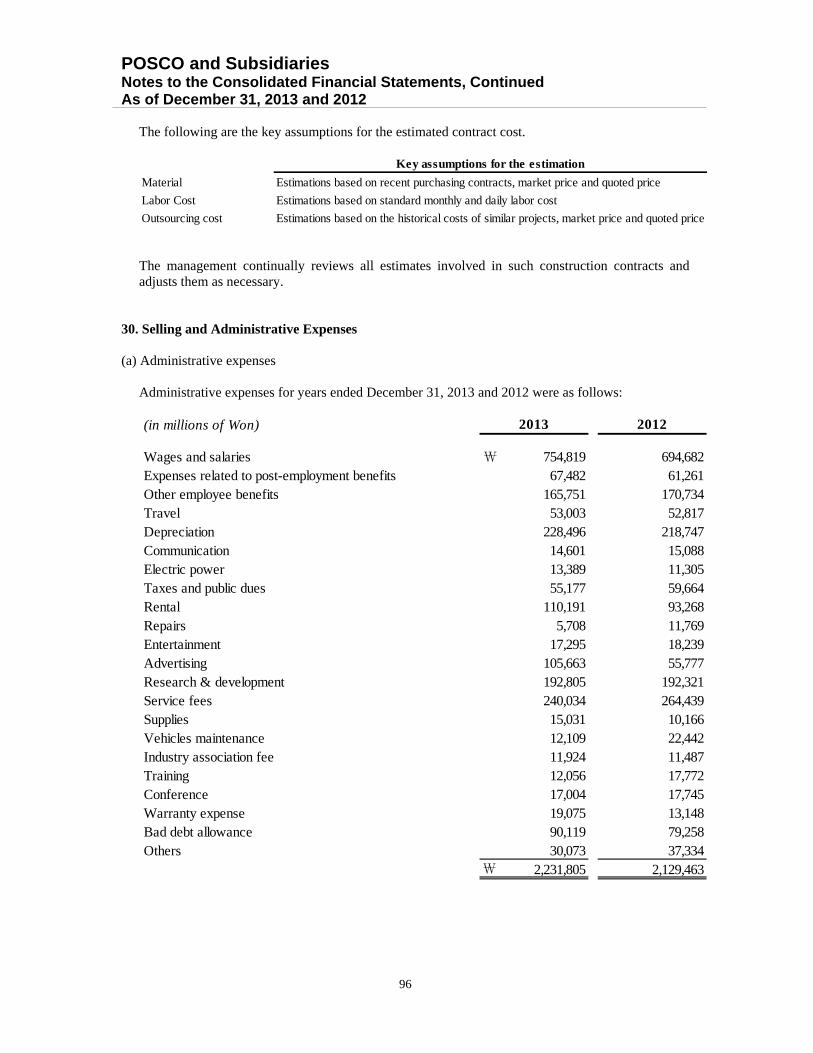
POSCO and Subsidiaries Notes to the Consolidated Financial Statements, Continued As of December 31, 2013 and 2012
96
The following are the key assumptions for the estimated contract cost.
The management continually reviews all estimates involved in such construction contracts and adjusts them as necessary.
30. Selling and Administrative Expenses (a) Administrative expenses
Administrative expenses for years ended December 31, 2013 and 2012 were as follows:
Material Estimations based on recent purchasing contracts, market price and quoted price
Labor Cost Estimations based on standard monthly and daily labor cost
Outsourcing cost Estimations based on the historical costs of similar projects, market price and quoted price
Key assumptions for the estimation
(in millions of Won)
Wages and salaries ₩ 754,819 694,682Expenses related to post-employment benefits 67,482 61,261Other employee benefits 165,751 170,734Travel 53,003 52,817Depreciation 228,496 218,747Communication 14,601 15,088Electric power 13,389 11,305Taxes and public dues 55,177 59,664Rental 110,191 93,268Repairs 5,708 11,769Entertainment 17,295 18,239Advertising 105,663 55,777
Research & development 192,805 192,321Service fees 240,034 264,439Supplies 15,031 10,166Vehicles maintenance 12,109 22,442Industry association fee 11,924 11,487Training 12,056 17,772Conference 17,004 17,745Warranty expense 19,075 13,148Bad debt allowance 90,119 79,258Others 30,073 37,334
₩ 2,231,805 2,129,463
2013 2012
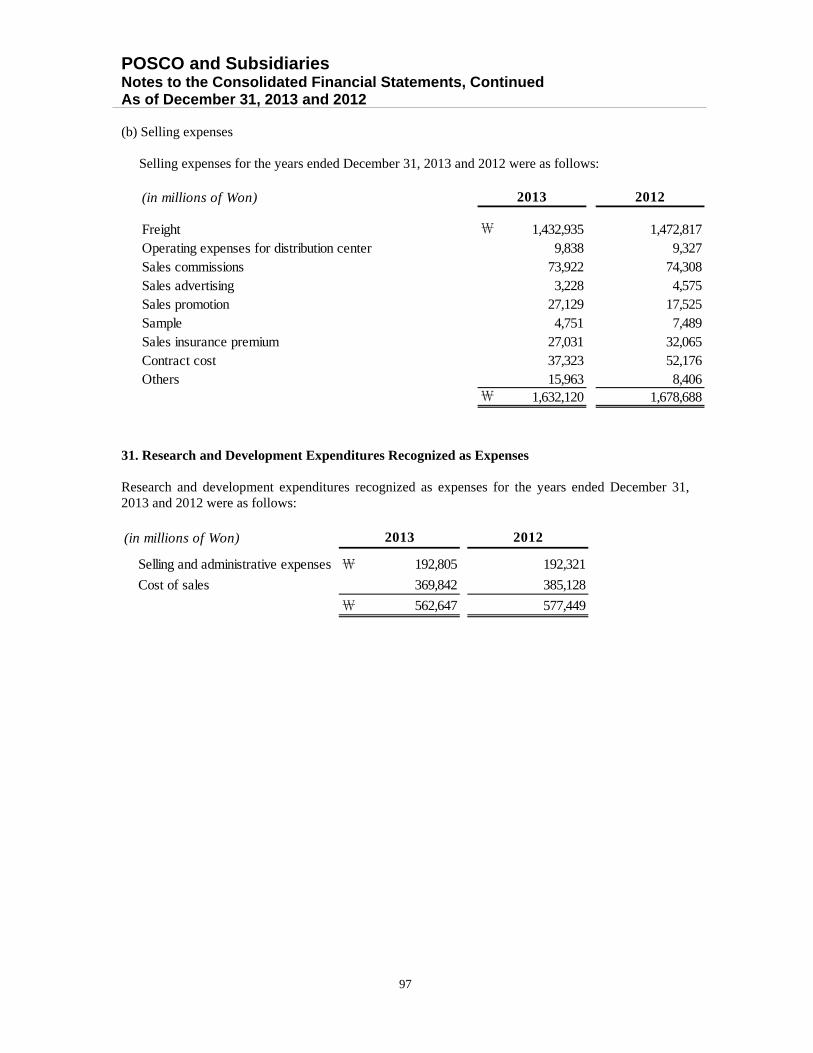
POSCO and Subsidiaries Notes to the Consolidated Financial Statements, Continued As of December 31, 2013 and 2012
97
(b) Selling expenses
Selling expenses for the years ended December 31, 2013 and 2012 were as follows:
31. Research and Development Expenditures Recognized as Expenses Research and development expenditures recognized as expenses for the years ended December 31, 2013 and 2012 were as follows:
(in millions of Won)
Freight ₩ 1,432,935 1,472,817Operating expenses for distribution center 9,838 9,327Sales commissions 73,922 74,308Sales advertising 3,228 4,575Sales promotion 27,129 17,525Sample 4,751 7,489Sales insurance premium 27,031 32,065Contract cost 37,323 52,176Others 15,963 8,406
₩ 1,632,120 1,678,688
2013 2012
(in millions of Won)
Selling and administrative expenses ₩ 192,805 192,321
Cost of sales 369,842 385,128
₩ 562,647 577,449
2013 2012

POSCO and Subsidiaries Notes to the Consolidated Financial Statements, Continued As of December 31, 2013 and 2012
98
32. Adjusted Operating Profit Adjusted operating profits which include the other profits or losses excluded from operating profit but reflect the results of the Company’s operations for the years ended December 31, 2013 and 2012 were as follows:
Operating profits on the statement of comprehensive income ₩ 2,996,134 3,653,108Add
14,177 42,290Retal revenues 1,588 1,898Gains on disposals of intangible assets 801 906Gains on disposals of investment in associates 7,668 39,441Gains on disposals of assets held for sale 101,611 193,333Grant income 2,287 3,198Reversal of other provisions - 16,037Outsourcing income 25,428 29,136Gain on disposals of wastes 16,541 38,597Gain from claim compensation 14,525 31,613Penalty income from early termination of contracts 16,477 15,054Others 27,970 36,617
229,073 448,120Deduct
(121,133) (65,486)Loss on disposals of assets held for sale (26,498) (9,510)Idle tangible assets expenses (17,624) (31,297)Impariment losses on other non-current assets (9,000) (36,453)Impairment losses of assets held for sale (1,814) (258,451)Impairment loss of property, plant and equipment (9,742) (12,977)Other bad debt expenses (111,065) (44,115)Donations (60,940) (73,963)Impairment losses on intangible assets (125,316) (21,776)Penalty and default losses (19,340) (149,437)Loss on disposals of wastes (15,231) (45,480)Loss on disposals of investment in associates (19,404) (15,119)Other provision expenses (65,896) - Others (47,803) (45,401)
(650,806) (809,465)Adjusted operating profit ₩ 2,574,401 3,291,763
Loss on disposals of property, plant and equipment
(in millions of Won) 2013 2012
Gain on disposals of property, plant and equipment

POSCO and Subsidiaries Notes to the Consolidated Financial Statements, Continued As of December 31, 2013 and 2012
99
33. Finance Income and Costs Details of finance income and costs for the years ended December 31, 2013 and 2012 were as follows:
(in millions of Won)
Finance incomeInterest income ₩ 260,398 278,807Dividend income 59,181 124,475Gain on foreign currency transactions 997,591 935,457Gain on foreign currency translations 511,143 936,740Gains on derivatives transactions 370,343 407,791Gains on valuations of derivatives 72,297 94,492Gains on disposals of available-for-sale investment 105,563 112,095Others 4,322 7,206
₩ 2,380,838 2,897,063
Finance costsInterest expenses ₩ 657,681 871,457Loss on foreign currency transactions 927,453 839,241Loss on foreign currency translations 344,900 243,091Loss on derivatives transactions 286,574 309,067Loss on valuation of derivatives 291,465 159,604Impairment loss on available-for-sale investment 280,237 224,171Loss on disposals of available-for-sale investment 3,721 36,286Loss on financial guarantee 5,880 38,442Others 31,342 76,279
₩ 2,829,253 2,797,638
20122013
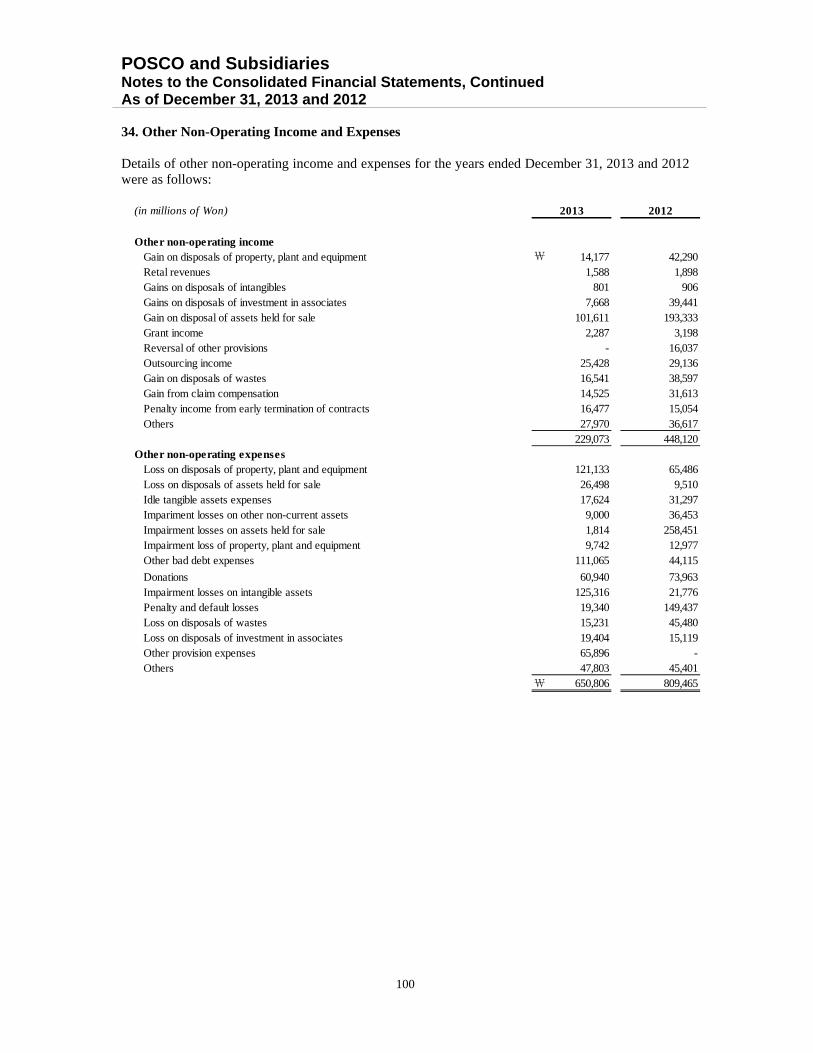
POSCO and Subsidiaries Notes to the Consolidated Financial Statements, Continued As of December 31, 2013 and 2012
100
34. Other Non-Operating Income and Expenses
Details of other non-operating income and expenses for the years ended December 31, 2013 and 2012 were as follows:
(in millions of Won)
Other non-operating income Gain on disposals of property, plant and equipment ₩ 14,177 42,290 Retal revenues 1,588 1,898 Gains on disposals of intangibles 801 906 Gains on disposals of investment in associates 7,668 39,441 Gain on disposal of assets held for sale 101,611 193,333 Grant income 2,287 3,198 Reversal of other provisions - 16,037 Outsourcing income 25,428 29,136 Gain on disposals of wastes 16,541 38,597 Gain from claim compensation 14,525 31,613 Penalty income from early termination of contracts 16,477 15,054 Others 27,970 36,617
229,073 448,120Other non-operating expenses Loss on disposals of property, plant and equipment 121,133 65,486 Loss on disposals of assets held for sale 26,498 9,510 Idle tangible assets expenses 17,624 31,297 Impariment losses on other non-current assets 9,000 36,453 Impairment losses on assets held for sale 1,814 258,451 Impairment loss of property, plant and equipment 9,742 12,977 Other bad debt expenses 111,065 44,115
Donations 60,940 73,963 Impairment losses on intangible assets 125,316 21,776 Penalty and default losses 19,340 149,437 Loss on disposals of wastes 15,231 45,480 Loss on disposals of investment in associates 19,404 15,119 Other provision expenses 65,896 - Others 47,803 45,401
₩ 650,806 809,465
2013 2012

POSCO and Subsidiaries Notes to the Consolidated Financial Statements, Continued As of December 31, 2013 and 2012
101
35. Expenses by Nature Expenses that are recorded by nature as cost of sales, selling, general and administrative expenses and other non-operating expenses in the statements of comprehensive income for the years ended December 31, 2013 and 2012 were as follows (excluding finance costs and income tax expense):
(*1) Includes depreciation expense of investment property. (*2) The details of employee benefits expenses for the years ended December 31, 2013 and 2012
were as follows:
36. Income Taxes (a) Income tax expense for the years ended December 31, 2013 and 2012 was as follows:
(in millions of Won)
Changes in inventories ₩ 12,163,136 14,161,271Cost of merchandises sold 25,909,164 25,997,220Employee benefits expenses(*2) 3,174,316 2,889,829Outsourced processing cost 9,462,946 8,896,642Depreciation expenses(*1) 2,505,536 2,405,769Amortization expenses 180,014 157,991Research & development expenses 562,647 577,449Freight and custody expenses 1,432,935 1,472,817Commissions paid 73,922 74,308Loss on disposals of property, plant and equipment 121,133 65,486Donations 60,940 73,963Other expenses 3,872,633 3,987,763
₩ 59,519,322 60,760,508
2013 2012
(in millions of Won)
Wages and salaries ₩ 2,907,442 2,647,177Severance benefit 266,874 242,652
₩ 3,174,316 2,889,829
2013 2012
(in millions of Won)
Current income taxes ₩ 615,771 795,601Deferred income tax due to temporary differences 108,034 154,324 Less: Items recorded directly in equity (132,808) 32,954Income tax expense ₩ 590,997 982,879
2013 2012
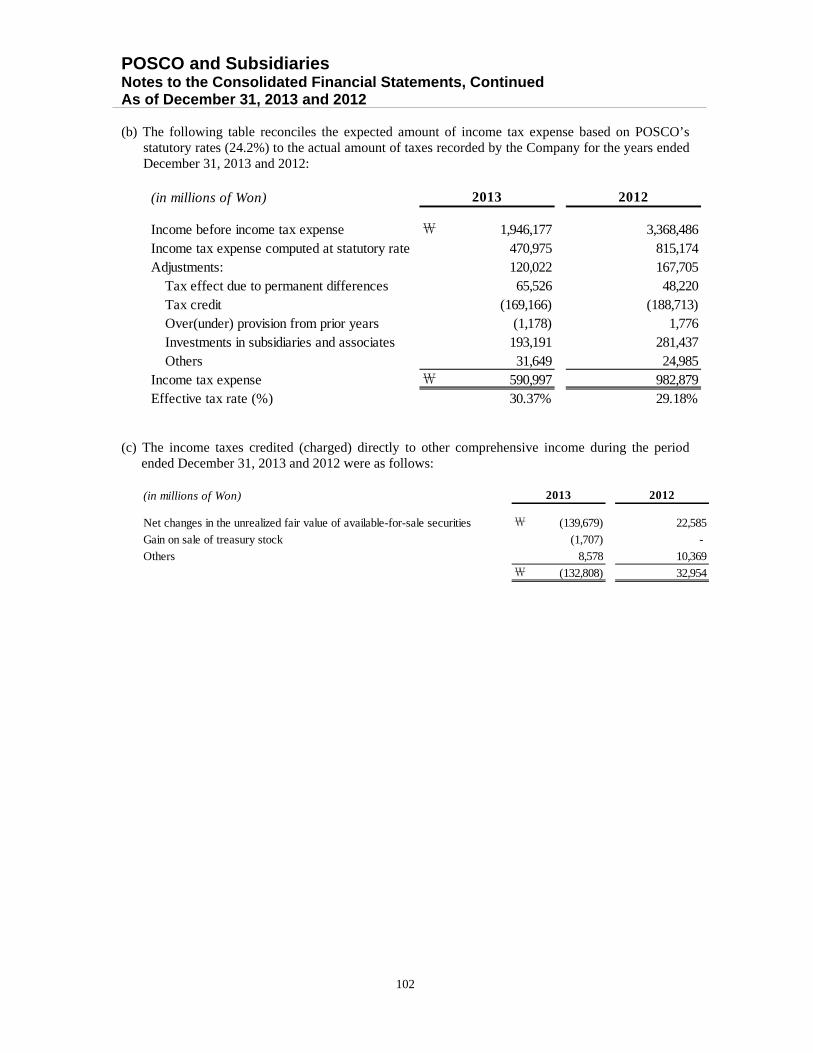
POSCO and Subsidiaries Notes to the Consolidated Financial Statements, Continued As of December 31, 2013 and 2012
102
(b) The following table reconciles the expected amount of income tax expense based on POSCO’s
statutory rates (24.2%) to the actual amount of taxes recorded by the Company for the years ended December 31, 2013 and 2012:
(c) The income taxes credited (charged) directly to other comprehensive income during the period
ended December 31, 2013 and 2012 were as follows:
(in millions of Won)
Income before income tax expense ₩ 1,946,177 3,368,486Income tax expense computed at statutory rate 470,975 815,174Adjustments: 120,022 167,705
Tax effect due to permanent differences 65,526 48,220Tax credit (169,166) (188,713)Over(under) provision from prior years (1,178) 1,776Investments in subsidiaries and associates 193,191 281,437Others 31,649 24,985
Income tax expense ₩ 590,997 982,879Effective tax rate (%) 30.37% 29.18%
2013 2012
(in millions of Won)
Net changes in the unrealized fair value of available-for-sale securities ₩ (139,679) 22,585
Gain on sale of treasury stock (1,707) -
Others 8,578 10,369₩ (132,808) 32,954
2013 2012
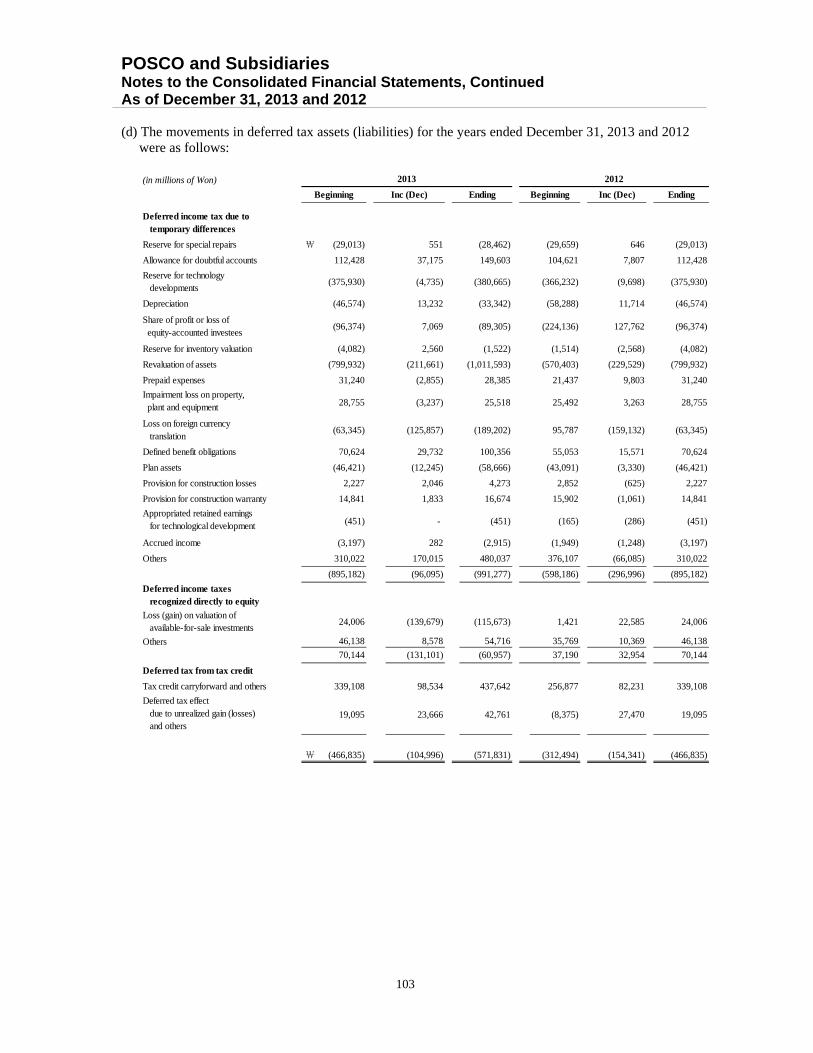
POSCO and Subsidiaries Notes to the Consolidated Financial Statements, Continued As of December 31, 2013 and 2012
103
(d) The movements in deferred tax assets (liabilities) for the years ended December 31, 2013 and 2012
were as follows:
(in millions of Won)
Inc (Dec) Ending
Reserve for special repairs ₩ (29,013) 551 (28,462) (29,659) 646 (29,013)
Allowance for doubtful accounts 112,428 37,175 149,603 104,621 7,807 112,428
(375,930) (4,735) (380,665) (366,232) (9,698) (375,930)
Depreciation (46,574) 13,232 (33,342) (58,288) 11,714 (46,574)
(96,374) 7,069 (89,305) (224,136) 127,762 (96,374)
Reserve for inventory valuation (4,082) 2,560 (1,522) (1,514) (2,568) (4,082)
(799,932) (211,661) (1,011,593) (570,403) (229,529) (799,932)
Prepaid expenses 31,240 (2,855) 28,385 21,437 9,803 31,240
28,755 (3,237) 25,518 25,492 3,263 28,755
(63,345) (125,857) (189,202) 95,787 (159,132) (63,345)
Defined benefit obligations 70,624 29,732 100,356 55,053 15,571 70,624
Plan assets (46,421) (12,245) (58,666) (43,091) (3,330) (46,421)
Provision for construction losses 2,227 2,046 4,273 2,852 (625) 2,227
Provision for construction warranty 14,841 1,833 16,674 15,902 (1,061) 14,841
(451) - (451) (165) (286) (451)
Accrued income (3,197) 282 (2,915) (1,949) (1,248) (3,197)
Others 310,022 170,015 480,037 376,107 (66,085) 310,022
(895,182) (96,095) (991,277) (598,186) (296,996) (895,182)
24,006 (139,679) (115,673) 1,421 22,585 24,006
46,138 8,578 54,716 35,769 10,369 46,138
70,144 (131,101) (60,957) 37,190 32,954 70,144
Deferred tax from tax credit
Tax credit carryforward and others 339,108 98,534 437,642 256,877 82,231 339,108
19,095 23,666 42,761 (8,375) 27,470 19,095
₩ (466,835) (104,996) (571,831) (312,494) (154,341) (466,835)
Appropriated retained earnings for technological development
Deferred tax effect due to unrealized gain (losses) and others
Others
Share of profit or loss of equity-accounted investees
Impairment loss on property, plant and equipment
Loss (gain) on valuation of available-for-sale investments
2013 2012
Beginning Inc (Dec) Ending Beginning
Deferred income tax due to temporary differences
Reserve for technology developments
Revaluation of assets
Loss on foreign currency translation
Deferred income taxes recognized directly to equity
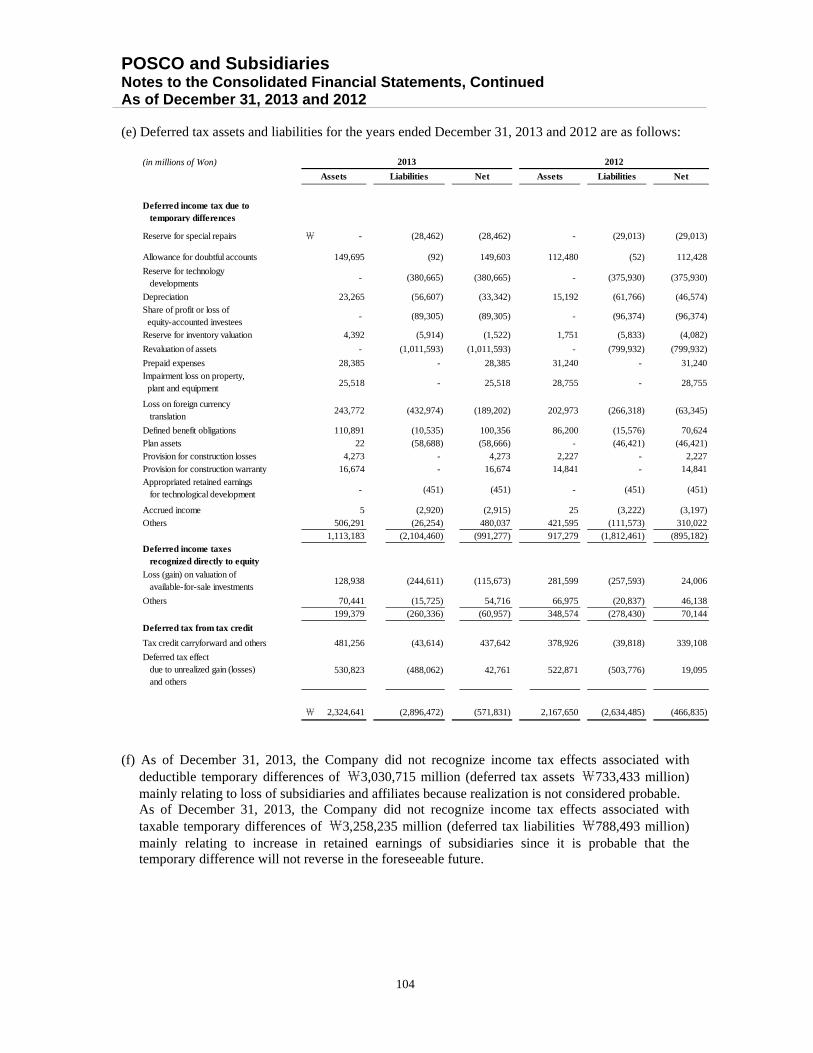
POSCO and Subsidiaries Notes to the Consolidated Financial Statements, Continued As of December 31, 2013 and 2012
104
(e) Deferred tax assets and liabilities for the years ended December 31, 2013 and 2012 are as follows:
(f) As of December 31, 2013, the Company did not recognize income tax effects associated with
deductible temporary differences of ₩3,030,715 million (deferred tax assets ₩733,433 million) mainly relating to loss of subsidiaries and affiliates because realization is not considered probable.
As of December 31, 2013, the Company did not recognize income tax effects associated with taxable temporary differences of ₩3,258,235 million (deferred tax liabilities ₩788,493 million) mainly relating to increase in retained earnings of subsidiaries since it is probable that the temporary difference will not reverse in the foreseeable future.
(in millions of Won)
Liabilities Net
Reserve for special repairs ₩ - (28,462) (28,462) - (29,013) (29,013)
Allowance for doubtful accounts 149,695 (92) 149,603 112,480 (52) 112,428
- (380,665) (380,665) - (375,930) (375,930)
Depreciation 23,265 (56,607) (33,342) 15,192 (61,766) (46,574)
- (89,305) (89,305) - (96,374) (96,374)
Reserve for inventory valuation 4,392 (5,914) (1,522) 1,751 (5,833) (4,082)
- (1,011,593) (1,011,593) - (799,932) (799,932)
Prepaid expenses 28,385 - 28,385 31,240 - 31,240
25,518 - 25,518 28,755 - 28,755
243,772 (432,974) (189,202) 202,973 (266,318) (63,345)
Defined benefit obligations 110,891 (10,535) 100,356 86,200 (15,576) 70,624Plan assets 22 (58,688) (58,666) - (46,421) (46,421)Provision for construction losses 4,273 - 4,273 2,227 - 2,227Provision for construction warranty 16,674 - 16,674 14,841 - 14,841
- (451) (451) - (451) (451)
Accrued income 5 (2,920) (2,915) 25 (3,222) (3,197)Others 506,291 (26,254) 480,037 421,595 (111,573) 310,022
1,113,183 (2,104,460) (991,277) 917,279 (1,812,461) (895,182)
128,938 (244,611) (115,673) 281,599 (257,593) 24,006
70,441 (15,725) 54,716 66,975 (20,837) 46,138199,379 (260,336) (60,957) 348,574 (278,430) 70,144
Deferred tax from tax credit
Tax credit carryforward and others 481,256 (43,614) 437,642 378,926 (39,818) 339,108
530,823 (488,062) 42,761 522,871 (503,776) 19,095
₩ 2,324,641 (2,896,472) (571,831) 2,167,650 (2,634,485) (466,835)
Deferred tax effect due to unrealized gain (losses) and others
Loss on foreign currency translation
Deferred income taxes recognized directly to equity
Loss (gain) on valuation of available-for-sale investments
Others
Impairment loss on property, plant and equipment
Appropriated retained earnings for technological development
Deferred income tax due to temporary differences
Reserve for technology developments
Revaluation of assets
Share of profit or loss of equity-accounted investees
2013 2012
Assets Liabilities Net Assets
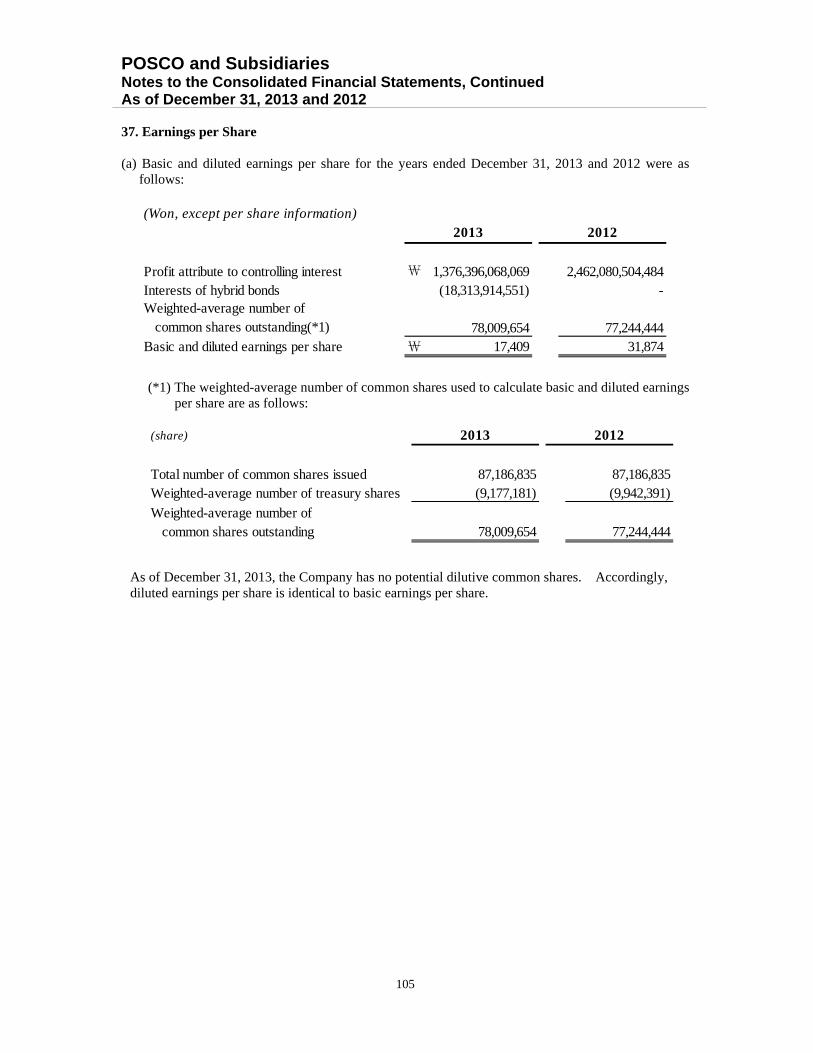
POSCO and Subsidiaries Notes to the Consolidated Financial Statements, Continued As of December 31, 2013 and 2012
105
37. Earnings per Share (a) Basic and diluted earnings per share for the years ended December 31, 2013 and 2012 were as
follows:
(*1) The weighted-average number of common shares used to calculate basic and diluted earnings per share are as follows:
As of December 31, 2013, the Company has no potential dilutive common shares. Accordingly, diluted earnings per share is identical to basic earnings per share.
(Won, except per share information)
Profit attribute to controlling interest ₩ 1,376,396,068,069 2,462,080,504,484Interests of hybrid bonds (18,313,914,551) -
78,009,654 77,244,444Basic and diluted earnings per share ₩ 17,409 31,874
Weighted-average number of common shares outstanding(*1)
2013 2012
(share)
Total number of common shares issued 87,186,835 87,186,835Weighted-average number of treasury shares (9,177,181) (9,942,391)
78,009,654 77,244,444
2013 2012
Weighted-average number of common shares outstanding
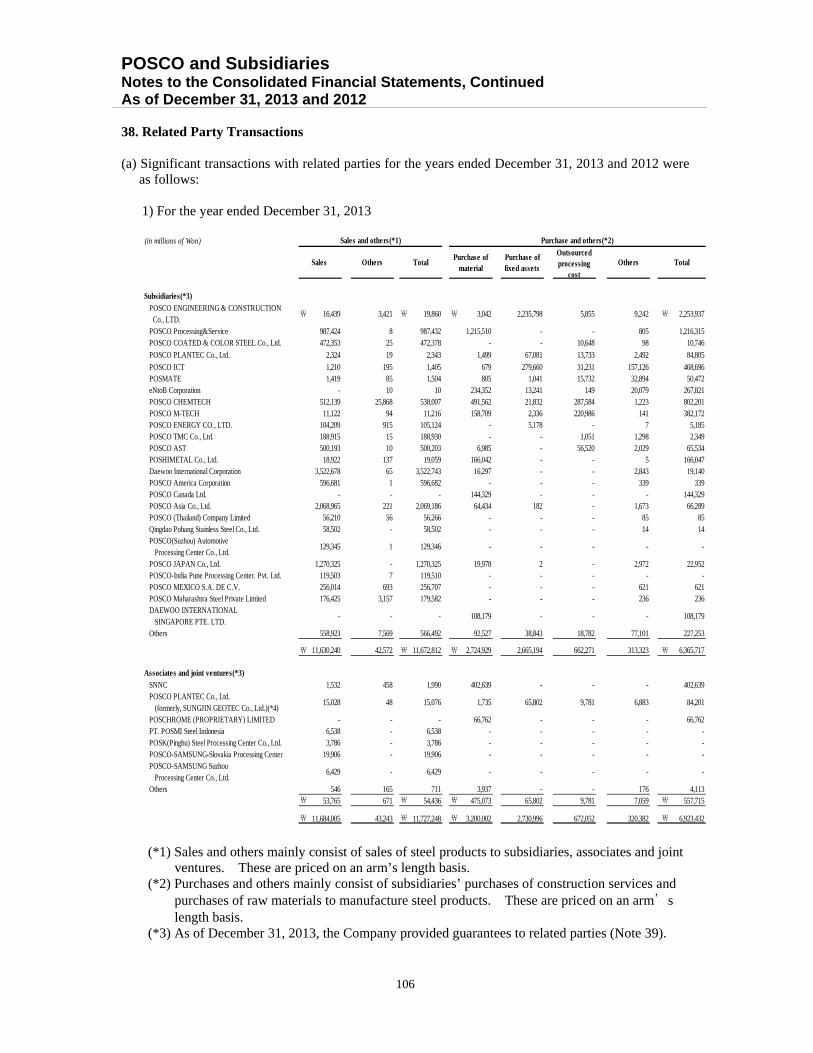
POSCO and Subsidiaries Notes to the Consolidated Financial Statements, Continued As of December 31, 2013 and 2012
106
38. Related Party Transactions (a) Significant transactions with related parties for the years ended December 31, 2013 and 2012 were
as follows:
1) For the year ended December 31, 2013
(*1) Sales and others mainly consist of sales of steel products to subsidiaries, associates and joint ventures. These are priced on an arm’s length basis.
(*2) Purchases and others mainly consist of subsidiaries’ purchases of construction services and purchases of raw materials to manufacture steel products. These are priced on an arm’s length basis.
(*3) As of December 31, 2013, the Company provided guarantees to related parties (Note 39).
(in millions of Won)
Subsidiaries(*3)POSCO ENGINEERING & CONSTRUCTION Co., LTD.
₩ 16,439 3,421 ₩ 19,860 ₩ 3,042 2,235,798 5,855 9,242 ₩ 2,253,937
POSCO Processing&Service 987,424 8 987,432 1,215,510 - - 805 1,216,315POSCO COATED & COLOR STEEL Co., Ltd. 472,353 25 472,378 - - 10,648 98 10,746
POSCO PLANTEC Co., Ltd. 2,324 19 2,343 1,499 67,081 13,733 2,492 84,805
POSCO ICT 1,210 195 1,405 679 279,660 31,231 157,126 468,696POSMATE 1,419 85 1,504 805 1,041 15,732 32,894 50,472eNtoB Corporation - 10 10 234,352 13,241 149 20,079 267,821POSCO CHEMTECH 512,139 25,868 538,007 491,562 21,832 287,584 1,223 802,201POSCO M-TECH 11,122 94 11,216 158,709 2,336 220,986 141 382,172POSCO ENERGY CO., LTD. 104,209 915 105,124 - 5,178 - 7 5,185POSCO TMC Co., Ltd. 188,915 15 188,930 - - 1,051 1,298 2,349POSCO AST 500,193 10 500,203 6,985 - 56,520 2,029 65,534POSHIMETAL Co., Ltd. 18,922 137 19,059 166,042 - - 5 166,047Daewoo International Corporation 3,522,678 65 3,522,743 16,297 - - 2,843 19,140POSCO America Corporation 596,681 1 596,682 - - - 339 339POSCO Canada Ltd. - - - 144,329 - - - 144,329POSCO Asia Co., Ltd. 2,068,965 221 2,069,186 64,434 182 - 1,673 66,289POSCO (Thailand) Company Limited 56,210 56 56,266 - - - 85 85Qingdao Pohang Stainless Steel Co., Ltd. 58,502 - 58,502 - - - 14 14POSCO(Suzhou) Automotive Processing Center Co., Ltd.
129,345 1 129,346 - - - - -
POSCO JAPAN Co., Ltd. 1,270,325 - 1,270,325 19,978 2 - 2,972 22,952POSCO-India Pune Processing Center. Pvt. Ltd. 119,503 7 119,510 - - - - -POSCO MEXICO S.A. DE C.V. 256,014 693 256,707 - - - 621 621POSCO Maharashtra Steel Private Limited 176,425 3,157 179,582 - - - 236 236DAEWOO INTERNATIONAL SINGAPORE PTE. LTD.
- - - 108,179 - - - 108,179
Others 558,923 7,569 566,492 92,527 38,843 18,782 77,101 227,253
₩ 11,630,240 42,572 ₩ 11,672,812 ₩ 2,724,929 2,665,194 662,271 313,323 ₩ 6,365,717
Associates and joint ventures(*3)SNNC 1,532 458 1,990 402,639 - - - 402,639POSCO PLANTEC Co., Ltd. (formerly, SUNGJIN GEOTEC Co., Ltd.)(*4)
15,028 48 15,076 1,735 65,802 9,781 6,883 84,201
POSCHROME (PROPRIETARY) LIMITED - - - 66,762 - - - 66,762PT. POSMI Steel Indonesia 6,538 - 6,538 - - - - -POSK(Pinghu) Steel Processing Center Co., Ltd. 3,786 - 3,786 - - - - -POSCO-SAMSUNG-Slovakia Processing Center 19,906 - 19,906 - - - - -POSCO-SAMSUNG Suzhou Processing Center Co., Ltd.
6,429 - 6,429 - - - - -
Others 546 165 711 3,937 - - 176 4,113₩ 53,765 671 ₩ 54,436 ₩ 475,073 65,802 9,781 7,059 ₩ 557,715
₩ 11,684,005 43,243 ₩ 11,727,248 ₩ 3,200,002 2,730,996 672,052 320,382 ₩ 6,923,432
Sales and others(*1) Purchase and others(*2)
Sales Others TotalPurchase of
materialPurchase offixed assets
Outsourcedprocessing
cost
Others Total
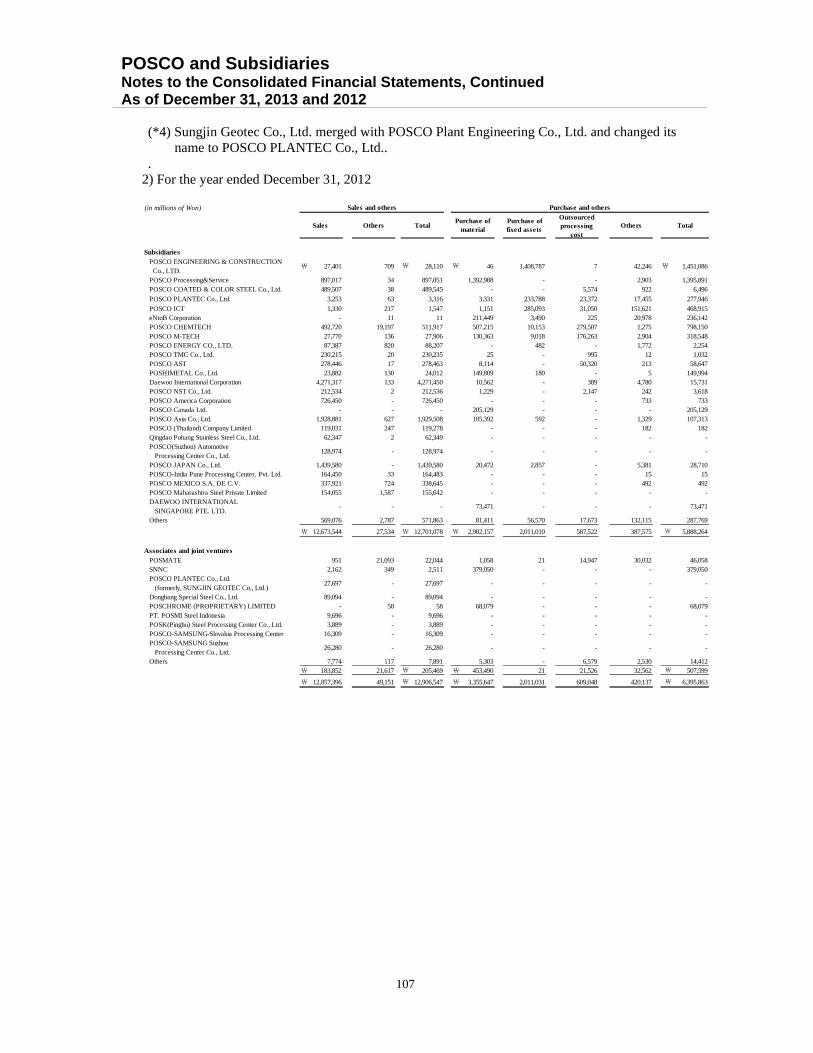
POSCO and Subsidiaries Notes to the Consolidated Financial Statements, Continued As of December 31, 2013 and 2012
107
(*4) Sungjin Geotec Co., Ltd. merged with POSCO Plant Engineering Co., Ltd. and changed its
name to POSCO PLANTEC Co., Ltd.. .
2) For the year ended December 31, 2012
(in millions of Won)
SubsidiariesPOSCO ENGINEERING & CONSTRUCTION Co., LTD.
₩ 27,401 709 ₩ 28,110 ₩ 46 1,408,787 7 42,246 ₩ 1,451,086
POSCO Processing&Service 897,017 34 897,051 1,392,988 - - 2,903 1,395,891POSCO COATED & COLOR STEEL Co., Ltd. 489,507 38 489,545 - - 5,574 922 6,496
POSCO PLANTEC Co., Ltd. 3,253 63 3,316 3,331 233,788 23,372 17,455 277,946
POSCO ICT 1,330 217 1,547 1,151 285,093 31,050 151,621 468,915eNtoB Corporation - 11 11 211,449 3,490 225 20,978 236,142POSCO CHEMTECH 492,720 19,197 511,917 507,215 10,153 279,507 1,275 798,150POSCO M-TECH 27,770 136 27,906 130,363 9,018 176,263 2,904 318,548POSCO ENERGY CO., LTD. 87,387 820 88,207 - 482 - 1,772 2,254POSCO TMC Co., Ltd. 230,215 20 230,235 25 - 995 12 1,032POSCO AST 278,446 17 278,463 8,114 - 50,320 213 58,647POSHIMETAL Co., Ltd. 23,882 130 24,012 149,809 180 - 5 149,994Daewoo International Corporation 4,271,317 133 4,271,450 10,562 - 389 4,780 15,731POSCO NST Co., Ltd. 212,534 2 212,536 1,229 - 2,147 242 3,618POSCO America Corporation 726,450 - 726,450 - - - 733 733POSCO Canada Ltd. - - - 205,129 - - - 205,129POSCO Asia Co., Ltd. 1,928,881 627 1,929,508 105,392 592 - 1,329 107,313POSCO (Thailand) Company Limited 119,031 247 119,278 - - - 182 182Qingdao Pohang Stainless Steel Co., Ltd. 62,347 2 62,349 - - - - -POSCO(Suzhou) Automotive Processing Center Co., Ltd.
128,974 - 128,974 - - - - -
POSCO JAPAN Co., Ltd. 1,439,580 - 1,439,580 20,472 2,857 - 5,381 28,710POSCO-India Pune Processing Center. Pvt. Ltd. 164,450 33 164,483 - - - 15 15POSCO MEXICO S.A. DE C.V. 337,921 724 338,645 - - - 492 492POSCO Maharashtra Steel Private Limited 154,055 1,587 155,642 - - - - -DAEWOO INTERNATIONAL SINGAPORE PTE. LTD.
- - - 73,471 - - - 73,471
Others 569,076 2,787 571,863 81,411 56,570 17,673 132,115 287,769
₩ 12,673,544 27,534 ₩ 12,701,078 ₩ 2,902,157 2,011,010 587,522 387,575 ₩ 5,888,264
Associates and joint venturesPOSMATE 951 21,093 22,044 1,058 21 14,947 30,032 46,058SNNC 2,162 349 2,511 379,050 - - - 379,050POSCO PLANTEC Co., Ltd. (formerly, SUNGJIN GEOTEC Co., Ltd.)
27,697 - 27,697 - - - - -
Dongbang Special Steel Co., Ltd. 89,094 - 89,094 - - - - -POSCHROME (PROPRIETARY) LIMITED - 58 58 68,079 - - - 68,079PT. POSMI Steel Indonesia 9,696 - 9,696 - - - - -POSK(Pinghu) Steel Processing Center Co., Ltd. 3,889 - 3,889 - - - - -POSCO-SAMSUNG-Slovakia Processing Center 16,309 - 16,309 - - - - -POSCO-SAMSUNG Suzhou Processing Center Co., Ltd.
26,280 - 26,280 - - - - -
Others 7,774 117 7,891 5,303 - 6,579 2,530 14,412₩ 183,852 21,617 ₩ 205,469 ₩ 453,490 21 21,526 32,562 ₩ 507,599
₩ 12,857,396 49,151 ₩ 12,906,547 ₩ 3,355,647 2,011,031 609,048 420,137 ₩ 6,395,863
Purchase offixed assets
Outsourcedprocessing
costOthers Total
Sales and others Purchase and others
Sales Others TotalPurchase of
material

POSCO and Subsidiaries Notes to the Consolidated Financial Statements, Continued As of December 31, 2013 and 2012
108
(b) The related account balances of significant transactions with related companies as of December 31,
2013 and 2012 are as follows:
1) December 31, 2013
(in millions of Won)
SubsidiariesPOSCO ENGINEERING & CONSTRUCTION Co., LTD.
₩ 40 110,955 ₩ 110,995 ₩ - 105,603 - ₩ 105,603
POSCO Processing&Service 103,400 73 103,473 17,914 683 - 18,597POSCO COATED & COLOR STEEL Co., Ltd. 69,260 65 69,325 - 59 1,434 1,493POSCO ICT 75 123 198 - 51,247 - 51,247POSMATE 489 1,533 2,022 141 3,274 1,058 4,473eNtoB Corporation - - - 8,057 10,311 - 18,368POSCO CHEMTECH 46,943 4,313 51,256 35,829 6,983 8,663 51,475POSCO M-TECH 18 28 46 12,020 21,326 10,799 44,145POSCO ENERGY CO., LTD. 14,733 2,894 17,627 - 421 - 421POSCO TMC Co., Ltd. 20,510 26 20,536 - 16 50 66POSCO AST 85,501 53 85,554 - 3,004 5,238 8,242POSHIMETAL Co., Ltd. 1,721 12 1,733 - 12,624 - 12,624Daewoo International Corporation 148,383 878 149,261 9,319 - - 9,319POSCO America Corporation 57,554 - 57,554 - - - -POSCO Canada Ltd. - - - 12,323 - - 12,323POSCO Asia Co., Ltd. 134,602 142 134,744 2,063 - - 2,063POSCO (Thailand) Company Limited 6,052 7 6,059 - - - -Qingdao Pohang Stainless Steel Co., Ltd. 3,329 - 3,329 - - - -POSCO JAPAN Co., Ltd. 73,992 - 73,992 862 108 1 971POSCO-India Pune Processing Center. Pvt. Ltd. 8,117 - 8,117 - - - -POSCO MEXICO S.A. DE C.V. 100,016 76 100,092 - - - -POSCO Maharashtra Steel Private Limited 55,392 3,218 58,610 - - - -Others 54,357 8,887 63,244 6,523 15,421 1,647 23,591
₩ 984,484 133,283 ₩ 1,117,767 ₩ 105,051 231,080 28,890 ₩ 365,021
Associates and joint venturesSNNC 140 40 180 16,669 - - 16,669
POSCO PLANTEC Co., Ltd. (formerly, SUNGJIN GEOTEC Co., Ltd.)
879 46 925 353 - - 353
POSCHROME (PROPRIETARY) LIMITED - 67 67 - - - -LLP POSUK Titanium - 4,066 4,066 - - - -
Others - 17 17 319 2 - 321
₩ 1,019 4,236 ₩ 5,255 ₩ 17,341 2 - ₩ 17,343
₩ 985,503 137,519 ₩ 1,123,022 ₩ 122,392 231,082 28,890 ₩ 382,364
Receivables Payables
Trade accounts andnotes receivable
Others TotalTrade accounts and
notes payableAccountspayable
Others Total
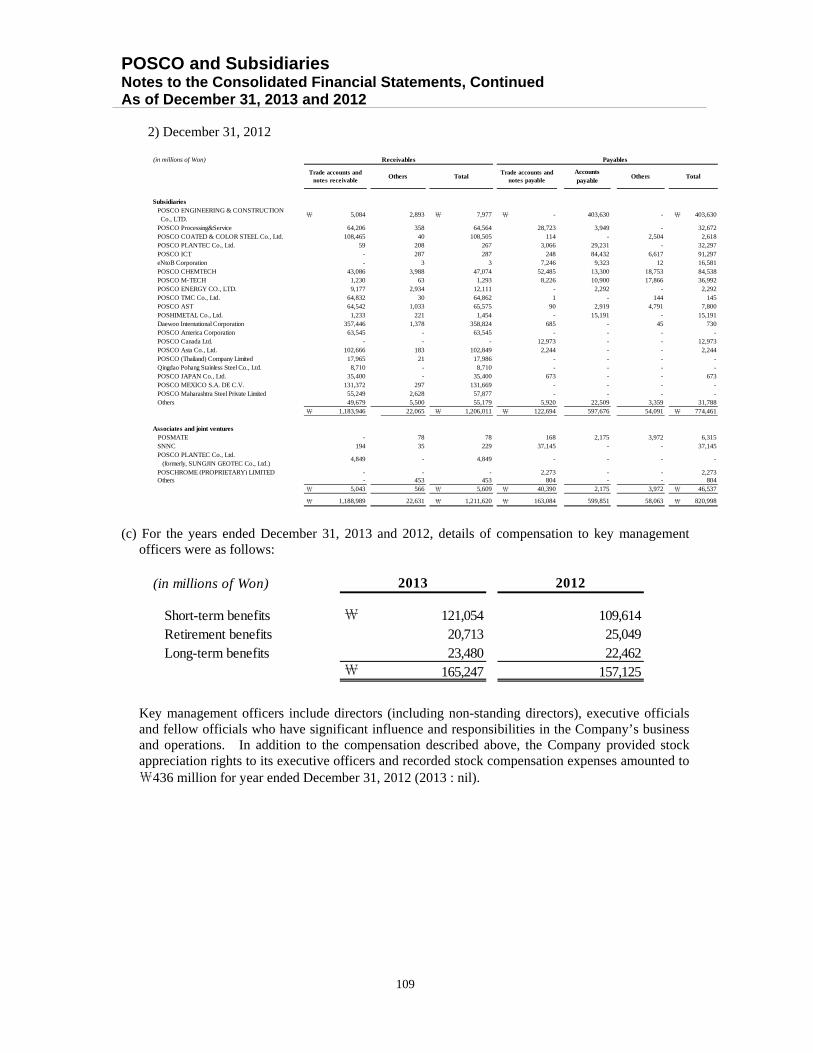
POSCO and Subsidiaries Notes to the Consolidated Financial Statements, Continued As of December 31, 2013 and 2012
109
2) December 31, 2012
(c) For the years ended December 31, 2013 and 2012, details of compensation to key management
officers were as follows:
Key management officers include directors (including non-standing directors), executive officials and fellow officials who have significant influence and responsibilities in the Company’s business and operations. In addition to the compensation described above, the Company provided stock appreciation rights to its executive officers and recorded stock compensation expenses amounted to ₩436 million for year ended December 31, 2012 (2013 : nil).
(in millions of Won)
SubsidiariesPOSCO ENGINEERING & CONSTRUCTION Co., LTD.
₩ 5,084 2,893 ₩ 7,977 ₩ - 403,630 - ₩ 403,630
POSCO Processing&Service 64,206 358 64,564 28,723 3,949 - 32,672POSCO COATED & COLOR STEEL Co., Ltd. 108,465 40 108,505 114 - 2,504 2,618POSCO PLANTEC Co., Ltd. 59 208 267 3,066 29,231 - 32,297POSCO ICT - 287 287 248 84,432 6,617 91,297eNtoB Corporation - 3 3 7,246 9,323 12 16,581POSCO CHEMTECH 43,086 3,988 47,074 52,485 13,300 18,753 84,538POSCO M-TECH 1,230 63 1,293 8,226 10,900 17,866 36,992POSCO ENERGY CO., LTD. 9,177 2,934 12,111 - 2,292 - 2,292POSCO TMC Co., Ltd. 64,832 30 64,862 1 - 144 145POSCO AST 64,542 1,033 65,575 90 2,919 4,791 7,800POSHIMETAL Co., Ltd. 1,233 221 1,454 - 15,191 - 15,191Daewoo International Corporation 357,446 1,378 358,824 685 - 45 730POSCO America Corporation 63,545 - 63,545 - - - -POSCO Canada Ltd. - - - 12,973 - - 12,973POSCO Asia Co., Ltd. 102,666 183 102,849 2,244 - - 2,244POSCO (Thailand) Company Limited 17,965 21 17,986 - - - -Qingdao Pohang Stainless Steel Co., Ltd. 8,710 - 8,710 - - - -POSCO JAPAN Co., Ltd. 35,400 - 35,400 673 - - 673POSCO MEXICO S.A. DE C.V. 131,372 297 131,669 - - - -POSCO Maharashtra Steel Private Limited 55,249 2,628 57,877 - - - -Others 49,679 5,500 55,179 5,920 22,509 3,359 31,788
₩ 1,183,946 22,065 ₩ 1,206,011 ₩ 122,694 597,676 54,091 ₩ 774,461
Associates and joint ventures POSMATE - 78 78 168 2,175 3,972 6,315
SNNC 194 35 229 37,145 - - 37,145POSCO PLANTEC Co., Ltd. (formerly, SUNGJIN GEOTEC Co., Ltd.)
4,849 - 4,849 - - - -
POSCHROME (PROPRIETARY) LIMITED - - - 2,273 - - 2,273Others - 453 453 804 - - 804
₩ 5,043 566 ₩ 5,609 ₩ 40,390 2,175 3,972 ₩ 46,537
₩ 1,188,989 22,631 ₩ 1,211,620 ₩ 163,084 599,851 58,063 ₩ 820,998
Others Total
Receivables Payables
Trade accounts andnotes receivable
Others TotalTrade accounts and
notes payableAccountspayable
(in millions of Won)
Short-term benefits ₩ 121,054 109,614Retirement benefits 20,713 25,049Long-term benefits 23,480 22,462
₩ 165,247 157,125
2013 2012
POSCO and Subsidiaries Notes to the Consolidated Financial Statements, Continued As of December 31, 2013 and 2012
110
39. Commitments and Contingencies (a) Contingent liabilities
Contingent liabilities may develop in a way not initially expected. Therefore, management continuously assesses contingent liabilities to determine whether an outflow of resources embodying economic benefits has become probable. If it becomes probable that an outflow of future economic benefits will be required for an item previously dealt with as a contingent liability, a provision is recognized in the financial statements of the period in which the change in probability occurs (except in the extremely rare circumstances where no reliable estimate can be made).
Management makes estimates and assumptions that affect disclosures of commitments and contingencies. All estimates and assumptions are based on the evaluation of current circumstances and appraisals with the supports of internal specialists or external consultants.
Management regularly analyzes current information about these matters and provides provisions for probable contingent losses including the estimate of legal expense to resolve the matters. Internal and external lawyers are used for these assessments. In making the decision regarding the need for provisions, management considers the degree of probability of an unfavorable outcome and the ability to make a sufficiently reliable estimate of the amount of loss.

POSCO and Subsidiaries Notes to the Consolidated Financial Statements, Continued As of December 31, 2013 and 2012
111
(b) Details of guarantees
(in millions of Won)Guarantors Guarantee beneficiary Financial institution Won Eequivalent
[The Company]POSCO POSCO (Guangdong) Automotive
Steel Co., Ltd.BOC CNY 350,000,000 60,932BOA and others USD 280,000,000 295,484
POSCO Maharashtra Steel Private Limited POSCO VST CO., LTD. ANZ and others USD 65,000,000 68,595 POSCO MEXICO S.A. DE C.V. HSBC and others USD 244,725,000 258,258 POSCO-VIETNAM Co., Ltd. Export-Import Bank of Korea USD 196,000,000 206,839 Zeus II (Cayman) Ltd. Creditor JPY 25,779,278,600 258,994 Zhangjiagang Pohang Stainless Steel Co., Ltd. POSCO ASSAN TST STEEL INDUSTRY POSCO Electrical Steel India Private Limited
PT. KRAKATAU POSCOExport-Import Bank of Korea and others
USD 1,350,300,000 1,424,972
Daewoo International Corporation
Daewoo Paper Manufacturing Co., Ltd. HSBC USD 12,500,000 13,191
DAEWOO TEXTILE BUKHARA LLC Export-Import Bank of Korea USD 20,000,000 21,106 DAEWOO INTERNATIONAL MEXICO S.A. DE C.V. POSCO ASSAN TST STEEL INDUSTRY Brazil Sao Paulo Steel Processing Center Daewoo International (Deutschland) GmbH. EUR 15,000,000 21,844 PT. Bio Inti Agrindo Export-Import Bank of Korea USD 30,000,000 31,659
POSCO ENGINEERING & CONSTRUCTION CO., LTD.
HONG KONG POSCO E&C (CHINA) INVESTMENT Co., Ltd.
Woori Bank and others USD 135,000,000 142,466
INTERNATIONAL BUSINESS CENTER CORPORATION
Export-Import Bank of Korea USD 20,000,000 21,106
POSCO E&C Vietnam Co., Ltd. Export-Import Bank of Korea USD 16,500,000 17,412SANTOSCMI S.A. CITI Equador and others USD 36,000,000 37,991
POSCO Processing&Service POSCO Canada Ltd. Hana Bank USD 12,484,500 13,175POSCO Gulf SFC LLC KEB bank USD 20,000,000 21,106
POSCO ICT PT.POSCO ICT INDONESIA POSCO Investment Co., Ltd. USD 3,000,000 3,166KEB bank GBP 3,500,000 6,092POSCO Investment Co., Ltd. USD 4,000,000 4,221
POSCO ENERGY CO., LTD. PT. KRAKATAU POSCO ENERGYExport-Import Bank of Korea and others
USD 193,900,000 204,623
TECHREN Solar, LLC Woori Bank USD 3,000,000 3,166POSCO Engineering CO., Ltd KEB bank USD 6,818,876 7,196
KEB Bank and others IDR 82,727,107,048 7,148POSCO ENGINEERING (THAILAND) Citi Bank USD 15,300,000 16,146 CO., LTD. Woori Bank and others THB 6,342,881,200 203,860
POSCO-Japan Co., Ltd. POSCO-JEPC Co., Ltd. Mizuho Bank and others JPY 1,944,160,748 19,532POSCO-JKPC Co., Ltd. Higo bank and others JPY 1,050,400,000 10,553POSCO-JOPC Co., Ltd. Kiyo bank and others JPY 112,500,000 1,130Xenesys Inc. Aozora Bank JPY 250,000,000 2,512
DAEWOO TEXTILE FERGANA LLC DAEWOO TEXTILE BUKHARA LLC NBU USD 3,037,183 3,205POSCO E&C CHINA Co., Ltd. HONG KONG POSCO E&C
(CHINA) INVESTMENT Co., Ltd.POSCO-China Holding Corp. POSCO YongXin Rare Earth Metal Co., Ltd. KEB Bank and others CNY 71,820,000 12,503
POSCO CHEMTECH PT.Krakatau Posco Chemtech Calcination and others
KEB Bank and others USD 55,130,000 58,179
POSCO Specialty Steel Co., Ltd. POSCO SS-VINA Export-Import Bank of Korea USD 354,409,800 374,009
SANTOSCMI S.A. COMPANIADEAUTOMATIZACION &CONTROL, GENESYS S.A.
Banco de Guayaquil and others USD 1,550,000 1,636
PT PEN INDONESIA
Woori Bank(Beijing branch) USD 33,000,000 34,825
SMBC USD 20,000,000 21,106
Shinhan Bank
VECTUS LIMITED
NOVA SCOTIA USD 30,000,000 31,659
ING and others USD 20,932,500 22,090
SMBC and others USD 188,392,500 198,811
ING and others USD 83,784,000 88,417
Export-Import Bank of Korea and others
USD 566,069,000 597,373
MIZUHO and others USD 160,000,000 168,848
Foreign Currency
SMBC and others USD 157,600,000 166,315
POSCO Investment Co., Ltd.

POSCO and Subsidiaries Notes to the Consolidated Financial Statements, Continued As of December 31, 2013 and 2012
112
(c) POSCO ENGINEERING & CONSTRCTION Co., Ltd. has provided the completion guarantees for Samsung C&T Corporation amounting to ₩1,142,459 million while Samsung C&T Corporation has provided the construction guarantees or payment guarantees on customers’ borrowings on behalf of POSCO ENGINEERING & CONSTRCTION Co., Ltd. amounting to ₩801,676 million as of December 31, 2013. POSCO ENGINEERING & CONSTRCTION Co., Ltd. provides payment guarantees on borrowings of customers such as Asset Backed Commercial Paper amounted to ₩650,800 million and Project Financing loan amounted to ₩38,800 million as of December 31, 2013.
(in millions of Won)Guarantors Guarantee beneficiary Financial institution Won Eequivalen
[Associates and joint ventures]POSCO United Spiral Pipe, LLC Shinhan Bank USD 24,500,000 25,855
LLP POSUK Titanium Shinhan Bank USD 18,000,000 18,995
Daewoo International Corporation DMSA/AMSAExport-Import Bank of Korea and others
USD 165,133,333 174,265
GLOBAL KOMSCO Daewoo LLCExport-Import Bank of Korea and others
USD 8,050,000 8,495
POSCO ENGINEERING & Taegisan Wind Power Corporation KDB Bank KRW 7,500 7,500 CONSTRUCTION CO., LTD. Posco e&c Songdo International Building Hana Bank and others KRW 356,600 356,600
CHUNGJU ENTERPRISE CITY DEVELOPMENT Co., Ltd and others
NH Bank and others KRW 318,226 318,226
POSCO Engineering CO., Ltd PT. Wampu Electric Power Woori Bank USD 344,848 364POSCO Processing&Service Sebang Steel Shinhan Bank JPY 245,000,000 2,461POSCO ICT UITrans LRT Co., Ltd. Construction Guarantee Cooperative KRW 64,638 64,638
Incheon-Gimpo Expressway Co., Ltd. KDB Bank and others KRW 175,000 175,000 CHUNGJU ENTERPRISE CITY DEVELOPMENT Co., Ltd
NH Bank KRW 2,530 2,530
Daewoo (China) Co., Ltd. SHANGHAI LANSHENG DAEWOO CORP.
POSCO CHEMTECH PT.INDONESIA POS CHEMTECH CHOSUN Ref
[Others]Daewoo International Ambatovy Project Export-Import Bank of Corporation Investments Limited Korea
Sherritt International Export-Import Bank of Corporation Korea
POSCO ENGINEERING & CONSTRUCTION CO., LTD.
NH Bank and others KRW 853,150 853,150
THE GALE INVESTMENTS COMPANY, L.L.C.
Woori Bank USD 50,000,000 52,765
POSCO ICT BTL business and othersKyobo Life Insurance Co.,Ltd and others
KRW 2,065,471 2,065,471
SMS Energy and others Hana Bank and others KRW 169,156 169,156
POSCO M-TECH PYUNGSAN SI Co., Ltd Seoul Guarantee Insurance Co., Ltd. KRW 67 67
POSCO AUSTRALIA PTY LTD
Department of Trade and Investment (NSW Government)
Woori Bank AUD 8,023,765 7,542
POSCO Engineering CO., Ltd Kwanma Solar Co., Ltd. and others Hana Bank and others KRW 57,124 57,124
PT MPM and othersExport-Import Bank of Korea and others
USD 7,652,000 8,075
Hyundai ENG Co., Ltd. Engineering Financial Cooperative KRW 35,933 35,933
USD 4,705,386,266 4,965,596AUD 8,023,765 7,542CNY 521,820,000 90,844EUR 15,000,000 21,844GBP 3,500,000 6,092IDR 82,727,107,048 7,148JPY 29,381,339,348 295,182
KRW 4,105,395 4,105,395THB 6,342,881,200 203,860
The union of City environment improvement for Kukje building and others
USD 65,454,545 69,074
USD 21,818,181 23,025
Foreign Currency
Bank of Communications CNY 100,000,000 17,409
KEB Bank USD 6,000,000 6,332
POSCO and Subsidiaries Notes to the Consolidated Financial Statements, Continued As of December 31, 2013 and 2012
113
(d) Other commitments Details of other commitments of the Company as of December 31, 2013, are as follows:
POSCO POSCO entered into long-term contracts to purchase iron ore, coal, nickel and others. Thecontracts of iron ore and coal generally have terms of more than three years and the contractsof nickel have terms of more than one year. These contracts provide for periodic priceadjustments based on the market price. As of December 31, 2013, 193 million tons of iron oreand 14 million tons of coal remained to be purchased under such long-term contracts.
POSCO entered into an agreement with Tangguh Liquefied Natural Gas (LNG) Consortium inIndonesia to purchase 550 thousand tons of LNG annually for 20 years commencing in August2005. The purchase price is subject to change, based on changes of the monthly standard oilprice (JCC) and with a price ceiling.
As of December 31, 2013, POSCO entered into commitments with Korea National OilCorporation for long-term foreign currency borrowings, which are limited up to the amount ofUSD 6.86 million, USD 6.58 million and USD 4.12 million. The borrowings are related to theexploration of gas hydrates in Aral Sea, Uzbekistan, the exploration of gas hydrates inNamangan-Chust and the exploration of gas hydrates in Western Fergana-Chenavard,respectively. The repayment of the borrowings depends on the success of the projects.POSCO is not liable for the repayment of full or part of the money borrowed if the respectiveprojects fail. POSCO has agreed to pay a certain portion of its profits under certain conditions,as defined by the borrowing agreements.
POSCO has provided a supplemental funding agreement, as the largest shareholder, asrequested from the creditors, including Norddeutsche Landesbank, for seamless funding toPOSCO ENERGY Co., Ltd. under construction of new power plant.
POSCO ENGINEERING & CONSTRUCTION CO., LTD.
As of December 31, 2013, POSCO ENGINEERING & CONSTRUCTION CO., LTD. hascomprehensive loan agreements of up to ₩247,000 million and USD 408 million with WooriBank and ₩53,000 million with Korea Exchange Bank. Also, POSCO ENGINEERING &CONSTRUCTION CO., LTD. has bank overdraft agreements of up to ₩20,000 million withWooriBank which is included in the limit of comprehensive loan agreements and ₩3,000million with Korea Exchange Bank.
POSCO ICT As of December 31, 2013, in relation to contract enforcement, POSCO ICT was provided with₩58,954 million and ₩49,383 million guaranties from Korea Software Financial Cooperativeand Seoul Guarantee Insurance, respectively.
As of December 31, 2013, POSCO ICT provided ₩324 million of guaranties to SeoulGuarantee Insurance to ensure performance guarantee agreement which Busan NavyResidence and others had.
POSCO Specialty Steel Co., Ltd.
As of December 31, 2013, POSCO Specialty Steel Co., Ltd. has agreements for a loan andimport letter of credit with Korea Exchange Bank and others.
POSCO and Subsidiaries Notes to the Consolidated Financial Statements, Continued As of December 31, 2013 and 2012
114
(e) Litigation in progress As of December 31, 2013, POSCO and certain subsidiaries are defendants in legal actions arising from the normal course of business. 1) Civil lawsuits with Nippon Steel & Sumitomo Metal Corporation
During the year ended December 31, 2012, Nippon Steel & Sumitomo Metal Corporation filed a civil lawsuit in the Tokyo District Court of Japan against POSCO and POSCO Japan Co., Ltd., a subsidiary of POSCO, to prohibit production and sales of grain oriented electrical steel sheets using improperly acquired trade secrets and seeking compensation from the Company of JPY 98.6 billion (₩990.6 billion). Through trials up to December 31, 2013, the Company submitted its responses that the Japan court did not have jurisdiction on this lawsuit as it should be judged by Korean law and the Company developed grain oriented electrical steel sheets using the Company’s own technologies. As of December 31, 2013, the Japan court has not made any judgments on this matter. Since the Company does not believe that it is probable that an outflow of resources will be required, the Company has not recorded any provision for this lawsuit as of December 31, 2013. In addition, Nippon Steel & Sumitomo Metal Corporation filed a civil lawsuit in the New Jersey federal court, United States, against POSCO and POSCO America Co., Ltd., a subsidiary of POSCO, claiming infringement of intellectual property rights related to the production of grain oriented electrical steel sheets. As of December 31, 2013, no claim amount has been made and the Company is under discovery proceedings related to this matter. Due to the early stage of the litigation and the inherent uncertainties, the Company is not able to reliably estimate the amount of compensation and timing, if any, that might be awarded to Nippon Steel & Sumitomo Metal Corporation. Consequently, it is not possible for the Company to make an estimate of the expected financial effect that will result from the ultimate resolution of this civil lawsuit. Therefore, the Company has not recorded any provision for this lawsuit in the U.S. as of December 31, 2013.
2) Lawsuits related to liability of Daewoo Co., Ltd. which was spun off into Daewoo International Corporation and Daewoo Engineering & Construction Co., Ltd.
In May 2002, Industrial Development Bank of India Limited, the creditor of Daewoo Motors India Ltd. for which Daewoo Co., Ltd. provided a guarantee, filed lawsuits against Daewoo Motors India Ltd., Daewoo Co., Ltd., Daewoo Engineering & Construction Co., Ltd, and Daewoo International Corporation (a subsidiary of POSCO) seeking for the disposition of assets and judgment of debt of Daewoo Motors India Ltd. amounting to ₩76 billion in India Delhi Mumbai Court. Management of the Company has assessed the likelihood of the outcome of this matter and estimated the amount of possible loss and has made the contingency provision of ₩23.3 billion for these lawsuits as of December 31, 2013.
POSCO and Subsidiaries Notes to the Consolidated Financial Statements, Continued As of December 31, 2013 and 2012
115
3) Other lawsuits and claims
For all other lawsuits and claims, the Company believes that although the outcome of these matters is uncertain, the impact of these matters is not expected to be material to the Company.
(f) Other contingencies
(In millions of Won, in thousand of foreign currencies)
Company Legal actions Korean wonequivalent Description
POSCO 37 KRW 68,963 68,963 Lawsuit on claim for damagesPOSCO ENGINEERING & CONSTRUCTION CO., LTD. 84 KRW 110,619 110,619 Lawsuit on claim for paymentPOSCO Processing&Service 2 KRW 705 705 Lawsuit on claim for paymentPOSCO COATED & COLOR STEEL Co., Ltd. 2 KRW 3,595 3,595 Lawsuit on claim for paymentPOSCO ICT 14 KRW 7,333 7,333 Lawsuit on claim for paymentPOSCO America Corporation 1 USD - - Lawsuit on Anti-TrustPOSCO M-TECH 1 KRW 19 19 Lawsuit on claim for paymentPOSCO E&C CHINA Co., Ltd. 1 CNY 37,000 6,441 Lawsuit on claim for paymentPOSCO-Malaysia SDN. BHD. 1 MYR 5,782 1,852 Lawsuit on claim for payment
POSCO Engineering CO., Ltd 7 KRW 2,789 2,789Lawsuit on claim for payment on construction by Samyanginnochem
Daewoo International (America) Corp. 3 USD 13,042 13,763Lawsuit on claim for product liability and illegal act on products
Brazil Sao Paulo Steel Processing Center 3 BRL 978 437 Lawsuit on claim for payment
Daewoo International Corporation 2 CNY 42,201 7,347Lawsuit on claim for indemnification damages
2 EUR 8,270 12,043 Lawsuit on claim for damages3 KRW 1,175 1,175 Lawsuit on claim for payment7 USD 45,787 48,319 Lawsuit on claim for damages
claim amount
Company POSCO
POSCO ENGINEERING & CONSTRUCTION CO., LTD.
Daewoo International Corporation
POSCO ICT
DescriptionPOSCO has provided two blank promissory notes and one blank check to Korea Resources Corporation and six blank promissory notes andthree blank checks to Korea National Oil Corporation as collateral for out-standing loans.
As of December 31, 2013, POSCO ENGINEERING & CONSTRUCTION CO., LTD. has provided twenty-six blank checks and ten blankpromissory notes as collateral for agreements and outstanding loans.
As of December 31, 2013, Daewoo International Corporation has provided forty-five blank promissory notes and thirteen blank checks toKorea National Oil Corporation as collateral for the guarantee on performance for contracts and others.
As of December 31, 2013, POSCO ICT has provided eight blank promissory notes and fourteen blank checks to financial institutions ascollateral for the guarantee on performance for contracts and others.
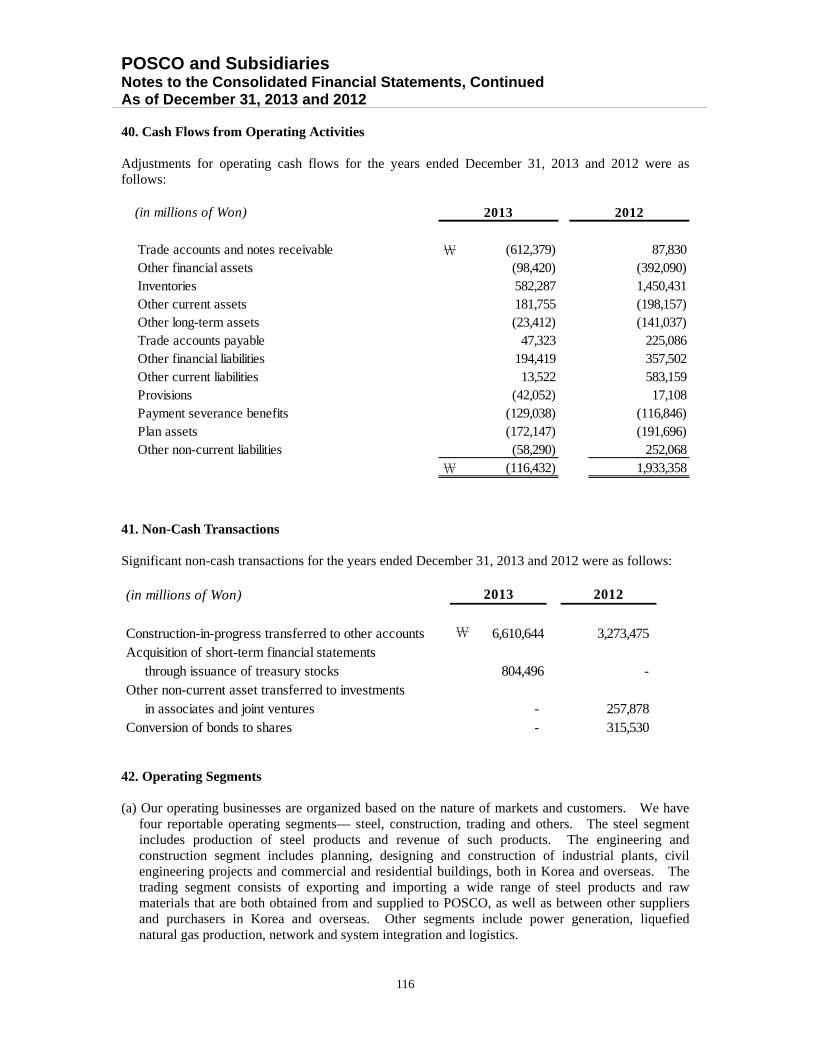
POSCO and Subsidiaries Notes to the Consolidated Financial Statements, Continued As of December 31, 2013 and 2012
116
40. Cash Flows from Operating Activities Adjustments for operating cash flows for the years ended December 31, 2013 and 2012 were as follows:
41. Non-Cash Transactions Significant non-cash transactions for the years ended December 31, 2013 and 2012 were as follows:
42. Operating Segments (a) Our operating businesses are organized based on the nature of markets and customers. We have
four reportable operating segments— steel, construction, trading and others. The steel segment includes production of steel products and revenue of such products. The engineering and construction segment includes planning, designing and construction of industrial plants, civil engineering projects and commercial and residential buildings, both in Korea and overseas. The trading segment consists of exporting and importing a wide range of steel products and raw materials that are both obtained from and supplied to POSCO, as well as between other suppliers and purchasers in Korea and overseas. Other segments include power generation, liquefied natural gas production, network and system integration and logistics.
(in millions of Won)
Trade accounts and notes receivable ₩ (612,379) 87,830Other financial assets (98,420) (392,090)Inventories 582,287 1,450,431Other current assets 181,755 (198,157)Other long-term assets (23,412) (141,037)Trade accounts payable 47,323 225,086Other financial liabilities 194,419 357,502Other current liabilities 13,522 583,159Provisions (42,052) 17,108Payment severance benefits (129,038) (116,846)
Plan assets (172,147) (191,696)Other non-current liabilities (58,290) 252,068
₩ (116,432) 1,933,358
2013 2012
(in millions of Won)
Construction-in-progress transferred to other accounts ₩ 6,610,644 3,273,475 Acquisition of short-term financial statements through issuance of treasury stocks 804,496 -
- 257,878 Conversion of bonds to shares - 315,530
2013 2012
Other non-current asset transferred to investments in associates and joint ventures
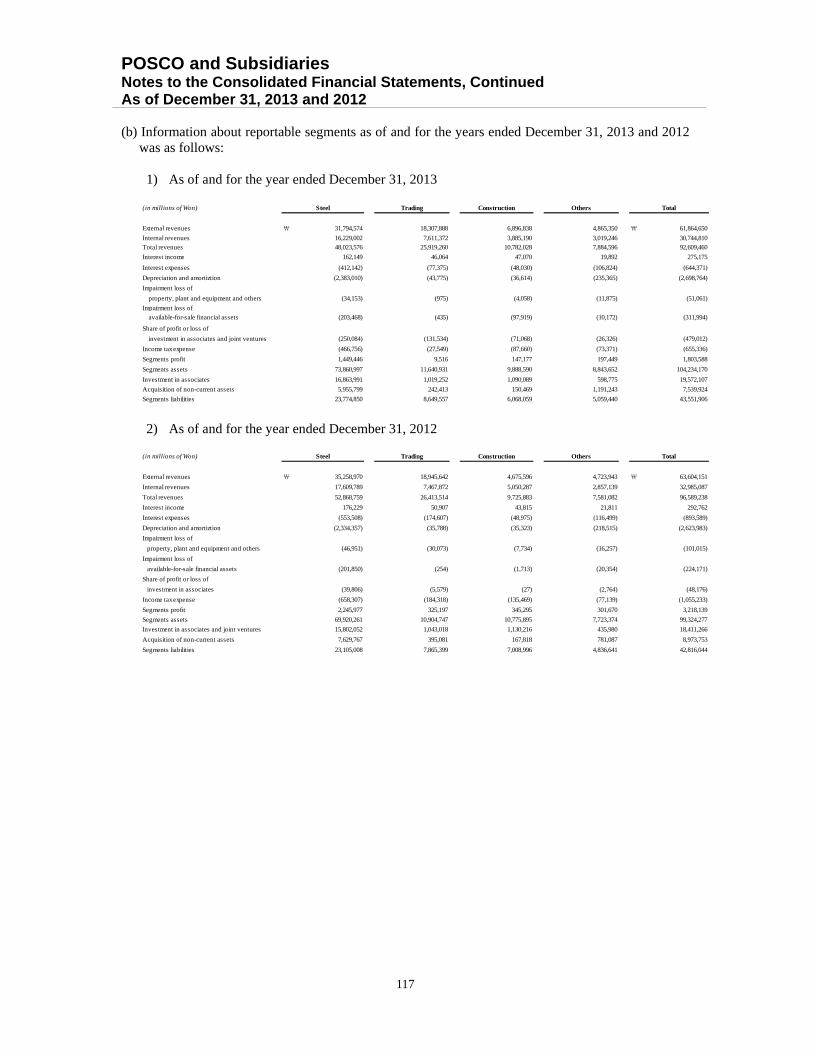
POSCO and Subsidiaries Notes to the Consolidated Financial Statements, Continued As of December 31, 2013 and 2012
117
(b) Information about reportable segments as of and for the years ended December 31, 2013 and 2012
was as follows:
1) As of and for the year ended December 31, 2013
2) As of and for the year ended December 31, 2012
(in millions of Won)
External revenues ₩ 31,794,574 18,307,888 6,896,838 4,865,350 ₩ 61,864,650
Internal revenues 16,229,002 7,611,372 3,885,190 3,019,246 30,744,810Total revenues 48,023,576 25,919,260 10,782,028 7,884,596 92,609,460
Interest income 162,149 46,064 47,070 19,892 275,175
Interest expenses (412,142) (77,375) (48,030) (106,824) (644,371)
Depreciation and amortiztion (2,383,010) (43,775) (36,614) (235,365) (2,698,764)
Impairment loss of
property, plant and equipment and others (34,153) (975) (4,058) (11,875) (51,061)
Impairment loss of available-for-sale financial assets (203,468) (435) (97,919) (10,172) (311,994)
Share of profit or loss of
investment in associates and joint ventures (250,084) (131,534) (71,068) (26,326) (479,012)
Income tax expense (466,756) (27,549) (87,660) (73,371) (655,336)
Segments profit 1,449,446 9,516 147,177 197,449 1,803,588
Segments assets 73,860,997 11,640,931 9,888,590 8,843,652 104,234,170
Investment in associates 16,863,991 1,019,252 1,090,089 598,775 19,572,107
Acquisition of non-current assets 5,955,799 242,413 150,469 1,191,243 7,539,924
Segments liabilities 23,774,850 8,649,557 6,068,059 5,059,440 43,551,906
Steel Trading Construction Others Total
(in millions of Won)
External revenues ₩ 35,258,970 18,945,642 4,675,596 4,723,943 ₩ 63,604,151
Internal revenues 17,609,789 7,467,872 5,050,287 2,857,139 32,985,087
Total revenues 52,868,759 26,413,514 9,725,883 7,581,082 96,589,238
Interest income 176,229 50,907 43,815 21,811 292,762
Interest expenses (553,508) (174,607) (48,975) (116,499) (893,589)
Depreciation and amortiztion (2,334,357) (35,788) (35,323) (218,515) (2,623,983)
Impairment loss of
property, plant and equipment and others (46,951) (30,073) (7,734) (16,257) (101,015)
Impairment loss of
available-for-sale financial assets (201,850) (254) (1,713) (20,354) (224,171)
Share of profit or loss of
investment in associates (39,806) (5,579) (27) (2,764) (48,176)
Income tax expense (658,307) (184,318) (135,469) (77,139) (1,055,233)
Segments profit 2,245,977 325,197 345,295 301,670 3,218,139
Segments assets 69,920,261 10,904,747 10,775,895 7,723,374 99,324,277
Investment in associates and joint ventures 15,802,052 1,043,018 1,130,216 435,980 18,411,266
Acquisition of non-current assets 7,629,767 395,081 167,818 781,087 8,973,753
Segments liabilities 23,105,008 7,865,399 7,008,996 4,836,641 42,816,044
Steel Trading Construction Others Total
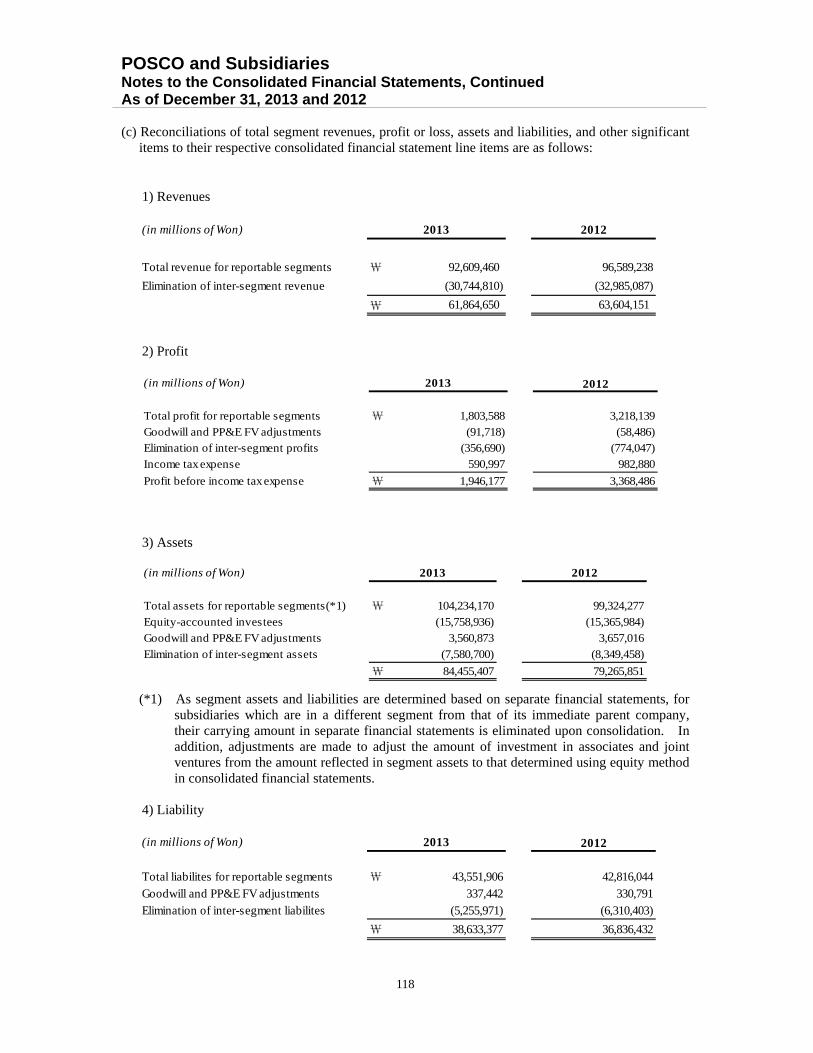
POSCO and Subsidiaries Notes to the Consolidated Financial Statements, Continued As of December 31, 2013 and 2012
118
(c) Reconciliations of total segment revenues, profit or loss, assets and liabilities, and other significant
items to their respective consolidated financial statement line items are as follows:
1) Revenues
2) Profit
3) Assets
(*1) As segment assets and liabilities are determined based on separate financial statements, for
subsidiaries which are in a different segment from that of its immediate parent company, their carrying amount in separate financial statements is eliminated upon consolidation. In addition, adjustments are made to adjust the amount of investment in associates and joint ventures from the amount reflected in segment assets to that determined using equity method in consolidated financial statements.
4) Liability
(in millions of Won) 2012
Total revenue for reportable segments ₩ 92,609,460 96,589,238
Elimination of inter-segment revenue (30,744,810) (32,985,087)
₩ 61,864,650 63,604,151
2013
(in millions of Won) 2012
Total profit for reportable segments ₩ 1,803,588 3,218,139
Goodwill and PP&E FV adjustments (91,718) (58,486)Elimination of inter-segment profits (356,690) (774,047)
Income tax expense 590,997 982,880
Profit before income tax expense ₩ 1,946,177 3,368,486
2013
(in millions of Won) 2012
Total assets for reportable segments(*1) ₩ 104,234,170 99,324,277
Equity-accounted investees (15,758,936) (15,365,984)Goodwill and PP&E FV adjustments 3,560,873 3,657,016
Elimination of inter-segment assets (7,580,700) (8,349,458)
₩ 84,455,407 79,265,851
2013
(in millions of Won) 2012
Total liabilites for reportable segments ₩ 43,551,906 42,816,044
Goodwill and PP&E FV adjustments 337,442 330,791
Elimination of inter-segment liabilites (5,255,971) (6,310,403)
₩ 38,633,377 36,836,432
2013
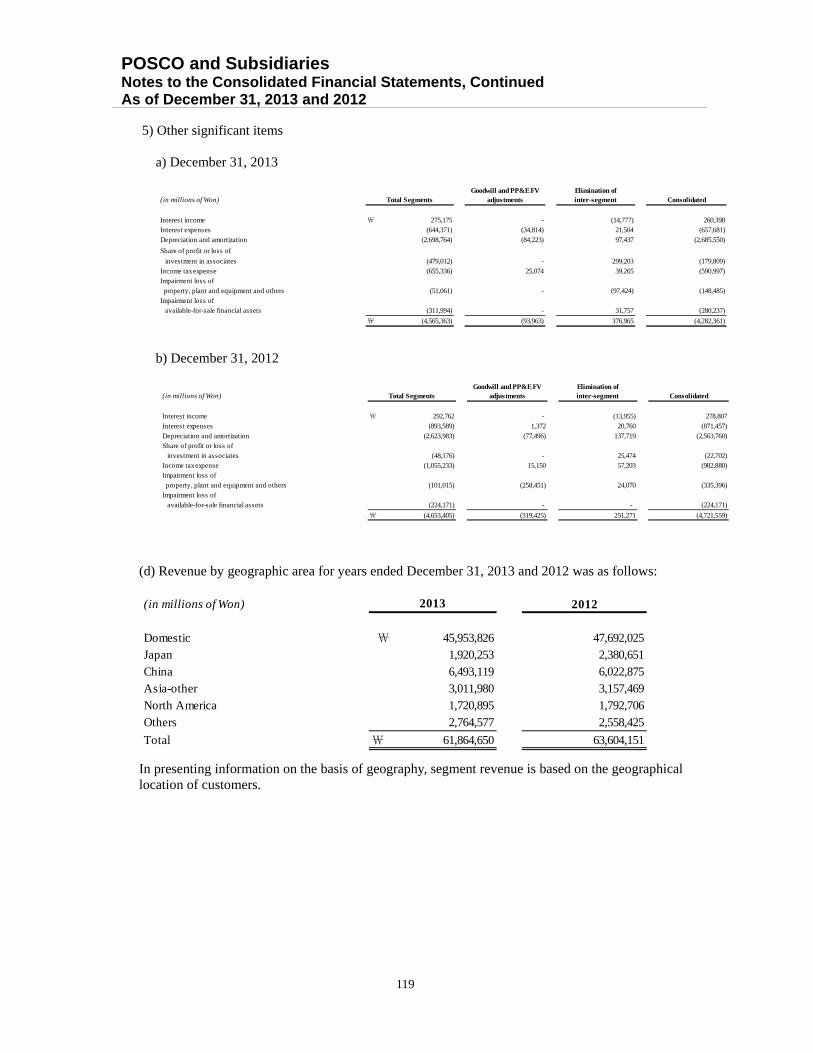
POSCO and Subsidiaries Notes to the Consolidated Financial Statements, Continued As of December 31, 2013 and 2012
119
5) Other significant items
a) December 31, 2013
b) December 31, 2012
(d) Revenue by geographic area for years ended December 31, 2013 and 2012 was as follows:
In presenting information on the basis of geography, segment revenue is based on the geographical location of customers.
(in millions of Won)
Interest income ₩ 275,175 - (14,777) 260,398Interest expenses (644,371) (34,814) 21,504 (657,681)
Depreciation and amortization (2,698,764) (84,223) 97,437 (2,685,550)
Share of profit or loss of
investment in associates (479,012) - 299,203 (179,809)
Income tax expense (655,336) 25,074 39,265 (590,997)Impairment loss of
property, plant and equipment and others (51,061) - (97,424) (148,485)
Impairment loss of available-for-sale financial assets (311,994) - 31,757 (280,237)
₩ (4,565,363) (93,963) 376,965 (4,282,361)
Total SegmentsGoodwill and PP&E FV
adjustmentsElimination ofinter-segment Consolidated
(in millions of Won)
Interest income ₩ 292,762 - (13,955) 278,807
Interest expenses (893,589) 1,372 20,760 (871,457)
Depreciation and amortization (2,623,983) (77,496) 137,719 (2,563,760)Share of profit or loss of
investment in associates (48,176) - 25,474 (22,702)Income tax expense (1,055,233) 15,150 57,203 (982,880)
Impairment loss of property, plant and equipment and others (101,015) (258,451) 24,070 (335,396)
Impairment loss of
available-for-sale financial assets (224,171) - - (224,171)
₩ (4,653,405) (319,425) 251,271 (4,721,559)
Total SegmentsGoodwill and PP&E FV
adjustmentsElimination ofinter-segment Consolidated
(in millions of Won) 2012
Domestic ₩ 45,953,826 47,692,025Japan 1,920,253 2,380,651
China 6,493,119 6,022,875Asia-other 3,011,980 3,157,469
North America 1,720,895 1,792,706
Others 2,764,577 2,558,425
Total ₩ 61,864,650 63,604,151
2013
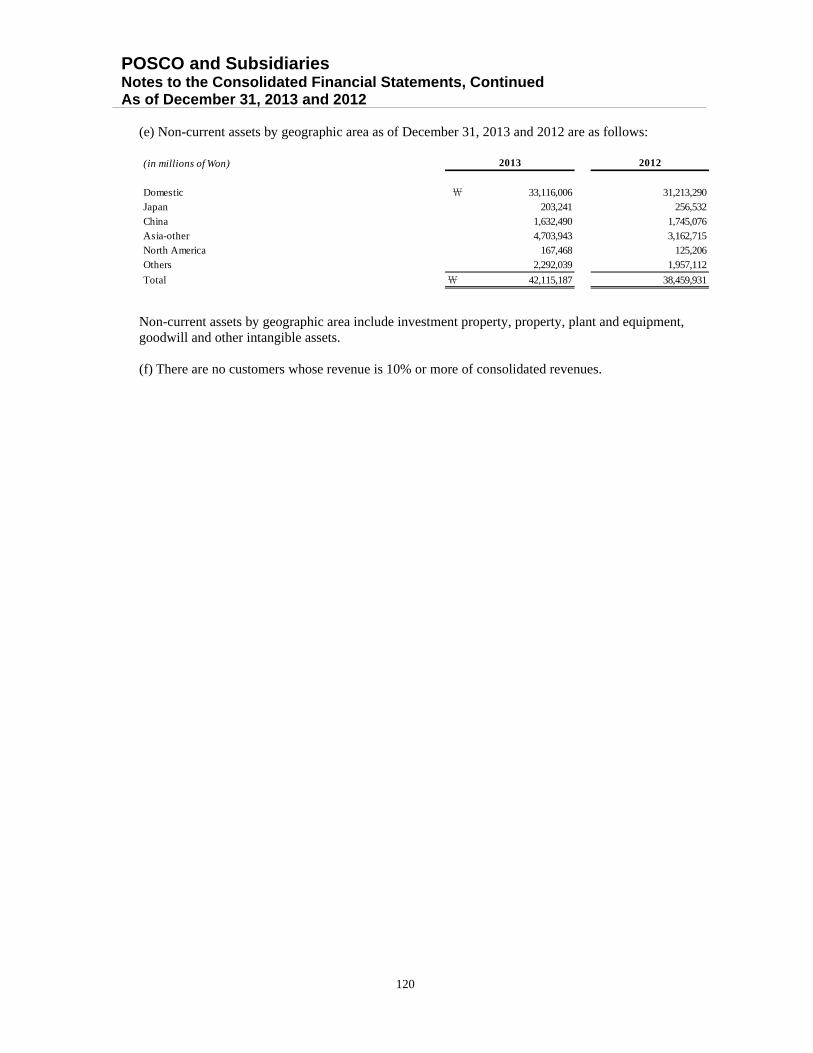
POSCO and Subsidiaries Notes to the Consolidated Financial Statements, Continued As of December 31, 2013 and 2012
120
(e) Non-current assets by geographic area as of December 31, 2013 and 2012 are as follows:
Non-current assets by geographic area include investment property, property, plant and equipment, goodwill and other intangible assets.
(f) There are no customers whose revenue is 10% or more of consolidated revenues.
(in millions of Won)
Domestic ₩ 33,116,006 31,213,290Japan 203,241 256,532
China 1,632,490 1,745,076Asia-other 4,703,943 3,162,715North America 167,468 125,206Others 2,292,039 1,957,112
Total ₩ 42,115,187 38,459,931
2013 2012
POSCO Separate Financial Statements December 31, 2013 and 2012 (With Independent Auditors’ Report Thereon)
Table of Contents
Page
Independent Auditors’ Report ............................................................................................................. 1
Separate Financial Statements
Separate Statements of Financial Position .............................................................................................. 3
Separate Statements of Comprehensive Income ..................................................................................... 5
Separate Statements of Changes in Equity ............................................................................................. 6
Separate Statements of Cash Flows ........................................................................................................ 7
Notes to the Separate Financial Statements ............................................................................................ 8
Independent Auditors’ Review Report on Internal Accounting Control System .......................... 79
Report on the Operations of Internal Accounting Control System ................................................ 81
Independent Auditors’ Report
Based on a report originally issued in Korean
The Board of Directors and Stockholders POSCO: We have audited the accompanying separate statements of financial position of POSCO (the “Company”) as of December 31, 2013 and 2012 and the related separate statements of comprehensive income, changes in equity and cash flows for the years then ended. Management is responsible for the preparation and fair presentation of these separate financial statements in accordance with Korean International Financial Reporting Standards. Our responsibility is to express an opinion on these separate financial statements based on our audits.
We conducted our audits in accordance with auditing standards generally accepted in the Republic of Korea. Those standards require that we plan and perform the audit to obtain reasonable assurance about whether the separate financial statements are free of material misstatement. An audit includes examining, on a test basis, evidence supporting the amounts and disclosures in the separate financial statements. An audit also includes assessing the accounting principles used and significant estimates made by management, as well as evaluating the overall financial statement presentation. We believe that the audit evidence we have obtained is sufficient and appropriate to provide a basis for our opinion. In our opinion, the separate financial statements referred to above present fairly, in all material respects, the financial position of the Company as of December 31, 2013 and 2012 and its financial performance and its cash flows for the years then ended, in conformity with Korean International Financial Reporting Standards.
2
Without qualifying our opinion, we draw attention to the following: The procedures and practices utilized in the Republic of Korea to audit such separate financial statements may differ from those generally accepted and applied in other countries. Accordingly, this report and the accompanying separate financial statements are for use by those knowledgeable about Korean auditing standards and their application in practice. Seoul, Korea February 25, 2014
This report is effective as of February 25, 2014, the audit report date. Certain subsequent events or circumstances, which may occur between the audit report date and the time of reading this report, could have a material impact on the accompanying separate financial statements and notes thereto. Accordingly, the readers of the audit report should understand that the above audit report has not been updated to reflect the impact of such subsequent events or circumstances, if any.

POSCO Separate Statements of Financial Position As of December 31, 2013 and 2012
3
See accompanying notes to the separate financial statements.
(in millions of Won)Notes December 31, 2012
Assets
Cash and cash equivalents 4,5,22 \ 1,394,315 1,752,560
Trade accounts and notes receivable, net 6,22,37 3,393,444 4,087,030Other receivables, net 7,22,37 281,161 394,762Other short-term financial assets 8,22 2,318,816 928,778Inventories 9,34 4,538,657 5,403,660Assets held for sale 10 1,304 - Other current assets 11 25,782 42,681
Total current assets 11,953,479 12,609,471
Long-term trade accounts and notes receivable, net 6,22 4,464 274Other receivables, net 7,22 45,738 60,652Other long-term financial assets 8,22 3,362,594 2,968,113Investments in subsidiaries, associates and joint ventures 12 15,092,836 14,100,053Investment property, net 13 92,879 110,526Property, plant and equipment, net 14 23,240,603 22,166,735Intangiable assets, net 15 438,783 293,841Other long-term assets 11 10,902 10,771
Total non-current assets 42,288,799 39,710,965
Total assets \ 54,242,278 52,320,436
December 31, 2013
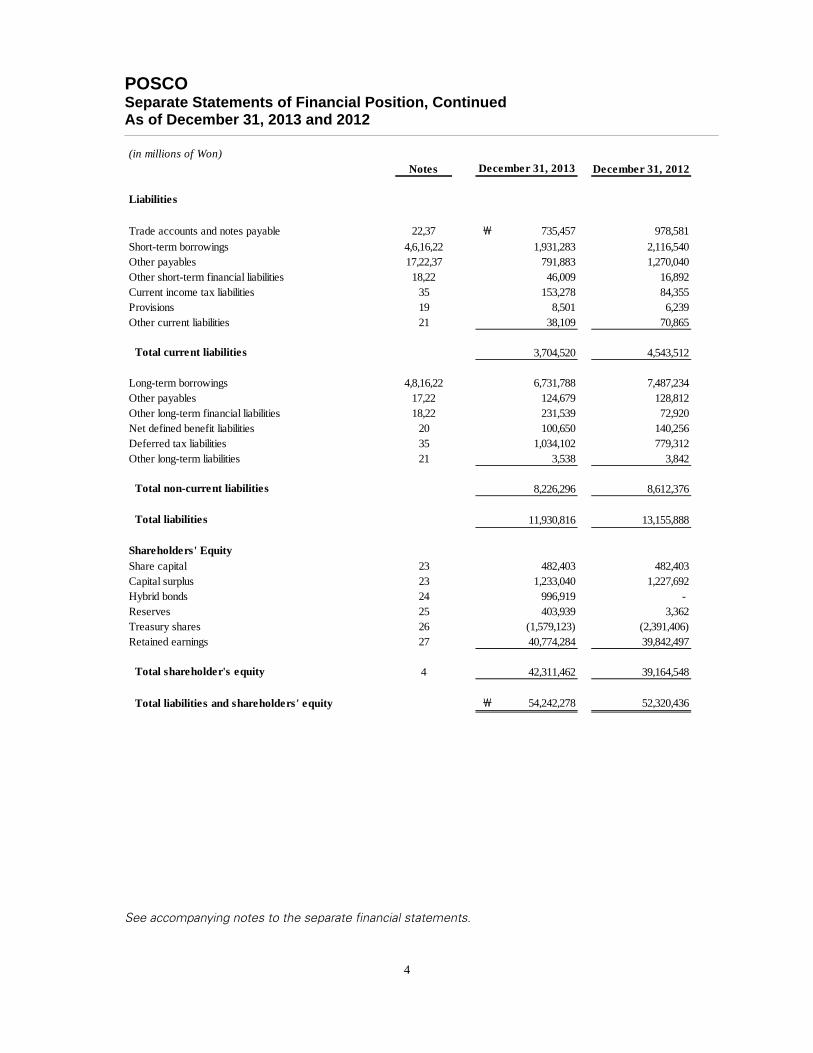
POSCO Separate Statements of Financial Position, Continued As of December 31, 2013 and 2012
4
See accompanying notes to the separate financial statements.
(in millions of Won)Notes December 31, 2012
Liabilities
Trade accounts and notes payable 22,37 \ 735,457 978,581
Short-term borrowings 4,6,16,22 1,931,283 2,116,540Other payables 17,22,37 791,883 1,270,040Other short-term financial liabilities 18,22 46,009 16,892Current income tax liabilities 35 153,278 84,355Provisions 19 8,501 6,239Other current liabilities 21 38,109 70,865
Total current liabilities 3,704,520 4,543,512
Long-term borrowings 4,8,16,22 6,731,788 7,487,234Other payables 17,22 124,679 128,812Other long-term financial liabilities 18,22 231,539 72,920Net defined benefit liabilities 20 100,650 140,256Deferred tax liabilities 35 1,034,102 779,312Other long-term liabilities 21 3,538 3,842
Total non-current liabilities 8,226,296 8,612,376
Total liabilities 11,930,816 13,155,888
Shareholders' EquityShare capital 23 482,403 482,403Capital surplus 23 1,233,040 1,227,692Hybrid bonds 24 996,919 - Reserves 25 403,939 3,362Treasury shares 26 (1,579,123) (2,391,406)Retained earnings 27 40,774,284 39,842,497
Total shareholder's equity 4 42,311,462 39,164,548
Total liabilities and shareholders' equity \ 54,242,278 52,320,436
December 31, 2013

POSCO Separate Statements of Comprehensive Income For the years ended December 31, 2013 and 2012
5
See accompanying notes to the separate financial statements.
(in millions of Won, except per share informations)
Notes 2012
Revenue 28,37 \ 30,543,545 35,664,933Cost of sales 9,20,30,34,37 (26,494,617) (31,041,900)
Gross profit 4,048,928 4,623,033
Selling and administrative expenses Administrative expenses 20,22,29,30,34 (892,966) (853,908)Selling expenses 29,30,34 (940,829) (979,528)
Operating profit 31 2,215,133 2,789,597
Finance income and costsFinance income 22,32 967,073 1,356,539Finance costs 22,32 (918,360) (759,291)
Other non-operating income and expenses Other non-operating income 31,33,37 140,048 69,737Other non-operating expenses 31,33,34,37 (418,599) (334,301)
Profit before income tax 1,985,295 3,122,281Income tax expense 35 (402,699) (622,758)
Profit for the period 1,582,596 2,499,523Other comprehensive income
Items that will not be reclassified subsequentlyto profit or loss : Remeasurements of defined benefit pension plans, net of tax 20 (8,692) (45,824)
Items that are or may be reclassified subsequentlyto profit or loss : Net changes in unrealized fair value of available-for-sale investments, net of tax 8,22,25 400,577 (153,345)
Total comprehensive income \ 1,974,481 2,300,354
Basic and diluted earnings per share 36 \ 20,052 32,359
2013
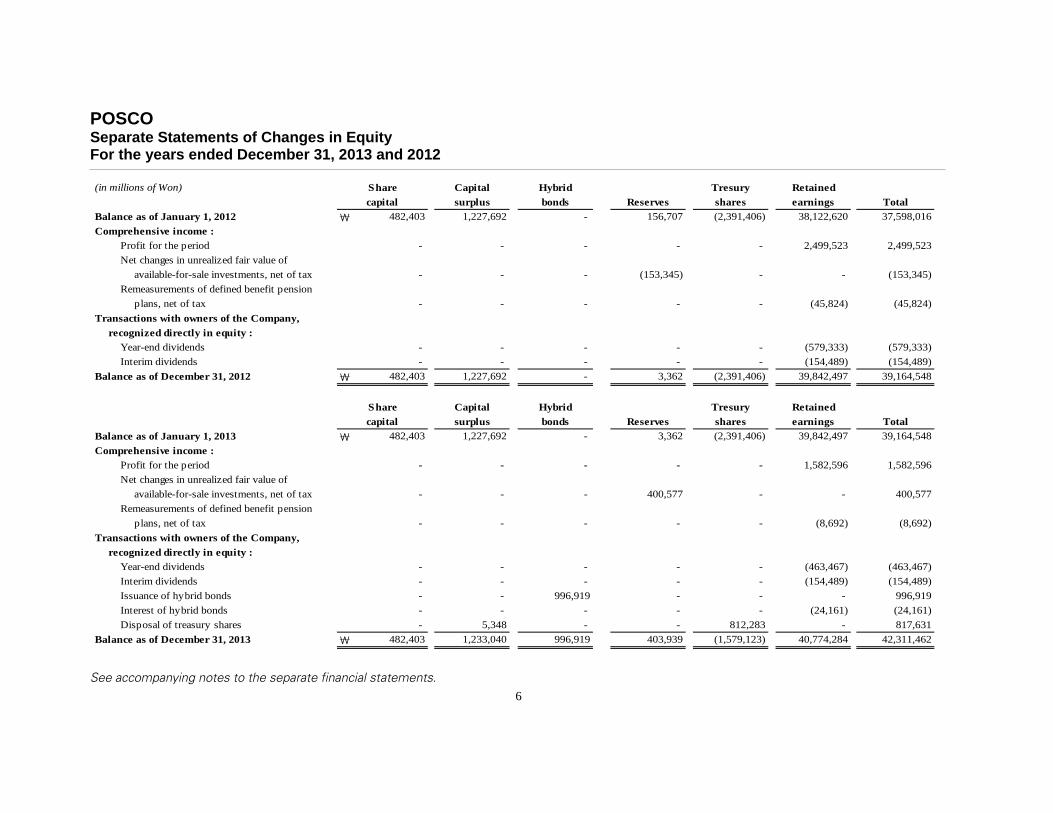
POSCO Separate Statements of Changes in Equity For the years ended December 31, 2013 and 2012
6
See accompanying notes to the separate financial statements.
(in millions of Won) Capital Hybrid Tresury Retained
surplus bonds Reserves shares earnings Total
Balance as of January 1, 2012 ₩ 482,403 1,227,692 - 156,707 (2,391,406) 38,122,620 37,598,016
Comprehensive income :
Profit for the period - - - - - 2,499,523 2,499,523
Net changes in unrealized fair value of
available-for-sale investments, net of tax - - - (153,345) - - (153,345)
Remeasurements of defined benefit pension
plans, net of tax - - - - - (45,824) (45,824)
Transactions with owners of the Company,
recognized directly in equity :
Year-end dividends - - - - - (579,333) (579,333)
Interim dividends - - - - - (154,489) (154,489)
Balance as of December 31, 2012 ₩ 482,403 1,227,692 - 3,362 (2,391,406) 39,842,497 39,164,548
Capital Hybrid Tresury Retained
surplus bonds Reserves shares earnings Total
Balance as of January 1, 2013 ₩ 482,403 1,227,692 - 3,362 (2,391,406) 39,842,497 39,164,548
Comprehensive income :
Profit for the period - - - - - 1,582,596 1,582,596
Net changes in unrealized fair value of
available-for-sale investments, net of tax - - - 400,577 - - 400,577
Remeasurements of defined benefit pension
plans, net of tax - - - - - (8,692) (8,692)
Transactions with owners of the Company,
recognized directly in equity :
Year-end dividends - - - - - (463,467) (463,467)
Interim dividends - - - - - (154,489) (154,489)
Issuance of hybrid bonds - - 996,919 - - - 996,919
Interest of hybrid bonds - - - - - (24,161) (24,161)
Disposal of treasury shares - 5,348 - - 812,283 - 817,631
Balance as of December 31, 2013 ₩ 482,403 1,233,040 996,919 403,939 (1,579,123) 40,774,284 42,311,462
Share
capital
Share
capital
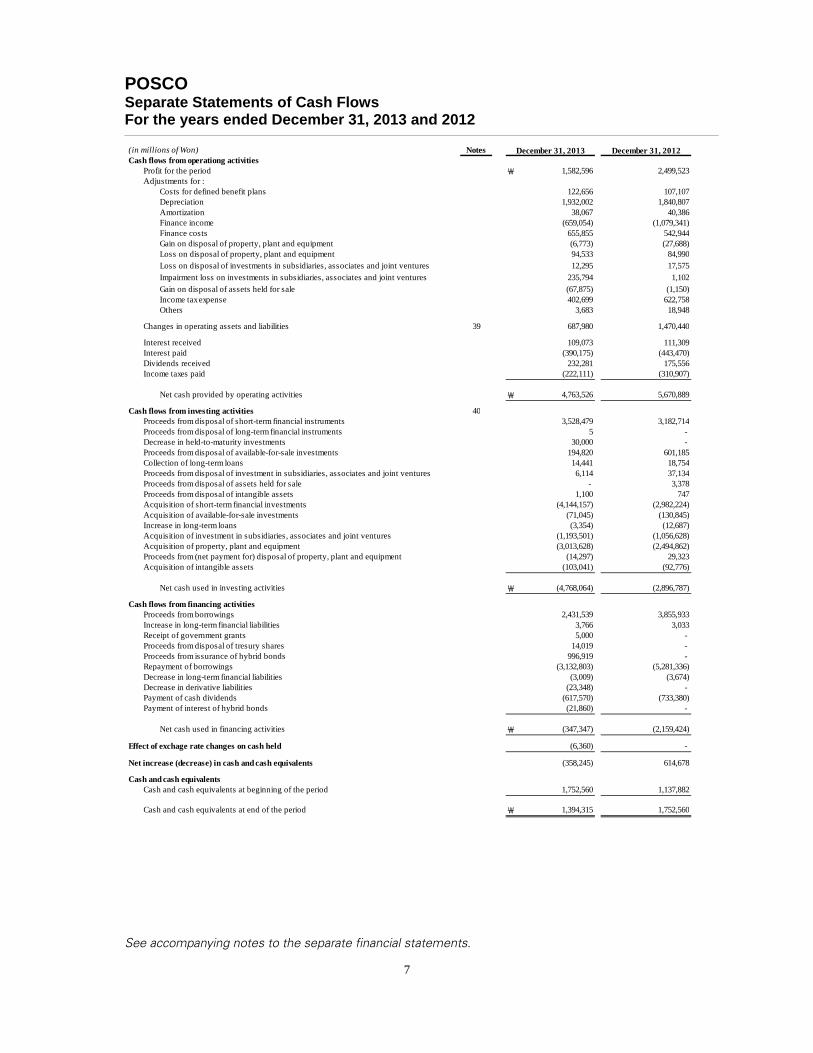
POSCO Separate Statements of Cash Flows For the years ended December 31, 2013 and 2012
7
See accompanying notes to the separate financial statements.
(in millions of Won) Notes December 31, 2012Cash flows from operationg activities
Profit for the period \ 1,582,596 2,499,523Adjustments for :
Costs for defined benefit plans 122,656 107,107Depreciation 1,932,002 1,840,807Amortization 38,067 40,386Finance income (659,054) (1,079,341)Finance costs 655,855 542,944Gain on disposal of property, plant and equipment (6,773) (27,688)Loss on disposal of property, plant and equipment 94,533 84,990Loss on disposal of investments in subsidiaries, associates and joint ventures 12,295 17,575
Impairment loss on investments in subsidiaries, associates and joint ventures 235,794 1,102
Gain on disposal of assets held for sale (67,875) (1,150)Income tax expense 402,699 622,758Others 3,683 18,948
Changes in operating assets and liabilities 39 687,980 1,470,440
Interest received 109,073 111,309Interest paid (390,175) (443,470)Dividends received 232,281 175,556Income taxes paid (222,111) (310,907)
Net cash provided by operating activities \ 4,763,526 5,670,889
Cash flows from investing activities 40Proceeds from disposal of short-term financial instruments 3,528,479 3,182,714Proceeds from disposal of long-term financial instruments 5 - Decrease in held-to-maturity investments 30,000 - Proceeds from disposal of available-for-sale investments 194,820 601,185Collection of long-term loans 14,441 18,754Proceeds from disposal of investment in subsidiaries, associates and joint ventures 6,114 37,134Proceeds from disposal of assets held for sale - 3,378Proceeds from disposal of intangible assets 1,100 747Acquisition of short-term financial investments (4,144,157) (2,982,224)Acquisition of available-for-sale investments (71,045) (130,845)Increase in long-term loans (3,354) (12,687)Acquisition of investment in subsidiaries, associates and joint ventures (1,193,501) (1,056,628)Acquisition of property, plant and equipment (3,013,628) (2,494,862)Proceeds from (net payment for) disposal of property, plant and equipment (14,297) 29,323Acquisition of intangible assets (103,041) (92,776)
Net cash used in investing activities \ (4,768,064) (2,896,787)
Cash flows from financing activitiesProceeds from borrowings 2,431,539 3,855,933Increase in long-term financial liabilities 3,766 3,033Receipt of government grants 5,000 - Proceeds from disposal of tresury shares 14,019 - Proceeds from issurance of hybrid bonds 996,919 - Repayment of borrowings (3,132,803) (5,281,336)Decrease in long-term financial liabilities (3,009) (3,674)Decrease in derivative liabilities (23,348) - Payment of cash dividends (617,570) (733,380)Payment of interest of hybrid bonds (21,860) -
Net cash used in financing activities \ (347,347) (2,159,424)
Effect of exchage rate changes on cash held (6,360) -
Net increase (decrease) in cash and cash equivalents (358,245) 614,678
Cash and cash equivalentsCash and cash equivalents at beginning of the period 1,752,560 1,137,882
Cash and cash equivalents at end of the period \ 1,394,315 1,752,560
December 31, 2013
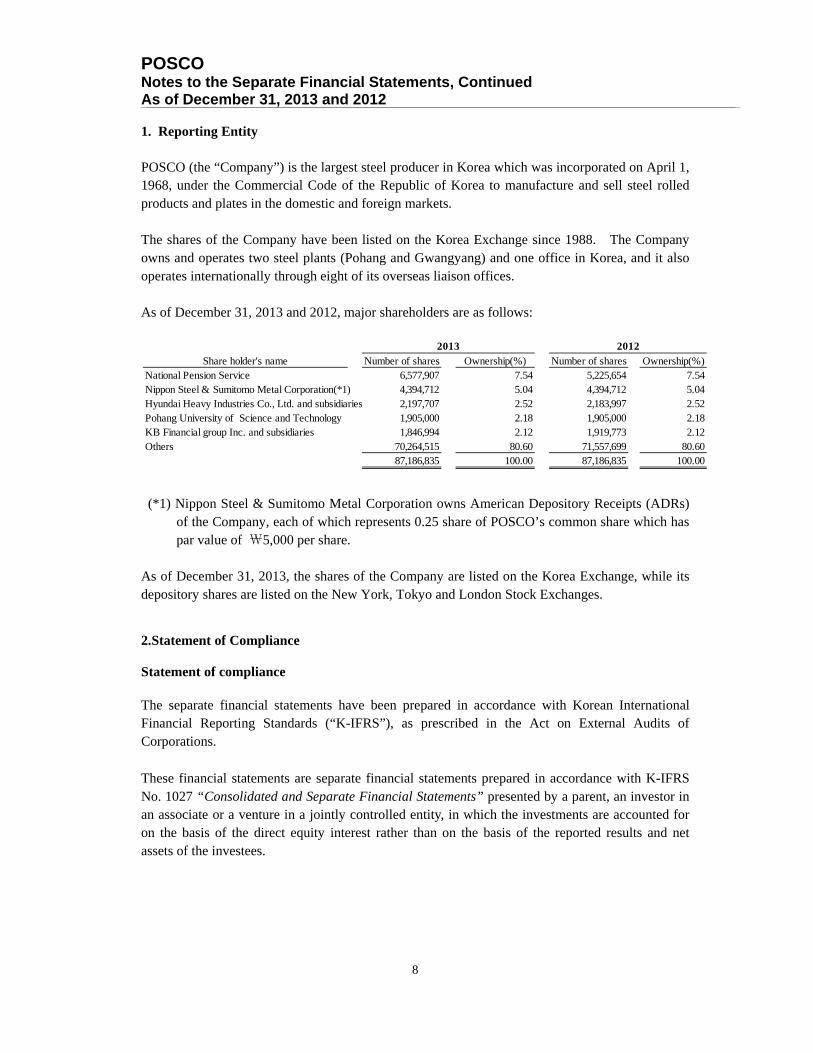
POSCO Notes to the Separate Financial Statements, Continued As of December 31, 2013 and 2012
8
1. Reporting Entity POSCO (the “Company”) is the largest steel producer in Korea which was incorporated on April 1, 1968, under the Commercial Code of the Republic of Korea to manufacture and sell steel rolled products and plates in the domestic and foreign markets. The shares of the Company have been listed on the Korea Exchange since 1988. The Company owns and operates two steel plants (Pohang and Gwangyang) and one office in Korea, and it also operates internationally through eight of its overseas liaison offices. As of December 31, 2013 and 2012, major shareholders are as follows:
(*1) Nippon Steel & Sumitomo Metal Corporation owns American Depository Receipts (ADRs)
of the Company, each of which represents 0.25 share of POSCO’s common share which has par value of ₩5,000 per share.
As of December 31, 2013, the shares of the Company are listed on the Korea Exchange, while its depository shares are listed on the New York, Tokyo and London Stock Exchanges. 2.Statement of Compliance Statement of compliance The separate financial statements have been prepared in accordance with Korean International Financial Reporting Standards (“K-IFRS”), as prescribed in the Act on External Audits of Corporations. These financial statements are separate financial statements prepared in accordance with K-IFRS No. 1027 “Consolidated and Separate Financial Statements” presented by a parent, an investor in an associate or a venture in a jointly controlled entity, in which the investments are accounted for on the basis of the direct equity interest rather than on the basis of the reported results and net assets of the investees.
Share holder's name Number of shares Ownership(%) Number of shares Ownership(%)National Pension Service 6,577,907 7.54 5,225,654 7.54Nippon Steel & Sumitomo Metal Corporation(*1) 4,394,712 5.04 4,394,712 5.04Hyundai Heavy Industries Co., Ltd. and subsidiaries 2,197,707 2.52 2,183,997 2.52Pohang University of Science and Technology 1,905,000 2.18 1,905,000 2.18KB Financial group Inc. and subsidiaries 1,846,994 2.12 1,919,773 2.12Others 70,264,515 80.60 71,557,699 80.60
87,186,835 100.00 87,186,835 100.00
2013 2012
POSCO Notes to the Separate Financial Statements, Continued As of December 31, 2013 and 2012
9
Basis of measurement The separate financial statements have been prepared on the historical cost basis, except for the following material items in the statement of financial position, as described in the accounting policy below. (a) Derivatives instruments are measured at fair value (b) Available-for-sale financial assets are measured at fair value (c) Defined benefit liabilities are measured at the present value of the defined benefit obligation
less the fair value of the plan asset Functional and presentation currency These separate financial statements are presented in Korean won, which is the Company’s functional currency and the currency of the primary economic environment in which the Company operates.
Use of estimates and judgements The preparation of the financial statements in conformity with K-IFRS requires management to make judgments, estimates and assumptions that affect the application of accounting policies and the reported amounts of assets, liabilities, income and expenses. Actual results may differ from these estimates. Estimates and underlying assumptions are reviewed on an ongoing basis. Revisions to accounting estimates are recognized in the period in which the estimates are revised and in any future periods affected. (a) Judgements
Information about critical judgements in applying accounting policies that have the most significant effect on the amounts recognized in the separate financial statements is included in the following notes:
• Note 8 - Other financial assets • Note 13 - Investment property, net • Note 14 - Property, plant and equipment, net
(b) Assumptions and estimation uncertainties
Information about assumptions and estimation uncertainties that have a significant risk of resulting in a material adjustment within the next financial year is included in the following notes:
• Note 19 - Provisions • Note 20 - Employee benefits • Note 38 - Commitments and contingencies
POSCO Notes to the Separate Financial Statements, Continued As of December 31, 2013 and 2012
10
(c) Measurement of fair value
The Company’s accounting policies and disclosures require the measurement of fair values, for both financial and non-financial assets and liabilities. The Company has an established control framework with respect to the measurement of fair values. This includes a valuation team that has overall responsibility for overseeing all significant fair value measurements, including Level 3 fair values, and reports directly to the financial officer.
The valuation team regularly reviews significant unobservable inputs and valuation adjustments. If third party information, such as broker quotes or pricing services, is used to measure fair values, then the valuation team assesses the evidence obtained from the third parties to support the conclusion that such valuations meet the requirements of K-IFRS including the level in the fair value hierarchy in which such valuation techniques should be classified. When measuring the fair value of an asset or a liability, the Company uses market observable data as far as possible. Fair values are categorized into different levels in a fair value hierarchy based on the inputs used in the valuation techniques as follows.
• Level 1 - quoted prices (unadjusted) in active markets for identical assets or liabilities. • Level 2 - inputs other than quoted prices included in Level 1 that are observable for the
assets or liability, either directly (i.e. as prices) or indirectly(i.e. derived from prices).
• Level 3 - inputs for the assets or liability that are not based on observable market data (unobservable inputs).
If the inputs used to measure the fair value of an asset or a liability might be categorized in different levels of the fair value hierarchy, then the fair value measurement is categorized in its entirety in the same level of the fair value hierarchy as the lowest level input that is significant to the entire measurement. The Company recognizes transfers between levels of the fair value hierarchy at the end of the reporting period during which the change has occurred.
Information about the assumptions made in measuring fair values is included in the following notes:
• Note 22 – Financial instruments
Changes in accounting policies Except for the change below, the Company has consistently applied the accounting policies set out in note 3 to all periods presented in these separate financial statements. The Company has adopted the following new standards and amendments to standards with a date of initial application of January 1, 2013. (a) K-IFRS No. 1001, “Presentation of Financial Statements” (b) K-IFRS No. 1019, “Employee Benefits” (c) K-IFRS No. 1107, “Financial Instruments: Disclosures” (d) K-IFRS No. 1113, “Fair Value Measurement”

POSCO Notes to the Separate Financial Statements, Continued As of December 31, 2013 and 2012
11
The details of changes in accounting policies are as follows: (a) Classification of other comprehensive income
As a result of the amendments to K-IFRS No. 1001, the Company has modified the presentation of items of other comprehensive income in its statement of comprehensive income to present separately items that would be reclassified to profit or loss from those that would never be reclassified to profit or loss. Comparative information has been re-presented accordingly.
(b) Post-employment defined benefit plan
As a result of the amendments to K-IFRS No. 1019, the Company has changed its accounting policy with respect the basis for determining the income or expense related to its post-employment defined benefit plans. Under the amendments to K-IFRS No. 1019, the Company determines the net interest expense (income) on the net defined benefit liability (asset) for the period by applying the discount rate used to measure the defined benefit obligation at the beginning of the annual period to the then-net defined benefit liability (asset), taking into account any changes in the net defined benefit liability (asset) during the period as a result of contributions and benefit payments. Consequently, the net interest on the net defined benefit liability (asset) now comprises: interest cost on the defined benefit obligation, interest income on plan assets, and interest on the effect on the asset ceiling. Previously, the Company determined interest income on plan assets based on their long-term rate of expected return. The impact of the amendments on the Company’s separate financial statements is not significant.
(c) Offsetting of financial assets and financial liabilities
As a result of the amendments to K-IFRS No. 1107, the Company has expanded its disclosures about the offsetting of financial assets and financial liabilities (Note 22).
(d) Fair value measurement
K-IFRS No. 1113, establishes a single framework for measuring fair value and making disclosures about fair value measurements when such measurements are required or permitted by other K-IFRSs. It unifies the definition of fair value as the price that would be received to sell an asset or paid to transfer a liability in an orderly transaction between market participants at the measurement date. It replaces and expands the disclosure requirements about fair value measurements in other K-IFRSs, including K-IFRS No. 1107. As a result, the Company has included additional disclosures in this regard (Note 22).
In accordance with the transitional provisions of K-IFRS No. 1113, the Company has applied the new fair value measurement guidance prospectively and has not provided any comparative information for new disclosures. Notwithstanding the above, the change had no significant impact on the measurements of the Company’s assets and liabilities.
Impact of changes in accounting policies As management believes the impact of the amendments to K-IFRS No. 1019 and 1113 on the Company’s prior year’s separate financial statements is not significant, the comparative period’s separate financial statements are not restated.
POSCO Notes to the Separate Financial Statements, Continued As of December 31, 2013 and 2012
12
Approval of financial statement The separate financial statements were authorized for issue by the Board of Directors on January 29, 2014, and will be submitted for approval at the shareholders’ meeting to be held on March 14, 2014. 3. Summary of Significant Accounting Policies The significant accounting policies applied by the Company in preparation of its separate financial statements are included below. The accounting policies set out below have been applied consistently to all periods presented in these financial statements, except for those as disclosed in note 2. The comparative amounts in separate statements of comprehensive income have been re-presented as a result of a change in the accounting policy regarding the presentation of items of other comprehensive income. Investments in Subsidiaries, Associates and Joint Ventures
These separate financial statements are prepared and presented in accordance with K-IFRS No. 1027 “Consolidated and Separate Financial Statements”. The Company applied the cost method to investments in subsidiaries, associates and joint ventures in accordance with K-IFRS No. 1027. Dividends from a subsidiary, associate or joint venture are recognized in profit or loss when the right to receive the dividend is established. Foreign currency transactions and translation
Foreign currency transactions are initially recorded using the spot exchange rate between the functional currency and the foreign currency at the date of the transaction. At the end of each reporting period, foreign currency monetary items are translated using the closing rate. Non-monetary items that are measured in terms of historical cost in a foreign currency are translated using the exchange rate at the date of the original transaction. Non-monetary items that are measured at fair value in a foreign currency are translated using the exchange rate at the date fair value was initially determined. Exchange differences arising on the settlement of monetary items or on translating monetary items at rates different from those at which they were translated on initial recognition during the period or in previous financial statements are recognized in profit or loss in the period in which they arise. When gains or losses on non-monetary items are recognized in other comprehensive income, exchange components of those gains or losses are recognized in other comprehensive income. Conversely, when gains or losses on non-monetary items are recognized in profit or loss, exchange components of those gains or losses are recognized in profit or loss.
POSCO Notes to the Separate Financial Statements, Continued As of December 31, 2013 and 2012
13
Cash and cash equivalents Cash and cash equivalents comprise cash on hand, demand deposits, and short-term investments in highly liquid securities that are readily convertible to known amounts of cash with maturities of three months or less from the acquisition date and which are subject to an insignificant risk of changes in value. Equity investments are excluded from cash and cash equivalents. Non-derivative financial assets
The Company recognizes and measures non-derivative financial assets by the following four categories: financial assets at fair value through profit or loss, held-to-maturity investments, loans and receivables and available-for-sale financial assets. The Company recognizes financial assets in the separate statement of financial position when the Company becomes a party to the contractual provisions of the instrument. Upon initial recognition, non-derivative financial assets are measured at their fair value plus, in the case of a financial asset not at fair value through profit or loss, transaction costs that are directly attributable to the asset’s acquisition or issuance. (a) Financial assets at fair value through profit or loss
Financial assets are classified at fair value through profit or loss if they are held for trading or designated as such upon initial recognition. Upon initial recognition, transaction costs are recognized in profit or loss when incurred. Financial assets at fair value through profit or loss are measured at fair value, and changes therein are recognized in profit or loss.
(b) Held-to-maturity financial assets
A non-derivative financial asset with a fixed or determinable payment and fixed maturity, for which the Company has the positive intention and ability to hold to maturity, is classified as held-to-maturity financial assets. Subsequent to initial recognition, held-to-maturity financial assets are measured at amortized cost using the effective interest method.
(c) Loans and receivables
Loans and receivables are non-derivative financial assets with fixed or determinable payments that are not quoted in an active market. Subsequent to initial recognition, loans and receivables are measured at amortized cost using the effective interest method unless the effect of discounting is immaterial.

POSCO Notes to the Separate Financial Statements, Continued As of December 31, 2013 and 2012
14
(d) Available-for-sale financial assets
Available-for-sale financial assets are those non-derivative financial assets that are designated as available-for-sale or are not classified as financial assets at fair value through profit or loss, held-to-maturity financial assets or loans and receivables. Subsequent to initial recognition, they are measured at fair value, with changes in fair value, net of any tax effect, recorded in other comprehensive income in equity. Investments in equity instruments that do not have a quoted market price in an active market and whose fair value cannot be reliably measured and derivatives that are linked to and must be settled by delivery of such unquoted equity instruments are measured at cost. When a financial asset is derecognized or impairment losses are recognized, the cumulative gain or loss previously recognized in other comprehensive income is reclassified from equity to profit or loss. Dividends on an available-for-sale equity instrument are recognized in profit or loss when the Company’s right to receive payment is established.
(e) Derecognition of non-derivative financial assets
The Company derecognizes non-derivative financial assets when the contractual rights to the cash flows from the financial asset expire, or the Company transfers the rights to receive the contractual cash flows from the financial asset as well as substantially all the risks and rewards of ownership of the financial asset. Any interest in a transferred financial asset that is created or retained by the Company is recognized as a separate asset or liability.
If the Company retains substantially all the risks and rewards of ownership of the transferred financial assets, the Company continues to recognize the transferred financial assets and recognizes financial liabilities for the consideration received.
(f) Offsetting a financial asset and a financial liability
Financial assets and financial liabilities are offset and the net amount is presented in the separate statement of financial position only when the Company currently has a legally enforceable right to offset the recognized amounts, and there is the intention to settle on a net basis or to realize the asset and settle the liability simultaneously.
Inventories
Inventories are measured at the lower of cost and net realizable value. Costs are determined by using the moving-weighted average method. The cost of inventories comprise all costs of purchase, costs of conversion and other costs incurred in bringing the inventories to their present location and condition. The allocation of fixed production overheads to the costs of finished goods or work in progress are based on the normal capacity of the production facilities.
POSCO Notes to the Separate Financial Statements, Continued As of December 31, 2013 and 2012
15
When inventories are sold, the carrying amount of those inventories is recognized as cost of goods sold in the period in which the related revenue is recognized. Inventories are measured at the lower of cost and net realizable value. The amount of any write-down of inventories to net realizable value and all losses of inventories are recognized as an expense in the period the write-down or loss occurs. The amount of any reversal of any write-down of inventories arising from an increase in net realizable value is recognized as a reduction in the amount of inventories recognized as a cost of goods sold in the period in which the reversal occurs. Non-current assets held for sale Non-current assets or disposal groups comprising assets and liabilities that are expected to be recovered primarily through sale rather than through continuing use are classified as held for sale. In order to be classified as held for sale, the assets or disposal groups must be available for immediate sale in their present condition and their sale must be highly probable. The assets or disposal groups that are classified as non-current assets held for sale are measured at the lower of their carrying amount and fair value less cost to sell. The Company recognizes an impairment loss for any initial or subsequent write-down of an asset or disposal group to fair value less costs to sell, and a gain for any subsequent increase in fair value less costs to sell, up to the cumulative impairment loss previously recognized in accordance with K-IFRS No. 1036 “Impairment of Assets”. A non-current asset that is classified as held for sale or part of a disposal group classified as held for sale is not depreciated (or amortized). Investment property Property held to earn rentals or for capital appreciation or both is classified as investment property. Investment property is measured initially at its cost. Transaction costs are included in the initial measurement. Subsequently, investment property is carried at depreciated cost less any accumulated impairment losses. Subsequent costs are recognized in the carrying amount of investment property at cost or, if appropriate, as separate items if it is probable that future economic benefits associated with the item will flow to the Company and the cost of the item can be measured reliably. The carrying amount of the replaced part is derecognized. The costs of the day-to-day servicing are recognized in profit or loss as incurred. Depreciation methods, useful lives and residual values are reviewed at the end of each reporting date and adjusted, if appropriate. The change is accounted for as a change in an accounting estimate.
POSCO Notes to the Separate Financial Statements, Continued As of December 31, 2013 and 2012
16
Property, plant and equipment
Property, plant and equipment are initially measured at cost and after initial recognition, are carried at cost less accumulated depreciation and any accumulated impairment losses. The cost of property, plant and equipment includes expenditures arising directly from the construction or acquisition of the asset, any costs directly attributable to bringing the asset to the location and condition necessary for it to be capable of operating in the manner intended by management and, when the Company has an obligation to remove the asset or restore the site, an estimate of the costs of dismantling and removing the item and restoring the site on which it is located. The cost of replacing a part of an item is recognized in the carrying amount of the item of property, plant and equipment, if the following recognition criteria are met: (a) it is probable that future economic benefits associated with the item will flow to the Company;
and (b) the cost can be measured reliably. The carrying amount of the replaced part is derecognized at the time the replacement part is recognized. The costs of the day-to-day servicing of the item are recognized in profit or loss as incurred. Items of property, plant and equipment are depreciated from the date they are available for use or, in respect of self-constructed assets, from the date that the asset is completed and ready for use. Other than land, the costs of an asset less its estimated residual value are depreciated. Depreciation of property, plant and equipment is recognized in profit or loss on a straight-line basis, which most closely reflects the expected pattern of consumption of the future economic benefits embodied in the asset, over the estimated useful lives of each component of an item of property, plant and equipment. Leased assets are depreciated over the shorter of the lease term and their useful lives unless it is reasonably certain that the Company will obtain ownership by the end of the lease term. Land is not depreciated. Each part of an item of property, plant and equipment with a cost that is significant in relation to the total cost of the item is depreciated separately. The gain or loss arising from the derecognition of an item of property, plant and equipment is included in profit or loss when the item is derecognized. The estimated useful lives for the current and comparative periods are as follows:
Buildings 20-40 yearsStructures 20-40 yearsMachinery and equipment 15 yearsVehicles 4-9 yearsTools 4 yearsFurniture and fixtures 4 yearsLease assets 18 years
POSCO Notes to the Separate Financial Statements, Continued As of December 31, 2013 and 2012
17
The estimated residual value, useful lives and the depreciation method are reviewed at least at the end of each reporting period and, if expectations differ from previous estimates, the changes are accounted for as changes in accounting estimates. Borrowing costs The Company capitalizes borrowing costs directly attributable to the acquisition, construction or production of a qualifying asset as part of the cost of that asset. Other borrowing costs are recognized in expense as incurred. A qualifying asset is an asset that requires a substantial period of time to get ready for its intended use or sale. Financial assets and inventories that are manufactured or otherwise produced over a short period of time are not qualifying assets. Assets that are ready for their intended use or sale when acquired are not qualifying assets. To the extent that the Company borrows funds specifically for the purpose of obtaining a qualifying asset, the Company determines the amount of borrowing costs eligible for capitalization as the actual borrowing costs incurred on that borrowing during the period less any investment income on the temporary investment of those borrowings. The Company immediately recognizes other borrowing costs as an expense. To the extent that the Company borrows funds generally and uses them for the purpose of obtaining a qualifying asset, the Company shall determine the amount of borrowing costs eligible for capitalization by applying a capitalization rate to the expenditures on that asset. The capitalization rate shall be the weighted average of the borrowing costs applicable to the borrowings of the Company that are outstanding during the period, other than borrowings made specifically for the purpose of obtaining a qualifying asset. The amount of borrowing costs that the Company capitalizes during a period shall not exceed the amount of borrowing costs incurred during that period. Intangible assets
Intangible assets are measured initially at cost and, subsequently, are carried at cost less accumulated amortization and accumulated impairment losses. Amortization of intangible assets except for goodwill is calculated on a straight-line basis over the estimated useful lives of intangible assets from the date that they are available for use. The residual value of intangible assets is zero. However, as there are no foreseeable limits to the periods over which club memberships are expected to be available for use, this intangible asset is determined as an having an indefinite useful life and not amortized.
Intellectual property rights 5-10 yearsDevelopment costs 4 yearsPort facilities usage rights 5-75 yearsOther intangible assets 4-20 years
Amortization periods and the amortization methods for intangible assets with finite useful lives are reviewed at the end of each reporting period. The useful lives of intangible assets that are not being amortized are reviewed at the end of each reporting period to determine whether events and circumstances continue to support indefinite useful life assessments for those assets. Changes are accounted for as changes in accounting estimates.
POSCO Notes to the Separate Financial Statements, Continued As of December 31, 2013 and 2012
18
Expenditures on research activities, undertaken with the prospect of gaining new scientific or technical knowledge and understanding, are recognized in profit or loss as incurred. Development expenditures are capitalized only if development costs can be measured reliably, the product or process is technically and commercially feasible, future economic benefits are probable, and the Company intends to and has sufficient resources to complete development and to use or sell the asset. Other development expenditures are recognized in profit or loss as incurred.
Subsequent expenditures are capitalized only when they increase the future economic benefits embodied in the specific asset to which they relate. All other expenditures, including expenditures on internally generated goodwill and brands, are recognized in profit or loss as incurred. Government grants
Government grants are not recognized unless there is reasonable assurance that the Company will comply with the grant’s conditions and that the grant will be received.
(a) Grants related to assets
Government grants whose primary condition is that the Company purchase, construct or otherwise acquire long-term assets are deducted from the carrying amount of the assets and recognized in profit or loss on a systematic and rational basis over the life of the depreciable assets.
(b) Grants related to income
Government grants which are intended to compensate the Company for expenses incurred are deducted from the related expenses.
Leases
The Company classifies and accounts for leases as either a finance or operating lease, depending on the terms. Leases where the Company assumes substantially all of the risks and rewards of ownership are classified as finance leases. All other leases are classified as operating leases. (a) Finance leases
At the commencement of the lease term, the Company recognizes as finance assets and finance liabilities the lower amount of the fair value of the leased property and the present value of the minimum lease payments, each determined at the inception of the lease. Any initial direct costs are added to the amount recognized as an asset. Minimum lease payments are apportioned between the finance charge and the reduction of the outstanding liability. The finance charge is allocated to each period during the lease term so as to produce a constant periodic rate of interest on the remaining balance of the liability. Contingent rents are charged as expenses in the periods in which they are incurred.
POSCO Notes to the Separate Financial Statements, Continued As of December 31, 2013 and 2012
19
The depreciable amount of a leased asset is allocated to each accounting period during the period of expected use on a systematic basis consistent with the depreciation policy the Company adopts for similar depreciable assets that are owned. If there is no reasonable certainty that the Company will obtain ownership by the end of the lease term, the asset is fully depreciated over the shorter of the lease term and its useful life.
(b) Operating leases
Leases obligations under operating leases are recognized as an expense on a straight-line basis over the lease term. Contingent rents are charged as expenses in the periods in which they are incurred.
Impairment for financial assets A financial asset not carried at fair value through profit or loss is assessed at each reporting date to determine whether there is objective evidence that it is impaired. A financial asset is impaired if objective evidence indicates that a loss event has occurred after the initial recognition of the asset, and that the loss event had a negative effect on the estimated future cash flows of that asset that can be estimated reliably. However, losses expected as a result of future events, regardless of likelihood, are not recognized.
Objective evidence that a financial asset or group of assets are impaired includes :
(a) significant financial difficulty of the issuer or obligor (b) a breach of contract, such as a default or delinquency in interest or principal payments (c) the lender, for economic or legal reasons relating to the borrower's financial difficulty,
granting to the borrower a concession that the lender would not otherwise consider (d) it becoming probable that the borrower will enter bankruptcy or other financial reorganization (e) the disappearance of an active market for that financial asset because of financial difficulties (f) observable data indicating that there is a measurable decrease in the estimated future cash
flows from a group of financial assets since the initial recognition of those assets, although the decrease cannot yet be identified with the individual financial assets in the group.
In addition, for an equity instrument classified as available-for-sale, a significant or prolonged decline in its fair value below its cost is objective evidence of impairment. If financial assets have objective evidence that they are impaired, impairment losses are measured and recognized.
POSCO Notes to the Separate Financial Statements, Continued As of December 31, 2013 and 2012
20
(a) Financial assets measured at amortized cost
An impairment loss in respect of a financial asset measured at amortized cost is calculated as the difference between its carrying amount and the present value of its estimated future cash flows discounted at the asset’s original effective interest rate. If it is not practicable to obtain the instrument’s estimated future cash flows, impairment losses would be measured by using prices from any observable current market transactions. The Company can recognize impairment losses directly or establish a provision to cover impairment losses. If, in a subsequent period, the amount of the impairment loss decreases and the decrease can be related objectively to an event occurring after the impairment was recognized, the previously recognized impairment loss shall be reversed either directly or by adjusting an allowance account.
(b) Financial assets carried at cost
If there is objective evidence that an impairment loss has occurred on an unquoted equity instrument that is not carried at fair value because its fair value cannot be reliably measured, or on a derivative asset that is linked to and must be settled by delivery of such an unquoted equity instrument, the amount of the impairment loss is measured as the difference between the carrying amount of the financial asset and the present value of estimated future cash flows discounted at the current market rate of return for a similar financial asset. Such impairment losses are not reversed.
(c) Available-for-sale financial assets
When a decline in the fair value of an available-for-sale financial asset has been recognized in other comprehensive income and there is objective evidence that the asset is impaired, the cumulative loss that had been recognized in other comprehensive income shall be reclassified from equity to profit or loss as a reclassification adjustment even though the financial asset has not been derecognized. Impairment losses recognized in profit or loss for an investment in an equity instrument classified as available-for-sale are not reversed through profit or loss. If, in a subsequent period, the fair value of a debt instrument classified as available-for-sale increases and the increase can be objectively related to an event occurring after the impairment loss was recognized in profit or loss, the impairment loss shall be reversed, with the amount of the reversal recognized in profit or loss.
Impairment for non-financial assets
The carrying amounts of the Company’s non-financial assets, other than assets arising from employee benefits, inventories, deferred tax assets and non-current assets held for sale, are reviewed at the end of the reporting period to determine whether there is any indication of impairment. If any such indication exists, then the asset’s recoverable amount is estimated. Intangible assets that have indefinite useful lives or that are not yet available for use, irrespective of whether there is any indication of impairment, are tested for impairment annually by comparing their recoverable amount to their carrying amount.

POSCO Notes to the Separate Financial Statements, Continued As of December 31, 2013 and 2012
21
Management estimates the recoverable amount of an individual asset. If it is impossible to measure the individual recoverable amount of an asset, then management estimates the recoverable amount of cash-generating unit (“CGU”). A CGU is the smallest identifiable group of assets that generates cash inflows that are largely independent of the cash inflows from other assets or groups of assets. The recoverable amount of an asset or CGU is the greater of its value in use and its fair value less costs to sell. The value in use is estimated by applying a pre-tax discount rate that reflects current market assessments of the time value of money and the risks specific to the asset or CGU for which estimated future cash flows have not been adjusted, to the estimated future cash flows expected to be generated by the asset or CGU. An impairment loss is recognized if the carrying amount of an asset or a CGU exceeds its recoverable amount. Impairment losses are recognized in profit or loss. Any impairment identified at the CGU level is used to reduce the carrying amount of the other assets in the CGU on a pro rata basis. An impairment loss is reversed if there has been a change in the estimates used to determine the recoverable amount. An impairment loss is reversed only to the extent that the asset’s carrying amount does not exceed the carrying amount that would have been determined, net of depreciation or amortization, if no impairment loss had been recognized. Derivative financial instruments
Derivatives are initially recognized at fair value. Subsequent to initial recognition, derivatives are measured at fair value, and changes therein are recognized in profit or loss. (a) Embedded derivatives
Embedded derivatives are separated from the host contract and accounted for separately only if the following criteria have been met: (a) the economic characteristics and risks of the host contract and the embedded derivatives are not clearly and closely related to a separate instrument with the same terms as the embedded derivative that would meet the definition of a derivative, and (b) the hybrid (combined) instrument is not measured at fair value through profit or loss. Changes in the fair value of separable embedded derivatives from the host contract are recognized immediately in profit or loss.
(b) Other derivatives
Changes in the fair value of a derivative that is not designated as a hedging instrument are recognized immediately in profit or loss.
POSCO Notes to the Separate Financial Statements, Continued As of December 31, 2013 and 2012
22
Non-derivative financial liabilities
The Company classifies non-derivative financial liabilities into financial liabilities at fair value
through profit or loss or other financial liabilities in accordance with the substance of the contractual arrangement and the definitions of financial liabilities. The Company recognizes financial liabilities in the separate statement of financial position when the Company becomes a party to the contractual provisions of the financial liability.
(a) Financial liabilities at fair value through profit or loss
Financial liabilities at fair value through profit or loss include financial liabilities held for trading or designated as upon initial recognition. Subsequent to initial recognition, financial liabilities at fair value through profit or loss are measured at fair value, and changes therein are recognized in profit or loss. Upon initial recognition, transaction costs that are directly attributable to the acquisition are recognized in profit or loss as incurred.
(b) Other financial liabilities
Non-derivative financial liabilities other than financial liabilities at fair value through profit or loss are classified as other financial liabilities.
Financial guarantee liabilities are initially measured at their fair values and, if not designated as financial liabilities at fair value through profit or loss, they are subsequently measured at the higher of: 1) the amount of the best estimate of the expenditure required to settle the present obligation at
the end of the reporting period; and 2) the amount initially recognized less, cumulative amortization recognized on a straight-line
basis over the guarantee period At the date of initial recognition, other financial liabilities are measured at fair value minus transaction costs that are directly attributable to the acquisition. Subsequent to initial recognition, other financial liabilities are measured at amortized cost using the effective interest method.. The Company derecognizes a financial liability from the separate statement of financial position when it is extinguished (i.e. when the obligation specified in the contract is discharged, cancelled or expires).

POSCO Notes to the Separate Financial Statements, Continued As of December 31, 2013 and 2012
23
Employee benefits
(a) Short-term employee benefits
Short-term employee benefits are employee benefits that are due to be settled within twelve months after the end of the period in which the employees render the related service. When an employee has rendered service to the Company during an accounting period, the Company recognizes the undiscounted amount of short-term employee benefits expected to be paid in exchange for that service as profit or loss. If the Company has a legal or constructive obligation which can be reliably measured, the Company recognizes the amount of expected payment for profit-sharing and bonuses payable as liabilities.
(b) Other long-term employee benefits
Other long-term employee benefits include employee benefits that are settled beyond 12 months after the end of the period in which the employees render the related service, and are calculated at the present value of the amount of future benefit that employees have earned in return for their service in the current and prior periods, less the fair value of any related assets. The present value is determined by discounting the expected future cash flows using the interest rate of corporate bonds that have maturity dates approximating the terms of the Company’s obligations and that are denominated in the same currency in which the benefits are expected to be paid. Any actuarial gains and losses are recognized in profit or loss in the period in which they arise.
(c) Retirement benefits: Defined contribution plans
For defined contribution plans, when an employee has rendered service to the Company during a period, the Company recognizes the contribution payable to a defined contribution plan in exchange for that service as an accrued expense, after deducting any contributions already paid. If the contributions already paid exceed the contribution due for service before the end of the reporting period, the Company recognizes that excess as an asset (prepaid expense) to the extent that the prepayment will lead to a reduction in future payments or a cash refund.
(d) Retirement benefits: Defined benefit plans
A defined benefit plan is a post-employment benefit plan other than a defined contribution plan. The Company’s net obligation in respect of defined benefit plans is calculated by estimating the amount of future benefit that employees have earned in return for their service in the current and prior periods; that benefit is discounted to determine its present value. The fair value of plan assets is deducted. The calculation is performed annually by an independent actuary using the projected unit credit method.
The discount rate is the yield at the reporting date on corporate bonds that have maturity dates approximating the terms of the Company’s obligations and that are denominated in the same currency in which the benefits are expected to be paid. The Company recognizes all actuarial gains and losses arising from actuarial assumption changes and experiential adjustments in other comprehensive income when incurred.
POSCO Notes to the Separate Financial Statements, Continued As of December 31, 2013 and 2012
24
When the fair value of plan assets exceeds the present value of the defined benefit obligation, the Company recognizes an asset, to the extent of the total of cumulative unrecognized past service cost and present value of any economic benefits available in the form of refunds from the plan or reduction in the future contributions to the plan.
Remeasurements of net defined benefit liabilities, which comprise actuarial gains and losses, the return on plan assets (excluding interest) and the effect of the asset ceiling (if any, excluding interest), are recognized immediately in other comprehensive income. The Company determines the net interest expense(income) on the net defined benefit liability (asset) for the period by applying the discount rate used to measure the defined benefit obligation at the beginning of the annual period to the then-net defined benefit liability (asset), taking into account any changes in the net defined benefit liability (asset) during the period as a result of contributions and benefit payments, net interest expense and other expenses related to defined benefit plans are recognized in profit or loss.
When the benefits of a plan are changed or when a plan is curtailed, the resulting change in benefit that relates to past service or the gain or loss in curtailment is recognized immediately in profit or loss. The Company recognizes gains and losses on the settlement of a defined benefit plan when the settlement occurs.
Provisions
Provisions are recognized when the Company has a present legal or constructive obligation as a result of a past event, it is probable that an outflow of resources embodying economic benefits will be required to settle the obligation and a reliable estimate can be made of the amount of the obligation. The risks and uncertainties that inevitably surround many events and circumstances are taken into account in reaching the best estimate of a provision. Where the effect of the time value of money is material, provisions are determined at the present value of the expected future cash flows. Where some or all of the expenditures required to settle a provision are expected to be reimbursed by another party, the reimbursement shall be recognized when, and only when, it is virtually certain that reimbursement will be received if the entity settles the obligation. The reimbursement shall be treated as a separate asset. Provisions are reviewed at the end of each reporting period and adjusted to reflect the current best estimates. If it is no longer probable that an outflow of resources embodying economic benefits will be required to settle the obligation, the provision is reversed. A provision is used only for expenditures for which the provision was originally recognized.
POSCO Notes to the Separate Financial Statements, Continued As of December 31, 2013 and 2012
25
Equity instruments (a) Share capital
Common stock is classified as equity and the incremental costs arising directly attributable to the issuance of common stock less their tax effects are deducted from equity.
If the Company reacquires its own equity instruments, the amount of those instruments (“treasury shares”) are presented as a contra equity account. No gain or loss is recognized in profit or loss on the purchase, sale, issuance or cancellation of its own equity instruments. When treasury shares are sold or reissued subsequently, the amount received is recognized as an increase to equity, and the resulting surplus or deficit on the transaction is recorded in capital surplus.
(b) Hybrid bonds
Debt and equity instruments issued by the Company are classified as either financial liabilities or as equity in accordance with the substance of the contractual arrangements and the definitions of financial liability and an equity instrument. When the Company has an unconditional right to avoid delivering cash or another financial asset to settle a contractual obligation, the Company’s hybrid bond has been classified as an equity instrument.
Revenue Revenue from the sale of goods, services provided and the use of assets is measured at the fair value of the consideration received or receivable, net of returns and allowances, trade discounts and volume rebates, which are not significant for all periods presented. (a) Sale of goods
Revenue from the sale of goods in the ordinary course of activities is measured at the fair value of the consideration received or receivable, net of returns, trade discounts and volume rebates. Revenue is recognized when persuasive evidence exists, usually in the form of an executed sales agreement, that the significant risks and rewards of ownership have been transferred to the buyer, recovery of the consideration is probable, the associated costs and possible return of goods can be estimated reliably, there is no continuing management involvement with the goods, and the amount of revenue can be measured reliably. The appropriate timing for transfer of risks and rewards varies depending on the individual terms and conditions of the sales contract. For international sales, this timing depends on the type of international commercial terms of the contract.
(b) Rental income
Rental income from investment property, net of lease incentives granted, is recognized in profit or loss on a straight-line basis over the term of the lease.
POSCO Notes to the Separate Financial Statements, Continued As of December 31, 2013 and 2012
26
Finance income and finance costs Finance income comprises interest income on funds invested (including available-for-sale financial assets), dividend income, gains on the disposal of available-for-sale financial assets and changes in the fair value of financial assets at fair value through profit or loss. Interest income is recognized as it accrues in profit or loss, using the effective interest method. Dividend income is recognized in profit or loss on the date that the Company’s right to receive payment is established. Finance costs comprise interest expense on borrowings and changes in the fair value of financial assets at fair value through profit or loss. Borrowing costs are recognized in profit or loss using the effective interest rate method. Income taxes
Income tax expense comprises current and deferred tax. Current tax and deferred tax are recognized in profit or loss except to the extent that it relates to items recognized directly in equity or in other comprehensive income. (a) Current tax
Current tax is the expected tax payable or receivable on the taxable profit or loss for the year, using tax rates enacted or substantively enacted at the end of the reporting period and any adjustment to tax payable in respect of previous years. The taxable profit is different from the accounting profit for the period since the taxable profit is calculated excluding the temporary differences, which will be taxable or deductible in determining taxable profit of future periods, and non-taxable or non-deductible items from the accounting profit.
(b) Deferred tax
The measurement of deferred tax liabilities and deferred tax assets reflects the tax consequences that would follow from the manner in which the Company expects, at the end of the reporting period, to recover or settle the carrying amount of its assets and liabilities. The Company recognizes a deferred tax liability for all taxable temporary differences associated with investments in subsidiaries, associates, and joint ventures, except to the extent that the Company is able to control the timing of the reversal of the temporary difference and it is probable that the temporary difference will not reverse in the foreseeable future. The Company recognizes a deferred tax asset for deductible temporary differences arising from investments in subsidiaries, associates and joint ventures, to the extent that it is probable that the temporary difference will reverse in the foreseeable future and taxable profit will be available against which the temporary difference can be utilized. However, deferred tax is not recognized for the following temporary differences: taxable temporary differences arising on the initial recognition of goodwill, or the initial recognition of assets or liabilities in a transaction that is not a business combination and that affects neither accounting profit or loss nor taxable income.

POSCO Notes to the Separate Financial Statements, Continued As of December 31, 2013 and 2012
27
The carrying amount of a deferred tax asset is reviewed at the end of each reporting period and is reduced to the extent that it is no longer probable that sufficient taxable profit will be available to allow the benefit of part or all of that deferred tax asset to be utilized.
Deferred tax assets and liabilities are measured at the tax rates that are expected to apply to the period when the asset is realized or the liability is settled, based on tax rates (and tax laws) that have been enacted or substantively enacted by the end of the reporting period. The measurement of deferred tax liabilities and deferred tax assets reflects the tax consequences that would follow from the manner in which the Company expects, at the end of the reporting period to recover or settle the carrying amount of its assets and liabilities. Deferred tax assets and liabilities are offset only if there is a legally enforceable right to offset the related current tax liabilities and assets, and they relate to income taxes levied by the same tax authority and they intend to settle current tax liabilities and assets on a net basis.
Earnings per share Management calculates basic earnings per share (“EPS”) data for the Company’s ordinary shares, which is presented at the end of the statement of comprehensive income. Basic EPS is calculated by dividing profit attributable to ordinary shareholders of the Company by the weighted average number of ordinary shares outstanding during the period, adjusted for own shares held. New standards and interpretations not yet adopted The following new standards, interpretations and amendments to existing standards have been published and are mandatory for the Company for annual periods beginning after January 1, 2013, and the Company has not early adopted them. Management believes the impact of the amendments on the Company’s separate financial statements is not significant. (a) Amendments to K-IFRS No. 1032 “Financial Instruments : Presentation” The amendments clarified application guidance related to offsetting of a financial asset and a financial liability. The amendments are mandatorily effective for annual periods beginning on or after January 1, 2014 with earlier adoption permitted.
POSCO Notes to the Separate Financial Statements, Continued As of December 31, 2013 and 2012
28
4. Financial risk management The Company has exposure to the following risks from its use of financial instruments:
• credit risk • liquidity risk • market risk • capital risk
This note presents information about the Company’s exposure to each of the above risks, the Company’s objectives, policies and processes for measuring and managing risk, and the Company’s management of capital. Further quantitative disclosures are included throughout these separate financial statements. (a) Financial risk management
1) Risk management framework The Board of Directors has overall responsibility for the establishment and oversight of the Company’s risk management framework. The Company’s risk management policies are established to identify and analyze the risks faced by the Company, to set appropriate risk limits and controls, and to monitor risks and adherence to limits. Risk management policies and systems are reviewed regularly to reflect changes in market conditions and the Company’s activities. The Company, through its training and management standards and procedures, aims to develop a disciplined and constructive control environment in which all employees understand their roles and obligations.
2) Credit risk
Credit risk is the risk of financial loss to the Company if a customer or counterparty to a financial instrument fails to meet its contractual obligations, and arises principally from the Company’s receivables from customers and investment securities. In addition, credit risk arises from finance guarantees. The Company implements a credit risk management policy under which the Company only transacts business with counterparties that have a certain level of credit rate evaluated based on financial condition, historical experience, and other factors. The Company’s exposure to credit risk is influenced mainly by the individual characteristics of each customer. The default risk of a nation or an industry in which a customer operates its business does not have a significant influence on credit risk. The Company has established a credit policy under which each new customer is analyzed individually for creditworthiness.

POSCO Notes to the Separate Financial Statements, Continued As of December 31, 2013 and 2012
29
The Company establishes an allowance for impairment that represents its estimate of incurred losses in respect of trade and other receivables. The main components of this allowance are a specific loss component that relates to individually significant exposures, and a collective loss component established for companies of similar assets in respect of losses that have been incurred but not yet identified. The collective loss allowance is determined based on historical data of payment statistics for similar financial assets. Debt securities are analyzed individually, and an expected loss shall be directly deducted from debt securities. Credit risk also arises from transactions with financial institutions, and such transactions include transactions of cash and cash equivalents, various deposits, and financial instruments such as derivative contracts. The Company manages its exposure to this credit risk by only entering into transactions with banks that have high international credit ratings. The Company’s treasury department authorizes, manages, and overseas new transactions with financial institutions with whom the Company has no previous relationship. Furthermore, the Company limits its exposure to credit risk of financial guarantee contracts by strictly evaluating their necessity based on internal decision making processes, such as the approval of the board of directors.
3) Liquidity risk management
Liquidity risk is the risk that the Company will encounter difficulty in meeting the obligations associated with its financial liabilities that are settled by delivering cash or another financial asset. The Company’s approach to managing liquidity is to ensure, as far as possible, that it will always have sufficient liquidity to meet its liabilities when due, under both normal and stressed conditions, without incurring unacceptable losses or risking damage to the Company’s reputation.
The Company's cash flow from business, borrowing or financing is sufficient to meet the cash requirements for the Company’s strategic investments. Management believes that the Company is capable of raising funds by borrowing or financing if the Company is not able to generate cash flow requirements from its operations. The Company has committed borrowing facilities with various banks.
4) Market risk management
Market risk means that the fair value or future cash flows of a financial instrument will fluctuate because of changes in market prices. The goal of market risk management is optimization of profit and controlling the exposure to market risk within acceptable limits.
① Currency risk
The Company is exposed to currency risk on sales, purchases and borrowings that are denominated in a currency other than the functional currency of the Company, Korean Won.

POSCO Notes to the Separate Financial Statements, Continued As of December 31, 2013 and 2012
30
The Company’s policy in respect of foreign currency risks is a natural hedge whereby foreign currency income is offset with foreign currency expenditures. The remaining net exposures after the natural hedge have been hedged using derivative contracts such as forward exchange contracts. In addition, the Company’s derivative transactions are limited to hedging actual foreign currency transactions and speculative hedging is not permitted. Based on this policy, the Company has foreign currency borrowings from banks and hedges foreign currency risks of the foreign currency borrowings by using foreign currency swaps.
② Interest rate risk
The Company mostly borrows at fixed interest rates. The Company’s management monitors interest rate risks regularly.
③ Other market risk
Equity price risk arises from listed equity securities among available-for-sale equity securities. Management of the Company measures regularly the fair value of listed equity securities and the risk of variance in future cash flow caused by market price fluctuations. Significant investments are managed separately and all buy and sell decisions are approved by management of the Company.
(b) Management of capital risk
The fundamental goal of capital management is the maximization of shareholders’ value by means of the stable dividend policy and the retirement of treasury shares. The capital structure of the Company consists of equity and net debt, deducting cash and cash equivalents and current financial instruments from borrowings. The Company applied the same financial risk management strategy that was applied in the previous period. The equity attributable to owners as of December 31, 2013 and 2012 are as follows:
(in millions of Won)
Total borrowings 8,663,071 9,603,774 Less: Cash and cash equivalents 1,394,315 1,752,560Net borrowings 7,268,756 7,851,214Total equity 42,311,462 39,164,548
Net borrowings-to-equity ratio 17.18% 20.05%
2013 2012
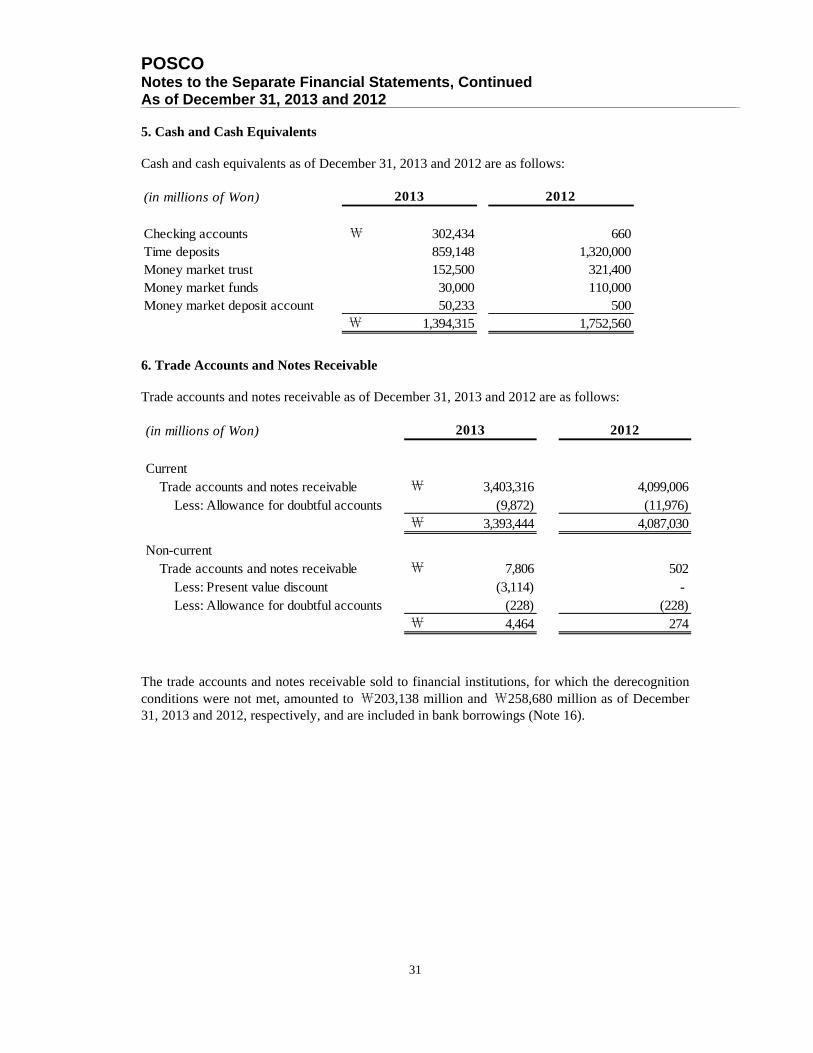
POSCO Notes to the Separate Financial Statements, Continued As of December 31, 2013 and 2012
31
5. Cash and Cash Equivalents Cash and cash equivalents as of December 31, 2013 and 2012 are as follows:
6. Trade Accounts and Notes Receivable Trade accounts and notes receivable as of December 31, 2013 and 2012 are as follows:
The trade accounts and notes receivable sold to financial institutions, for which the derecognition conditions were not met, amounted to ₩203,138 million and ₩258,680 million as of December 31, 2013 and 2012, respectively, and are included in bank borrowings (Note 16).
(in millions of Won)
Checking accounts ₩ 302,434 660Time deposits 859,148 1,320,000Money market trust 152,500 321,400Money market funds 30,000 110,000Money market deposit account 50,233 500
₩ 1,394,315 1,752,560
2013 2012
(in millions of Won)
CurrentTrade accounts and notes receivable ₩ 3,403,316 4,099,006 Less: Allowance for doubtful accounts (9,872) (11,976)
₩ 3,393,444 4,087,030
Non-currentTrade accounts and notes receivable ₩ 7,806 502 Less: Present value discount (3,114) - Less: Allowance for doubtful accounts (228) (228)
₩ 4,464 274
2013 2012
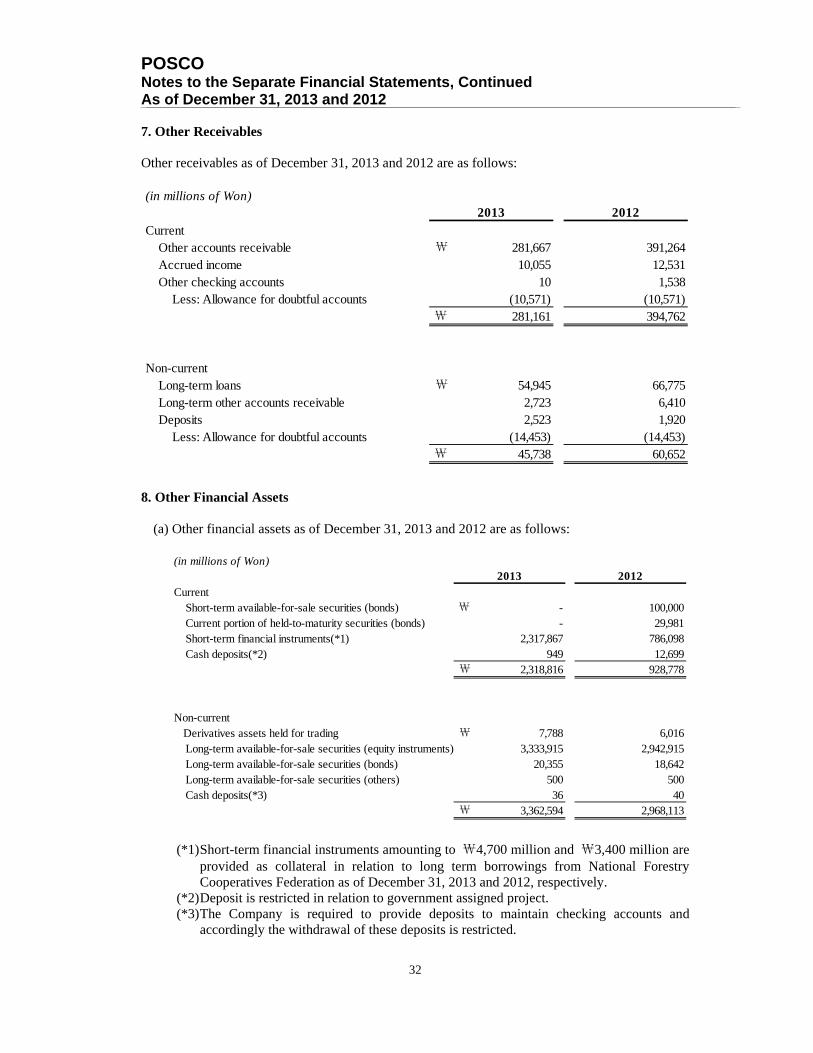
POSCO Notes to the Separate Financial Statements, Continued As of December 31, 2013 and 2012
32
7. Other Receivables Other receivables as of December 31, 2013 and 2012 are as follows:
8. Other Financial Assets
(a) Other financial assets as of December 31, 2013 and 2012 are as follows:
(*1) Short-term financial instruments amounting to ₩4,700 million and ₩3,400 million are
provided as collateral in relation to long term borrowings from National Forestry Cooperatives Federation as of December 31, 2013 and 2012, respectively.
(*2) Deposit is restricted in relation to government assigned project. (*3) The Company is required to provide deposits to maintain checking accounts and
accordingly the withdrawal of these deposits is restricted.
(in millions of Won)
CurrentOther accounts receivable ₩ 281,667 391,264Accrued income 10,055 12,531Other checking accounts 10 1,538 Less: Allowance for doubtful accounts (10,571) (10,571)
₩ 281,161 394,762
Non-currentLong-term loans ₩ 54,945 66,775Long-term other accounts receivable 2,723 6,410Deposits 2,523 1,920 Less: Allowance for doubtful accounts (14,453) (14,453)
₩ 45,738 60,652
2013 2012
(in millions of Won)
CurrentShort-term available-for-sale securities (bonds) ₩ - 100,000Current portion of held-to-maturity securities (bonds) - 29,981Short-term financial instruments(*1) 2,317,867 786,098Cash deposits(*2) 949 12,699
₩ 2,318,816 928,778
Non-current Derivatives assets held for trading ₩ 7,788 6,016
Long-term available-for-sale securities (equity instruments) 3,333,915 2,942,915Long-term available-for-sale securities (bonds) 20,355 18,642Long-term available-for-sale securities (others) 500 500Cash deposits(*3) 36 40
₩ 3,362,594 2,968,113
2013 2012
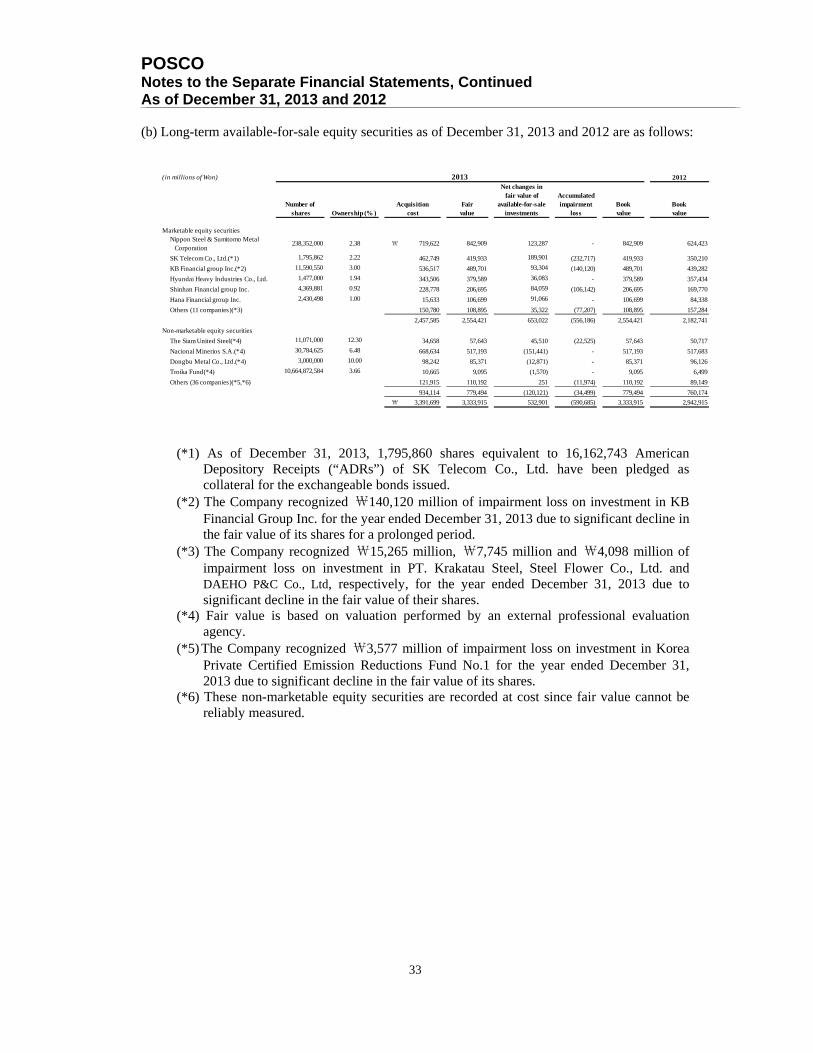
POSCO Notes to the Separate Financial Statements, Continued As of December 31, 2013 and 2012
33
(b) Long-term available-for-sale equity securities as of December 31, 2013 and 2012 are as follows:
(*1) As of December 31, 2013, 1,795,860 shares equivalent to 16,162,743 American
Depository Receipts (“ADRs”) of SK Telecom Co., Ltd. have been pledged as collateral for the exchangeable bonds issued.
(*2) The Company recognized ₩140,120 million of impairment loss on investment in KB Financial Group Inc. for the year ended December 31, 2013 due to significant decline in the fair value of its shares for a prolonged period.
(*3) The Company recognized ₩15,265 million, ₩7,745 million and ₩4,098 million of impairment loss on investment in PT. Krakatau Steel, Steel Flower Co., Ltd. and DAEHO P&C Co., Ltd, respectively, for the year ended December 31, 2013 due to significant decline in the fair value of their shares.
(*4) Fair value is based on valuation performed by an external professional evaluation agency.
(*5) The Company recognized ₩3,577 million of impairment loss on investment in Korea Private Certified Emission Reductions Fund No.1 for the year ended December 31, 2013 due to significant decline in the fair value of its shares.
(*6) These non-marketable equity securities are recorded at cost since fair value cannot be reliably measured.
(in millions of Won)
Number of shares Ownership (% )
Fairvalue
Net changes infair value of
available-for-saleinvestments
Accumulatedimpairment
lossBookvalue
Marketable equity securitiesNippon Steel & Sumitomo Metal Corporation
238,352,000 2.38 ₩ 719,622 842,909 123,287 - 842,909 624,423
SK Telecom Co., Ltd.(*1) 1,795,862 2.22 462,749 419,933 189,901 (232,717) 419,933 350,210
KB Financial group Inc.(*2) 11,590,550 3.00 536,517 489,701 93,304 (140,120) 489,701 439,282
Hyundai Heavy Industries Co., Ltd. 1,477,000 1.94 343,506 379,589 36,083 - 379,589 357,434
Shinhan Financial group Inc. 4,369,881 0.92 228,778 206,695 84,059 (106,142) 206,695 169,770
Hana Financial group Inc. 2,430,498 1.00 15,633 106,699 91,066 - 106,699 84,338
Others (11 companies)(*3) 150,780 108,895 35,322 (77,207) 108,895 157,284
2,457,585 2,554,421 653,022 (556,186) 2,554,421 2,182,741
Non-marketable equity securities
The Siam United Steel(*4) 11,071,000 12.30 34,658 57,643 45,510 (22,525) 57,643 50,717
Nacional Minerios S.A.(*4) 30,784,625 6.48 668,634 517,193 (151,441) - 517,193 517,683
Dongbu Metal Co., Ltd.(*4) 3,000,000 10.00 98,242 85,371 (12,871) - 85,371 96,126
Troika Fund(*4) 10,664,872,584 3.66 10,665 9,095 (1,570) - 9,095 6,499
Others (36 companies)(*5,*6) 121,915 110,192 251 (11,974) 110,192 89,149
934,114 779,494 (120,121) (34,499) 779,494 760,174
₩ 3,391,699 3,333,915 532,901 (590,685) 3,333,915 2,942,915
Bookvalue
Acquisitioncost
20122013
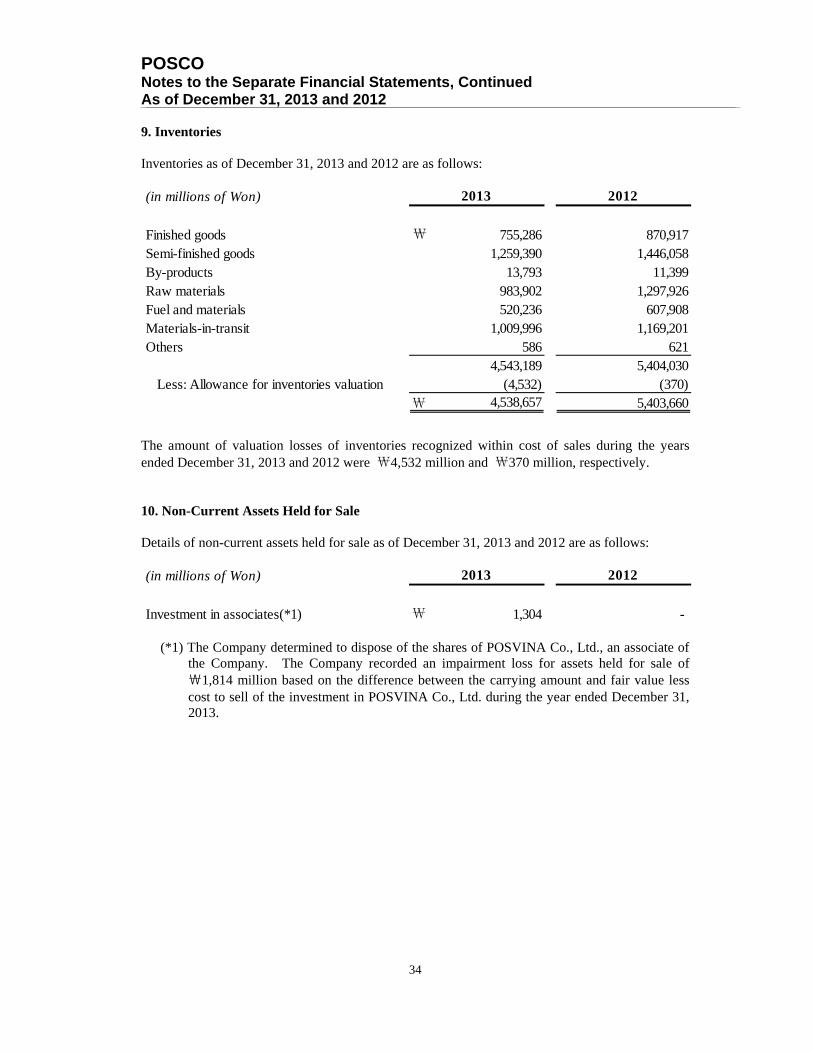
POSCO Notes to the Separate Financial Statements, Continued As of December 31, 2013 and 2012
34
9. Inventories Inventories as of December 31, 2013 and 2012 are as follows:
The amount of valuation losses of inventories recognized within cost of sales during the years ended December 31, 2013 and 2012 were ₩4,532 million and ₩370 million, respectively. 10. Non-Current Assets Held for Sale Details of non-current assets held for sale as of December 31, 2013 and 2012 are as follows:
(*1) The Company determined to dispose of the shares of POSVINA Co., Ltd., an associate of the Company. The Company recorded an impairment loss for assets held for sale of ₩1,814 million based on the difference between the carrying amount and fair value less cost to sell of the investment in POSVINA Co., Ltd. during the year ended December 31, 2013.
(in millions of Won)
Finished goods ₩ 755,286 870,917Semi-finished goods 1,259,390 1,446,058By-products 13,793 11,399Raw materials 983,902 1,297,926Fuel and materials 520,236 607,908Materials-in-transit 1,009,996 1,169,201Others 586 621
4,543,189 5,404,030 Less: Allowance for inventories valuation (4,532) (370)
₩ 4,538,657 5,403,660
2013 2012
(in millions of Won)
Investment in associates(*1) ₩ 1,304 -
2013 2012
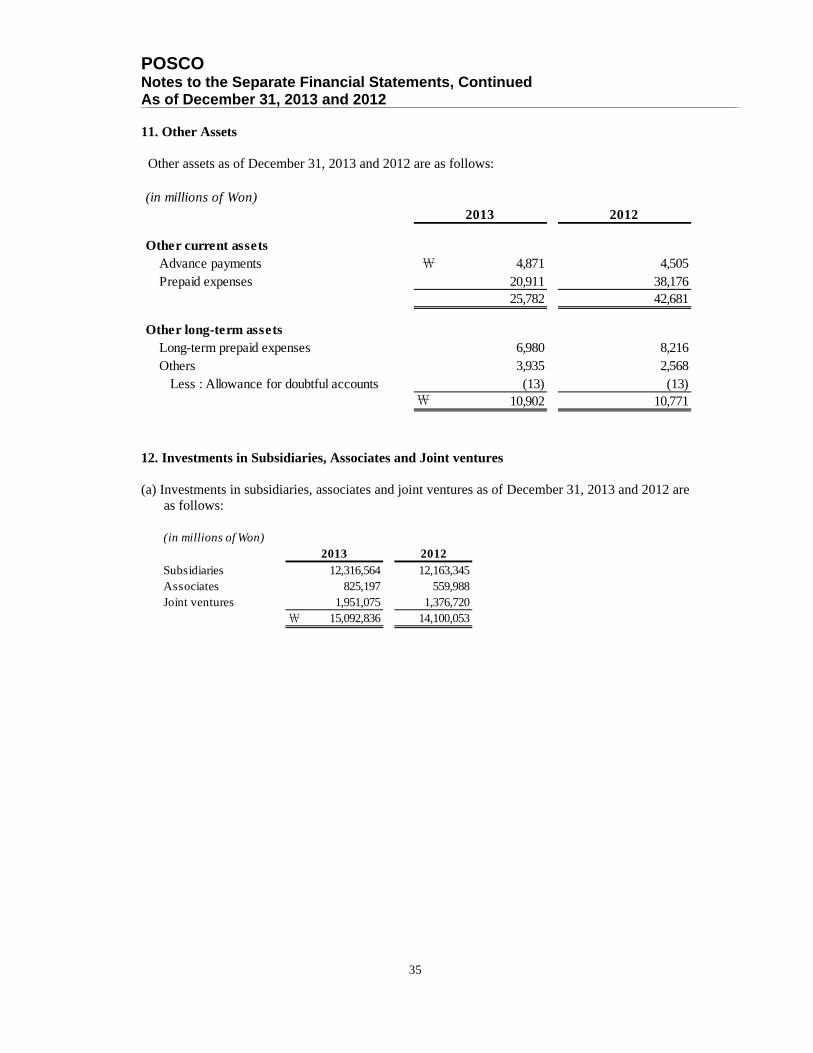
POSCO Notes to the Separate Financial Statements, Continued As of December 31, 2013 and 2012
35
11. Other Assets
Other assets as of December 31, 2013 and 2012 are as follows:
12. Investments in Subsidiaries, Associates and Joint ventures (a) Investments in subsidiaries, associates and joint ventures as of December 31, 2013 and 2012 are
as follows:
(in millions of Won)
Other current assetsAdvance payments ₩ 4,871 4,505Prepaid expenses 20,911 38,176
25,782 42,681
Other long-term assetsLong-term prepaid expenses 6,980 8,216Others 3,935 2,568 Less : Allowance for doubtful accounts (13) (13)
₩ 10,902 10,771
2013 2012
(in millions of Won)2012
Subsidiaries 12,316,564 12,163,345Associates 825,197 559,988Joint ventures 1,951,075 1,376,720
₩ 15,092,836 14,100,053
2013

POSCO Notes to the Separate Financial Statements, Continued As of December 31, 2013 and 2012
36
(b) Details of subsidiaries and carrying values as of December 31, 2013 and 2012 are as follows:
(in millions of Won)
2012
[Domestic] Country Principal operations Number of shares
Ownership(% )
Net assetvalue
Bookvalue
Bookvalue
Daewoo International Corporation Korea Trading 68,681,566 60.31 ₩ 3,371,481 2,215,646 3,371,481 3,371,481
POSCO ENGINEERING & CONSTRUCTION., LTD.
Korea Engineering and Construction 32,876,418 89.53 1,510,716 2,970,887 1,510,716 1,510,716
POSCO ENERGY CO., LTD. Korea Generation of Electricity 40,234,508 89.02 658,176 1,589,280 658,176 658,176
POSCO Specialty Steel Co., Ltd. Korea Steel manufacturing and sales 26,000,000 72.09 628,842 1,259,107 628,842 628,842
POSCO Processing&Service Korea Steel sales and service 17,155,000 95.31 421,927 693,895 421,927 421,927
POSCO AST Korea Steel manufacturing and sales 17,386,952 100.00 176,609 153,598 176,609 176,609
POSCO Specialty Steel Co., Ltd. Korea Coated steel manufacturing 3,412,000 56.87 108,421 169,564 108,421 108,421
POSCO M-TECH(*1) Korea Packing materials manufacturing 20,342,460 48.85 107,278 153,202 107,278 107,278
POSTECH Venture Capital Co., Ltd. Korea Investment in venture companies 19,700,000 95.00 103,780 107,417 103,780 103,780
POSCO CHEMTECH Korea Manufacturing and sales 3,544,200 60.00 100,535 449,272 100,535 100,535
POSCO ICT KoreaComputer hardware and software distribution
99,403,282 65.38 70,990 406,240 70,990 70,990
POSMATE(*2) Korea Business facility maintenance 806,318 54.46 63,222 158,039 63,222 -
POSHIMETAL Co., Ltd. Korea Steel manufacturing and sales 10,023,000 65.00 49,452 9,082 49,452 49,452
POSCO Family Strategy Fund Korea Financial investment 400 60.79 40,000 61,026 40,000 40,000
Busan E&E Co,. Ltd.(*3) KoreaMunicipal solid waste fuel and power generation
6,029,660 70.00 30,148 39,678 30,148 30,148
Others (12 companies) 178,264 425,073 178,264 239,528
₩ 7,619,841 10,861,006 7,619,841 7,617,883
2013
Acquisitioncost
(in millions of Won)2012
[Foreign] Country Principal operationsNumber of
sharesOwnership
(% )Net asset
valueBookvalue
Bookvalue
PT. KRAKATAU POSCO Indonesia Steel manufacturing and sales 693,700 70.00 ₩ 764,198 972,767 808,492 732,503
POSCO Thainox Public Co., Ltd.(*4) ThailandStainless steel manufacturing and sales
6,620,532,219 84.93 551,807 284,084 340,249 551,807
POSCO Australia Pty. Ltd. AustrailiaIron ore sales and mine development 761,775 100.00 330,623 643,016 330,623 330,623
POSCO WA Pty. Ltd. AustrailiaSteel sales and mine development
418,340,038 100.00 446,093 317,212 446,093 312,851
POSCO Maharashtra Steel Private Ltd.
India Steel manufacturing and sales 150,076,072 100.00 343,564 110,589 355,987 302,053
Zhangjiagang Pohang Stainless Steel Co., Ltd.
ChinaStainless steel manufacturing and sales
- 58.60 283,845 499,827 284,753 285,201
POSCO-China Holding Corp. China Investment management - 100.00 240,430 252,494 240,430 223,436
POSCO-India Private Ltd. India Steel manufacturing and sales 764,999,999 99.99 184,815 114,872 184,815 184,815
POSCO-Mexico S.A. DE C.V. Mexico Plate steel manufacturing 2,686,705,272 84.84 180,069 199,937 182,080 182,048
POSCO-Vietnam Co., Ltd. Vietnam Steel manufacturing - 85.00 154,691 32,055 157,295 155,428
POSCO VST Co., Ltd. Vietnam Stainless steel manufacturing - 95.65 144,573 27,833 145,288 145,462
POSCO America Corporation USA Trading-Steel 391,042 99.45 140,381 52,404 140,381 140,381
POSCO(Guangdong) Automotive Steel Co., Ltd.
China Steel manufacturing and selling 117,187,089 83.64 130,751 124,368 131,291 131,618
POSCO ASSAN TST STEEL Industry Turkey Steel manufacturing and sales 144,579,160 60.00 92,800 42,633 95,710 96,215
POSCO Investment Co., Ltd. Hong Kong Finance 4,999,999 99.99 85,521 100,166 87,211 86,323
POSCO-JAPAN Co., Ltd. Japan Trading-Steel 90,438 100.00 68,436 106,747 68,436 68,436
Qingdao Pohang Stainless Steel Co., Ltd.
ChinaStainless steel manufacturing and sales
- 70.00 65,982 90,927 65,982 65,982
POSCO (Suzhou) Automotive Processing Center Co., Ltd.
China Steel manufacturing and sales - 90.00 62,494 113,655 62,494 62,494
POSCO Electrical Steel India Private Limited
IndiaElectrical steel manufacturing and sales
24,120,664 100.00 57,119 31,507 58,662 48,058
POSCO AFRICA (PROPRIETARY) LIMITED
South Africa Trading 1,390 100.00 50,297 44,854 50,297 5,629
POSCO China Dalian Plate Processing Center Co., Ltd.
ChinaHeavy plate processing and marketing
- 80.00 32,992 20,657 32,992 32,992
POSCO Asia Co., Ltd. Hong Kong Steel transit trade 9,360,000 100.00 32,189 39,216 32,189 32,189
POSCO (Guangdong) Steel Co., Ltd. China Plate steel sheet manufacturing - 87.04 31,299 44,424 31,299 31,299
POSCO-Malaysia SDN. BHD. Malaysia Steel manufacturing and sales 98,486,000 80.07 31,027 (22,292) 31,027 31,027
POSCO-URUGUAY S.A. Uruguay Wood manufacturing and sales 526,105,608 98.04 29,341 22,685 29,341 27,724
Others (30 companies) 303,304 436,761 303,306 278,868
4,838,641 4,703,398 4,696,723 4,545,462₩ 12,458,482 15,564,404 12,316,564 12,163,345
2013Acquisition
cost
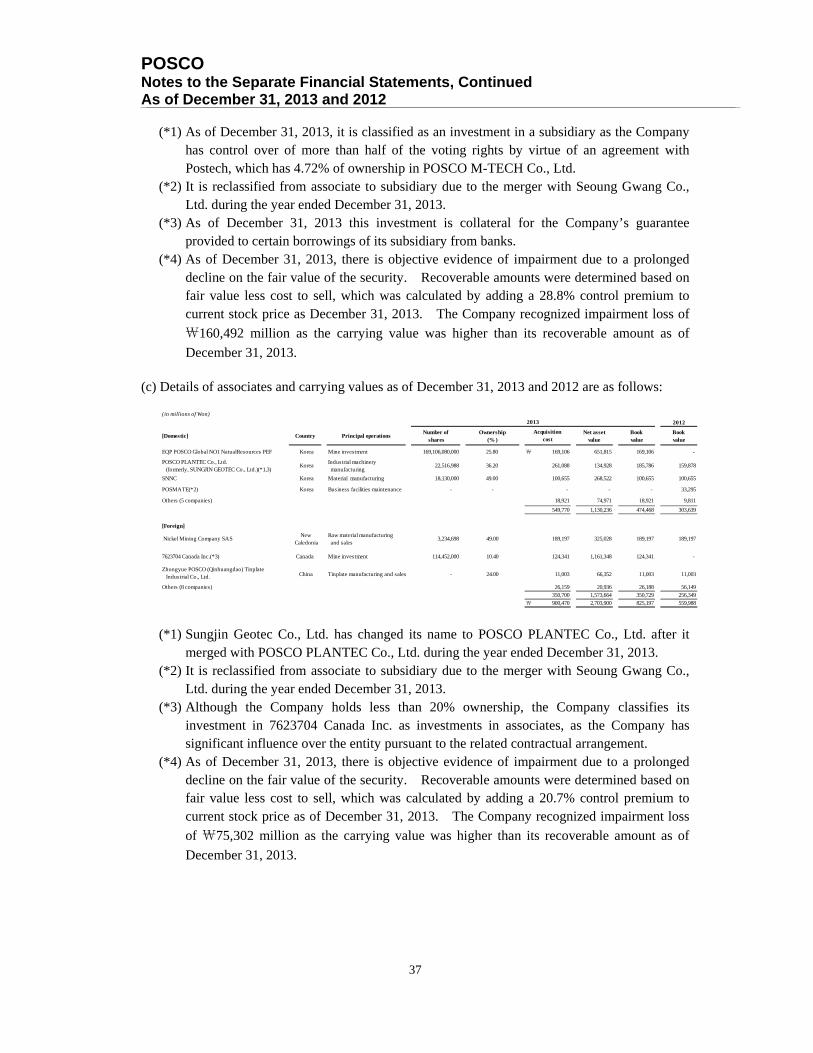
POSCO Notes to the Separate Financial Statements, Continued As of December 31, 2013 and 2012
37
(*1) As of December 31, 2013, it is classified as an investment in a subsidiary as the Company
has control over of more than half of the voting rights by virtue of an agreement with Postech, which has 4.72% of ownership in POSCO M-TECH Co., Ltd.
(*2) It is reclassified from associate to subsidiary due to the merger with Seoung Gwang Co., Ltd. during the year ended December 31, 2013.
(*3) As of December 31, 2013 this investment is collateral for the Company’s guarantee provided to certain borrowings of its subsidiary from banks.
(*4) As of December 31, 2013, there is objective evidence of impairment due to a prolonged decline on the fair value of the security. Recoverable amounts were determined based on fair value less cost to sell, which was calculated by adding a 28.8% control premium to current stock price as December 31, 2013. The Company recognized impairment loss of
₩160,492 million as the carrying value was higher than its recoverable amount as of
December 31, 2013. (c) Details of associates and carrying values as of December 31, 2013 and 2012 are as follows:
(*1) Sungjin Geotec Co., Ltd. has changed its name to POSCO PLANTEC Co., Ltd. after it merged with POSCO PLANTEC Co., Ltd. during the year ended December 31, 2013.
(*2) It is reclassified from associate to subsidiary due to the merger with Seoung Gwang Co., Ltd. during the year ended December 31, 2013.
(*3) Although the Company holds less than 20% ownership, the Company classifies its investment in 7623704 Canada Inc. as investments in associates, as the Company has significant influence over the entity pursuant to the related contractual arrangement.
(*4) As of December 31, 2013, there is objective evidence of impairment due to a prolonged decline on the fair value of the security. Recoverable amounts were determined based on fair value less cost to sell, which was calculated by adding a 20.7% control premium to current stock price as of December 31, 2013. The Company recognized impairment loss
of ₩75,302 million as the carrying value was higher than its recoverable amount as of
December 31, 2013.
(in millions of Won)
2012
[Domestic] Country Principal operationsNumber of
sharesOwnership
(% )Net asset
valueBookvalue
Bookvalue
EQP POSCO Global NO1 NatualResources PEF Korea Mine investment 169,106,080,000 25.80 ₩ 169,106 651,815 169,106 -
POSCO PLANTEC Co., Ltd. (formerly, SUNGJIN GEOTEC Co., Ltd.)(*1,3)
KoreaIndustrial machinery manufacturing
22,516,988 36.20 261,088 134,928 185,786 159,878
SNNC Korea Material manufacturing 18,130,000 49.00 100,655 268,522 100,655 100,655
POSMATE(*2) Korea Business facilities maintenance - - - - - 33,295
Others (5 companies) 18,921 74,971 18,921 9,811
549,770 1,130,236 474,468 303,639
[Foreign]
Nickel Mining Company SAS New
CaledoniaRaw material manufacturing and sales
3,234,698 49.00 189,197 325,028 189,197 189,197
7623704 Canada Inc.(*3) Canada Mine investment 114,452,000 10.40 124,341 1,161,348 124,341 -
Zhongyue POSCO (Qinhuangdao) Tinplate Industrial Co., Ltd. China Tinplate manufacturing and sales - 24.00 11,003 66,352 11,003 11,003
Others (8 companies) 26,159 20,936 26,188 56,149
350,700 1,573,664 350,729 256,349
₩ 900,470 2,703,900 825,197 559,988
Acquisitioncost
2013
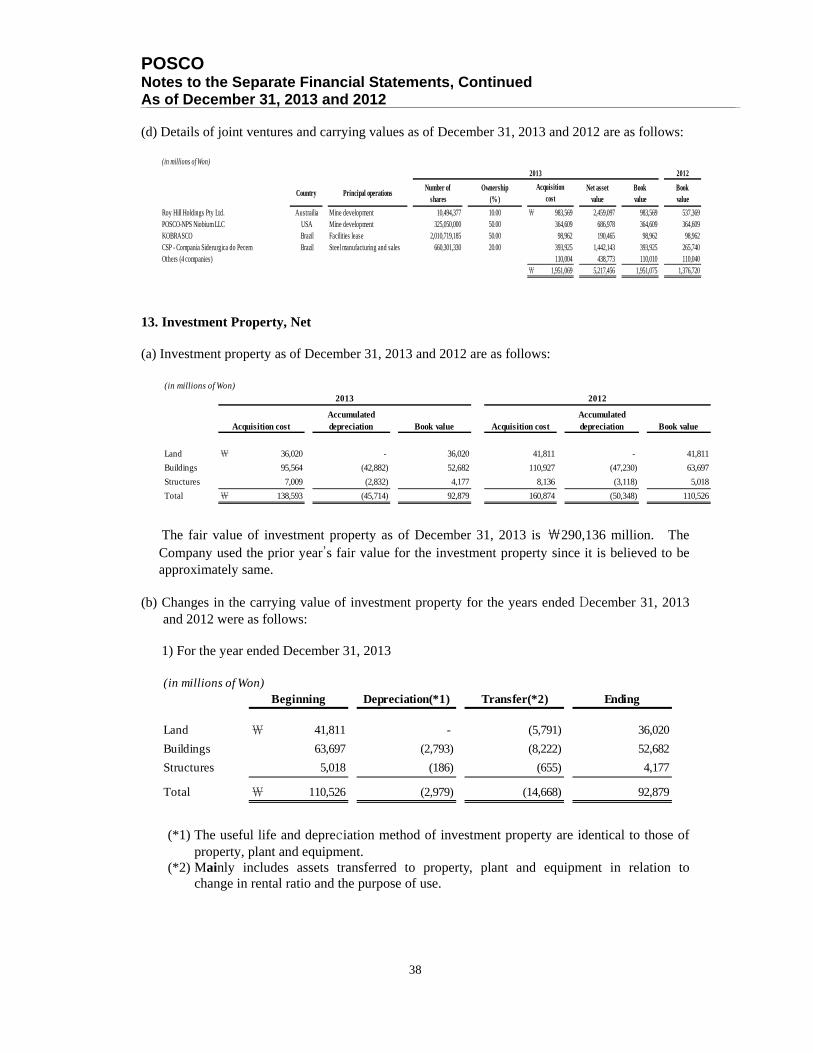
POSCO Notes to the Separate Financial Statements, Continued As of December 31, 2013 and 2012
38
(d) Details of joint ventures and carrying values as of December 31, 2013 and 2012 are as follows:
13. Investment Property, Net (a) Investment property as of December 31, 2013 and 2012 are as follows:
The fair value of investment property as of December 31, 2013 is ₩290,136 million. The
Company used the prior year’s fair value for the investment property since it is believed to be approximately same.
(b) Changes in the carrying value of investment property for the years ended December 31, 2013
and 2012 were as follows:
1) For the year ended December 31, 2013
(*1) The useful life and depreciation method of investment property are identical to those of
property, plant and equipment. (*2) Mainly includes assets transferred to property, plant and equipment in relation to
change in rental ratio and the purpose of use.
(in millions of Won)2012
Country Principal operationsNumber of
sharesOwnership
(% )Net asset
valueBookvalue
Bookvalue
Roy Hill Holdings Pty Ltd. Austrailia Mine development 10,494,377 10.00 ₩ 983,569 2,459,097 983,569 537,369POSCO-NPS Niobium LLC USA Mine development 325,050,000 50.00 364,609 686,978 364,609 364,609KOBRASCO Brazil Facilities lease 2,010,719,185 50.00 98,962 190,465 98,962 98,962CSP - Compania Siderurgica do Pecem Brazil Steel manufacturing and sales 660,301,330 20.00 393,925 1,442,143 393,925 265,740Others (4 companies) 110,004 438,773 110,010 110,040
₩ 1,951,069 5,217,456 1,951,075 1,376,720
2013
Acquisitioncost
(in millions of Won)
Book value Acquisition cost Book value
Land ₩ 36,020 - 36,020 41,811 - 41,811
Buildings 95,564 (42,882) 52,682 110,927 (47,230) 63,697
Structures 7,009 (2,832) 4,177 8,136 (3,118) 5,018
Total ₩ 138,593 (45,714) 92,879 160,874 (50,348) 110,526
2013 2012
Acquisition costAccumulateddepreciation
Accumulateddepreciation
(in millions of Won)
Land ₩ 41,811 - (5,791) 36,020
Buildings 63,697 (2,793) (8,222) 52,682
Structures 5,018 (186) (655) 4,177
Total ₩ 110,526 (2,979) (14,668) 92,879
Depreciation(*1)Beginning Transfer(*2) Ending
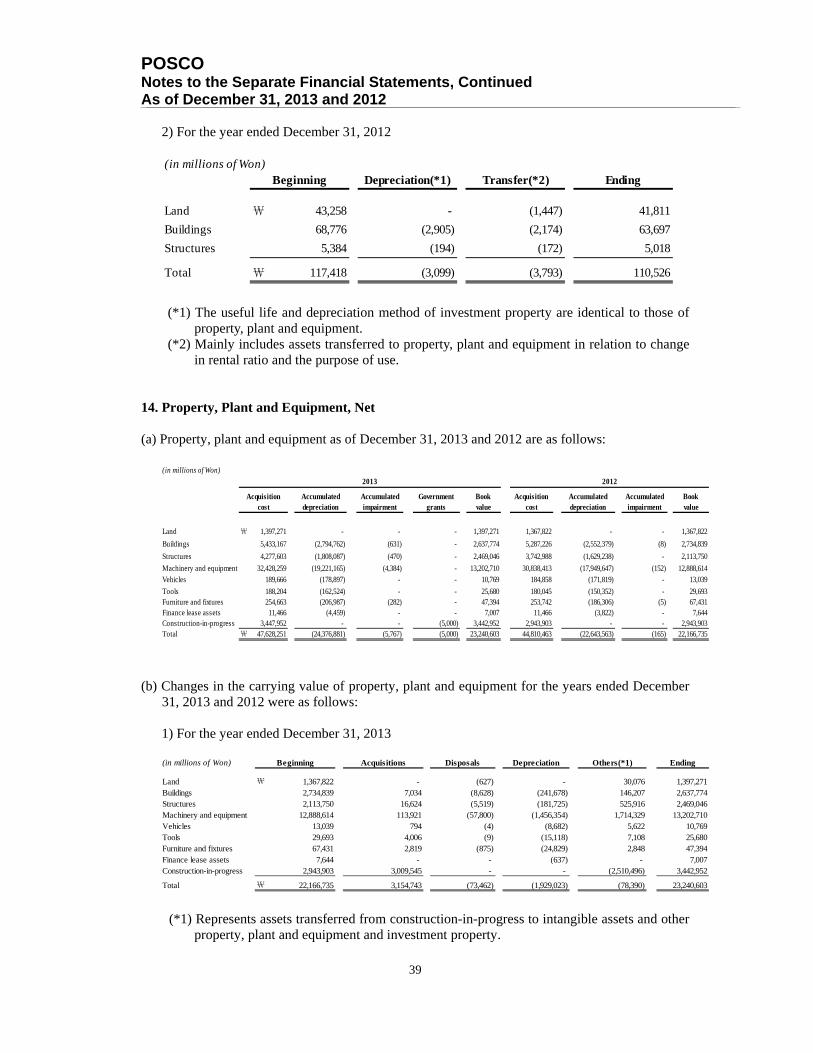
POSCO Notes to the Separate Financial Statements, Continued As of December 31, 2013 and 2012
39
2) For the year ended December 31, 2012
(*1) The useful life and depreciation method of investment property are identical to those of
property, plant and equipment. (*2) Mainly includes assets transferred to property, plant and equipment in relation to change
in rental ratio and the purpose of use.
14. Property, Plant and Equipment, Net (a) Property, plant and equipment as of December 31, 2013 and 2012 are as follows:
(b) Changes in the carrying value of property, plant and equipment for the years ended December 31, 2013 and 2012 were as follows:
1) For the year ended December 31, 2013
(*1) Represents assets transferred from construction-in-progress to intangible assets and other
property, plant and equipment and investment property.
(in millions of Won)
Land ₩ 43,258 - (1,447) 41,811
Buildings 68,776 (2,905) (2,174) 63,697
Structures 5,384 (194) (172) 5,018
Total ₩ 117,418 (3,099) (3,793) 110,526
Depreciation(*1) EndingBeginning Transfer(*2)
(in millions of Won)
Accumulatedimpairment
Governmentgrants
Bookvalue
Acquisitioncost
Accumulatedimpairment
Bookvalue
Land ₩ 1,397,271 - - - 1,397,271 1,367,822 - - 1,367,822
Buildings 5,433,167 (2,794,762) (631) - 2,637,774 5,287,226 (2,552,379) (8) 2,734,839
Structures 4,277,603 (1,808,087) (470) - 2,469,046 3,742,988 (1,629,238) - 2,113,750
Machinery and equipment 32,428,259 (19,221,165) (4,384) - 13,202,710 30,838,413 (17,949,647) (152) 12,888,614
Vehicles 189,666 (178,897) - - 10,769 184,858 (171,819) - 13,039
Tools 188,204 (162,524) - - 25,680 180,045 (150,352) - 29,693Furniture and fixtures 254,663 (206,987) (282) - 47,394 253,742 (186,306) (5) 67,431Finance lease assets 11,466 (4,459) - - 7,007 11,466 (3,822) - 7,644Construction-in-progress 3,447,952 - - (5,000) 3,442,952 2,943,903 - - 2,943,903Total ₩ 47,628,251 (24,376,881) (5,767) (5,000) 23,240,603 44,810,463 (22,643,563) (165) 22,166,735
2013 2012
Acquisitioncost
Accumulateddepreciation
Accumulateddepreciation
(in millions of Won)
Land ₩ 1,367,822 - (627) - 30,076 1,397,271Buildings 2,734,839 7,034 (8,628) (241,678) 146,207 2,637,774Structures 2,113,750 16,624 (5,519) (181,725) 525,916 2,469,046Machinery and equipment 12,888,614 113,921 (57,800) (1,456,354) 1,714,329 13,202,710Vehicles 13,039 794 (4) (8,682) 5,622 10,769Tools 29,693 4,006 (9) (15,118) 7,108 25,680Furniture and fixtures 67,431 2,819 (875) (24,829) 2,848 47,394Finance lease assets 7,644 - - (637) - 7,007Construction-in-progress 2,943,903 3,009,545 - - (2,510,496) 3,442,952
Total ₩ 22,166,735 3,154,743 (73,462) (1,929,023) (78,390) 23,240,603
EndingDepreciation Others(*1)Beginning Acquisitions Disposals
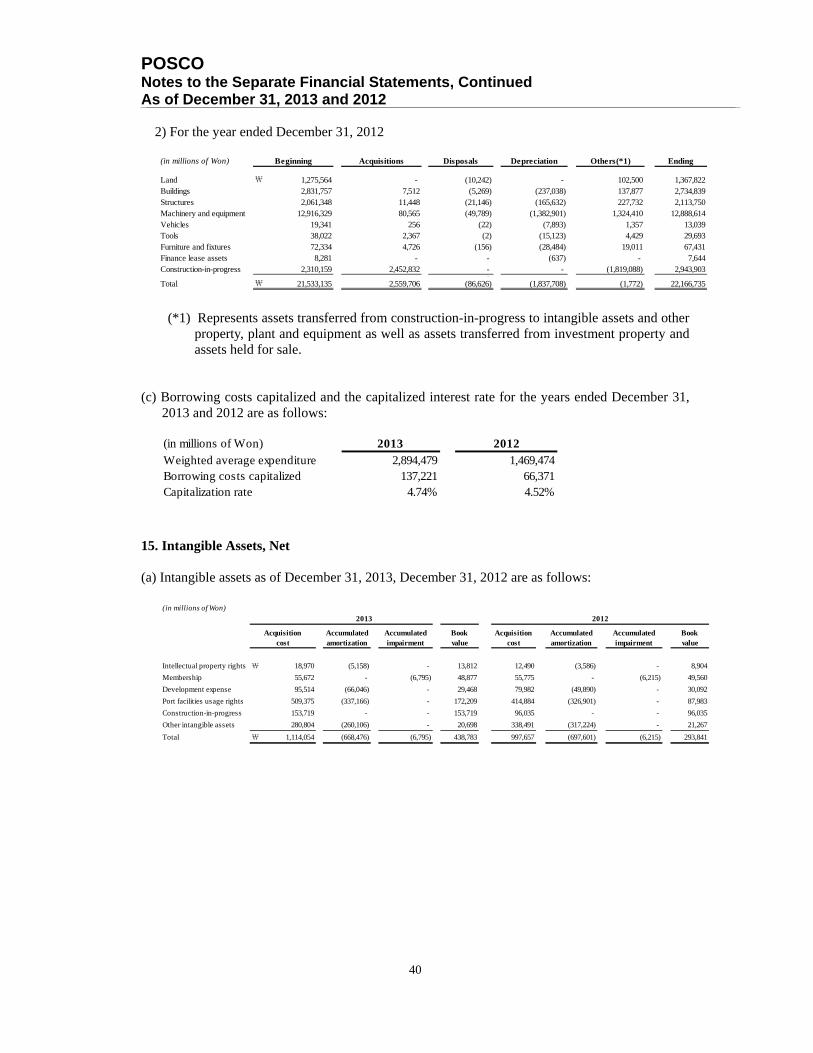
POSCO Notes to the Separate Financial Statements, Continued As of December 31, 2013 and 2012
40
2) For the year ended December 31, 2012
(*1) Represents assets transferred from construction-in-progress to intangible assets and other property, plant and equipment as well as assets transferred from investment property and assets held for sale.
(c) Borrowing costs capitalized and the capitalized interest rate for the years ended December 31,
2013 and 2012 are as follows:
15. Intangible Assets, Net (a) Intangible assets as of December 31, 2013, December 31, 2012 are as follows:
(in millions of Won)
Land ₩ 1,275,564 - (10,242) - 102,500 1,367,822Buildings 2,831,757 7,512 (5,269) (237,038) 137,877 2,734,839Structures 2,061,348 11,448 (21,146) (165,632) 227,732 2,113,750Machinery and equipment 12,916,329 80,565 (49,789) (1,382,901) 1,324,410 12,888,614Vehicles 19,341 256 (22) (7,893) 1,357 13,039Tools 38,022 2,367 (2) (15,123) 4,429 29,693Furniture and fixtures 72,334 4,726 (156) (28,484) 19,011 67,431Finance lease assets 8,281 - - (637) - 7,644Construction-in-progress 2,310,159 2,452,832 - - (1,819,088) 2,943,903
-Total ₩ 21,533,135 2,559,706 (86,626) (1,837,708) (1,772) 22,166,735
EndingDepreciation Others(*1)Beginning Acquisitions Disposals
(in millions of Won) 2013 2012Weighted average expenditure 2,894,479 1,469,474Borrowing costs capitalized 137,221 66,371Capitalization rate 4.74% 4.52%
(in millions of Won)
Accumulatedamortization
Accumulatedimpairment
Bookvalue
Acquisitioncost
Accumulatedamortization
Accumulatedimpairment
Bookvalue
Intellectual property rights ₩ 18,970 (5,158) - 13,812 12,490 (3,586) - 8,904
Membership 55,672 - (6,795) 48,877 55,775 - (6,215) 49,560
Development expense 95,514 (66,046) - 29,468 79,982 (49,890) - 30,092
Port facilities usage rights 509,375 (337,166) - 172,209 414,884 (326,901) - 87,983
Construction-in-progress 153,719 - - 153,719 96,035 - - 96,035
Other intangible assets 280,804 (260,106) - 20,698 338,491 (317,224) - 21,267
Total ₩ 1,114,054 (668,476) (6,795) 438,783 997,657 (697,601) (6,215) 293,841
2013 2012
Acquisitioncost
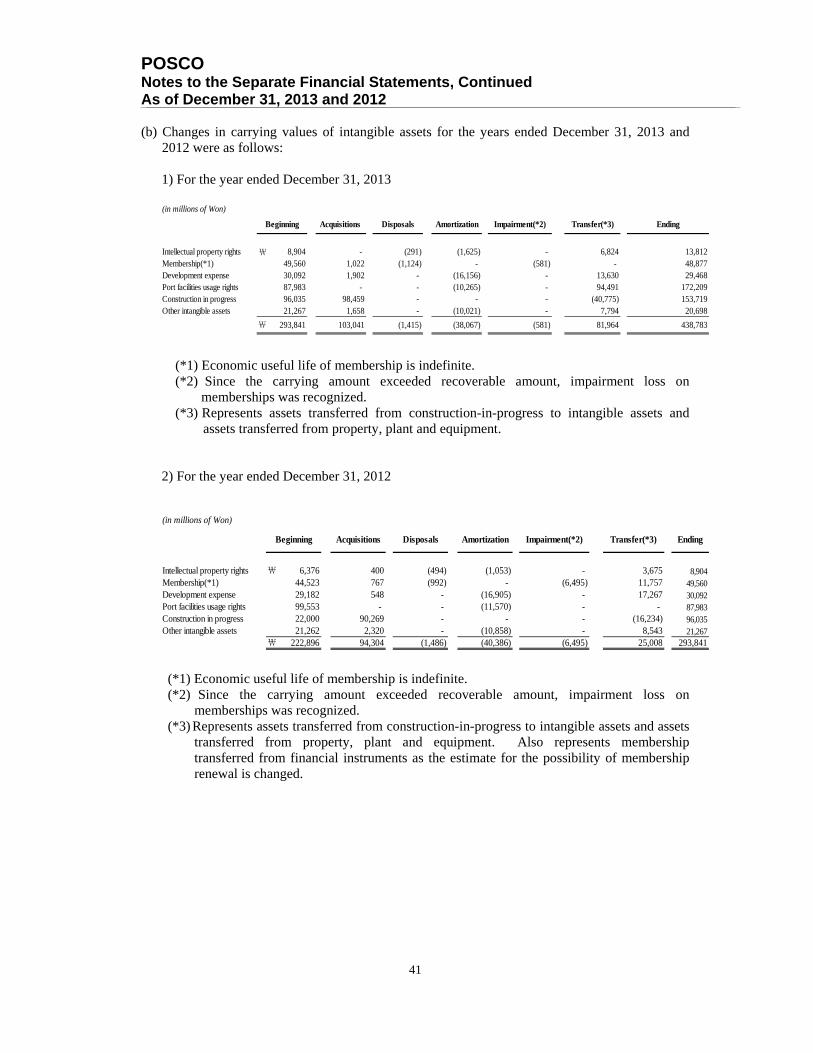
POSCO Notes to the Separate Financial Statements, Continued As of December 31, 2013 and 2012
41
(b) Changes in carrying values of intangible assets for the years ended December 31, 2013 and
2012 were as follows:
1) For the year ended December 31, 2013
(*1) Economic useful life of membership is indefinite. (*2) Since the carrying amount exceeded recoverable amount, impairment loss on
memberships was recognized. (*3) Represents assets transferred from construction-in-progress to intangible assets and
assets transferred from property, plant and equipment.
2) For the year ended December 31, 2012
(*1) Economic useful life of membership is indefinite. (*2) Since the carrying amount exceeded recoverable amount, impairment loss on
memberships was recognized. (*3) Represents assets transferred from construction-in-progress to intangible assets and assets
transferred from property, plant and equipment. Also represents membership transferred from financial instruments as the estimate for the possibility of membership renewal is changed.
(in millions of Won)
Intellectual property rights ₩ 8,904 - (291) (1,625) - 6,824 13,812Membership(*1) 49,560 1,022 (1,124) - (581) - 48,877Development expense 30,092 1,902 - (16,156) - 13,630 29,468Port facilities usage rights 87,983 - - (10,265) - 94,491 172,209Construction in progress 96,035 98,459 - - - (40,775) 153,719Other intangible assets 21,267 1,658 - (10,021) - 7,794 20,698
₩ 293,841 103,041 (1,415) (38,067) (581) 81,964 438,783
EndingTransfer(*3)Amortization Impairment(*2)Beginning Acquisitions Disposals
(in millions of Won)
Ending
Intellectual property rights ₩ 6,376 400 (494) (1,053) - 3,675 8,904Membership(*1) 44,523 767 (992) - (6,495) 11,757 49,560Development expense 29,182 548 - (16,905) - 17,267 30,092Port facilities usage rights 99,553 - - (11,570) - - 87,983Construction in progress 22,000 90,269 - - - (16,234) 96,035Other intangible assets 21,262 2,320 - (10,858) - 8,543 21,267
₩ 222,896 94,304 (1,486) (40,386) (6,495) 25,008 293,841
Impairment(*2) Transfer(*3)AmortizationBeginning Acquisitions Disposals

POSCO Notes to the Separate Financial Statements, Continued As of December 31, 2013 and 2012
42
16. Borrowings (a) Borrowings as of December 31, 2013 and 2012 are as follows:
(b) Short-term borrowings as of December 31, 2013 and 2012 are as follows:
(in millions of Won)
Short-term borrowings Short-term borrowings ₩ 203,138 796,662
188,381 34,769Current portion of loans from foreign financial institutions 927 901Current portion of debentures 1,540,109 1,283,742
(1,272) (1,953) Add : Current portion of premium on debentures redemption - 2,419
₩ 1,931,283 2,116,540
Long-term borrowingsLong-term borrowings ₩ 648,251 843,015Loans from foreign financial institution 1,140 2,009Debentures 6,107,973 6,680,192
(38,167) (53,617) Add : Premium on debentures redemption 12,591 15,635
₩ 6,731,788 7,487,234
2013 2012
Current portion of long-term borrowings
Less : Current portion of discount on debentures issued
Less : Discount on debentures issued
(in millions of Won)Bank
Royal Bank of Scotland ₩ - 93,230Deutsche Bank - 133,833Bank of America - 114,093DBS Bank - 121,544JP Morgan Chase & Co. - 75,282Others (Transfer of account receivables not qualify for derecognition)
203,138 258,680
₩ 203,138 796,662
2013 2012
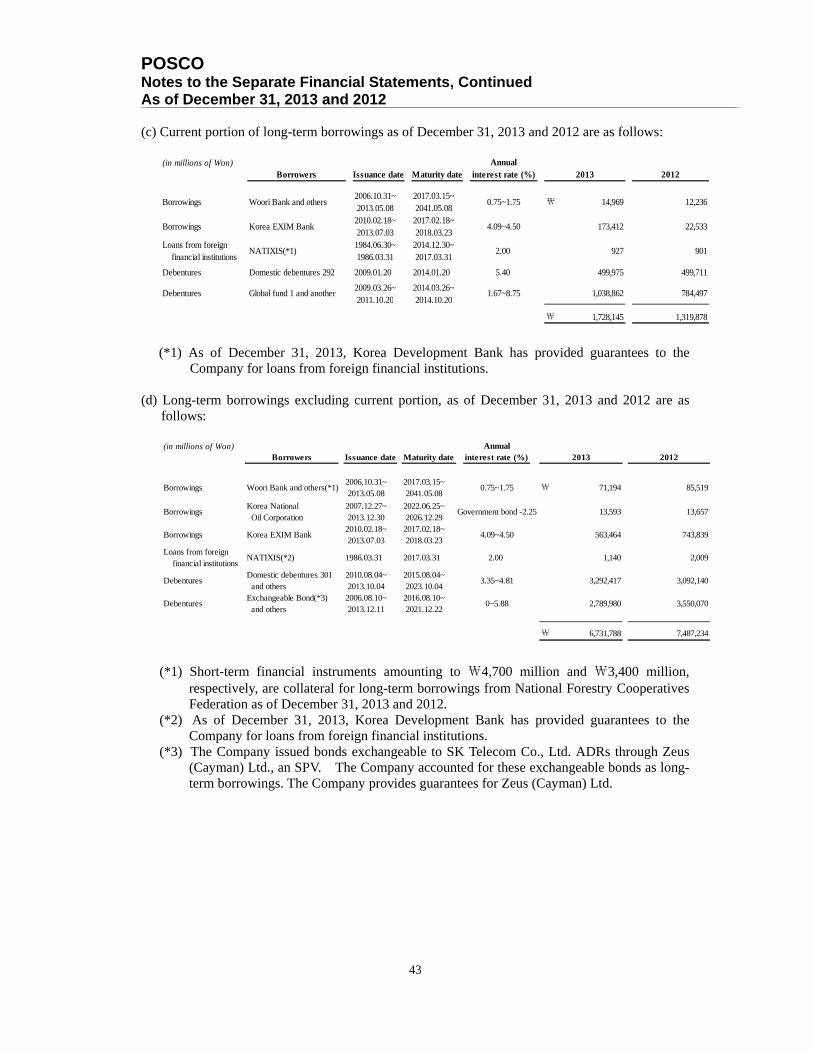
POSCO Notes to the Separate Financial Statements, Continued As of December 31, 2013 and 2012
43
(c) Current portion of long-term borrowings as of December 31, 2013 and 2012 are as follows:
(*1) As of December 31, 2013, Korea Development Bank has provided guarantees to the Company for loans from foreign financial institutions.
(d) Long-term borrowings excluding current portion, as of December 31, 2013 and 2012 are as
follows:
(*1) Short-term financial instruments amounting to ₩4,700 million and ₩3,400 million, respectively, are collateral for long-term borrowings from National Forestry Cooperatives Federation as of December 31, 2013 and 2012.
(*2) As of December 31, 2013, Korea Development Bank has provided guarantees to the Company for loans from foreign financial institutions.
(*3) The Company issued bonds exchangeable to SK Telecom Co., Ltd. ADRs through Zeus (Cayman) Ltd., an SPV. The Company accounted for these exchangeable bonds as long-term borrowings. The Company provides guarantees for Zeus (Cayman) Ltd.
(in millions of Won) AnnualBorrowers Issuance date Maturity date interest rate (%)
Borrowings Woori Bank and others2006.10.31~ 2013.05.08
2017.03.15~ 2041.05.08
0.75~1.75 ₩ 14,969 12,236
Borrowings Korea EXIM Bank2010.02.18~ 2013.07.03
2017.02.18~ 2018.03.23
4.09~4.50 173,412 22,533
Loans from foreign financial institutions
NATIXIS(*1)1984.06.30~ 1986.03.31
2014.12.30~ 2017.03.31
2.00 927 901
Debentures Domestic debentures 292 2009.01.20 2014.01.20 5.40 499,975 499,711
Debentures Global fund 1 and another2009.03.26~2011.10.20
2014.03.26~2014.10.20
1.67~8.75 1,038,862 784,497
₩ 1,728,145 1,319,878
2013 2012
(in millions of Won) AnnualBorrowers Issuance date Maturity date interest rate (%)
Borrowings Woori Bank and others(*1)2006.10.31~ 2013.05.08
2017.03.15~ 2041.05.08
0.75~1.75 ₩ 71,194 85,519
BorrowingsKorea National Oil Corporation
2007.12.27~2013.12.30
2022.06.25~2026.12.29
Government bond -2.25 13,593 13,657
Borrowings Korea EXIM Bank2010.02.18~2013.07.03
2017.02.18~2018.03.23
4.09~4.50 563,464 743,839
Loans from foreign financial institutions
NATIXIS(*2) 1986.03.31 2017.03.31 2.00 1,140 2,009
DebenturesDomestic debentures 301 and others
2010.08.04~2013.10.04
2015.08.04~2023.10.04
3.35~4.81 3,292,417 3,092,140
DebenturesExchangeable Bond(*3) and others
2006.08.10~ 2013.12.11
2016.08.10~ 2021.12.22
0~5.88 2,789,980 3,550,070
₩ 6,731,788 7,487,234
2013 2012

POSCO Notes to the Separate Financial Statements, Continued As of December 31, 2013 and 2012
44
17. Other Payables Other payables as of December 31, 2013 and 2012 are as follows:
(*1) During the year ended December 31, 2012, a fine of ₩98,326 million was imposed for price-fixing galvanized steel sheets as a result of the Korea Fair Trade Commission’s investigation.
18. Other Financial Liabilities Other financial liabilities as of December 31, 2013 and 2012 are as follows:
(in millions of Won)2012
Current Accounts payable ₩ 463,196 826,075 Accrued expenses(*1) 306,723 427,314 Dividend payable 9,180 6,493 Finance lease liabilities 1,124 1,088 Withholdings 11,660 9,070
₩ 791,883 1,270,040
Non-current
Long-term accounts payable ₩ 91,827 88,938 Accrued expenses 22,922 24,664 Finance lease liabilities 5,042 6,246 Long-term withholdings 4,888 8,964
₩ 124,679 128,812
2013
(in millions of Won)2012
Current Derivative instruments liabilites ₩ 36,964 9,499 Financial guarantee liabilities 9,045 7,393
₩ 46,009 16,892
Non-current Derivative instruments liabilites ₩ 175,463 31,256 Financial guarantee liabilities 56,076 41,664
₩ 231,539 72,920
2013
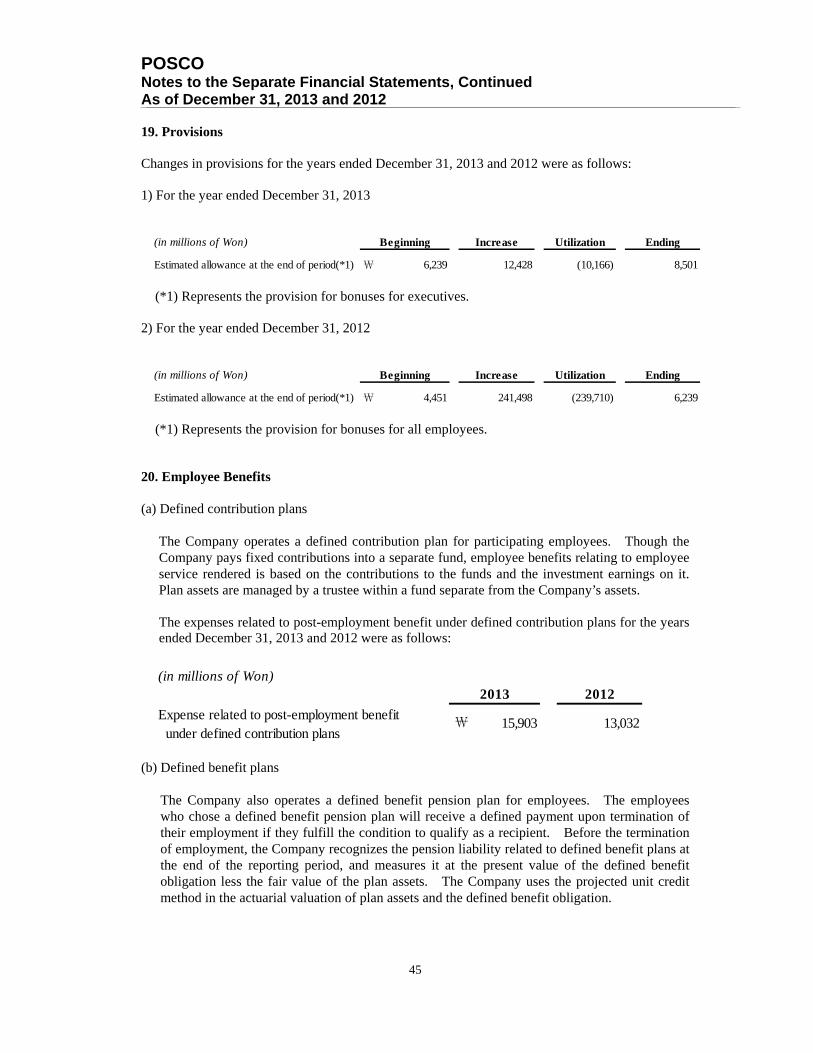
POSCO Notes to the Separate Financial Statements, Continued As of December 31, 2013 and 2012
45
19. Provisions Changes in provisions for the years ended December 31, 2013 and 2012 were as follows: 1) For the year ended December 31, 2013
(*1) Represents the provision for bonuses for executives. 2) For the year ended December 31, 2012
(*1) Represents the provision for bonuses for all employees. 20. Employee Benefits (a) Defined contribution plans
The Company operates a defined contribution plan for participating employees. Though the Company pays fixed contributions into a separate fund, employee benefits relating to employee service rendered is based on the contributions to the funds and the investment earnings on it. Plan assets are managed by a trustee within a fund separate from the Company’s assets. The expenses related to post-employment benefit under defined contribution plans for the years ended December 31, 2013 and 2012 were as follows:
(b) Defined benefit plans
The Company also operates a defined benefit pension plan for employees. The employees who chose a defined benefit pension plan will receive a defined payment upon termination of their employment if they fulfill the condition to qualify as a recipient. Before the termination of employment, the Company recognizes the pension liability related to defined benefit plans at the end of the reporting period, and measures it at the present value of the defined benefit obligation less the fair value of the plan assets. The Company uses the projected unit credit method in the actuarial valuation of plan assets and the defined benefit obligation.
(in millions of Won)
Estimated allowance at the end of period(*1) ₩ 6,239 12,428 (10,166) 8,501
Beginning Increase Utilization Ending
(in millions of Won)
Estimated allowance at the end of period(*1) ₩ 4,451 241,498 (239,710) 6,239
Beginning Increase Utilization Ending
(in millions of Won)
Expense related to post-employment benefit under defined contribution plans
2012
13,032
2013
15,903₩
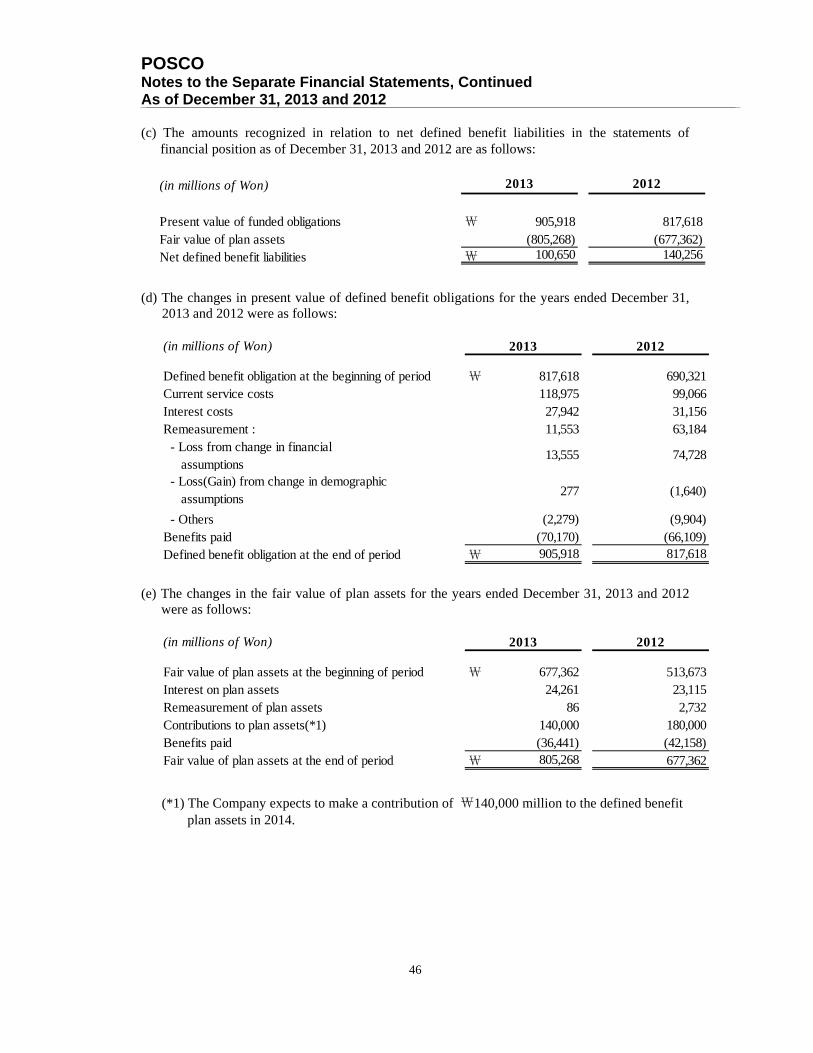
POSCO Notes to the Separate Financial Statements, Continued As of December 31, 2013 and 2012
46
(c) The amounts recognized in relation to net defined benefit liabilities in the statements of
financial position as of December 31, 2013 and 2012 are as follows:
(d) The changes in present value of defined benefit obligations for the years ended December 31,
2013 and 2012 were as follows:
(e) The changes in the fair value of plan assets for the years ended December 31, 2013 and 2012
were as follows:
(*1) The Company expects to make a contribution of ₩140,000 million to the defined benefit plan assets in 2014.
(in millions of Won)
Present value of funded obligations ₩ 905,918 817,618Fair value of plan assets (805,268) (677,362)Net defined benefit liabilities ₩ 100,650 140,256
2013 2012
(in millions of Won)
Defined benefit obligation at the beginning of period ₩ 817,618 690,321Current service costs 118,975 99,066Interest costs 27,942 31,156Remeasurement : 11,553 63,184 - Loss from change in financial assumptions
13,555 74,728
- Loss(Gain) from change in demographic assumptions
277 (1,640)
- Others (2,279) (9,904)Benefits paid (70,170) (66,109)Defined benefit obligation at the end of period ₩ 905,918 817,618
2013 2012
(in millions of Won)
Fair value of plan assets at the beginning of period ₩ 677,362 513,673Interest on plan assets 24,261 23,115Remeasurement of plan assets 86 2,732Contributions to plan assets(*1) 140,000 180,000Benefits paid (36,441) (42,158)Fair value of plan assets at the end of period ₩ 805,268 677,362
2013 2012
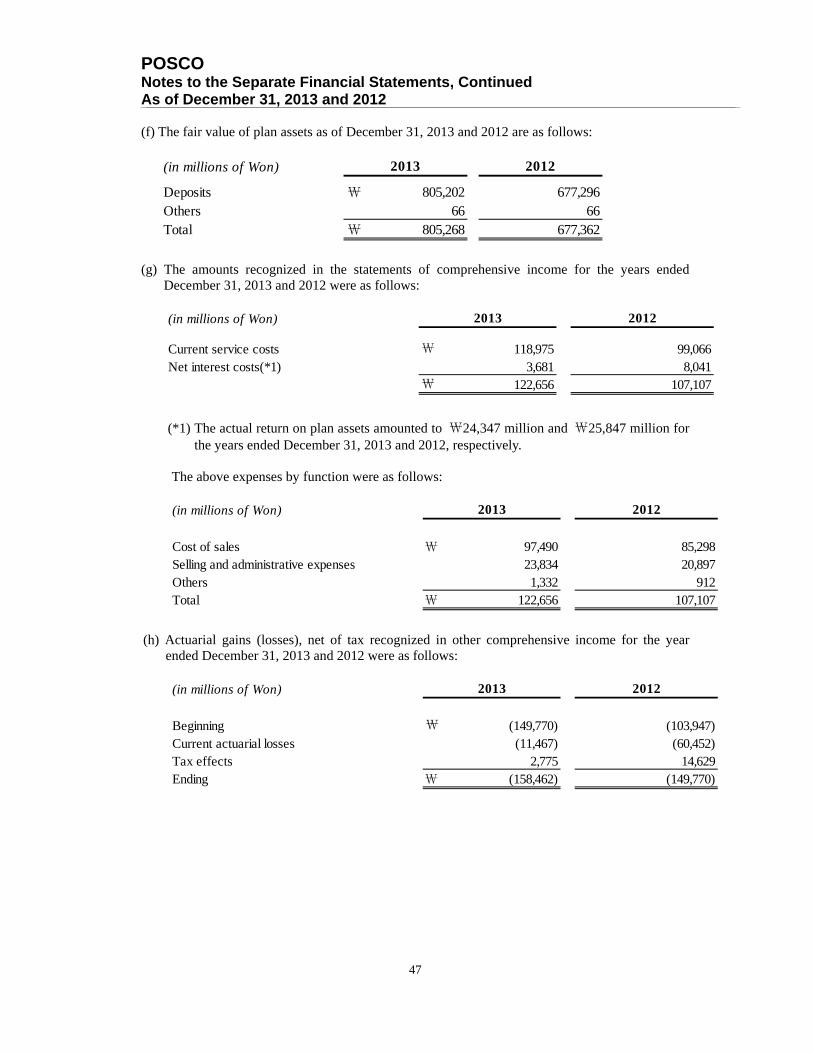
POSCO Notes to the Separate Financial Statements, Continued As of December 31, 2013 and 2012
47
(f) The fair value of plan assets as of December 31, 2013 and 2012 are as follows:
(g) The amounts recognized in the statements of comprehensive income for the years ended
December 31, 2013 and 2012 were as follows:
(*1) The actual return on plan assets amounted to ₩24,347 million and ₩25,847 million for the years ended December 31, 2013 and 2012, respectively.
The above expenses by function were as follows:
(h) Actuarial gains (losses), net of tax recognized in other comprehensive income for the year
ended December 31, 2013 and 2012 were as follows:
(in millions of Won)
Deposits ₩ 805,202 677,296Others 66 66Total ₩ 805,268 677,362
2013 2012
(in millions of Won)
Current service costs ₩ 118,975 99,066Net interest costs(*1) 3,681 8,041
₩ 122,656 107,107
20122013
(in millions of Won)
Cost of sales ₩ 97,490 85,298Selling and administrative expenses 23,834 20,897Others 1,332 912Total ₩ 122,656 107,107
2013 2012
(in millions of Won)
Beginning ₩ (149,770) (103,947)Current actuarial losses (11,467) (60,452)Tax effects 2,775 14,629Ending ₩ (158,462) (149,770)
2013 2012

POSCO Notes to the Separate Financial Statements, Continued As of December 31, 2013 and 2012
48
(i) The principal actuarial assumptions as of December 31, 2013 and 2012 are as follows:
(*1) Discount rate is the yield at the end of the reporting period on high quality corporate bonds that have maturity dates approximating the terms of our benefits obligations and that are denominated in the same currency in which the benefits are expected to be paid.
(*2) The expected future increases in salaries are based on the average salary increase rate for past three years.
All assumptions are reviewed at the end of the reporting period. Additionally, the total estimated defined benefit obligation includes actuarial assumptions associated with the long-term characteristics of the defined benefit plan. (j) Reasonably possible changes at the reporting date to one of the relevant actuarial assumption,
holding other assumptions constant, would have affected the defined benefit obligation by the amounts shown below:
(k) As of December 31, 2013 the maturity of the expected benefit payments are as follows :
The maturity analysis of the defined benefit obligation were nominal amounts of defined benefit obligations using expected remaining working lives of employees. 21. Other Liabilities Other liabilities as of December 31, 2013 and 2012 are as follows:
Discount rate(*1) 3.95% 3.47%
Expected future increases in salaries(*2) 3.30% 3.30%
2013 2012
(in millions of Won)
Percentage(%) Percentage(%)
Discount rate ₩ (65,987) (7.3) ₩ 75,505 8.3 Expected future increases in salaries 75,234 8.3 (66,959) (7.4)
1% Increase 1% DecreaseAmount Amount
(in millions of Won)1 year
- 5 years5 years
- 10 years10 years
- 20 yearsLater than20 years
Benefits paid ₩ 1,897 72,674 315,343 702,647 168,978 ₩ 1,261,539
Within 1 year
Total
(in millions of Won)
Current Advances received ₩ 20,912 44,488 Withholding 15,905 20,962 Unearned revenue 1,292 5,415
38,109 70,865Non-current
Unearned revenue 538 842 Others 3,000 3,000
₩ 3,538 3,842
2013 2012

POSCO Notes to the Separate Financial Statements, Continued As of December 31, 2013 and 2012
49
22. Financial Instruments (a) Classification of financial instruments
1) Financial assets as of December 31, 2013 and 2012 are as follows:
2) Financial liabilities as of December 31, 2013 and 2012 are as follows:
(in millions of Won)
Financial assets at fair value through profit or lossDerivatives assets held for trading ₩ 7,788 6,016
Available-for-sale financial assets 3,354,770 3,062,057Held-to-maturity investments - 29,981Loans and receivables 7,263,709 6,833,586
₩ 10,626,267 9,931,640
2013 2012
(in millions of Won)
Financial liabilities at fair value through profit or lossDerivatives liabilities held for trading ₩ 212,427 40,755
Financial liabilities measured as amortized costTrade accounts and notes payable 735,457 978,581Borrowings 8,663,071 9,603,774Financial guarantee liabilities(*1) 65,121 49,057Others 916,562 1,300,526
10,380,211 11,931,938₩ 10,592,638 11,972,693
2013 2012
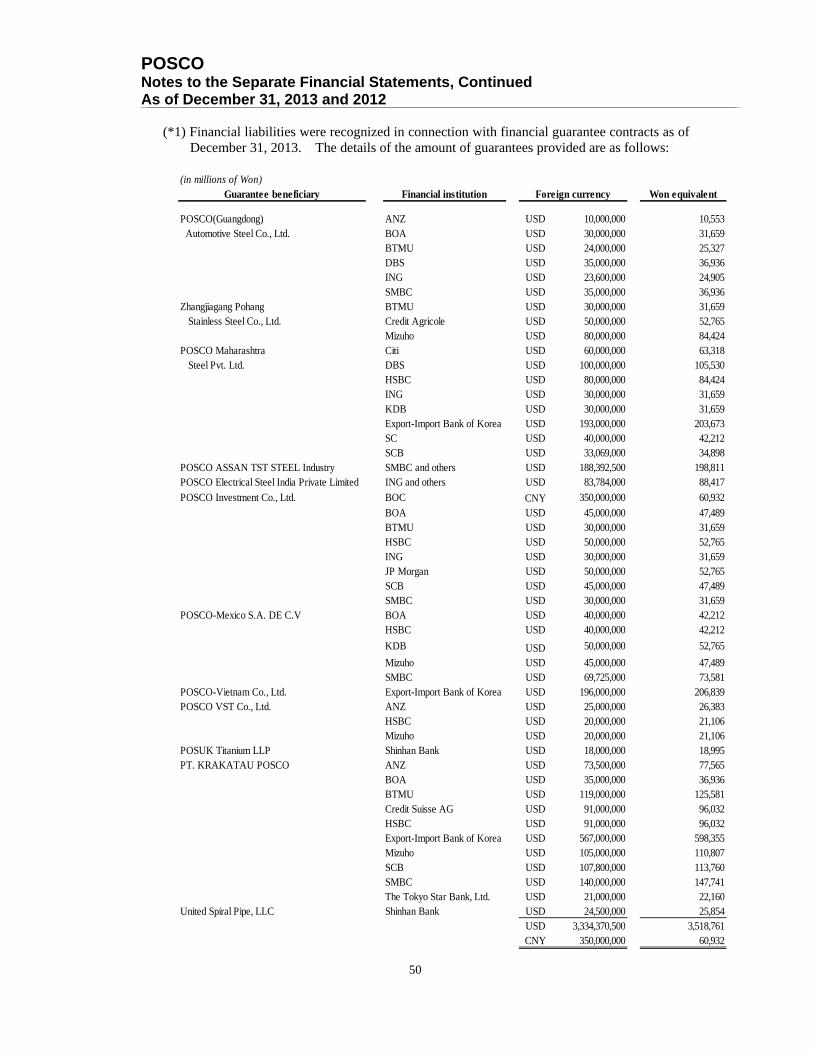
POSCO Notes to the Separate Financial Statements, Continued As of December 31, 2013 and 2012
50
(*1) Financial liabilities were recognized in connection with financial guarantee contracts as of
December 31, 2013. The details of the amount of guarantees provided are as follows:
(in millions of Won)Guarantee beneficiary Financial institution
POSCO(Guangdong) ANZ USD 10,000,000 10,553 Automotive Steel Co., Ltd. BOA USD 30,000,000 31,659
BTMU USD 24,000,000 25,327DBS USD 35,000,000 36,936ING USD 23,600,000 24,905SMBC USD 35,000,000 36,936
Zhangjiagang Pohang BTMU USD 30,000,000 31,659 Stainless Steel Co., Ltd. Credit Agricole USD 50,000,000 52,765
Mizuho USD 80,000,000 84,424POSCO Maharashtra Citi USD 60,000,000 63,318 Steel Pvt. Ltd. DBS USD 100,000,000 105,530
HSBC USD 80,000,000 84,424ING USD 30,000,000 31,659KDB USD 30,000,000 31,659Export-Import Bank of Korea USD 193,000,000 203,673SC USD 40,000,000 42,212SCB USD 33,069,000 34,898
POSCO ASSAN TST STEEL Industry SMBC and others USD 188,392,500 198,811POSCO Electrical Steel India Private Limited ING and others USD 83,784,000 88,417
POSCO Investment Co., Ltd. BOC CNY 350,000,000 60,932
BOA USD 45,000,000 47,489BTMU USD 30,000,000 31,659HSBC USD 50,000,000 52,765ING USD 30,000,000 31,659JP Morgan USD 50,000,000 52,765SCB USD 45,000,000 47,489SMBC USD 30,000,000 31,659
POSCO-Mexico S.A. DE C.V BOA USD 40,000,000 42,212HSBC USD 40,000,000 42,212
KDB USD 50,000,000 52,765
Mizuho USD 45,000,000 47,489SMBC USD 69,725,000 73,581
POSCO-Vietnam Co., Ltd. Export-Import Bank of Korea USD 196,000,000 206,839POSCO VST Co., Ltd. ANZ USD 25,000,000 26,383
HSBC USD 20,000,000 21,106Mizuho USD 20,000,000 21,106
POSUK Titanium LLP Shinhan Bank USD 18,000,000 18,995PT. KRAKATAU POSCO ANZ USD 73,500,000 77,565
BOA USD 35,000,000 36,936BTMU USD 119,000,000 125,581Credit Suisse AG USD 91,000,000 96,032HSBC USD 91,000,000 96,032Export-Import Bank of Korea USD 567,000,000 598,355Mizuho USD 105,000,000 110,807SCB USD 107,800,000 113,760SMBC USD 140,000,000 147,741The Tokyo Star Bank, Ltd. USD 21,000,000 22,160
United Spiral Pipe, LLC Shinhan Bank USD 24,500,000 25,854USD 3,334,370,500 3,518,761CNY 350,000,000 60,932
Foreign currency Won equivalent
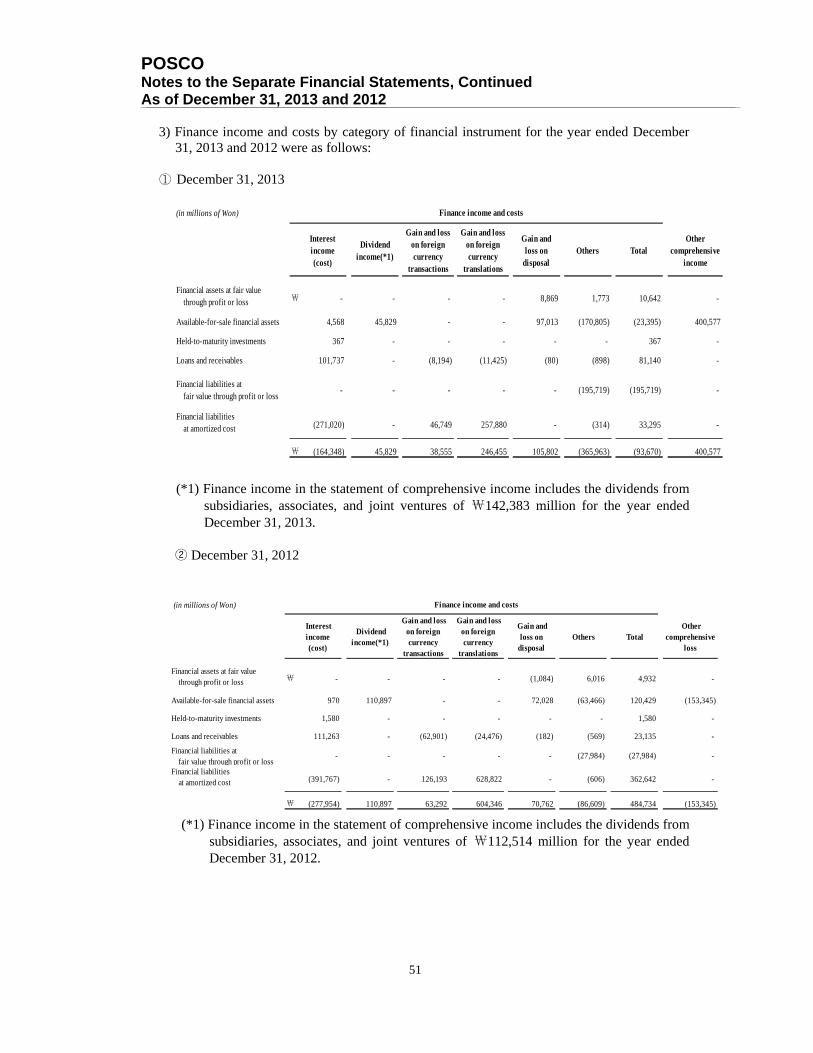
POSCO Notes to the Separate Financial Statements, Continued As of December 31, 2013 and 2012
51
3) Finance income and costs by category of financial instrument for the year ended December
31, 2013 and 2012 were as follows: ① December 31, 2013
(*1) Finance income in the statement of comprehensive income includes the dividends from
subsidiaries, associates, and joint ventures of ₩142,383 million for the year ended December 31, 2013.
② December 31, 2012
(*1) Finance income in the statement of comprehensive income includes the dividends from
subsidiaries, associates, and joint ventures of ₩112,514 million for the year ended December 31, 2012.
(in millions of Won)
Interestincome(cost)
Dividendincome(*1)
Gain and losson foreigncurrency
transactions
Gain and losson foreigncurrency
translations
Gain andloss on
disposalOthers Total
Othercomprehensive
income
Financial assets at fair value through profit or loss ₩ - - - - 8,869 1,773 10,642 -
Available-for-sale financial assets 4,568 45,829 - - 97,013 (170,805) (23,395) 400,577
Held-to-maturity investments 367 - - - - - 367 -
Loans and receivables 101,737 - (8,194) (11,425) (80) (898) 81,140 -
Financial liabilities at fair value through profit or loss
- - - - - (195,719) (195,719) -
Financial liabilities at amortized cost (271,020) - 46,749 257,880 - (314) 33,295 -
₩ (164,348) 45,829 38,555 246,455 105,802 (365,963) (93,670) 400,577
Finance income and costs
(in millions of Won)
Interestincome(cost)
Dividendincome(*1)
Gain and losson foreigncurrency
transactions
Gain and losson foreigncurrency
translations
Gain andloss on
disposal Others Total
Othercomprehensive
loss
Financial assets at fair value through profit or loss ₩ - - - - (1,084) 6,016 4,932 -
Available-for-sale financial assets 970 110,897 - - 72,028 (63,466) 120,429 (153,345)
Held-to-maturity investments 1,580 - - - - - 1,580 -
Loans and receivables 111,263 - (62,901) (24,476) (182) (569) 23,135 -
Financial liabilities at fair value through profit or loss
- - - - - (27,984) (27,984) -
Financial liabilities at amortized cost (391,767) - 126,193 628,822 - (606) 362,642 -
₩ (277,954) 110,897 63,292 604,346 70,762 (86,609) 484,734 (153,345)
Finance income and costs
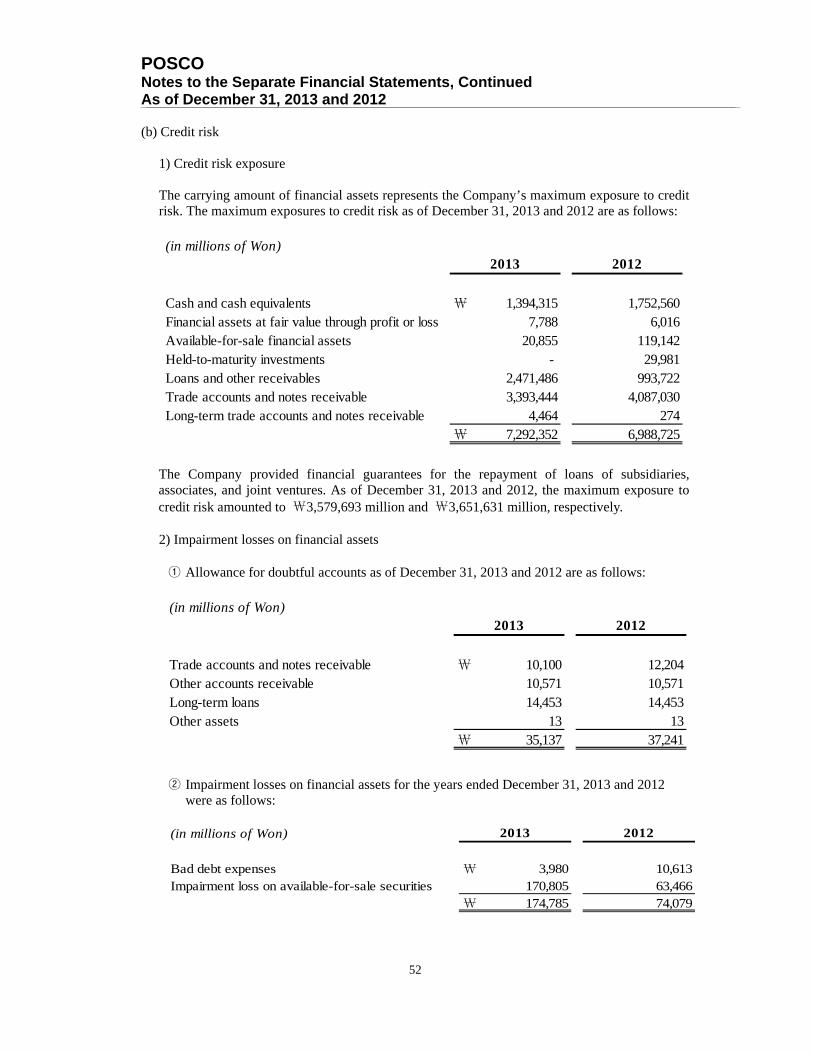
POSCO Notes to the Separate Financial Statements, Continued As of December 31, 2013 and 2012
52
(b) Credit risk
1) Credit risk exposure
The carrying amount of financial assets represents the Company’s maximum exposure to credit risk. The maximum exposures to credit risk as of December 31, 2013 and 2012 are as follows:
The Company provided financial guarantees for the repayment of loans of subsidiaries, associates, and joint ventures. As of December 31, 2013 and 2012, the maximum exposure to credit risk amounted to ₩3,579,693 million and ₩3,651,631 million, respectively.
2) Impairment losses on financial assets
① Allowance for doubtful accounts as of December 31, 2013 and 2012 are as follows:
② Impairment losses on financial assets for the years ended December 31, 2013 and 2012
were as follows:
(in millions of Won)
Cash and cash equivalents ₩ 1,394,315 1,752,560Financial assets at fair value through profit or loss 7,788 6,016Available-for-sale financial assets 20,855 119,142Held-to-maturity investments - 29,981Loans and other receivables 2,471,486 993,722Trade accounts and notes receivable 3,393,444 4,087,030Long-term trade accounts and notes receivable 4,464 274
₩ 7,292,352 6,988,725
2013 2012
(in millions of Won)
Trade accounts and notes receivable ₩ 10,100 12,204Other accounts receivable 10,571 10,571Long-term loans 14,453 14,453Other assets 13 13
₩ 35,137 37,241
2013 2012
(in millions of Won)
Bad debt expenses ₩ 3,980 10,613Impairment loss on available-for-sale securities 170,805 63,466
₩ 174,785 74,079
2013 2012
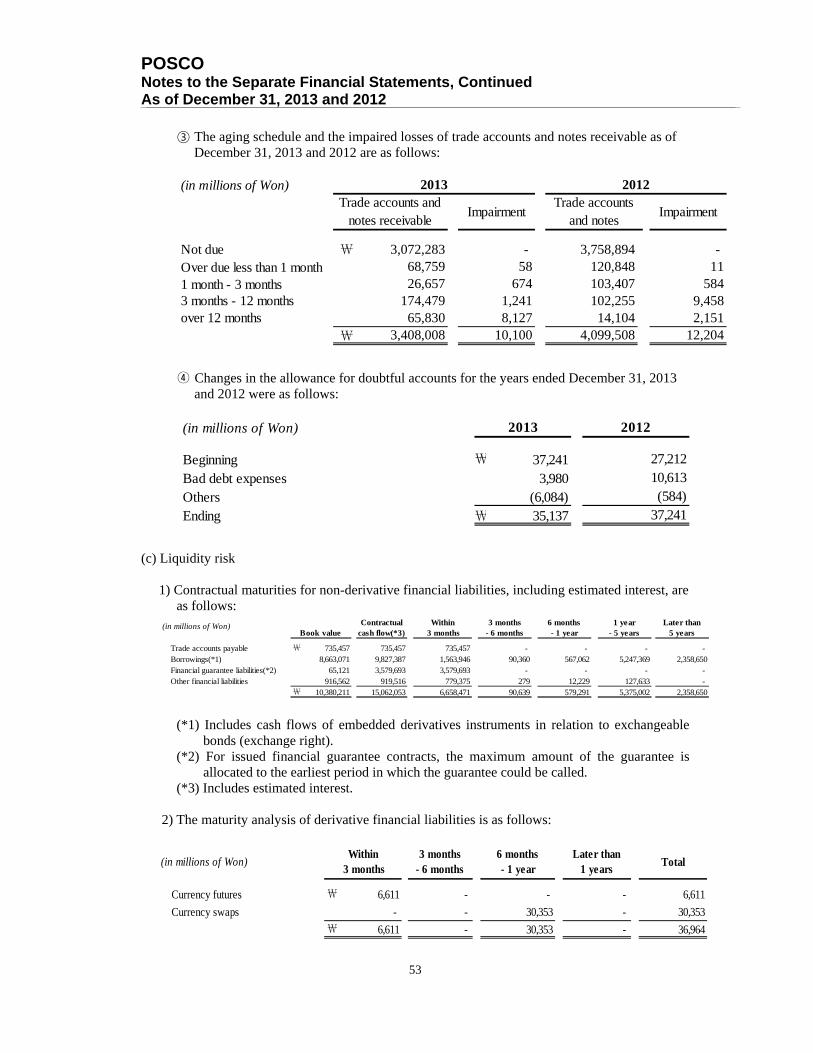
POSCO Notes to the Separate Financial Statements, Continued As of December 31, 2013 and 2012
53
③ The aging schedule and the impaired losses of trade accounts and notes receivable as of December 31, 2013 and 2012 are as follows:
④ Changes in the allowance for doubtful accounts for the years ended December 31, 2013 and 2012 were as follows:
(c) Liquidity risk
1) Contractual maturities for non-derivative financial liabilities, including estimated interest, are as follows:
(*1) Includes cash flows of embedded derivatives instruments in relation to exchangeable bonds (exchange right).
(*2) For issued financial guarantee contracts, the maximum amount of the guarantee is allocated to the earliest period in which the guarantee could be called.
(*3) Includes estimated interest.
2) The maturity analysis of derivative financial liabilities is as follows:
(in millions of Won)
Impairment Impairment
Not due ₩ 3,072,283 - 3,758,894 - Over due less than 1 month 68,759 58 120,848 111 month - 3 months 26,657 674 103,407 5843 months - 12 months 174,479 1,241 102,255 9,458over 12 months 65,830 8,127 14,104 2,151
₩ 3,408,008 10,100 4,099,508 12,204
2013 2012Trade accounts and
notes receivableTrade accounts
and notes
(in millions of Won)
Beginning ₩ 37,241Bad debt expenses 3,980Others (6,084)Ending ₩ 35,137
27,21210,613(584)
37,241
2013 2012
(in millions of Won) Contractualcash flow(*3)
Within 3 months
3 months- 6 months
6 months- 1 year
1 year- 5 years
Later than5 years
Trade accounts payable ₩ 735,457 735,457 735,457 - - - - Borrowings(*1) 8,663,071 9,827,387 1,563,946 90,360 567,062 5,247,369 2,358,650Financial guarantee liabilities(*2) 65,121 3,579,693 3,579,693 - - - - Other financial liabilities 916,562 919,516 779,375 279 12,229 127,633 -
₩ 10,380,211 15,062,053 6,658,471 90,639 579,291 5,375,002 2,358,650
Book value
(in millions of Won)3 months
- 6 months6 months- 1 year
Later than1 years
Total
Currency futures ₩ 6,611 - - - 6,611
Currency swaps - - 30,353 - 30,353
₩ 6,611 - 30,353 - 36,964
Within 3 months

POSCO Notes to the Separate Financial Statements, Continued As of December 31, 2013 and 2012
54
(d) Currency risk
1) The Company has exposure to the risk that the fair value or future cash flows of a financial instrument will fluctuate because of changes in foreign exchange rates. The exposure to currency risk as of December 31, 2013 and 2012 are as follows:
2) As of December 31, 2013 and 2012, provided that functional currency against foreign currencies other than functional currency hypothetically strengthens or weakens by 10%, the changes in gain or loss during the years ended December 31, 2013 and 2012 were as follows:
(e) Interest rate risk
1) The carrying amount of interest-bearing financial instruments as of December 31, 2013 and 2012 are as follows:
2) Sensitivity analysis on the fair value of financial instruments with fixed interest rate The Company does not account for derivative instruments such as interest swaps as hedges in fair value hedging accounting. Therefore, fluctuations in interest rates do not affect gain or loss.
(in millions of Won)
Assets Liabilities
USD ₩ 701,159 3,815,529 876,780 4,599,558JPY 450,938 1,370,603 62,602 1,863,516CNH 76,678 - - - EUR 7,208 3,131 25,127 5,554Others 38,337 226 46,306 149
₩ 1,274,320 5,189,489 1,010,815 6,468,777
2013 2012
Assets Liabilities
(in millions of Won)
10% decrease 10% increase 10% decrease
USD ₩ (311,437) 311,437 (372,278) 372,278JPY (91,967) 91,967 (180,091) 180,091CNH 7,668 (7,668) - - EUR 408 (408) 1,957 (1,957)
10% increase
2013 2012
(in millions of Won)Fixed rate
Financial assets ₩ 3,773,978 2,752,342Financial liabilities (8,580,517) (9,508,984)
₩ (4,806,539) (6,756,642)Variable rate
Financial liabilities ₩ (82,554) (94,790)
2013 2012

POSCO Notes to the Separate Financial Statements, Continued As of December 31, 2013 and 2012
55
3) Sensitivity analysis on the fair value of financial instruments with variable interest rate As of December 31, 2013 and 2012, provided that other factors remain the same and the interest rate of borrowings with floating rates increases or decreases by 1%, the changes in interest expense for the year ended December 31, 2013 and 2012 were as follows:
(h) Offsetting financial assets and financial liabilities
As of December 31, 2013 and 2012, financial assets and financial liabilities subject to offsetting, enforceable master netting arrangements and similar agreements are as follows:
1) December 31, 2013
2) December 31, 2012
(in millions of Won)
1% decrease
Variable rate financial instruments
(826) 826 (948) 948
1% increase 1% decrease 1% increase
2013 2012
(in millions of Won)
Financail AssetsTrade accounts and notes receivable, net ₩ 203,138 - 203,138 (203,138) - -
Financail LiabilitiesShort-term borrowings 203,138 - 203,138 (203,138) - -
FinancialInstruments
Cash collateralreceived or
pledged
Gross amountsof recognized
financialinstruments
Netamount
Gross amounts of recognizedfinancial instruments set
off in thestatement of financial position
Net amountsof financial instruments
presented inthe statement offinancial position
Related amounts not set off in the statement of
financial position
(in millions of Won)
Financail AssetsTrade accounts and notes receivable, net ₩ 258,680 - 258,680 (258,680) - -
Financail LiabilitiesShort-term borrowings 258,680 - 258,680 (258,680) - -
FinancialInstruments
Cash collateralreceived or
pledged
Related amounts not set off in the statement of
financial position
Gross amountsof recognized
financialinstruments
Gross amounts of recognizedfinancial instruments set
off in thestatement of financial position
Net amountsof financial instruments
presented inthe statement offinancial position
Netamount
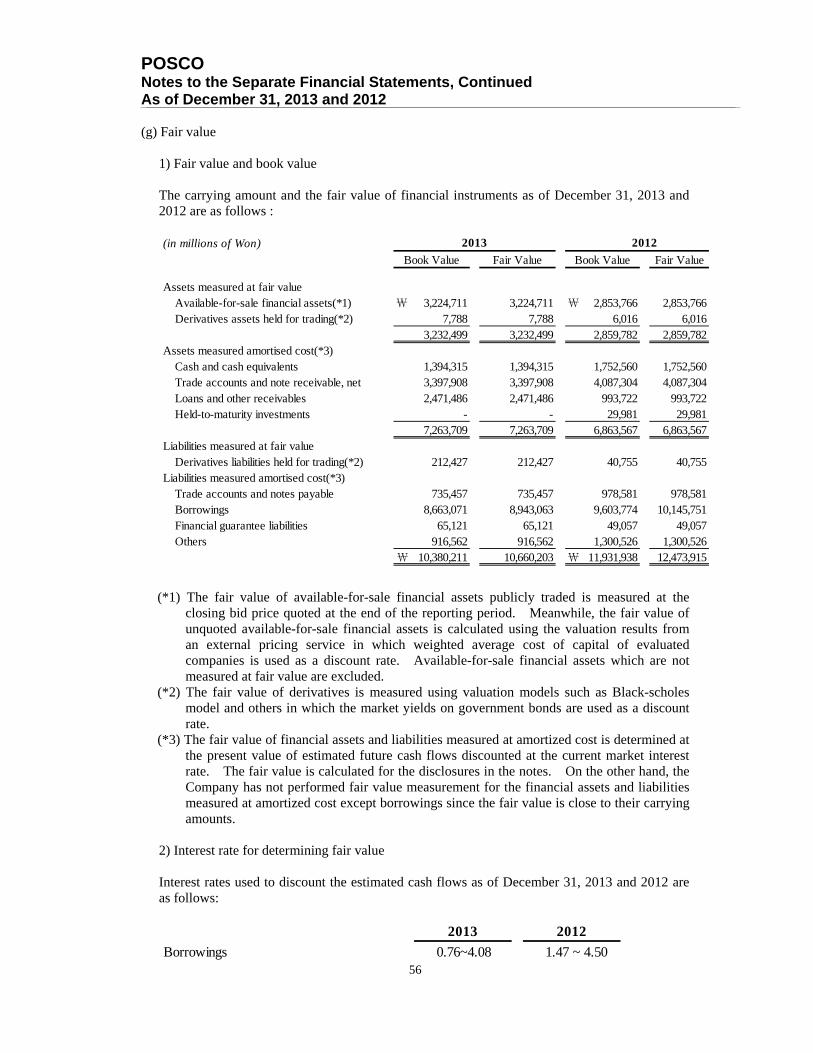
POSCO Notes to the Separate Financial Statements, Continued As of December 31, 2013 and 2012
56
(g) Fair value
1) Fair value and book value
The carrying amount and the fair value of financial instruments as of December 31, 2013 and 2012 are as follows :
(*1) The fair value of available-for-sale financial assets publicly traded is measured at the
closing bid price quoted at the end of the reporting period. Meanwhile, the fair value of unquoted available-for-sale financial assets is calculated using the valuation results from an external pricing service in which weighted average cost of capital of evaluated companies is used as a discount rate. Available-for-sale financial assets which are not measured at fair value are excluded.
(*2) The fair value of derivatives is measured using valuation models such as Black-scholes model and others in which the market yields on government bonds are used as a discount rate.
(*3) The fair value of financial assets and liabilities measured at amortized cost is determined at the present value of estimated future cash flows discounted at the current market interest rate. The fair value is calculated for the disclosures in the notes. On the other hand, the Company has not performed fair value measurement for the financial assets and liabilities measured at amortized cost except borrowings since the fair value is close to their carrying amounts.
2) Interest rate for determining fair value Interest rates used to discount the estimated cash flows as of December 31, 2013 and 2012 are as follows:
(in millions of Won)
Fair Value
Assets measured at fair valueAvailable-for-sale financial assets(*1) ₩ 3,224,711 3,224,711 ₩ 2,853,766 2,853,766Derivatives assets held for trading(*2) 7,788 7,788 6,016 6,016
3,232,499 3,232,499 2,859,782 2,859,782Assets measured amortised cost(*3)
Cash and cash equivalents 1,394,315 1,394,315 1,752,560 1,752,560Trade accounts and note receivable, net 3,397,908 3,397,908 4,087,304 4,087,304Loans and other receivables 2,471,486 2,471,486 993,722 993,722Held-to-maturity investments - - 29,981 29,981
7,263,709 7,263,709 6,863,567 6,863,567Liabilities measured at fair value
Derivatives liabilities held for trading(*2) 212,427 212,427 40,755 40,755Liabilities measured amortised cost(*3)
Trade accounts and notes payable 735,457 735,457 978,581 978,581Borrowings 8,663,071 8,943,063 9,603,774 10,145,751Financial guarantee liabilities 65,121 65,121 49,057 49,057Others 916,562 916,562 1,300,526 1,300,526
₩ 10,380,211 10,660,203 ₩ 11,931,938 12,473,915
2013 2012
Book Value Fair Value Book Value
Borrowings 0.76~4.08 1.47 ~ 4.50
2013 2012
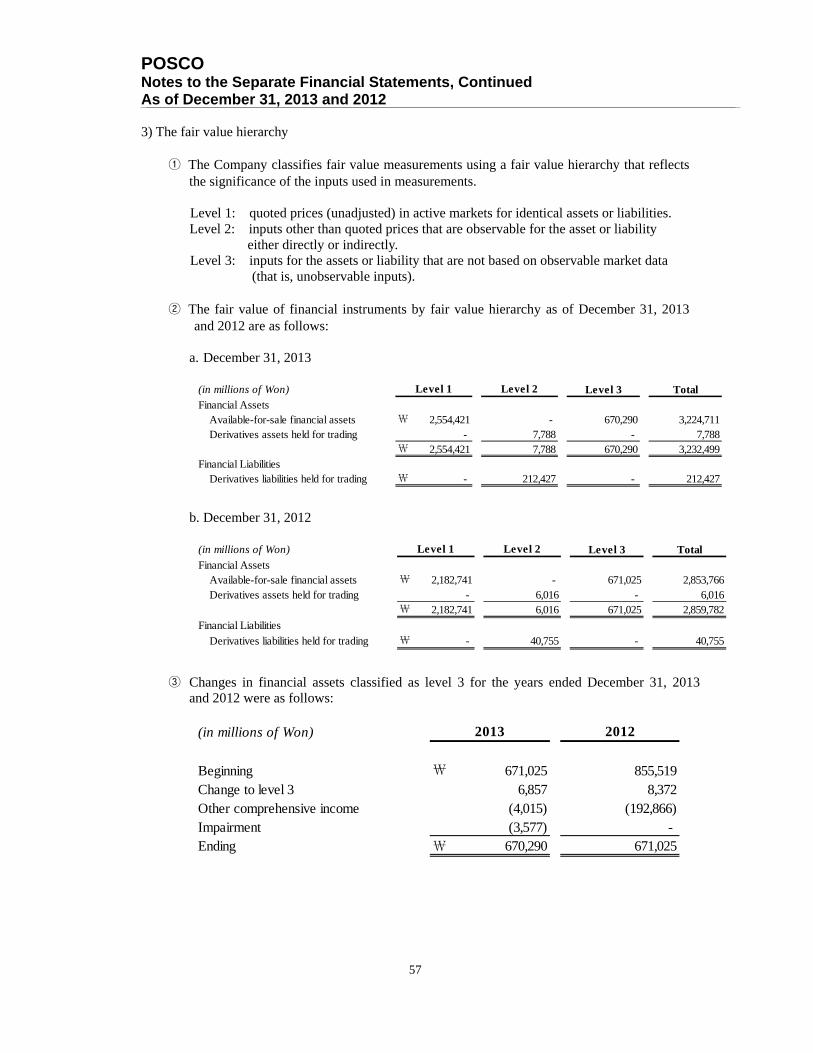
POSCO Notes to the Separate Financial Statements, Continued As of December 31, 2013 and 2012
57
3) The fair value hierarchy ① The Company classifies fair value measurements using a fair value hierarchy that reflects
the significance of the inputs used in measurements.
Level 1: quoted prices (unadjusted) in active markets for identical assets or liabilities. Level 2: inputs other than quoted prices that are observable for the asset or liability
either directly or indirectly. Level 3: inputs for the assets or liability that are not based on observable market data
(that is, unobservable inputs).
② The fair value of financial instruments by fair value hierarchy as of December 31, 2013 and 2012 are as follows:
a. December 31, 2013
b. December 31, 2012
③ Changes in financial assets classified as level 3 for the years ended December 31, 2013
and 2012 were as follows:
(in millions of Won) Level 3 TotalFinancial Assets
Available-for-sale financial assets ₩ 2,554,421 - 670,290 3,224,711Derivatives assets held for trading - 7,788 - 7,788
₩ 2,554,421 7,788 670,290 3,232,499Financial Liabilities
Derivatives liabilities held for trading ₩ - 212,427 - 212,427
Level 1 Level 2
(in millions of Won) Level 3 TotalFinancial Assets
Available-for-sale financial assets ₩ 2,182,741 - 671,025 2,853,766Derivatives assets held for trading - 6,016 - 6,016
₩ 2,182,741 6,016 671,025 2,859,782
Financial Liabilities
Derivatives liabilities held for trading ₩ - 40,755 - 40,755
Level 1 Level 2
(in millions of Won)
Beginning ₩ 671,025 855,519Change to level 3 6,857 8,372Other comprehensive income (4,015) (192,866)Impairment (3,577) - Ending ₩ 670,290 671,025
2013 2012

POSCO Notes to the Separate Financial Statements, Continued As of December 31, 2013 and 2012
58
23. Share Capital and Capital Surplus
(a) Share Capital as of December 31, 2013 and 2012 are as follows:
(*1) As of December 31, 2013, total numbers of ADRs of 53,749,064 are equivalent to 13,437,266 shares of common stock.
(*2) As of December 31, 2013, the difference between the ending balance of common stock and the par value of issued common stock is ₩46,469 million due to retirement of 9,293,790 treasury stocks.
(b) The changes in issued common stock for the years ended December 31, 2013 and 2012 were as
follows:
(c) Capital surplus as of December 31, 2013 and 2012 are as follows:
(Share, Won)
2012
Authorized shares 200,000,000 200,000,000
Par value ₩ 5,000 5,000
Issued shares(*1) 87,186,835 87,186,835
Shared capital(*2) ₩ 482,403,125,000 482,403,125,000
2013
(share)
Treasury sharesNumber of
outstanding shares Issued shares Treasury shares
Beginning ₩ 87,186,835 (9,942,391) 77,244,444 87,186,835 (9,942,391) 77,244,444
Disposal of treasury shares - 2,539,180 2,539,180 - - -
Ending 87,186,835 (7,403,211) 79,783,624 87,186,835 (9,942,391) 77,244,444
2013 2012
Issued sharesNumber of
outstanding shares
(in millions of Won)
2012
Additional paid in capital ₩ 463,825 463,825
Gain on disposal of treasury shares 769,215 763,867
₩ 1,233,040 1,227,692
2013
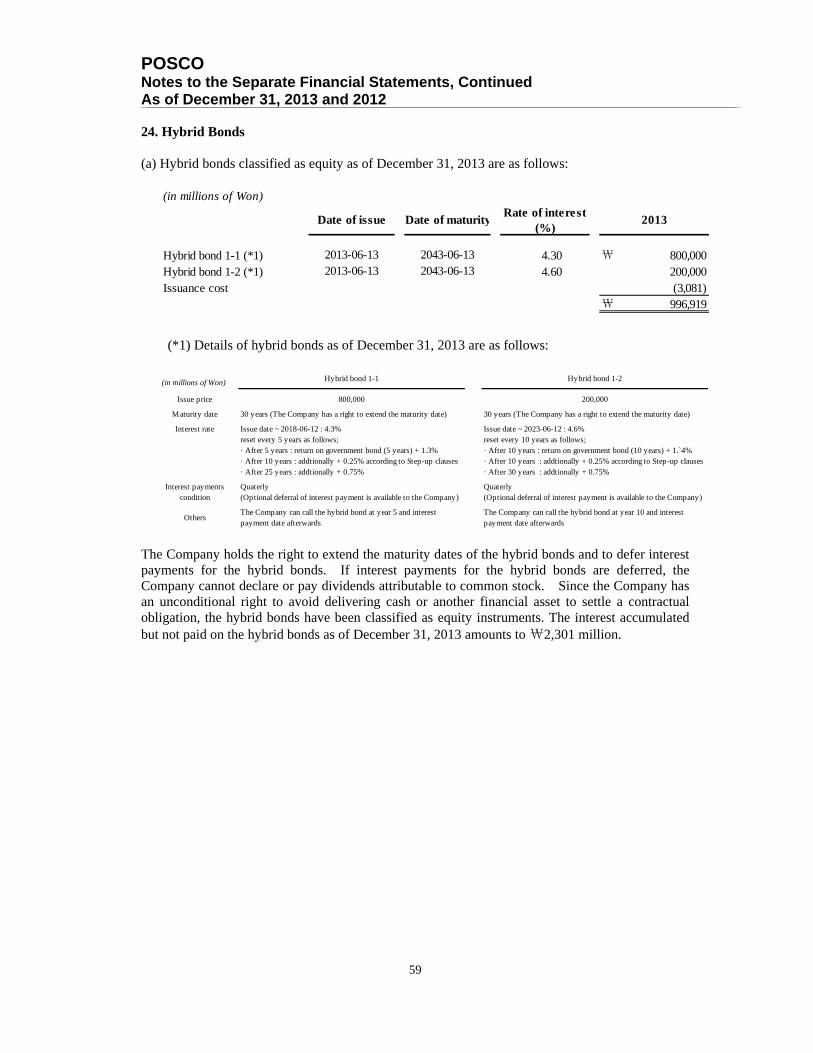
POSCO Notes to the Separate Financial Statements, Continued As of December 31, 2013 and 2012
59
24. Hybrid Bonds (a) Hybrid bonds classified as equity as of December 31, 2013 are as follows:
(*1) Details of hybrid bonds as of December 31, 2013 are as follows:
The Company holds the right to extend the maturity dates of the hybrid bonds and to defer interest payments for the hybrid bonds. If interest payments for the hybrid bonds are deferred, the Company cannot declare or pay dividends attributable to common stock. Since the Company has an unconditional right to avoid delivering cash or another financial asset to settle a contractual obligation, the hybrid bonds have been classified as equity instruments. The interest accumulated but not paid on the hybrid bonds as of December 31, 2013 amounts to ₩2,301 million.
(in millions of Won)
Hybrid bond 1-1 (*1) 4.30 ₩ 800,000Hybrid bond 1-2 (*1) 4.60 200,000Issuance cost (3,081)
₩ 996,919
Rate of interest(%)
2013
2013-06-132013-06-13
2043-06-132043-06-13
Date of issue Date of maturity
(in millions of Won) Hybrid bond 1-1 Hybrid bond 1-2
Issue price 800,000 200,000
Maturity date 30 years (The Company has a right to extend the maturity date) 30 years (The Company has a right to extend the maturity date)
Interest rate Issue date ~ 2018-06-12 : 4.3%reset every 5 years as follows;· After 5 years : return on government bond (5 years) + 1.3%· After 10 years : addtionally + 0.25% according to Step-up clauses· After 25 years : addtionally + 0.75%
Issue date ~ 2023-06-12 : 4.6%reset every 10 years as follows;· After 10 years : return on government bond (10 years) + 1.`4%· After 10 years : addtionally + 0.25% according to Step-up clauses· After 30 years : addtionally + 0.75%
Interest paymentscondition
Quaterly(Optional deferral of interest payment is available to the Company)
Quaterly(Optional deferral of interest payment is available to the Company)
OthersThe Company can call the hybrid bond at year 5 and interestpayment date afterwards
The Company can call the hybrid bond at year 10 and interestpayment date afterwards
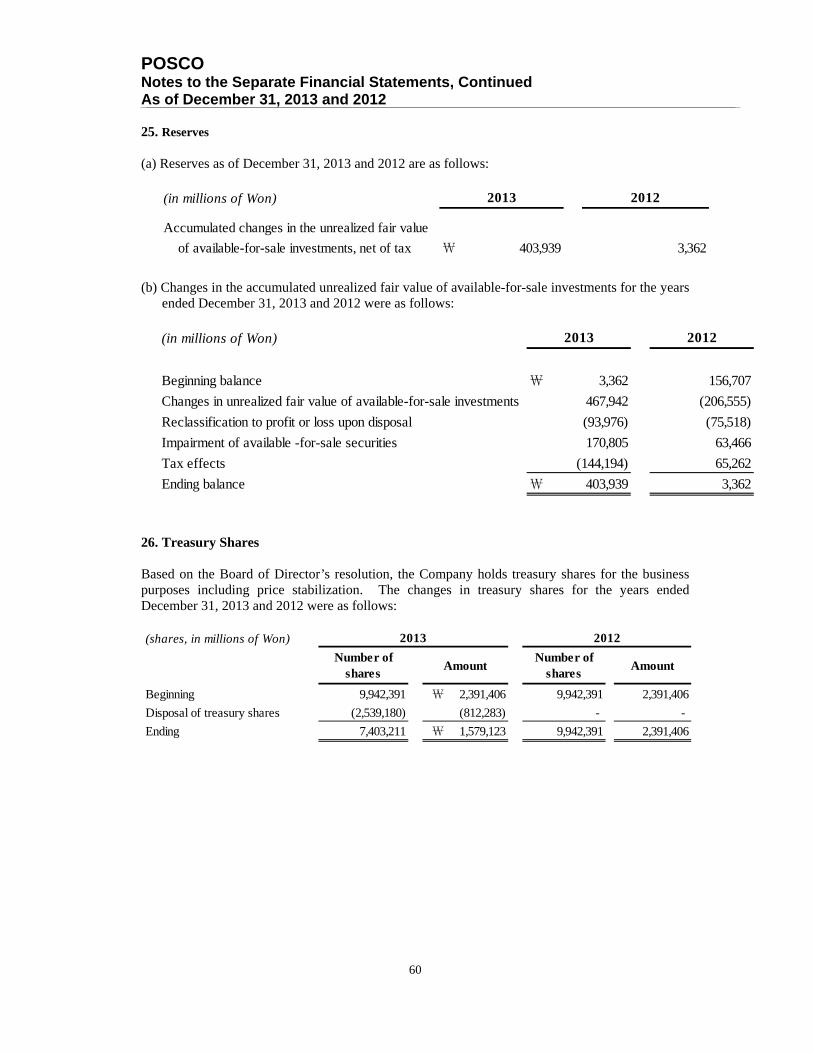
POSCO Notes to the Separate Financial Statements, Continued As of December 31, 2013 and 2012
60
25. Reserves (a) Reserves as of December 31, 2013 and 2012 are as follows:
(b) Changes in the accumulated unrealized fair value of available-for-sale investments for the years
ended December 31, 2013 and 2012 were as follows:
26. Treasury Shares Based on the Board of Director’s resolution, the Company holds treasury shares for the business purposes including price stabilization. The changes in treasury shares for the years ended December 31, 2013 and 2012 were as follows:
(in millions of Won)
Accumulated changes in the unrealized fair value
of available-for-sale investments, net of tax ₩ 403,939 3,362
2013 2012
(in millions of Won)
Beginning balance ₩ 3,362 156,707
Changes in unrealized fair value of available-for-sale investments 467,942 (206,555)
Reclassification to profit or loss upon disposal (93,976) (75,518)
Impairment of available -for-sale securities 170,805 63,466
Tax effects (144,194) 65,262
Ending balance ₩ 403,939 3,362
2013 2012
(shares, in millions of Won)
Beginning 9,942,391 ₩ 2,391,406 9,942,391 2,391,406
Disposal of treasury shares (2,539,180) (812,283) - -
Ending 7,403,211 ₩ 1,579,123 9,942,391 2,391,406
2013 2012
Number ofshares
AmountNumber of
sharesAmount
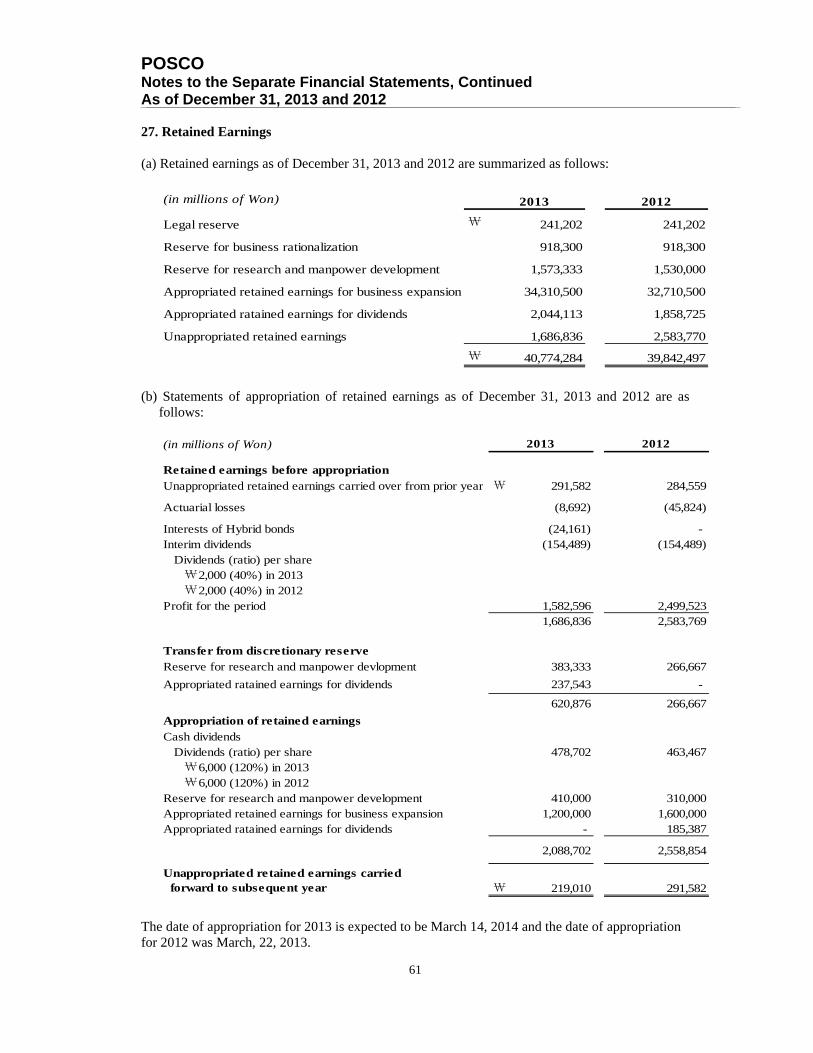
POSCO Notes to the Separate Financial Statements, Continued As of December 31, 2013 and 2012
61
27. Retained Earnings (a) Retained earnings as of December 31, 2013 and 2012 are summarized as follows:
(b) Statements of appropriation of retained earnings as of December 31, 2013 and 2012 are as
follows:
The date of appropriation for 2013 is expected to be March 14, 2014 and the date of appropriation for 2012 was March, 22, 2013.
(in millions of Won) 2013 2012
Legal reserve ₩ 241,202 241,202
Reserve for business rationalization 918,300 918,300
Reserve for research and manpower development 1,573,333 1,530,000
Appropriated retained earnings for business expansion 34,310,500 32,710,500
Appropriated ratained earnings for dividends 2,044,113 1,858,725
Unappropriated retained earnings 1,686,836 2,583,770
₩ 40,774,284 39,842,497
(in millions of Won)
Retained earnings before appropriationUnappropriated retained earnings carried over from prior year ₩ 291,582 284,559
Actuarial losses (8,692) (45,824)
Interests of Hybrid bonds (24,161) - Interim dividends (154,489) (154,489) Dividends (ratio) per share ₩ 2,000 (40%) in 2013 ₩ 2,000 (40%) in 2012Profit for the period 1,582,596 2,499,523
1,686,836 2,583,769
Transfer from discretionary reserveReserve for research and manpower devlopment 383,333 266,667
Appropriated ratained earnings for dividends 237,543 -
620,876 266,667
Appropriation of retained earningsCash dividends Dividends (ratio) per share 478,702 463,467 ₩ 6,000 (120%) in 2013 ₩ 6,000 (120%) in 2012Reserve for research and manpower development 410,000 310,000Appropriated retained earnings for business expansion 1,200,000 1,600,000Appropriated ratained earnings for dividends - 185,387
2,088,702 2,558,854
Unappropriated retained earnings carried forward to subsequent year ₩ 219,010 291,582
2013 2012
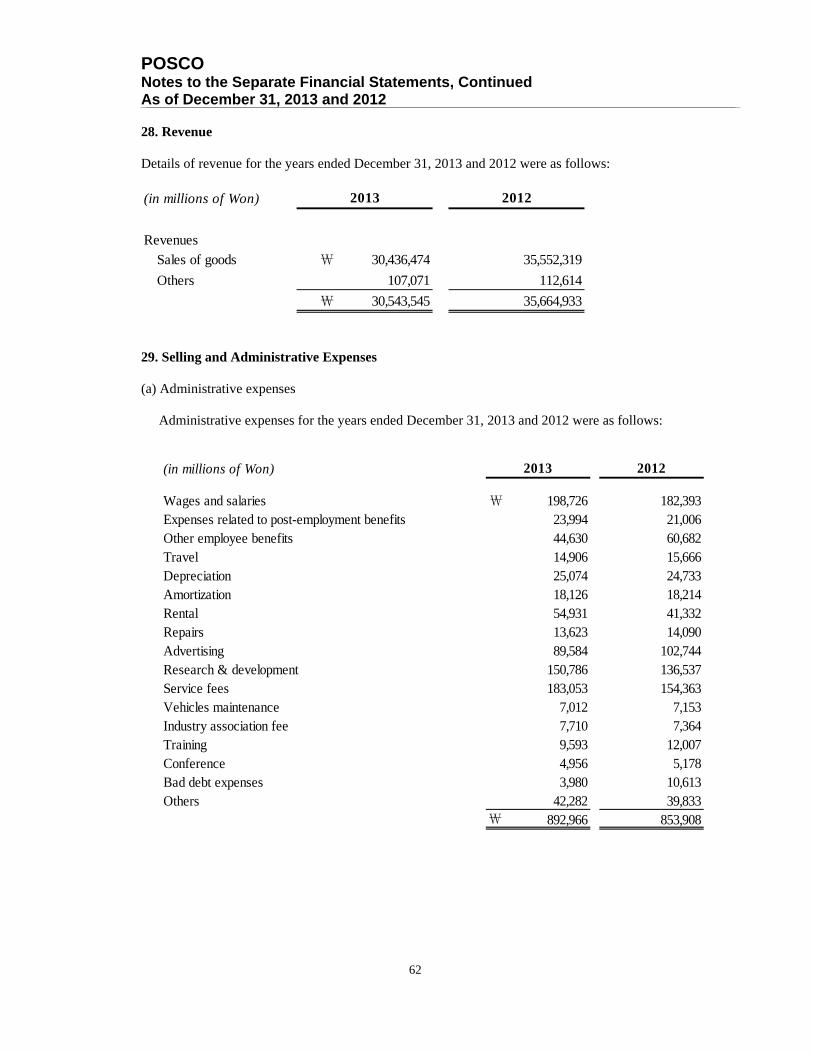
POSCO Notes to the Separate Financial Statements, Continued As of December 31, 2013 and 2012
62
28. Revenue Details of revenue for the years ended December 31, 2013 and 2012 were as follows:
29. Selling and Administrative Expenses (a) Administrative expenses
Administrative expenses for the years ended December 31, 2013 and 2012 were as follows:
(in millions of Won)
Revenues
Sales of goods ₩ 30,436,474 35,552,319
Others 107,071 112,614
₩ 30,543,545 35,664,933
2013 2012
(in millions of Won)
Wages and salaries ₩ 198,726 182,393 Expenses related to post-employment benefits 23,994 21,006 Other employee benefits 44,630 60,682 Travel 14,906 15,666 Depreciation 25,074 24,733 Amortization 18,126 18,214 Rental 54,931 41,332 Repairs 13,623 14,090 Advertising 89,584 102,744
Research & development 150,786 136,537 Service fees 183,053 154,363 Vehicles maintenance 7,012 7,153 Industry association fee 7,710 7,364 Training 9,593 12,007 Conference 4,956 5,178 Bad debt expenses 3,980 10,613 Others 42,282 39,833
₩ 892,966 853,908
2013 2012
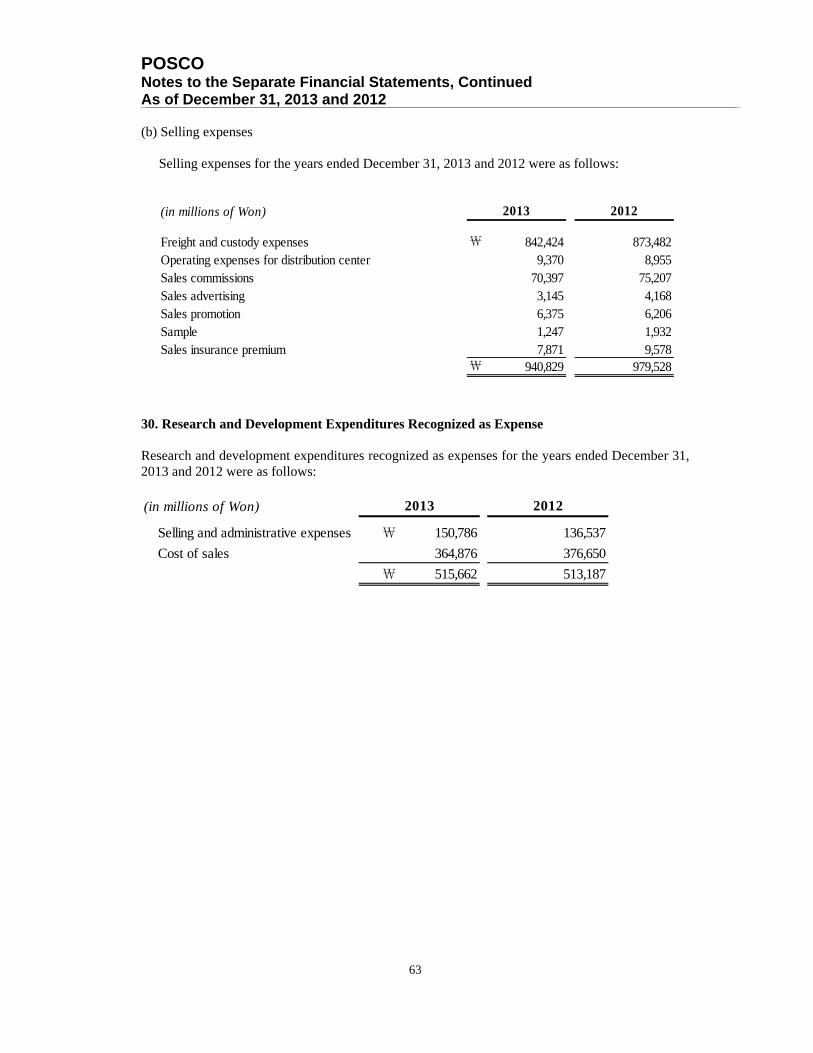
POSCO Notes to the Separate Financial Statements, Continued As of December 31, 2013 and 2012
63
(b) Selling expenses
Selling expenses for the years ended December 31, 2013 and 2012 were as follows:
30. Research and Development Expenditures Recognized as Expense Research and development expenditures recognized as expenses for the years ended December 31, 2013 and 2012 were as follows:
(in millions of Won)
Freight and custody expenses ₩ 842,424 873,482Operating expenses for distribution center 9,370 8,955Sales commissions 70,397 75,207Sales advertising 3,145 4,168Sales promotion 6,375 6,206Sample 1,247 1,932Sales insurance premium 7,871 9,578
₩ 940,829 979,528
2013 2012
(in millions of Won)
Selling and administrative expenses ₩ 150,786 136,537
Cost of sales 364,876 376,650
₩ 515,662 513,187
2013 2012

POSCO Notes to the Separate Financial Statements, Continued As of December 31, 2013 and 2012
64
31. Adjusted Operating Profit Adjusted operating profits which include the other profits or losses excluded from operating profit but reflect the results of the Company’s operations for the years ended December 31, 2013 and 2012 were as follows:
Operating profits on the statement of comprehensive income ₩ 2,215,133 2,789,597Add
6,773 27,688Gain on disposals of investments in subsidiaries, associates and joint ventures 14,544 8,693
- 1,60667,875 1,150
Others 50,856 30,600140,048 69,737
Deduct(94,533) (84,990)
Impairment loss on property, plant and equipment (5,697) - Impairment loss on intangible assets (581) (6,495)Loss on disposals of intangible assets (315) (617)
(40,319) (62,684)Idle tangible assets expenses (16,800) (30,743)Impairment loss on investments in subsidiaries, associates and joint ventures (235,794) (1,102)Loss on disposals of investments in subsidiaries, associates and joint ventures (12,295) (17,575)Impairment loss on assets held for sale (1,814) - Loss on disposals of assets held for sale - (9,391)Others (10,451) (120,704)
(418,599) (334,301)Adjusted operating profit ₩ 1,936,582 2,525,033
(in millions of Won) 2013 2012
Gain on disposals of property, plant and equipment
Reversal of impairment loss of property, plant and equipment Gain on disposals of assets held for sale
Loss on disposals of property, plant and equipment
Donations
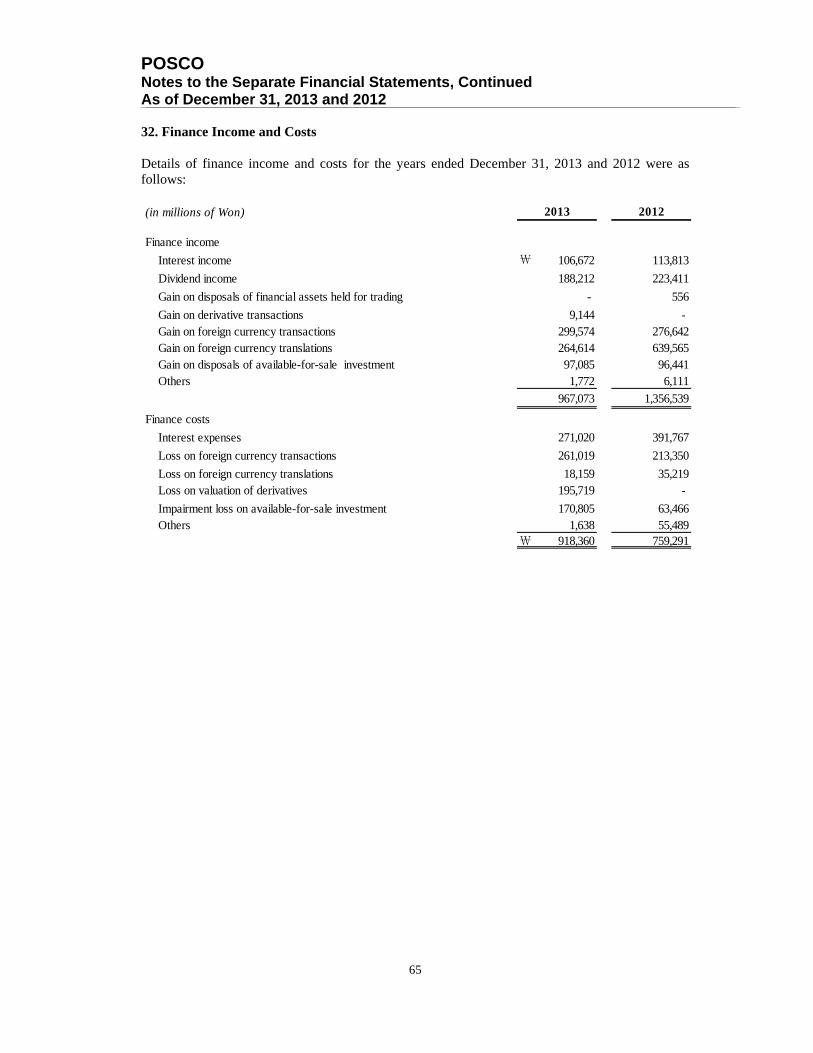
POSCO Notes to the Separate Financial Statements, Continued As of December 31, 2013 and 2012
65
32. Finance Income and Costs Details of finance income and costs for the years ended December 31, 2013 and 2012 were as follows:
(in millions of Won)
Finance income
Interest income ₩ 106,672 113,813
Dividend income 188,212 223,411
Gain on disposals of financial assets held for trading - 556
Gain on derivative transactions 9,144 - Gain on foreign currency transactions 299,574 276,642Gain on foreign currency translations 264,614 639,565Gain on disposals of available-for-sale investment 97,085 96,441Others 1,772 6,111
967,073 1,356,539
Finance costs
Interest expenses 271,020 391,767
Loss on foreign currency transactions 261,019 213,350
Loss on foreign currency translations 18,159 35,219Loss on valuation of derivatives 195,719 -
Impairment loss on available-for-sale investment 170,805 63,466Others 1,638 55,489
₩ 918,360 759,291
20122013
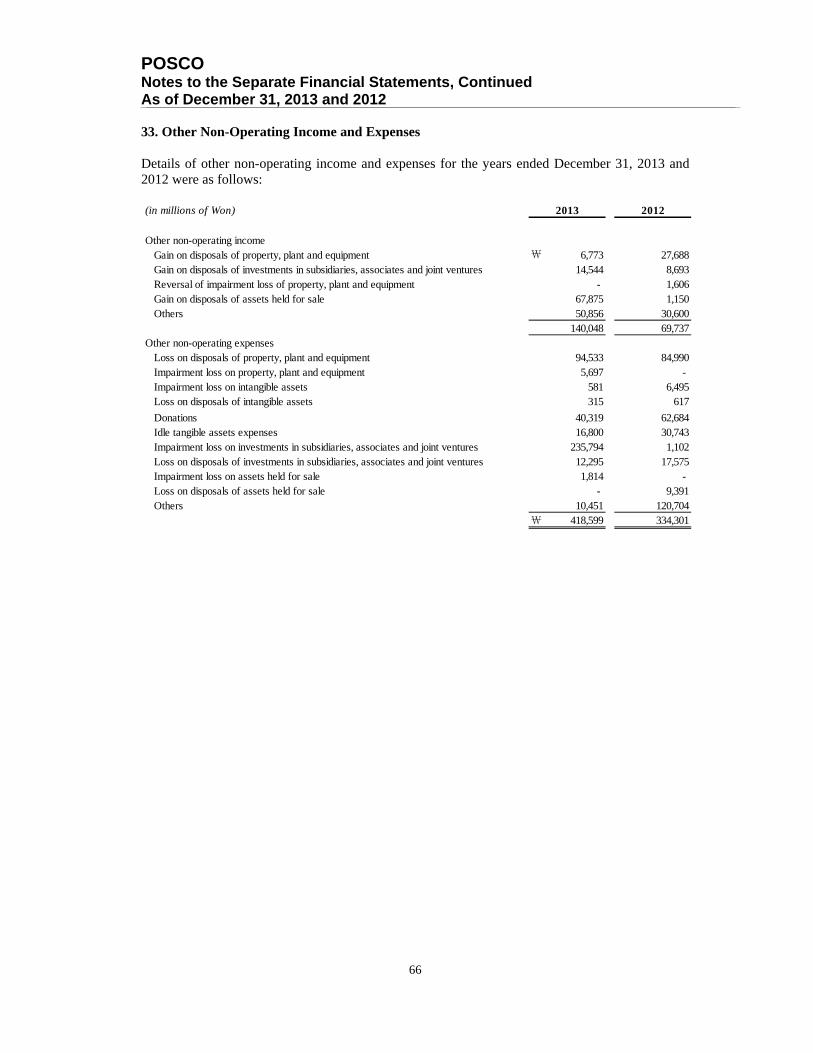
POSCO Notes to the Separate Financial Statements, Continued As of December 31, 2013 and 2012
66
33. Other Non-Operating Income and Expenses Details of other non-operating income and expenses for the years ended December 31, 2013 and 2012 were as follows:
(in millions of Won)
Other non-operating income Gain on disposals of property, plant and equipment ₩ 6,773 27,688 Gain on disposals of investments in subsidiaries, associates and joint ventures 14,544 8,693 Reversal of impairment loss of property, plant and equipment - 1,606 Gain on disposals of assets held for sale 67,875 1,150 Others 50,856 30,600
140,048 69,737Other non-operating expenses Loss on disposals of property, plant and equipment 94,533 84,990 Impairment loss on property, plant and equipment 5,697 - Impairment loss on intangible assets 581 6,495 Loss on disposals of intangible assets 315 617
Donations 40,319 62,684 Idle tangible assets expenses 16,800 30,743 Impairment loss on investments in subsidiaries, associates and joint ventures 235,794 1,102 Loss on disposals of investments in subsidiaries, associates and joint ventures 12,295 17,575 Impairment loss on assets held for sale 1,814 - Loss on disposals of assets held for sale - 9,391 Others 10,451 120,704
₩ 418,599 334,301
2013 2012
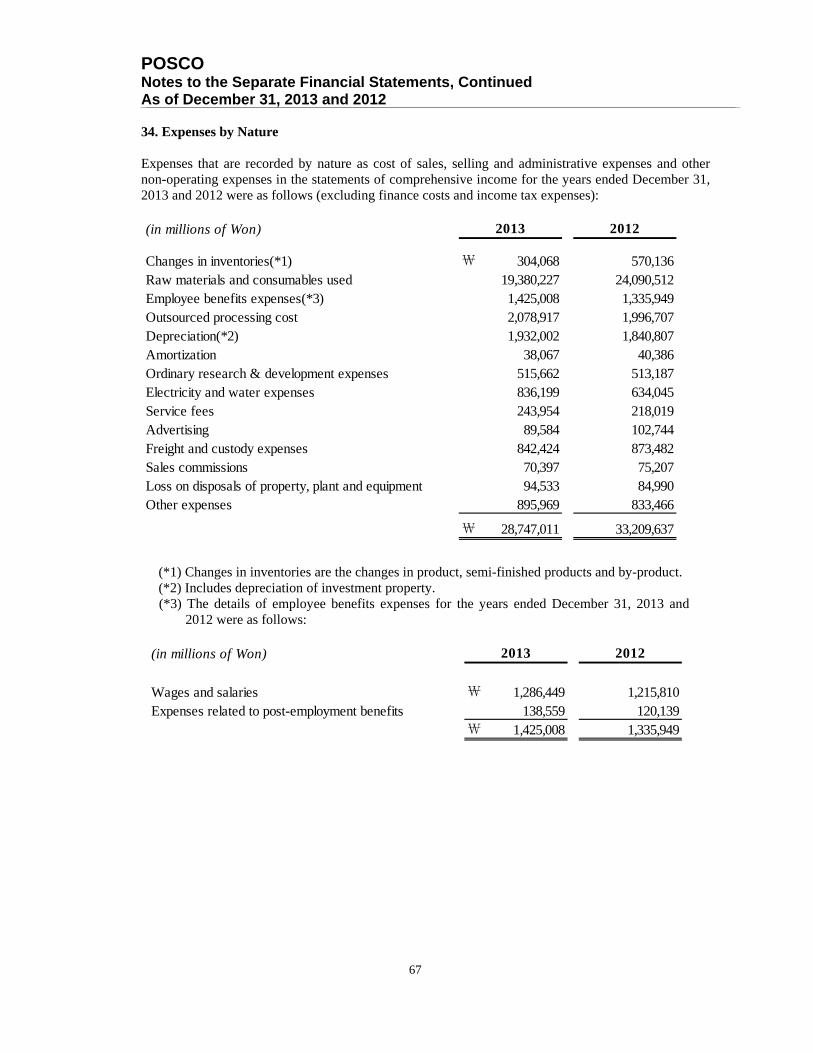
POSCO Notes to the Separate Financial Statements, Continued As of December 31, 2013 and 2012
67
34. Expenses by Nature Expenses that are recorded by nature as cost of sales, selling and administrative expenses and other non-operating expenses in the statements of comprehensive income for the years ended December 31, 2013 and 2012 were as follows (excluding finance costs and income tax expenses):
(*1) Changes in inventories are the changes in product, semi-finished products and by-product. (*2) Includes depreciation of investment property. (*3) The details of employee benefits expenses for the years ended December 31, 2013 and
2012 were as follows:
(in millions of Won)
Changes in inventories(*1) ₩ 304,068 570,136Raw materials and consumables used 19,380,227 24,090,512Employee benefits expenses(*3) 1,425,008 1,335,949Outsourced processing cost 2,078,917 1,996,707Depreciation(*2) 1,932,002 1,840,807Amortization 38,067 40,386Ordinary research & development expenses 515,662 513,187Electricity and water expenses 836,199 634,045Service fees 243,954 218,019Advertising 89,584 102,744Freight and custody expenses 842,424 873,482Sales commissions 70,397 75,207Loss on disposals of property, plant and equipment 94,533 84,990Other expenses 895,969 833,466
₩ 28,747,011 33,209,637
2013 2012
(in millions of Won)
Wages and salaries ₩ 1,286,449 1,215,810Expenses related to post-employment benefits 138,559 120,139
₩ 1,425,008 1,335,949
2013 2012

POSCO Notes to the Separate Financial Statements, Continued As of December 31, 2013 and 2012
68
35. Income Taxes (a) Income tax expense for the years ended December 31, 2013 and 2012 are as follows:
(*1) Additional tax payments (or tax returns) arising from finalized tax assessment are added
or deducted in current income taxes. (b) The expected amount of income tax expense based on statutory rates compared to the actual
amount of taxes recorded by the Company for the years ended December 31, 2013 and 2012 are as follows:
(c) The income taxes credited (charged) directly to equity for the years ended December 31, 2013 and 2012 were as follows:
(in millions of Won)
Current income taxes(*1) ₩ 291,035 212,107Deferred income taxes 254,790 330,760 Less: Items credited directly to shareholders' equity (143,126) 79,891Income tax expense ₩ 402,699 622,758
2013 2012
(in millions of Won)
Profit before income tax expense ₩ 1,985,295 3,122,281Income tax expense computed at statutory rate 480,441 755,592Adjustments: (77,742) (132,834)
Tax credit (134,670) (160,139)Additional payment of income taxes 2,253 3,328Investments in subsidiaries and associates 57,823 -
Tax effect due to permanent differences (11,071) 29,722Others 7,923 (5,745)
Income tax expense ₩ 402,699 622,758Effective tax rate (%) 20.3% 19.9%
2013 2012
(in millions of Won)
Net changes in the unrealized fair value of available-for-sale securities ₩ (144,194) 65,262
Defined benefit plan actuarial losses 2,775 14,629
Gain on disposal of treasury shares (1,707) - ₩ (143,126) 79,891
2013 2012

POSCO Notes to the Separate Financial Statements, Continued As of December 31, 2013 and 2012
69
(d) The movements in deferred tax assets (liabilities) for the years ended December 31, 2013 and
2012 were as follows:
(in millions of Won)
Inc(Dec) Dec.31, 2012
Reserve for special repairs ₩ (29,013) 551 (28,462) (29,659) 646 (29,013)
(368,647) (6,453) (375,100) (358,160) (10,487) (368,647)
Depreciation (56,394) 8,261 (48,133) (63,228) 6,834 (56,394)
Prepaid expenses 29,781 (2,101) 27,680 21,879 7,902 29,781
(789,056) (213,742) (1,002,798) (553,205) (235,851) (789,056)
(52,508) (122,422) (174,930) 93,911 (146,419) (52,508)
Defined benefit obligations 157,559 26,830 184,389 102,738 54,821 157,559
Plan assets (161,152) (33,773) (194,925) (124,536) (36,616) (161,152)
Accrued revenue (2,575) 643 (1,932) (2,314) (261) (2,575)
Others 162,669 127,759 290,428 283,880 (121,211) 162,669
(1,109,336) (214,447) (1,323,783) (628,694) (480,642) (1,109,336)
Deferred tax from tax credit
Tax credit carryforward 266,977 101,076 368,053 196,986 69,991 266,977
266,977 101,076 368,053 196,986 69,991 266,977
15,232 (144,194) (128,962) (50,030) 65,262 15,232
47,815 2,775 50,590 33,186 14,629 47,815
63,047 (141,419) (78,372) (16,844) 79,891 63,047
₩ (779,312) (254,790) (1,034,102) (448,552) (330,760) (779,312)
Defined benefit plan actuarial losses
Loss(gain) on valuation of available-for-sale securities
2013 2012
Dec.31, 2012 Inc(Dec) Dec.31, 2013 Dec.31, 2011
Deferred income tax due to temporary differences
Reserve for technology developments
Revaluation of property, plant and equipment
Loss on foreign currency translation
Deferred income taxes recognized directly to equity
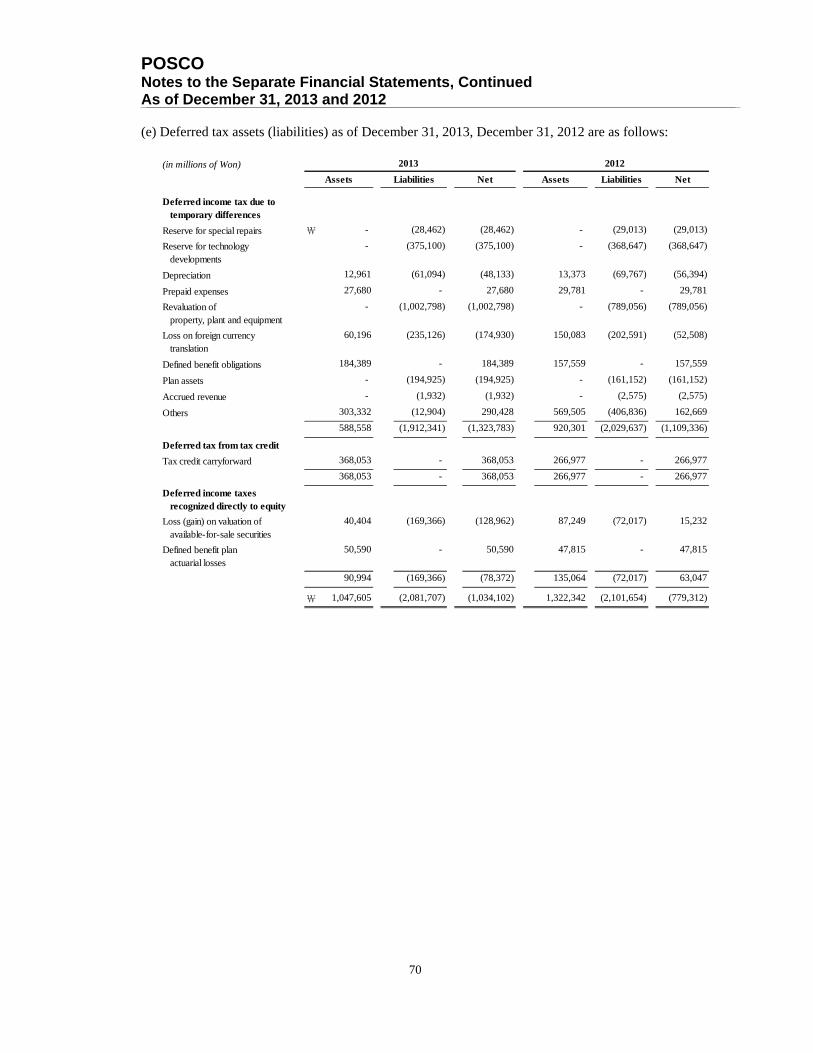
POSCO Notes to the Separate Financial Statements, Continued As of December 31, 2013 and 2012
70
(e) Deferred tax assets (liabilities) as of December 31, 2013, December 31, 2012 are as follows:
(in millions of Won)
Liabilities Net
Reserve for special repairs ₩ - (28,462) (28,462) - (29,013) (29,013)
- (375,100) (375,100) - (368,647) (368,647)
Depreciation 12,961 (61,094) (48,133) 13,373 (69,767) (56,394)
Prepaid expenses 27,680 - 27,680 29,781 - 29,781
- (1,002,798) (1,002,798) - (789,056) (789,056)
60,196 (235,126) (174,930) 150,083 (202,591) (52,508)
Defined benefit obligations 184,389 - 184,389 157,559 - 157,559
Plan assets - (194,925) (194,925) - (161,152) (161,152)
Accrued revenue - (1,932) (1,932) - (2,575) (2,575)
Others 303,332 (12,904) 290,428 569,505 (406,836) 162,669
588,558 (1,912,341) (1,323,783) 920,301 (2,029,637) (1,109,336)
Deferred tax from tax credit
Tax credit carryforward 368,053 - 368,053 266,977 - 266,977
368,053 - 368,053 266,977 - 266,977
40,404 (169,366) (128,962) 87,249 (72,017) 15,232
50,590 - 50,590 47,815 - 47,815
90,994 (169,366) (78,372) 135,064 (72,017) 63,047
₩ 1,047,605 (2,081,707) (1,034,102) 1,322,342 (2,101,654) (779,312)
Loss on foreign currency translation
Deferred income taxes recognized directly to equity
Loss (gain) on valuation of available-for-sale securities
Defined benefit plan actuarial losses
Deferred income tax due to temporary differences
Reserve for technology developments
Revaluation of property, plant and equipment
2013 2012
Assets Liabilities Net Assets
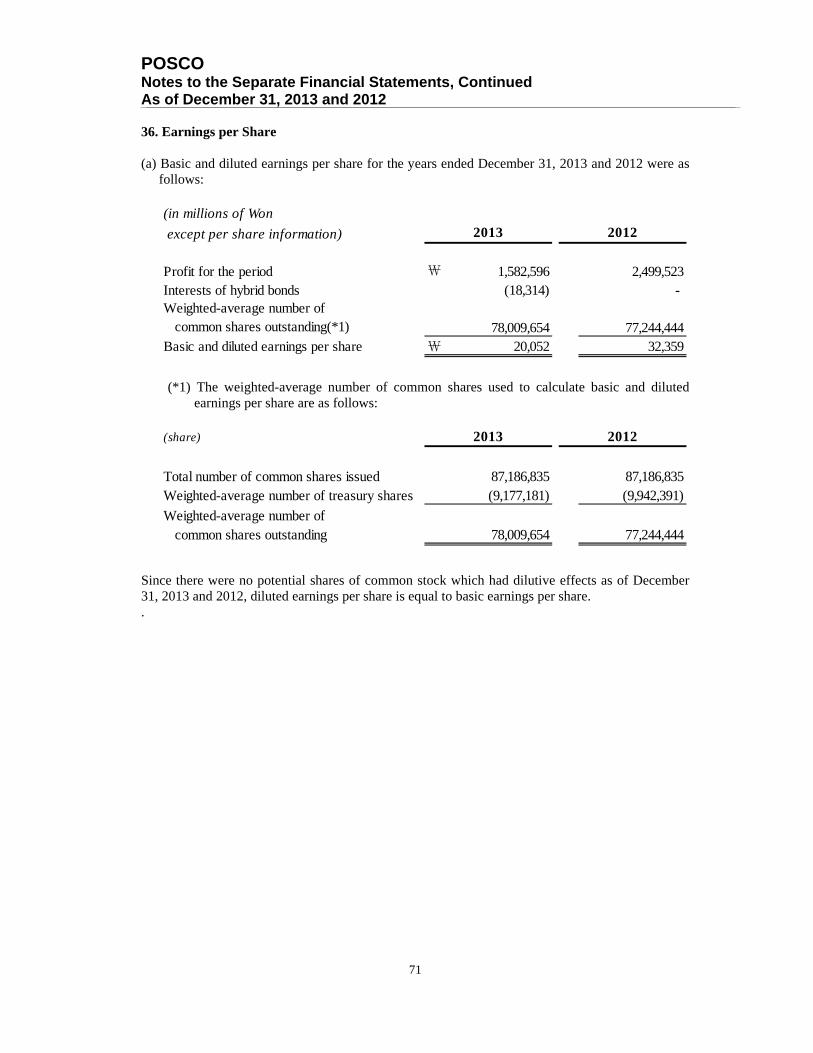
POSCO Notes to the Separate Financial Statements, Continued As of December 31, 2013 and 2012
71
36. Earnings per Share (a) Basic and diluted earnings per share for the years ended December 31, 2013 and 2012 were as
follows:
(*1) The weighted-average number of common shares used to calculate basic and diluted earnings per share are as follows:
Since there were no potential shares of common stock which had dilutive effects as of December 31, 2013 and 2012, diluted earnings per share is equal to basic earnings per share. .
(in millions of Won
except per share information)
Profit for the period ₩ 1,582,596 2,499,523Interests of hybrid bonds (18,314) -
78,009,654 77,244,444Basic and diluted earnings per share ₩ 20,052 32,359
Weighted-average number of common shares outstanding(*1)
2013 2012
(share)
Total number of common shares issued 87,186,835 87,186,835Weighted-average number of treasury shares (9,177,181) (9,942,391)
78,009,654 77,244,444
2013 2012
Weighted-average number of common shares outstanding

POSCO Notes to the Separate Financial Statements, Continued As of December 31, 2013 and 2012
72
37. Related Party Transactions (a) Significant transactions with related companies for the years ended December 31, 2013 and
2012 are as follows:
1) For the year ended December 31, 2013
(*1) Sales and others mainly consist of sales of steel products to subsidiaries, associates and joint ventures. These are priced on an arm’s length basis.
(*2) Purchases and others mainly consist of subsidiaries’ purchases of construction services and purchases of raw materials to manufacture steel products. These are priced on an arm’s length basis
(*3) As of December 31, 2013, the Company provided guarantees to related parties (note 22). (*4) Sungjin Geotec Co., Ltd. merged with POSCO Plant Engineering Co., Ltd. and changed
its name to POSCO PLANTEC Co., Ltd..
(in millions of Won)
Subsidiaries(*3)POSCO ENGINEERING & CONSTRUCTION Co., LTD.
₩ 16,439 3,421 ₩ 19,860 ₩ 3,042 2,235,798 5,855 9,242 ₩ 2,253,937
POSCO Processing&Service 987,424 8 987,432 1,215,510 - - 805 1,216,315POSCO COATED & COLOR STEEL Co., Ltd. 472,353 25 472,378 - - 10,648 98 10,746
POSCO PLANTEC Co., Ltd. 2,324 19 2,343 1,499 67,081 13,733 2,492 84,805
POSCO ICT 1,210 195 1,405 679 279,660 31,231 157,126 468,696POSMATE 1,419 85 1,504 805 1,041 15,732 32,894 50,472eNtoB Corporation - 10 10 234,352 13,241 149 20,079 267,821POSCO CHEMTECH 512,139 25,868 538,007 491,562 21,832 287,584 1,223 802,201POSCO M-TECH 11,122 94 11,216 158,709 2,336 220,986 141 382,172POSCO ENERGY CO., LTD. 104,209 915 105,124 - 5,178 - 7 5,185POSCO TMC Co., Ltd. 188,915 15 188,930 - - 1,051 1,298 2,349POSCO AST 500,193 10 500,203 6,985 - 56,520 2,029 65,534POSHIMETAL Co., Ltd. 18,922 137 19,059 166,042 - - 5 166,047Daewoo International Corporation 3,522,678 65 3,522,743 16,297 - - 2,843 19,140POSCO America Corporation 596,681 1 596,682 - - - 339 339POSCO Canada Ltd. - - - 144,329 - - - 144,329POSCO Asia Co., Ltd. 2,068,965 221 2,069,186 64,434 182 - 1,673 66,289POSCO (Thailand) Company Limited 56,210 56 56,266 - - - 85 85Qingdao Pohang Stainless Steel Co., Ltd. 58,502 - 58,502 - - - 14 14POSCO(Suzhou) Automotive Processing Center Co., Ltd.
129,345 1 129,346 - - - - -
POSCO JAPAN Co., Ltd. 1,270,325 - 1,270,325 19,978 2 - 2,972 22,952POSCO-India Pune Processing Center. Pvt. Ltd. 119,503 7 119,510 - - - - -POSCO MEXICO S.A. DE C.V. 256,014 693 256,707 - - - 621 621POSCO Maharashtra Steel Private Limited 176,425 3,157 179,582 - - - 236 236DAEWOO INTERNATIONAL SINGAPORE PTE. LTD.
- - - 108,179 - - - 108,179
Others 558,923 7,569 566,492 92,527 38,843 18,782 77,101 227,253
₩ 11,630,240 42,572 ₩ 11,672,812 ₩ 2,724,929 2,665,194 662,271 313,323 ₩ 6,365,717
Associates and joint ventures(*3)SNNC 1,532 458 1,990 402,639 - - - 402,639POSCO PLANTEC Co., Ltd.(*4) (formerly, SUNGJIN GEOTEC Co., Ltd.)
15,028 48 15,076 1,735 65,802 9,781 6,883 84,201
POSCHROME (PROPRIETARY) LIMITED - - - 66,762 - - - 66,762PT. POSMI Steel Indonesia 6,538 - 6,538 - - - - -POSK(Pinghu) Steel Processing Center Co., Ltd. 3,786 - 3,786 - - - - -POSCO-SAMSUNG-Slovakia Processing Center 19,906 - 19,906 - - - - -POSCO-SAMSUNG Suzhou Processing Center Co., Ltd.
6,429 - 6,429 - - - - -
Others 546 165 711 3,937 - - 176 4,113₩ 53,765 671 ₩ 54,436 ₩ 475,073 65,802 9,781 7,059 ₩ 557,715
₩ 11,684,005 43,243 ₩ 11,727,248 ₩ 3,200,002 2,730,996 672,052 320,382 ₩ 6,923,432
Sales and others(*1) Purchase and others(*2)
Sales Others TotalPurchase of
materialPurchase offixed assets
Outsourcedprocessing
cost
Others Total
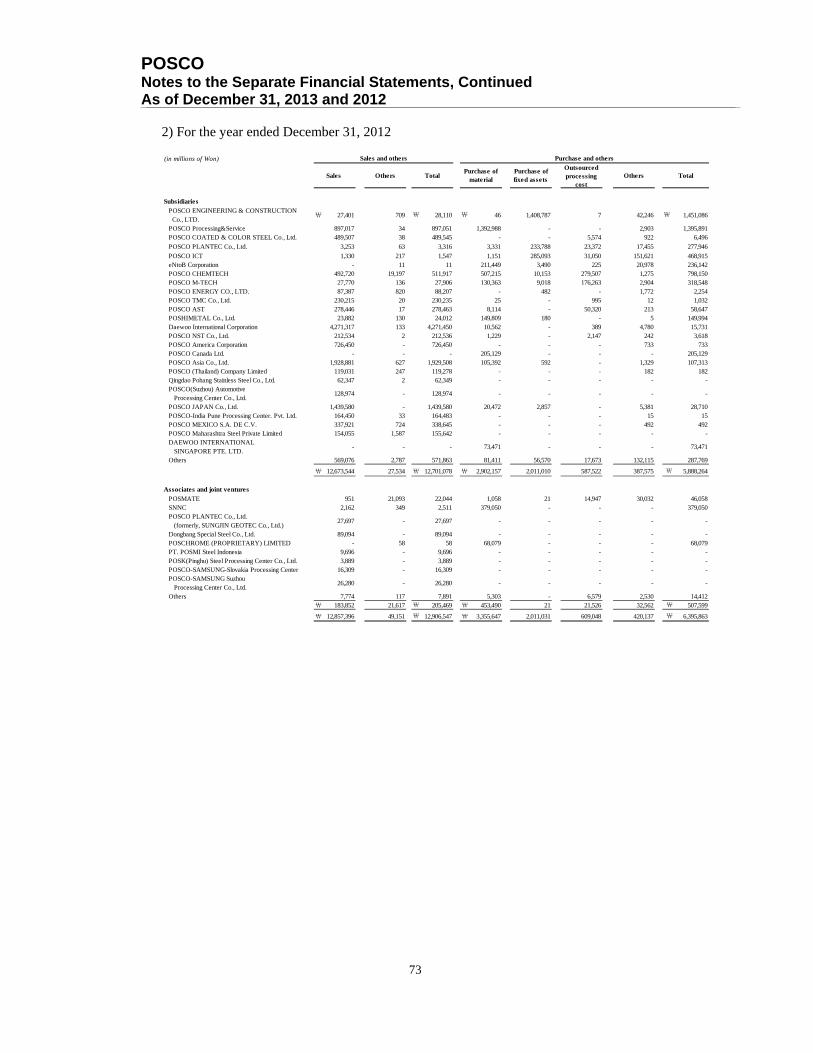
POSCO Notes to the Separate Financial Statements, Continued As of December 31, 2013 and 2012
73
2) For the year ended December 31, 2012
(in millions of Won)
SubsidiariesPOSCO ENGINEERING & CONSTRUCTION Co., LTD.
₩ 27,401 709 ₩ 28,110 ₩ 46 1,408,787 7 42,246 ₩ 1,451,086
POSCO Processing&Service 897,017 34 897,051 1,392,988 - - 2,903 1,395,891POSCO COATED & COLOR STEEL Co., Ltd. 489,507 38 489,545 - - 5,574 922 6,496
POSCO PLANTEC Co., Ltd. 3,253 63 3,316 3,331 233,788 23,372 17,455 277,946
POSCO ICT 1,330 217 1,547 1,151 285,093 31,050 151,621 468,915eNtoB Corporation - 11 11 211,449 3,490 225 20,978 236,142POSCO CHEMTECH 492,720 19,197 511,917 507,215 10,153 279,507 1,275 798,150POSCO M-TECH 27,770 136 27,906 130,363 9,018 176,263 2,904 318,548POSCO ENERGY CO., LTD. 87,387 820 88,207 - 482 - 1,772 2,254POSCO TMC Co., Ltd. 230,215 20 230,235 25 - 995 12 1,032POSCO AST 278,446 17 278,463 8,114 - 50,320 213 58,647POSHIMETAL Co., Ltd. 23,882 130 24,012 149,809 180 - 5 149,994Daewoo International Corporation 4,271,317 133 4,271,450 10,562 - 389 4,780 15,731POSCO NST Co., Ltd. 212,534 2 212,536 1,229 - 2,147 242 3,618POSCO America Corporation 726,450 - 726,450 - - - 733 733POSCO Canada Ltd. - - - 205,129 - - - 205,129POSCO Asia Co., Ltd. 1,928,881 627 1,929,508 105,392 592 - 1,329 107,313POSCO (Thailand) Company Limited 119,031 247 119,278 - - - 182 182Qingdao Pohang Stainless Steel Co., Ltd. 62,347 2 62,349 - - - - -POSCO(Suzhou) Automotive Processing Center Co., Ltd.
128,974 - 128,974 - - - - -
POSCO JAPAN Co., Ltd. 1,439,580 - 1,439,580 20,472 2,857 - 5,381 28,710POSCO-India Pune Processing Center. Pvt. Ltd. 164,450 33 164,483 - - - 15 15POSCO MEXICO S.A. DE C.V. 337,921 724 338,645 - - - 492 492POSCO Maharashtra Steel Private Limited 154,055 1,587 155,642 - - - - -DAEWOO INTERNATIONAL SINGAPORE PTE. LTD.
- - - 73,471 - - - 73,471
Others 569,076 2,787 571,863 81,411 56,570 17,673 132,115 287,769
₩ 12,673,544 27,534 ₩ 12,701,078 ₩ 2,902,157 2,011,010 587,522 387,575 ₩ 5,888,264
Associates and joint ventures
POSMATE 951 21,093 22,044 1,058 21 14,947 30,032 46,058SNNC 2,162 349 2,511 379,050 - - - 379,050POSCO PLANTEC Co., Ltd. (formerly, SUNGJIN GEOTEC Co., Ltd.)
27,697 - 27,697 - - - - -
Dongbang Special Steel Co., Ltd. 89,094 - 89,094 - - - - -POSCHROME (PROPRIETARY) LIMITED - 58 58 68,079 - - - 68,079PT. POSMI Steel Indonesia 9,696 - 9,696 - - - - -POSK(Pinghu) Steel Processing Center Co., Ltd. 3,889 - 3,889 - - - - -POSCO-SAMSUNG-Slovakia Processing Center 16,309 - 16,309 - - - - -POSCO-SAMSUNG Suzhou Processing Center Co., Ltd.
26,280 - 26,280 - - - - -
Others 7,774 117 7,891 5,303 - 6,579 2,530 14,412₩ 183,852 21,617 ₩ 205,469 ₩ 453,490 21 21,526 32,562 ₩ 507,599
₩ 12,857,396 49,151 ₩ 12,906,547 ₩ 3,355,647 2,011,031 609,048 420,137 ₩ 6,395,863
Sales and others Purchase and others
Sales Others TotalPurchase of
materialPurchase offixed assets
Outsourcedprocessing
costOthers Total
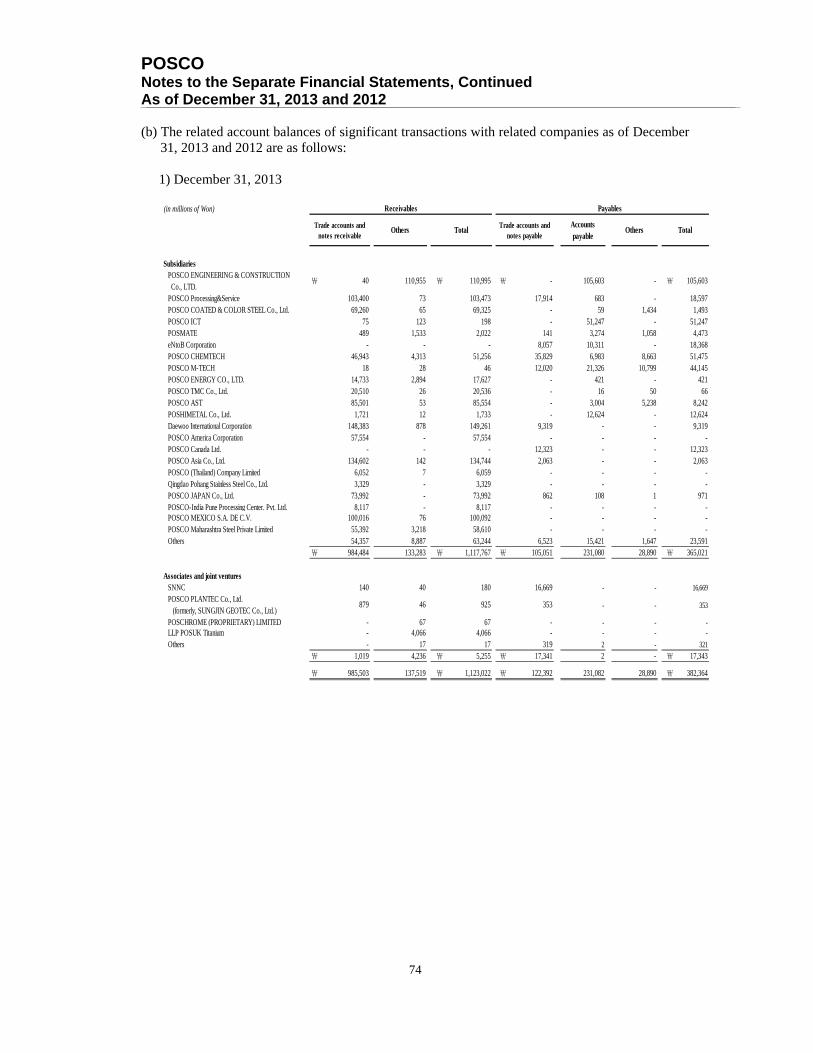
POSCO Notes to the Separate Financial Statements, Continued As of December 31, 2013 and 2012
74
(b) The related account balances of significant transactions with related companies as of December
31, 2013 and 2012 are as follows:
1) December 31, 2013
(in millions of Won)
SubsidiariesPOSCO ENGINEERING & CONSTRUCTION Co., LTD.
₩ 40 110,955 ₩ 110,995 ₩ - 105,603 - ₩ 105,603
POSCO Processing&Service 103,400 73 103,473 17,914 683 - 18,597POSCO COATED & COLOR STEEL Co., Ltd. 69,260 65 69,325 - 59 1,434 1,493POSCO ICT 75 123 198 - 51,247 - 51,247POSMATE 489 1,533 2,022 141 3,274 1,058 4,473eNtoB Corporation - - - 8,057 10,311 - 18,368POSCO CHEMTECH 46,943 4,313 51,256 35,829 6,983 8,663 51,475POSCO M-TECH 18 28 46 12,020 21,326 10,799 44,145POSCO ENERGY CO., LTD. 14,733 2,894 17,627 - 421 - 421POSCO TMC Co., Ltd. 20,510 26 20,536 - 16 50 66POSCO AST 85,501 53 85,554 - 3,004 5,238 8,242POSHIMETAL Co., Ltd. 1,721 12 1,733 - 12,624 - 12,624Daewoo International Corporation 148,383 878 149,261 9,319 - - 9,319POSCO America Corporation 57,554 - 57,554 - - - -POSCO Canada Ltd. - - - 12,323 - - 12,323POSCO Asia Co., Ltd. 134,602 142 134,744 2,063 - - 2,063POSCO (Thailand) Company Limited 6,052 7 6,059 - - - -Qingdao Pohang Stainless Steel Co., Ltd. 3,329 - 3,329 - - - -POSCO JAPAN Co., Ltd. 73,992 - 73,992 862 108 1 971POSCO-India Pune Processing Center. Pvt. Ltd. 8,117 - 8,117 - - - -POSCO MEXICO S.A. DE C.V. 100,016 76 100,092 - - - -POSCO Maharashtra Steel Private Limited 55,392 3,218 58,610 - - - -Others 54,357 8,887 63,244 6,523 15,421 1,647 23,591
₩ 984,484 133,283 ₩ 1,117,767 ₩ 105,051 231,080 28,890 ₩ 365,021
Associates and joint venturesSNNC 140 40 180 16,669 - - 16,669
POSCO PLANTEC Co., Ltd. (formerly, SUNGJIN GEOTEC Co., Ltd.)
879 46 925 353 - - 353
POSCHROME (PROPRIETARY) LIMITED - 67 67 - - - -LLP POSUK Titanium - 4,066 4,066 - - - -
Others - 17 17 319 2 - 321
₩ 1,019 4,236 ₩ 5,255 ₩ 17,341 2 - ₩ 17,343
₩ 985,503 137,519 ₩ 1,123,022 ₩ 122,392 231,082 28,890 ₩ 382,364
Receivables Payables
Trade accounts andnotes receivable
Others TotalTrade accounts and
notes payableAccountspayable
Others Total
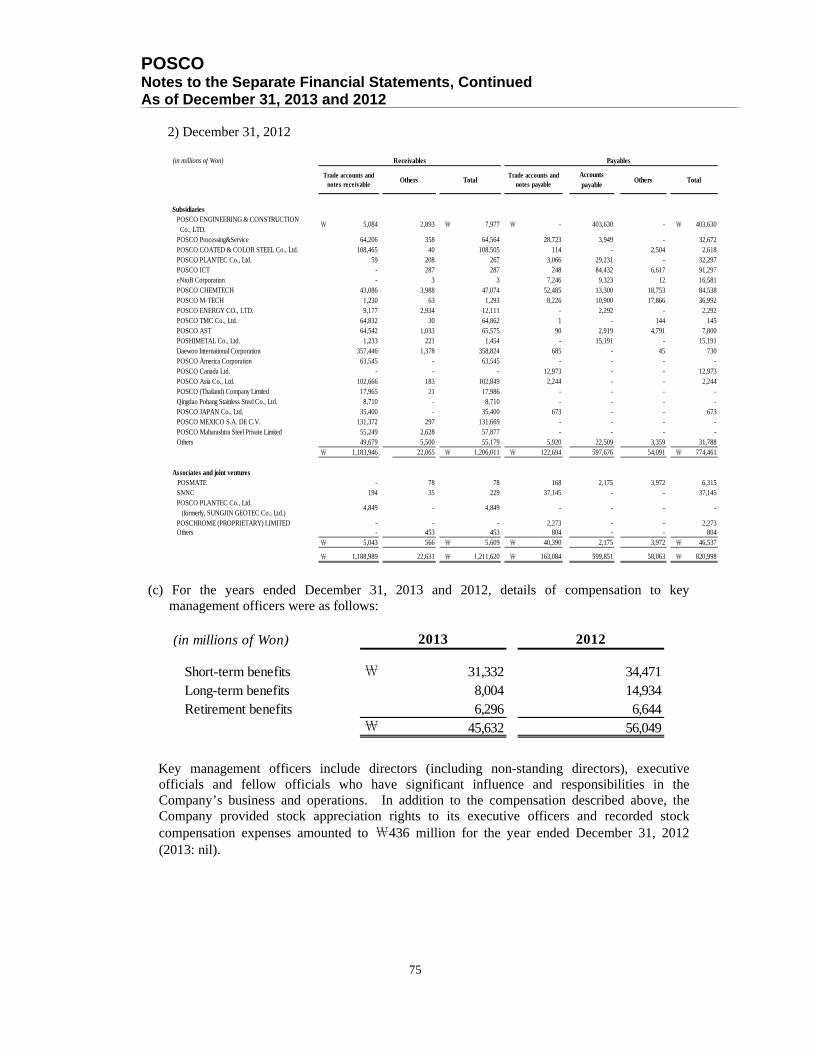
POSCO Notes to the Separate Financial Statements, Continued As of December 31, 2013 and 2012
75
2) December 31, 2012
(c) For the years ended December 31, 2013 and 2012, details of compensation to key
management officers were as follows:
Key management officers include directors (including non-standing directors), executive officials and fellow officials who have significant influence and responsibilities in the Company’s business and operations. In addition to the compensation described above, the Company provided stock appreciation rights to its executive officers and recorded stock compensation expenses amounted to ₩436 million for the year ended December 31, 2012 (2013: nil).
(in millions of Won)
SubsidiariesPOSCO ENGINEERING & CONSTRUCTION Co., LTD.
₩ 5,084 2,893 ₩ 7,977 ₩ - 403,630 - ₩ 403,630
POSCO Processing&Service 64,206 358 64,564 28,723 3,949 - 32,672POSCO COATED & COLOR STEEL Co., Ltd. 108,465 40 108,505 114 - 2,504 2,618POSCO PLANTEC Co., Ltd. 59 208 267 3,066 29,231 - 32,297POSCO ICT - 287 287 248 84,432 6,617 91,297eNtoB Corporation - 3 3 7,246 9,323 12 16,581POSCO CHEMTECH 43,086 3,988 47,074 52,485 13,300 18,753 84,538POSCO M-TECH 1,230 63 1,293 8,226 10,900 17,866 36,992POSCO ENERGY CO., LTD. 9,177 2,934 12,111 - 2,292 - 2,292POSCO TMC Co., Ltd. 64,832 30 64,862 1 - 144 145POSCO AST 64,542 1,033 65,575 90 2,919 4,791 7,800POSHIMETAL Co., Ltd. 1,233 221 1,454 - 15,191 - 15,191Daewoo International Corporation 357,446 1,378 358,824 685 - 45 730POSCO America Corporation 63,545 - 63,545 - - - -POSCO Canada Ltd. - - - 12,973 - - 12,973POSCO Asia Co., Ltd. 102,666 183 102,849 2,244 - - 2,244POSCO (Thailand) Company Limited 17,965 21 17,986 - - - -Qingdao Pohang Stainless Steel Co., Ltd. 8,710 - 8,710 - - - -POSCO JAPAN Co., Ltd. 35,400 - 35,400 673 - - 673POSCO MEXICO S.A. DE C.V. 131,372 297 131,669 - - - -POSCO Maharashtra Steel Private Limited 55,249 2,628 57,877 - - - -Others 49,679 5,500 55,179 5,920 22,509 3,359 31,788
₩ 1,183,946 22,065 ₩ 1,206,011 ₩ 122,694 597,676 54,091 ₩ 774,461
Associates and joint ventures POSMATE - 78 78 168 2,175 3,972 6,315
SNNC 194 35 229 37,145 - - 37,145POSCO PLANTEC Co., Ltd. (formerly, SUNGJIN GEOTEC Co., Ltd.)
4,849 - 4,849 - - - -
POSCHROME (PROPRIETARY) LIMITED - - - 2,273 - - 2,273Others - 453 453 804 - - 804
₩ 5,043 566 ₩ 5,609 ₩ 40,390 2,175 3,972 ₩ 46,537
₩ 1,188,989 22,631 ₩ 1,211,620 ₩ 163,084 599,851 58,063 ₩ 820,998
Total
Receivables Payables
Trade accounts andnotes receivable
Others TotalTrade accounts and
notes payableAccountspayable
Others
(in millions of Won)
Short-term benefits ₩ 31,332 34,471Long-term benefits 8,004 14,934Retirement benefits 6,296 6,644
₩ 45,632 56,049
2013 2012
POSCO Notes to the Separate Financial Statements, Continued As of December 31, 2013 and 2012
76
38. Commitments and Contingencies (a) Contingent liabilities
Contingent liabilities may develop in a way not initially expected. Therefore, management continuously assesses contingent liabilities to determine whether an outflow of resources embodying economic benefits has become probable. If it becomes probable that an outflow of future economic benefits will be required for an item previously dealt with as a contingent liability, a provision is recognized in the financial statements of the period in which the change in probability occurs (except in the extremely rare circumstances where no reliable estimate can be made).
Management makes estimates and assumptions that affect disclosures of commitments and contingencies. All estimates and assumptions are based on the evaluation of current circumstances and appraisals with the supports of internal specialists or external consultants.
Management regularly analyzes current information about these matters and provides provisions for probable contingent losses including the estimate of legal expense to resolve the matters. Internal and external lawyers are used for these assessments. In making the decision regarding the need for provisions, management considers the degree of probability of an unfavorable outcome and the ability to make a sufficiently reliable estimate of the amount of loss.
(b) Commitments
The Company entered into long-term contracts to purchase iron ore, coal, nickel and others. The contracts of iron ore and coal generally have terms of more than three years and the contracts of nickel have terms of more than one year. These contracts provide for periodic price adjustments based on the market price. As of December 31, 2013, 193million tons of iron ore and 14 million tons of coal remained to be purchased under such long-term contracts.
The Company entered into an agreement with Tangguh Liquefied Natural Gas (LNG) Consortium in Indonesia to purchase 550 thousand tons of LNG annually for 20 years commencing in August 2005. The purchase price is subject to change, based on changes of the monthly standard oil price (JCC) and with a price ceiling.
As of December 31, 2013, the Company entered into commitments with Korea National Oil Corporation for long-term foreign currency borrowings, which are limited up to the amount of USD 6.86 million, USD 6.58 million and USD 4.12 million. The borrowings are related to the exploration of gas hydrates in Aral Sea, Uzbekistan, the exploration of gas hydrates in Namangan-Chust and the exploration of gas hydrates in Western Fergana-Chenavard, respectively. The repayment of the borrowings depends on the success of the projects. The Company is not liable for the repayment of full or part of the money borrowed if the respective projects fail. The Company has agreed to pay a certain portion of its profits under certain conditions, as defined by the borrowing agreements.
As of December 31, 2013, the Company has provided two blank promissory notes and a blank check to Korea Resources Corporation as collateral for long-term domestic borrowings, and has provided six blank promissory notes and three blank checks to Korea National Oil Corporation as collateral for long-term foreign currency borrowings.
POSCO Notes to the Separate Financial Statements, Continued As of December 31, 2013 and 2012
77
(c) Litigation in progress
1) Civil lawsuits with Nippon Steel & Sumitomo Metal Corporation
During the year ended December 31, 2012, Nippon Steel & Sumitomo Metal Corporation filed a civil lawsuit in the Tokyo District Court of Japan against POSCO and POSCO Japan Co., Ltd., a subsidiary of POSCO, to prohibit production and sales of grain oriented electrical steel sheets using improperly acquired trade secrets and seeking compensation from the Company of JPY 98.6 billion (₩990.6 billion). Through trials to the year ended December 31, 2013, the Company submitted its responses that the Japan court did not have jurisdiction on this lawsuit as it should be judged by Korean law and the Company developed grain oriented electrical steel sheets using the Company’s own technologies. As of December 31, 2013, the Japan court has not made any judgments on this matter. Since the Company does not believe that it is probable that an outflow of resources will be required, the Company has not recorded any provision for this lawsuit as of December 31, 2013.
In addition, Nippon Steel & Sumitomo Metal Corporation filed a civil lawsuit in the New Jersey federal court, United States, against POSCO and POSCO America Co., Ltd., a subsidiary of POSCO, claiming infringement of intellectual property rights related to the production of grain oriented electrical steel sheets. As of December 31, 2013, no claim amount has been made and the Company is under discovery proceedings related to this matter. Due to the early stage of the litigation and the inherent uncertainties, the Company is not able to reliably estimate the amount of compensation and timing, if any, that might be awarded to Nippon Steel & Sumitomo Metal Corporation. Consequently, it is not possible for the Company to make an estimate of the expected financial effect that will result from the ultimate resolution of this civil lawsuit. Therefore, the Company has not recorded any provision for this lawsuit in the U.S. as of December 31, 2013. 2) Other lawsuits and claims
The Company is involved in 37 other lawsuits and claims for alleged damages aggregating to ₩69 billion as of December 31, 2013, which arose in the ordinary course of business. In the opinion of management, these 37 lawsuits and claims will not have a material adverse effect on the Company’s financial position, operating results or cash flows. Additionally, no provision is recorded in connection with these 37 lawsuits and claims as of December 31, 2013 because the Company has not concluded that a probable loss has occurred on any of the lawsuits and claims.
(d) The Company has provided a supplemental funding agreement, as the largest shareholder, as
requested from the creditors, including Norddeutsche Landesbank, for seamless funding to the construction of new power plant by POSCO Energy Co., Ltd..
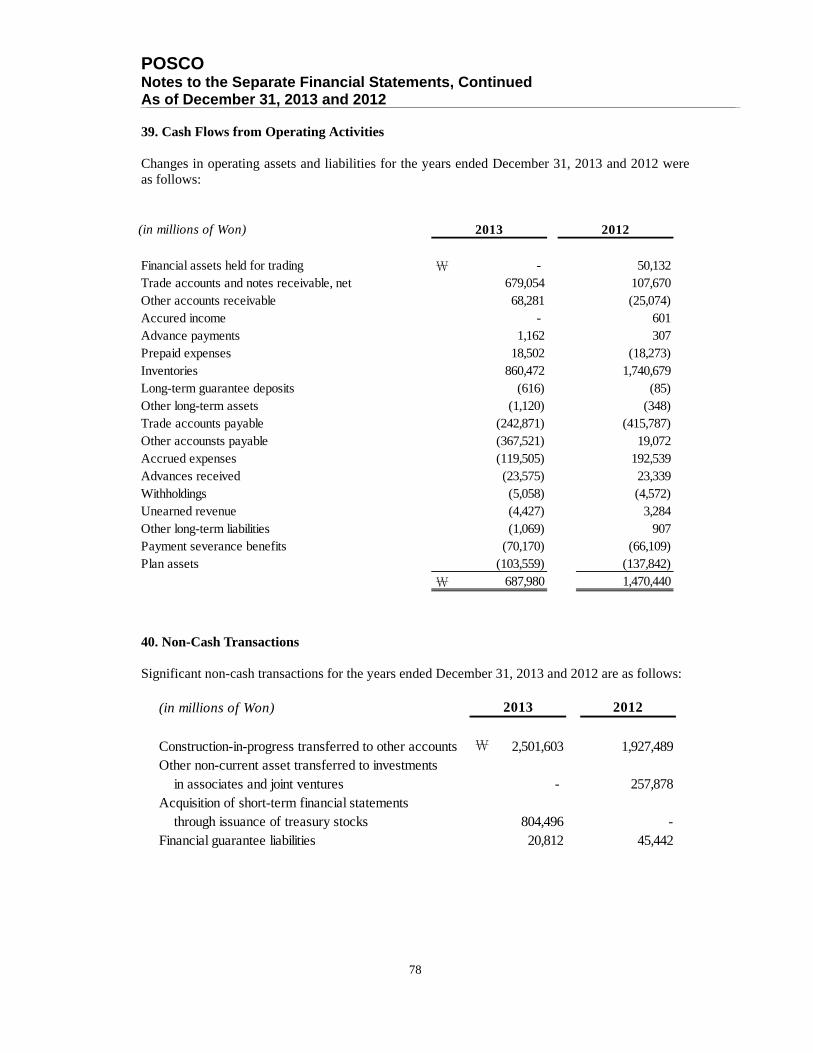
POSCO Notes to the Separate Financial Statements, Continued As of December 31, 2013 and 2012
78
39. Cash Flows from Operating Activities Changes in operating assets and liabilities for the years ended December 31, 2013 and 2012 were as follows:
40. Non-Cash Transactions Significant non-cash transactions for the years ended December 31, 2013 and 2012 are as follows:
(in millions of Won)
Financial assets held for trading ₩ - 50,132Trade accounts and notes receivable, net 679,054 107,670Other accounts receivable 68,281 (25,074)
Accured income - 601 Advance payments 1,162 307
Prepaid expenses 18,502 (18,273)Inventories 860,472 1,740,679Long-term guarantee deposits (616) (85)Other long-term assets (1,120) (348)Trade accounts payable (242,871) (415,787)Other accounsts payable (367,521) 19,072Accrued expenses (119,505) 192,539Advances received (23,575) 23,339Withholdings (5,058) (4,572)Unearned revenue (4,427) 3,284Other long-term liabilities (1,069) 907Payment severance benefits (70,170) (66,109)
Plan assets (103,559) (137,842)
₩ 687,980 1,470,440
2013 2012
(in millions of Won)
Construction-in-progress transferred to other accounts ₩ 2,501,603 1,927,489Other non-current asset transferred to investments in associates and joint ventures - 257,878Acquisition of short-term financial statements through issuance of treasury stocks 804,496 -Financial guarantee liabilities 20,812 45,442
2013 2012
79
Independent Auditors’ Review Report on internal Accounting control system
English Translation of a Report Originally Issued in Korean
To the President of POSCO:
We have reviewed the accompanying Report on the Operations of Internal Accounting Control System (“IACS”) of POSCO (the “Company”) as of December 31, 2013. The Company's management is responsible for designing and maintaining effective IACS and for its assessment of the effectiveness of IACS. Our responsibility is to review management's assessment and issue a report based on our review. In the accompanying report of management’s assessment of IACS, the Company’s management stated: “Based on the assessment on the operations of the IACS, the Company’s IACS has been effectively designed and is operating as of December 31, 2013, in all material respects, in accordance with the IACS Framework issued by the Internal Accounting Control System Operation Committee.”
We conducted our review in accordance with IACS Review Standards, issued by the Korean Institute of Certified Public Accountants. Those Standards require that we plan and perform the review to obtain assurance of a level less than that of an audit as to whether Report on the Operations of Internal Accounting Control System is free of material misstatement. Our review consists principally of obtaining an understanding of the Company’s IACS, inquiries of company personnel about the details of the report, and tracing to related documents we considered necessary in the circumstances. We have not performed an audit and, accordingly, we do not express an audit opinion.
A company's IACS is a process designed to provide reasonable assurance regarding the reliability of financial reporting and the preparation of financial statements for external purposes in conformity with Korean International Financial Reporting Standards. Because of its inherent limitations, however, IACS may not prevent or detect misstatements. Also, projections of any evaluation of effectiveness to future periods are subject to the risk that controls may become inadequate because of changes in conditions, or that the degree of compliance with the policies or procedures may deteriorate.
Based on our review, nothing has come to our attention that Report on the Operations of Internal Accounting Control System as of December 31, 2013 is not prepared in all material respects, in accordance with IACS Framework issued by the Internal Accounting Control System Operation Committee.
This report applies to the Company’s IACS in existence as of December 31, 2013. We did not review the Company’s IACS subsequent to December 31, 2013. This report has been prepared for Korean regulatory purposes, pursuant to the External Audit Law, and may not be appropriate for other purposes or for other users. Seoul, Korea February 25, 2014
80
Notice to Readers
This report is annexed in relation to the audit of the separate financial statements as of December 31, 2013 and the review of internal accounting control system pursuant to Article 2-3 of the Act on External Audit for Joint-stock Companies of the Republic of Korea.
81


![2016 Earnings Release - POSCO Earnings Release ... 303 407 18.5 40 25.7 [STS Aggregated* Performance Result] 2015 2016 ... (Target : 95 subsidiaries/54 assets) 11](https://static.documents.pub/doc/80x56/5abe9a9d7f8b9a3a428d2598/2016-earnings-release-earnings-release-303-407-185-40-257-sts-aggregated.jpg)


