58
European Commission Directorate-General XI ’5$)79(56,21 $0%,(17$,532//87,21&$5%210212;,’( 326,7,213$3(5 0DUFK
| Date post: | 02-Sep-2018 |
| Category: |
Documents |
| Upload: | trinhxuyen |
| View: | 217 times |
| Download: | 0 times |

European Commission
Directorate-General XI
'5$)7�9(56,21����
$0%,(17�$,5�32//87,21��&$5%21�0212;,'(
326,7,21�3$3(5
���0DUFK�����

This document has been prepared by the Commission’s consultant Dr. K.D. van den Hout,TNO Institute of Environmental Sciences, Energy Research and Process Innovation,
Apeldoorn, The Netherlands
with the assistance of the following experts:
A. Hauer, European Environmental BureauS. Baverstock, CONCAWE
M. Hawkins, ACEAM. Holland, AEA Technology, UK
P. Vanderstraeten, IBGE-BIMC. Wappenschmit, Ministerium für Umwelt, Raumordnung und Landwirtschaft des Landes
Nordrhein-WestfalenA. Borowiak, JRC
P. Hecq, DGXIL. Edwards, DGXI
127(
This document reflects the opinions of the majority of the experts who assisted in itspreparation.
It should not be considered as an official statement of the position of the EuropeanCommission
Not all experts necessarily share all the views expressed in this document.

CO position paper - draft version 5.2
3
$0%,(17�$,5�32//87,21��&$5%21�0212;,'(
326,7,21�3$3(5
6XPPDU\
����,QWURGXFWLRQ
This position paper is a background document to support the Commission in the preparationof a proposal for a Directive setting ambient air quality limit values for carbon monoxide(CO). The proposal is required by the Council Directive on the Assessment and Managementof Ambient Air Quality (the “Framework Directive”)1. The paper reflects the results ofdiscussions in the Air Quality Steering Group, in which representatives from the MemberStates, Industry and NGO’s assist the European Commission with the development oflegislation on ambient air quality. In contrast to similar position papers written earlier, whichwere written by special working groups, this paper was drafted by a consultant to theEuropean Commission, supported by some members of the Steering Group who contributed tothe paper in special CO meetings.
In 1994 the European Union emitted about 44 Mtonnes of CO into the air. By far the largestsource is road transport, which accounts for two-third of the emissions. The EU emissiontrend in the last years was downward, though not in all Member States.
The highest ambient CO concentrations are found near traffic in cities. As a result of currentand foreseen emission reduction measures for road traffic, a downward trend in concentrationsis observed at many locations, and this trend is expected to continue. The fact that industriallevels are hardly reported suggests that levels near industrial CO sources are not of majorconcern.
����5LVN�DVVHVVPHQW
CO readily reacts with haemoglobin in the human blood and as a result the oxygen-carryingcapacity of the blood is reduced. In order to protect non-smoking, middle-aged, and elderlypopulation groups with documented or latent coronary artery disease from acute ischemicheart attacks, and to protect fetuses of non-smoking pregnant mothers from untoward hypoxiceffects, the World Health Organisation (WHO) recommends that a carboxyhaemoglobin levelof 2.5% should not be exceeded. On this basis the WHO adopted in 1996 four guidelines forthe maximum CO concentrations.
:+2�JXLGHOLQHV�− ����PJ�P������SSP��IRU����PLQXWHV− ���PJ�P��IRU����PLQXWHV− ���PJ�P��IRU���KRXU− ���PJ�P��IRU���KRXUV
1 96/62/EC OJ L 296, 21.11.96 p55

CO position paper - draft version 5.2
4
Of the annual data series for 1989-1995 in the European APIS data base (mainly from stationsnear busy streets) 26% exceeded the 8-hour guideline; some Member States reported thatexceedences of the guidelines were not observed anymore. Fewer exceedences of the otherguidelines occurred. It is not necessary to use all WHO guidelines separately as bases for air quality thresholds. Forthe ambient air quality, the 15- and 30-minutes guidelines give no additional protectioncompared to the 1- and 8-hour guidelines. A few situations have been observed where the 1-hour guideline was exceeded and the 8-hour guideline was not, but the 8-hour guideline isfound to be in practice more protective than the 1-hour guideline. It is proposed to set a limitvalue for CO and base it on the 8-hour guideline. From a practical point of view it is generallypreferable to allow a limited number of exceedences per year. However, in the special case ofCO the levels are expected to decrease far enough to achieve full protection againstexceedence of the WHO guideline. It is proposed to define the limit value as the 8-hour average concentration of 10 mg/m3,which should not be exceeded. It is proposed to set the Margin Of Tolerance at 50% of thelimit value, decreasing linearly to zero in 2005. It is proposed not to set an alert threshold. It is proposed to make up-to-date information on ambient CO levels routinely available to thepublic and appropriate organizations. ����$VVHVVPHQW�RI�FRQFHQWUDWLRQV The assessment aims at: - checking whether the limit value is exceeded anywhere; - supporting air quality management in case of exceedence; - making information available to the public. In view of this, the following concentration parameters should be assessed: - daily maximum 8-hour average in the calendar year; - average over the calendar year. Network design (macro-siting) should be based on explicit goals of station representativenessand should facilitate the reporting of territory-covering statistics of CO concentrations. Threetypes of stations, characterised according to their representativeness, should be considered: - traffic stations; - industrial stations; - urban background stations. In practice, traffic stations are expected to be the most important types. Two types of assessments are allowed: - by measurements alone; - by measurements and supplementary assessment. For the first assessment type, a higher minimum station density is needed than for the secondtype. The assessment requirements also depend on whether the Upper Assessment Level(UAT) and Lower Assessment Threshold (LAT) are exceeded. It is proposed to set UAT andLAT at 70% and 50% of the limit value respectively. Table I proposes minimum densities forstations near diffuse sources in case of assessment by measurements alone.

CO position paper - draft version 5.2
5
Table I 0LQLPXP�QXPEHU�RI�VWDWLRQV�SHU�]RQH�LQ�FDVH�RI�QR�VXSSOHPHQWDU\�DVVHVVPHQW 3RSXODWLRQ�RIDJJORPHUDWLRQ�RU]RQH��PLOOLRQV�
,I�PD[LPXP�FRQFHQWUDWLRQVH[FHHG�8$7
,I�PD[LPXP�FRQFHQWUDWLRQV�DUHEHWZHHQ�8$7�DQG�/$7
<0.25 -0.5 -0.75 -1 -1.5 -2 -2.75 3.75 -4.75 -6 >6
1 2 2 3 4 5 6 7 8 9 10
1 1 1 1 2 2 3 3 4 4 5
If >1, to include at least oneurban background station and onetraffic oriented station
For the assessment of pollution in the vicinity of point sources, the number of samplingstations should be calculated taking into account emission densities, the likely distributionpatterns of ambient air pollution and potential exposure of the population. Micro-siting criteria include the requirement for street stations to measure less than 5 metresfrom the kerbside, but at least 4 metres from the centre of the nearest traffic lane and at least25 metres from the edge of major street junctions. For measuring CO the following reference method is proposed: analysis and calibrationaccording to ISO/DIS 4224: non-dispersive infrared spectrometer (NDIR) method. Assessment by mathematical methods (modelling, interpolation, combinations of models andmeasurements) are important tools to generate a territory-covering description of the COconcentrations, in particular spatial statistics. ����&RVW�LPSOLFDWLRQV A separate study was conducted to identify and estimate costs and benefits of further actionbeyond existing and planned measures needed to meet the limit values for CO. Two possiblelimit values were investigated: 10 mg/m3 as the highest 8-hour mean (proposed) and 10mg/m3 as the second highest mean in any year. These levels were investigated in both urbanbackground and hot-spot locations (the latter including kerb side sites). For 2005 noexceedences were expected for the urban background. Exceedences were estimated to occur athot spots, though in some cities only. The benefit assessment was limited to one type of effectonly, congestive heart failure. The benefits to be gained by reducing emissions to meet thelimit values were less than estimated costs, though of a similar order of magnitude. These results are subject to a high level of uncertainty. Important contributions to theuncertainty arise from inconsistencies in inventories between different countries, a lack ofgood exposure-response relations and the limited scope of the study which did not allow the

CO position paper - draft version 5.2
6
integration of secondary effects of abatement of CO, for example through emission reductionsof other pollutants. ����5HSRUWLQJ�WKH�UHVXOWV It is proposed that not only data of individual measuring stations should be reported, but, inthe case of supplementary assessment, also spatial statistics, in particular the total street-length in exceedence per zone.

CO position paper - draft version 5.2
7
&RQWHQWV
���,1752'8&7,21 �
����%DFNJURXQG �
����&2�LQ�WKH�DLU �
����6RXUFHV�RI�&2 �� 1.3.1 World-wide emissions 10 1.3.2 EU emissions 11
����&2�LQ�DPELHQW�DLU �� 1.4.1 Data at EU level 14 1.4.2 Data at national level 16 1.4.3 Summary of CO levels 18
���5,6.�$66(660(17 ��
����(IIHFWV�DQG�ULVNV �� 2.1.1 Health 20 2.1.2 Environment 21
����:+2�JXLGHOLQHV�IRU�PD[LPXP�FRQFHQWUDWLRQV�RI�&2�LQ�DPELHQW�DLU ��
����:+2�JXLGHOLQHV�YHUVXV�&2�FRQFHQWUDWLRQV ��
����([LVWLQJ�VWDQGDUGV �� 2.4.1 Existing EU standards 23 2.4.2 Standards in Member States 23 2.4.3 Standards in some other countries 24
����7KUHVKROGV�WR�EH�FRQVLGHUHG�DV�VWDUWLQJ�YDOXHV�IRU�(8�VWDQGDUGV �� 2.5.1 Comparison of the protectiveness of the four WHO guideline values 24 2.5.2 Choosing the limit value 28 2.5.3 Further specifications of the limit value 29 2.5.4 Public information on ambient concentrations 30 2.5.5 Alert threshold 30
���$66(660(17�2)�&21&(175$7,216 ��
����,QWURGXFWLRQ ��
����3ULQFLSOHV�DQG�DVVHVVPHQW�UHJLPHV�EDVHG�RQ�WKH�'LUHFWLYH�RQ�$PELHQW�$LU�4XDOLW\�$VVHVVPHQW�DQG0DQDJHPHQW ��
3.2.1 Purpose of the assessment 31 3.2.2 Targets addressed 31 3.2.3 Assessment regimes 31 3.2.4 Assessment in time and space 33 3.2.5 Upper and Lower Assessment Thresholds 34
����0HDVXUHPHQW�VWUDWHJ\ �� 3.3.1 General 36 3.3.2 Network density in the case of no supplementary assessment 37 3.3.3 Network density in the case of supplementary assessment 38 3.3.4 Siting criteria 38

CO position paper - draft version 5.2
8
����0HDVXUHPHQW�PHWKRGV �� 3.4.1 Existing sampling methods 41 3.4.2 Existing measuring methods 41 3.4.3 Existing calibration procedures 42 3.4.4 Reference measurement method 43 3.4.5 Screening techniques 43
����0DWKHPDWLFDO�PHWKRGV ��
����'DWD�TXDOLW\�REMHFWLYHV ��
����4XDOLW\�$VVXUDQFH�DQG�4XDOLW\�&RQWURO�RI�PHDVXUHPHQWV ��
���&267�,03/,&$7,216 ��
���5(3257,1*�7+(�5(68/76 ��
$11(;�$��63(&,$/�$5($6�2)�327(17,$//<�+,*+�&2�&21&(175$7,216 ��

CO position paper - draft version 5.2
9
&2���326,7,21�3$3(5
1. Introduction
1.1 Background The Council Directive on the Assessment and Management of Ambient Air Quality2, the so-called Framework Directive, gives a list of atmospheric pollutants for which the EuropeanCommission shall submit to the Council proposals for the setting of limit values and, asappropriate, alert thresholds in relation to the air quality. The pollutants are listed in Annex Ito the Directive. In 1995 the Commission and Member States established the Air QualitySteering Group, in which the Commission, the Member States and representatives of Industryand Non-Governmental Organisations participated. It started to work on the first fivepollutants sulphur dioxide, nitrogen dioxide, fine particulate matter, suspended particulatematter and lead. Under the responsibility of the Steering Group position papers were drawn upfor each pollutant. The two types of particulate pollutants were dealt with in one positionpaper on particulate matter, and so four position papers were written, which weresubsequently used by the Commission to draw up a proposal for a combined new Directive onthese pollutants (COM (97) 500). In the course of the work on the first Daughter Directive, the preparation of position papersfor the second group of pollutants ozone, benzene and carbon monoxide, commenced. Theposition paper for carbon monoxide (CO) was prepared by a consultant to the Commission onthe basis of information and comments given by the Steering Group. A group of experts onCO assigned by the Steering Group convened twice for detailed discussions. In addition aneconomic analysis was conducted. The current position paper on carbon monoxide only deals with the direct harmful effects ofCO in ambient air, in accordance with the Framework Directive. CO is not only a harmful airpollutant in itself, but also a precursor for other pollutants. In particular it is a precursor forcontinental and global scale ozone and carbon dioxide, which are important greenhouse gases.Ozone also has substantial direct effects on health, vegetation and materials. Pollutantsaffected by CO will be addressed elsewhere.
1.2 CO in the air CO is one of the most common air pollutants. It has no colour, odour or taste, it has a lowreactivity and a low water solubility. It is mainly emitted into the atmosphere as a product ofincomplete combustion. Annually, a large number of individuals die as a result of exposure tovery high indoor CO levels, far above ambient outdoor levels. In Flanders, for example, in1987-1988 about 100 people died, mostly as a result of accidental exposure3. For ambientoutdoor air, CO is one of the “classical” air pollutants, for which many countries have set airquality limit values. At the EU level no air quality threshold exist currently. In terms of absolute concentrations CO is the most prevalent of the toxic air pollutants. Itsconcentrations are expressed in mg/m3, in contrast to all other pollutants, which are measuredin µg/m3 or even smaller units.
2 Council Directive 96/62/EC O.J L 296 21.11.96 p55 3 Life in the big city (in Dutch). G. Magnus, 1995, Gemeenschappelijke Gezondheid, Antwerp.

CO position paper - draft version 5.2
10
Fortunately the risk thresholds are also in the range of mg/m3, which is higher than thresholdsfor other toxic air pollutants of concern. CO is not only directly emitted into the air, but can also be formed by chemical reactions fromorganic air pollutants, such as methane. CO has a residence time in the atmosphere of aboutthree months. At moderate latitudes the time for air to travel around the world is also of theorder of months. Since CO formation from organic air pollutants takes place everywhere inthe atmosphere, a global background level of CO exists, ranging between 0.05 and 0.15 ppmv(0.06 and 0.17 mg/m3)4. At EU latitudes the global background level is at the high end of thisrange.
1.3 Sources of CO
1.3.1 World-wide emissions CO is brought into the atmosphere by two different mechanisms: emission of CO andchemical formation from other pollutants. Table 1 gives an overview of the globalanthropogenic emissions of CO5. From the table it appears that burning of forest, savannahand agricultural waste accounts for half the global CO emissions. The chemical formation ofCO is due to the oxidation of hydrocarbons, and it adds 600 - 1600 Mtonnes to theatmosphere6. Two-third of it stems from methane. It is a slow process, and does not give riseto local peak concentrations. However, being a source of the same magnitude of the directemission, CO formation contributes considerably to the global background level. It isestimated that about one-third of CO results from natural sources, including that derived fromhydrocarbon oxidation.
Table 1 Global anthropogenic emissions of CO by sector in 1990
6HFWRU (PLVVLRQ 0WRQQHV�\HDU � Road transport 206.7 21% Non-road transport 1.7 0.2% Residential 218.9 22%
4 Climate Change 1994, Radiative Forcing of Climate Change and An Evaluation of the IPCC IS92 Emission
Scenarios, Intergovernmental Panel on Climate Change, 1995, University Press, Cambridge. 5 Description of EDGAR Version 2.0, J.G.J. Olivier et al., 1996, RIVM report nr. 771060002, TNO MEP report
nr. R96/119, The Netherlands. 6 Climate change 1994, Radiative Forcing of Climate Change and An Evaluation of the IPCC IS92 Emission
Scenarios, Intergovernmental Panel on Climate Change, 1995, University Press, Cambridge.
&RQYHUVLRQ������.�DQG������N3D��
��SSP� �������PJ�P�
��PJ�P�� �������SSP

CO position paper - draft version 5.2
11
Industry and power generation 51.2 5% Deforestation 111.4 11% Savannah burning 177.0 18% Agricultural waste burning 207.6 21% 7RWDO ����� ����
1.3.2 EU emissions Data on CO emissions in the EU are available in the CORINAIR emissions inventory for19907 and 19948. Table 2 and Figure 1 summarise the emissions by source sector for the EUmember states. By far the largest source is road transport, which accounts for two-thirds of theemissions of the EU. The contribution from traffic is seen to vary considerably between theMember States (from 30 to 89%). Also for other source sectors the relative contributionsdeviate from the EU pattern, H�J� there is no emission from production processes in the UK.Such deviations may reflect the real emission deviations, but it can not be excluded thatdifferences in emission registration method cause part of the discrepancies. Not all sectors in Table 1 and Table 2 can be directly compared, but EU emissions by roadtransport, combustion and production processes are, on a per capita basis, larger than globalemissions by road transport, industry and power generation. Conversely, residentialemissions, deforestation, savannah burning and agricultural waste burning are more importantsources on the global scale. Again, some of the differences may be due to differences inestimation methods. Figure 2 compares the 1994 emissions with those of 1990. The trend in emissions isdownward, though not in all Member States. The emissions in the most important sourcecategory, road transport, have gone down as a result of emission reduction measures, such asInspection and Maintenance and the introduction of the 3-way catalyst, although the effectwas partly offset by the growth of the number of vehicle-kilometres.
7 CORINAIR 90, Comprehensive Summary Report. Final Draft. March 1996. European Topic Centre on Air
Emissions / EEA. 8 CORINAIR 94, Summary Report. Final Draft. 10 April 1997. European Topic Centre on Air Emissions / EEA.

CO position paper - draft version 5.2
12
(8�HPLVVLRQV�E\�VHFWRU
Combustion20%
Production processes
6%
Road transport63%
Other1%
Waste5%
Other mobile5%
Figure 1 EU emission of CO by sector in 1994
Table 2 Emissions of CO in the EU in 1994 (1000 tonnes)9
6RXUFH�FDWHJRU\ &RPEXVWLRQ 3URGXFWLRQSURFHVVHV
5RDG�WUDQVSRUW 2WKHU�PRELOHVRXUFHV�DQGPDFKLQHU\
:DVWH�WUHDWPHQWDQG�GLVSRVDO
2WKHU 7RWDO
Austria 506 293 363 12 4 2 1181
Belgium 132 17 995 2 19 0 1166
Denmark 187 0 413 79 0 37 715
Finland 87 0 311 40 0 0 438
France 2455 623 5236 1013 233 107 9668
Germany 1992 606 3953 243 0 13 6807
Greece 19 25 978 38 0 135 1194
Ireland 65 0 261 6 1 0 333
Italy 704 481 5811 678 1527 30 9231
Luxembourg 85 14 44 3 0 0 145
Netherlands 233 112 523 27 3 37 935
Portugal 433 15 733 14 0 0 1195
Spain 1280 233 2739 113 315 133 4813
Sweden 30 5 1164 110 4 2 1315
United Kingdom 427 0 4315 41 48 47 4879
EU 8636 2423 27839 2418 2156 543 44015
(8 ��� �� ��� �� �� �� ����
9 CORINAIR emission data for 1995 were available at the time of writing, but since emission data were lacking
for some countries the set of 1994 was preferred. Official emission data reported under the UN FrameworkConvention on Climate Change did not contain road transport as a separate sector.

CO position paper - draft version 5.2
13
(PLVVLRQV�LQ������DV�SHUFHQWDJH�RI������HPLVVLRQV
0%
20%
40%
60%
80%
100%
120%A
ustr
ia
Bel
gium
Den
mar
k
Fin
land
Fra
nce
Ger
man
y
Gre
ece
Irel
and
Italy
Luxe
mbo
urg
Net
herla
nds
Por
tuga
l
Spa
in
Sw
eden
Uni
ted
Kin
gdom E
U
Figure 2 Emissions in 1994 as percentage of 1990 emissions
EMEP reports emissions data for a longer time span. The first year for which emissions percountry were given is 1980, but emissions were in many cases estimated by setting theemission equal to the value of the first official submission in a later year. Table 3 gives theEMEP emissions10; in order to bring out any trends it gives data only for years for whichemissions have actually been officially submitted to EMEP. Due to differences in definitionsand calculation methods, including revisions of old data of past years that were applied toonly one of the data bases, there are differences between the EMEP data and the CORINAIRdata, but also here a slightly downward trend in the last years can be noticed. The EMEP dataare not complete enough to allow a calculation of the trend in CO emissions of the EU as awhole.
Table 3 Trend in CO emissions as given by EMEP (1000 tonnes)11
���� ���� ���� ���� ���� ���� ���� Austria 1636 1648 1573 1503 1414 1326 1408 Belgium 1124 1131 1177 1147 Denmark 673 741 770 824 812 732 728 Finland 556 France 9216 8399 10930 10626 10309 9801 Germany 15064 12049 10280 9032 8640 8029 7428 Greece Ireland 429 428 403 416 Italy 6919 10347 Luxembourg 240 171 Netherlands 1356 1059 959 941 917 897 Portugal 1086 1111 1156 1175 1211 Spain 4778 4866 4801 4813 Sweden 1347 1312 1275 1236 United Kingdom 5631 5895 6360 6287 5842 5312 4884
10 Transboundary Air Pollution in Europe. MSC-W Status Report 1996. Part One; Estimated dispersion of
acidifying agents and of near surface ozone. EMP/ MSC-W, Report 1/96, July 1996. 11 See footnote 9.
CO position paper - draft version 5.2
14
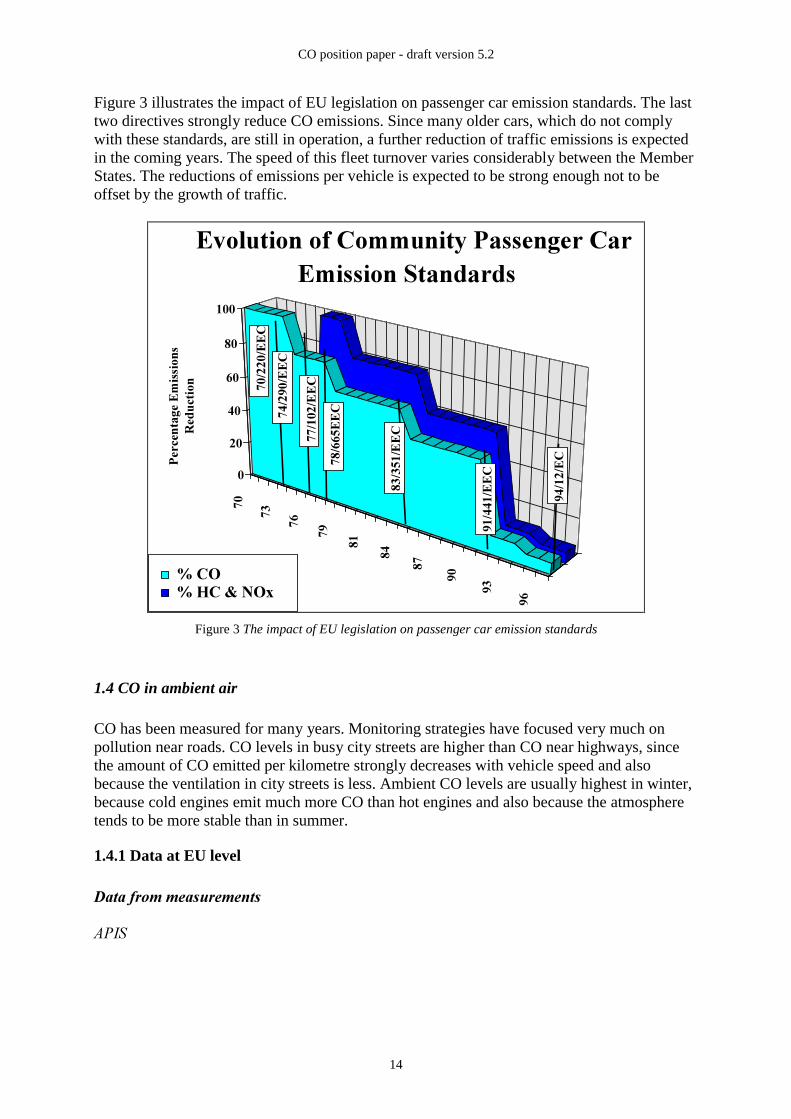
Figure 3 illustrates the impact of EU legislation on passenger car emission standards. The lasttwo directives strongly reduce CO emissions. Since many older cars, which do not complywith these standards, are still in operation, a further reduction of traffic emissions is expectedin the coming years. The speed of this fleet turnover varies considerably between the MemberStates. The reductions of emissions per vehicle is expected to be strong enough not to beoffset by the growth of traffic.
��
��
��
��
��
��
��
��
��
��
% CO% HC & NOx
�
��
��
��
��
���
3HUFHQWDJH�(PLVVLRQ
V�5HG
XFWLRQ
(YROXWLRQ�RI�&RPPXQLW\�3DVVHQJHU�&DU�(PLVVLRQ�6WDQGDUGV
���&2���+&��12[
������
�((&
�������((&
������((&
�������((&
������(&
������
�((&
�������((&
Figure 3 The impact of EU legislation on passenger car emission standards
1.4 CO in ambient air CO has been measured for many years. Monitoring strategies have focused very much onpollution near roads. CO levels in busy city streets are higher than CO near highways, sincethe amount of CO emitted per kilometre strongly decreases with vehicle speed and alsobecause the ventilation in city streets is less. Ambient CO levels are usually highest in winter,because cold engines emit much more CO than hot engines and also because the atmospheretends to be more stable than in summer.
1.4.1 Data at EU level 'DWD�IURP�PHDVXUHPHQWV $3,6

CO position paper - draft version 5.2
15
In the data base APIS12 of the European Commission, 491 annual data series of CO from theEU are present, distributed over the period 1981-1995. For most of the stations represented inAPIS, only a few years are available. Table 4 gives an overview of the levels measured at the stations in the period 1989-1995. Forsome data series a correction factor of 10 has been applied because the original data were notexpressed in the correct unit. For the data series with sufficient data capture (at least 75%valid data), which were almost all from traffic stations, statistics of the annual means, the 1-hour maximum and the 8-hour maximum are presented. From the table it is seen that annualmean levels are on the average 1.5 mg/m3, while the maximum 1-hour and 8-hour means aretypically an order of magnitude higher. The highest values of all data series are roughly afactor five higher than the typical values. Since the composition of the stations changedstrongly over the years, representative trends could not be derived from these data.
Table 4 Annual means and maximum 1-h and 8-h mean CO concentrations in data series of 1989-1995 in APIS(mg/m3)
&2�DLU�TXDOLW\�SDUDPHWHU $YHUDJH�RYHU�DOO�GDWDVHULHV
+LJKHVW�RI�DOO�GDWDVHULHV
Annual mean 1.5 8.4 Maximum 1-hour mean 13.5 64 Maximum 8-hour mean 8.6 44 'REULV Another source of information on CO levels in Europe is the “Dobris” inventory of urban airquality13. In this inventory cities with more than 500 000 inhabitants were asked to provideinformation on air quality monitoring data. For CO, only information on the station thatmonitored the highest concentrations was requested in order to get an impression of urban hotspots. Of the 60 stations for which CO levels were reported, 57 were traffic stations. Theconcentrations reported for the annual mean and the maximum 8-hour mean confirm thegeneral picture found in APIS. Two out of the 60 CO stations are referred to as city background or city stations, in Bremenand Budapest respectively. In Bremen, the annual average concentration is given as 1.2 mg/m3
and the 98-percentile (1/2h) given is, surprisingly, almost equal (1.3 mg/m3). None of the monitoring data from the EU collected in the Dobris inventory refer to industrialstations. Only one station in Budapest was characterised as such. The concentrations arereported for 1992, with an average of 4.0 mg/m3 and a 98-percentile of 24-hour meanconcentrations of 7.1 mg/m3. 'DWD�IURP�$XWR�2LO�, In the European Auto Oil I programme an extensive analysis of the future development of COemissions and concentrations in the EU was undertaken. In the "business as usual" scenario,which assumed that no additional measures would be developed, the urban background levelswere predicted to decrease considerably. For London, where the highest levels werecalculated, a decrease from 1.8 mg/m3 in 1990 to 0.6 mg/m3 in 2010 (annual average,neglecting the rural background) was found. Taking a representative ratio between the annual
12 Later incorporated in the AIRBASE data base. 13 R.J.C.F. Sluyter (ed.), Air Quality in Major European Cities, 1995, RIVM, report nr. 722401004, The
Netherlands; NILU, Norway.

CO position paper - draft version 5.2
16
average and the 8-hour WHO guideline value, the study concluded that the downwardemission trend would bring the urban background levels below the WHO guideline. It was,however, also remarked that if future European air quality standards would be required to bemet at roadside locations, the levels there might require more reductions than assumed in thestudy.
1.4.2 Data at national level Some Member States and the Union of Industrial and Employers’ Confederations of Europe(UNICE) submitted concentration data for this paper. Some expressed the concentrations interms of the parameters that were in use locally to characterise the CO levels, others expressedit in terms of the WHO guidelines that are taken as the basis for the EU limit values for CO(see Section 2.2). $XVWULD In Austria the WHO guideline value of 10 mg/m3 as 8 hour mean has been exceeded at fewsites in 1993 and 1996. The 8-hour mean guideline was found to be much more likely to beexceeded than the 1-hour and half-hour mean guideline values, which were not exceeded inAustria in the period 1990-1997. During the last years, CO concentrations decreasedcontinuously in Austria, except at an industrial site. At this industrial site WHO guidelineswere found to be slightly exceeded in 1996. %HOJLXP The concentrations provided by Belgium, from three traffic stations in 1996, were below theWHO guidelines. )LQODQG Data provided by Finland showed that the WHO guideline of 10 mg/m3 as 8-hour mean wasexceeded at some street stations in the period 1990-1996. Such exceedences occurred duringthis entire period. *HUPDQ\ Germany reported that the CO concentrations in streets with intensive traffic are down to lessthan 2 mg/m3 annual average and less than 5 mg/m3 as 98 percentile of half-hourly means.The German standards of 10 mg/m3 (annual average) and 30 mg/m3 (98 percentile of half-hour means) are met everywhere in Germany. A clear downward trend is visible in Figure 4, which gives the average trend for trafficstations and non-traffic stations in the Rhine-Ruhr area. Since the 98-percentile of half-hourmeans and the annual means go down, the 98-percentile of 8-hour means can be expected toexhibit a downward trend as well.

CO position paper - draft version 5.2
17
7UHQG�LQ�WKH�5XKU�5KLQH�UHJLRQ
0
1
2
3
4
5
6
7
8
9
10
1989
1990
1991
1992
1993
1994
1995
1996
&2�FRQFHQWUDWLRQ��PJ�P
�
Traffic stations, 98 perc. ofhalf-hour means
Traffic stations, annual mean
Non-traffic stations, 98 perc.of half-hour means
Non-traffic stations, annualmean
Figure 4 CO trend observed in the Rhine-Ruhr region.
7KH�1HWKHUODQGV In the Netherlands the limit value of 6 mg/m3 as 98-percentile of running 8-hour means wasnot exceeded at regional or urban background sites, while scarce exceedences were found inbusy streets. In 1996 the highest 8-hour mean measured was 4.7 mg/m3, and the highest 98-percentile of 8-hour means 3.3 mg/m3. A decreasing trend in CO exceedences is reported: theestimated total street length with exceedence of the limit value in the Netherlands was reducedfrom about 50 km at the end of the eighties to around 5 km in 1995. 3RUWXJDO Portugal provided data from 16 stations for 1993 and 1994. Information on the sites was notgiven. Table 5 summarises the data.
Table 5 Concentrations from 16 stations in Portugal (mg/m3)
$QQXDO�PHDQ 0D[��KRXUO\PHDQ
0D[���K�PHDQ 0D[��GDLO\PHDQ
1993 0.16-2.9 7.1-57 2.5-25 1.9-18 1994 0.87-2.9 6.7-45 2.2-43 1.2-38 6ZHGHQ The number of CO measurement sites has been decreased, because CO is not regarded as aproblem anymore. Table 6 gives a summary of the measurement results.

CO position paper - draft version 5.2
18
Table 6 Concentrations in some of the most polluted streets in Stockholm (mg/m3)
<HDU� ��������PRQWKV� ������ZKROH�\HDU� �K�PD[ �K�PD[ ��K�PD[ �K�PD[ ���SHUF
�K 3ROOXWHG�VWUHHWV�LQ�6WRFNKROP
Sveavägen (30 000 veh/day) 10 10 8.9 5.8 4.8 Hornsgatan (40 000 veh/day) 25 15 13 6.8 5.0 8UEDQ�EDFNJURXQG
Göteborg 8.2 5.0 1.6 'DWD�IURP�WXQQHOV In the Mont Blanc tunnel CO concentrations, measured when only private vehicles werepresent, were found to decrease continuously over the period 1970-1996, in spite of trafficgrowth and the reduction of the tunnel ventilation14. Similar patterns were observed in theGubrist tunnel near Zürich15.
1.4.3 Summary of CO levels From the above information the following picture arises. 5XUDO�OHYHOV Although CO is hardly removed from the air during atmospheric transport on the scale of thecontinent, long range transport does not lead to concentrations of concern. Only in the vicinityof sources, where atmospheric dilution is yet rather low, high levels occur. &LW\�EDFNJURXQG�OHYHOV A clear picture of urban background is not found in the above data. Urban background levelsexceeding the WHO guidelines were not observed. It is, however, not certain whether urbanbackground levels, particularly in Southern Member States can reach levels of concern duringconditions of low dispersion. /HYHOV�QHDU�WUDIILF Generally, the highest CO concentrations are reported for streets stations. The WHOguidelines are exceeded in some busy streets, but in many countries the levels are going down.This trend is expected to continue in the years to come. /HYHOV�QHDU�LQGXVWU\ Some industrial processes (particularly coke production) result in high emissions of CO.When these emissions are released through high chimneys the local ambient concentrationswill not increase very much. The fact that only one such location was identified in EUnetworks, suggests that industrial levels do not pose great problems. /HYHOV�QHDU�RWKHU�VRXUFHV
14 Vincenzo Ferro, 1992. Relazione sull’impianto di ventilazione del traforo del Mont Bianco. Studio
Professionale Associato Ingg. Ferro e Cerioni, Turin, Italy. 15 Urs Steinemann, 1995. Verkehrs- und Schadstoffmessungen 1994 im Gubristunnel. Ingenieurbüro für Energie-
und Umweltfragen, report nr. US 89-16-06, Wallerau, Switzerland.

CO position paper - draft version 5.2
19
Ambient CO levels of concern near other sources, H�J� agricultural waste burning, were notreported.

CO position paper - draft version 5.2
20
2. Risk assessment
2.1 Effects and risks
2.1.1 Health The following description of effects and risks is based on the chapter on CO in the Update andRevision of the WHO Air Quality Guidelines for Europe16. CO reacts readily with haemoglobin in the human blood to form carboxyhaemoglobin(COHb). The affinity of haemoglobin for CO is 200-250 times that for oxygen, and as a resultthis binding reduces the oxygen-carrying capacity of the blood and impairs the release ofoxygen to extravascular tissues. The most important variables determining the COHb level areCO in inhaled air, duration of exposure and lung ventilation. During an exposure to a fixedconcentration of CO, the COHb concentration increases rapidly at the onset of exposure, startsto level off after 3 hours, and reaches a steady-state after 6-8 hours of exposure. Physicalexercise accelerates the CO uptake process. The formation of COHb is a reversible process,but because of the tight binding of CO to haemoglobin, the elimination half-life whilebreathing room air is 2-6.5 hours depending on the initial COHb level. The elimination half-life of COHb is much longer in the fetus than in the pregnant mother. The toxic effects of CO become evident in organs and tissues with high oxygen consumptionsuch as the brain, the heart, the exercising skeletal muscle, and the developing fetus. Theeffects of CO exposure at very high concentrations (well above ambient levels) are lethal.High concentrations may cause both reversible, short-lasting neurological deficits and severe,often delayed neurological damage. At COHb levels as low as 5.1-8.2% impaired co-ordination, tracking, driving ability, vigilance and cognitive performance have been observed. In healthy subjects the endogenous production of CO17 results in COHb levels of 0.4-0.7%.During pregnancy, elevated maternal COHb levels of 0.7-2.5% have been reported, which ismainly due to increased endogenous production. The COHb levels in non-smoking generalpopulations are usually 0.5-1.5% due to endogenous production and environmental exposures.Non-smoking people in certain occupations (car drivers, policemen, traffic wardens, garageand tunnel workers, firemen etc.) can have long-term COHb levels up to 5%, and heavycigarette smokers have COHb levels up to 10%. Well-trained subjects engaging in heavyexercise in polluted indoor environments can increase their COHb levels quickly up to 10-20%. In indoor ice arenas, there have been recently reported epidemic CO poisonings. The Commission is required by Article 4.2 of the Air Quality Framework Directive tomaintain awareness of the most recent scientific research data on the effects of pollution and ifnecessary to re-examine the elements on which limit values are based. Such recentinformation and the references are given in the footnotes 18 19 20. 16 Air Quality Guidelines for Europe (1999), 2nd edition, Vol. 1, WHO Regional Publications, Regional Office
for Europe, Copenhagen, in press. 17 The carbon monoxide produced by the body’s own chemical reactions. 18 A recent epidemiological study in Athens (Toulomi et al., 1994) found that changes in CO concentrations
below these concentrations were associated with daily mortality. However, this association was not

CO position paper - draft version 5.2
21
2.1.2 Environment Adverse direct impacts on vegetation by CO at ambient concentrations have not beenreported. As a precursor of carbon dioxide and ozone, CO indirectly contributes to globalwarming and to direct effects by ozone to vegetation and materials.
2.2 WHO guidelines for maximum concentrations of CO in ambient air In order to protect non-smoking, middle-aged, and elderly population groups withdocumented or latent coronary artery disease from acute ischemic heart attacks, and to protectfetuses of non-smoking pregnant mothers from untoward hypoxic effects, the WHOrecommends that a COHb level of 2.5% should not be exceeded. The guideline values (ppm values rounded) and periods of time-weighted average exposuresfor maximum concentrations of CO in ambient air have been determined in such a way thatthe COHb level of 2.5% is not exceeded, even when a normal subject engages in light ormoderate exercise:
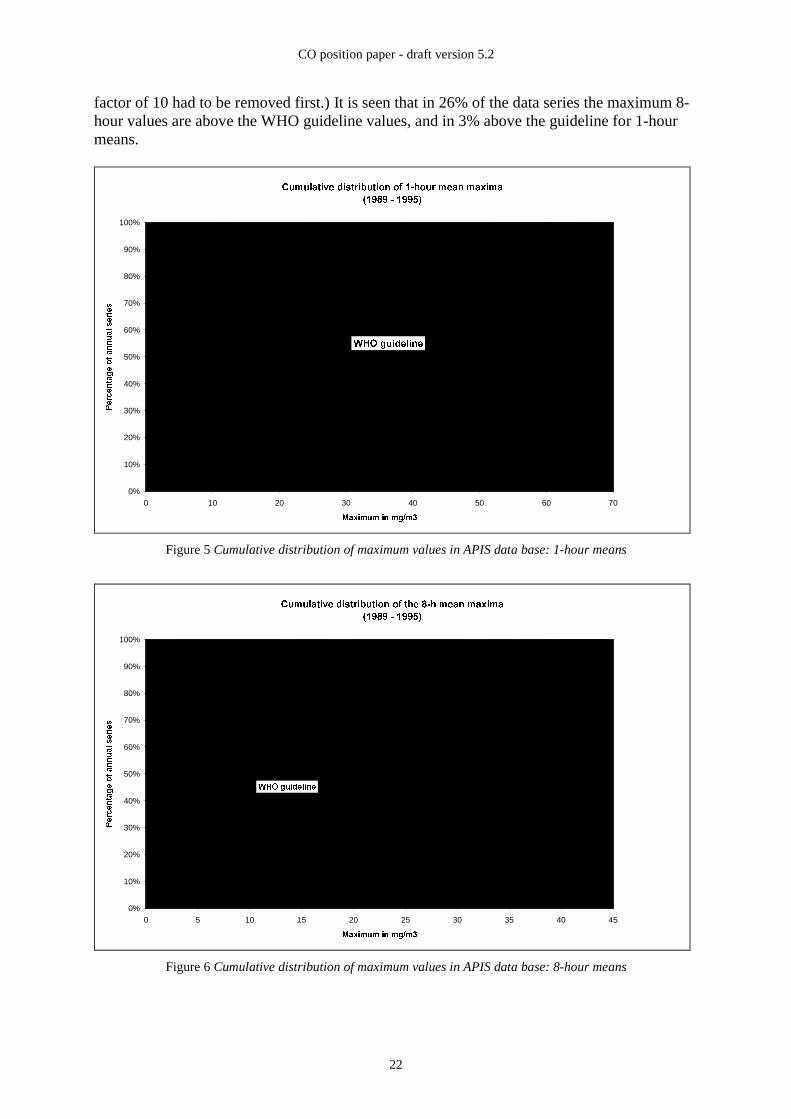
2.3 WHO guidelines versus CO concentrations The EU APIS data base contains both 1-hour mean and 8-hour mean concentrations. 10- and30-minutes values are not available, but since these values are less relevant for setting limitvalues than the other two (see Section 2.6.1), an analysis of these values is not needed. Figure 5 and Figure 6 present the cumulative distribution of the annual maximum values ofthe 1-hour means and the 8-hour means respectively. It represents the 327 CO annual dataseries in the APIS data base over the period 1989-1994. (For some data series an erroneous
significant after adjustment for SO2 and particulate matter. A more recent paper (Poloniecki et al., 1997)implicates CO in heart attacks in London. In the absence of replications these results must be regarded aspreliminary and have not been taken into account in recommendations for limit values.
19 G. Toulomi, S.J. Pocock, K. Katsouyanni and D. Trichopoulos, 1994. Short-term effects of air pollution ondaily mortality in Athens: a time series analysis. Int. J. Epidem., 32:954-967.
20 J.D. Poloniecki, R.W. Atkinson, A. Ponce de Leon and H.R. Anderson, 1997. Daily time series forcardiovascular hospital admissions and previous day’s air pollution in London, UK. Occupational andEnvironmental Medicine, 54:535-540.
:+2�JXLGHOLQHV
����PJ�P������SSP��IRU����PLQXWHV ���PJ�P��IRU����PLQXWHV
���PJ�P��IRU���KRXU ���PJ�P��IRU���KRXUV
CO position paper - draft version 5.2
22
factor of 10 had to be removed first.) It is seen that in 26% of the data series the maximum 8-hour values are above the WHO guideline values, and in 3% above the guideline for 1-hourmeans.
&XPXODWLYH�GLVWULEXWLRQ�RI���KRXU�PHDQ�PD[LPD
�������������
0%
10%
20%
30%
40%
50%
60%
70%
80%
90%
100%
0 10 20 30 40 50 60 70
0D[LPXP�LQ�PJ�P�
3HUFHQWDJH�RI�DQQXDO�VHULHV
:+2�JXLGHOLQH
Figure 5 Cumulative distribution of maximum values in APIS data base: 1-hour means
&XPXODWLYH�GLVWULEXWLRQ�RI�WKH���K�PHDQ�PD[LPD
�������������
0%
10%
20%
30%
40%
50%
60%
70%
80%
90%
100%
0 5 10 15 20 25 30 35 40 45
0D[LPXP�LQ�PJ�P�
3HUFHQWDJH�RI�DQQXDO�VHULHV
:+2�JXLGHOLQH
Figure 6 Cumulative distribution of maximum values in APIS data base: 8-hour means

CO position paper - draft version 5.2
23
In the national data received (Section 1.3.2), exceedences of the guideline for the 1- and 8-hour mean were found in several Member States (Austria, Finland, Portugal). Other MemberStates reported that no exceedences occurred any more. The German data, being expressed as98-percentiles of half-hour means, could not be directly compared with the WHO guidelines.
2.4 Existing standards
2.4.1 Existing EU standards For the European Union there are no existing limit values for CO in ambient air.
2.4.2 Standards in Member States Member States submitted the following information on their existing air quality standards. $XVWULD The air quality standard in Austria is:• 10 mg/m3 as moving 8-hour mean Austria has air quality standards for CO in its Smog Alert Act, defined as moving 3-hourmeans:• 20 mg/m3 for a pre-warning• 30 mg/m3 for warning level I• 40 mg/m3 for warning level II )LQODQG Finland has non-mandatory guidelines for CO:• 20 mg/m3 as maximum 1-hour mean• 8 mg/m3 as maximum 8-hour mean *HUPDQ\ The German air quality standards are:• 10 mg/m3 annual mean• 30 mg/m3 98 percentile based on half-hour means for one year 7KH�1HWKHUODQGV The limit values in the Netherlands are:• 6 mg/m3 98 percentile of 8-hour means• 40 mg/m3 99.9 percentile of 1-hour means Temporarily a less strict limit value applies for certain types of busy streets:• 8.25 mg/m3 98 percentile of 8-hour means until 1-1-2000 3RUWXJDO The Portuguese air quality thresholds are: /LPLW�YDOXHV• 40 mg/m3 1-hour mean, one exceedence allowed

CO position paper - draft version 5.2
24
• 10 mg/m3 8-hour mean (running means) *XLGH�YDOXH• 1 mg/m3 24-hour mean 6ZHGHQ The Swedish national air quality standard is:• 6 mg/m3 98 percentile of 8-hour running means in winter half year as target value
8QLWHG�.LQJGRPThe UK adopted an air quality target of 10 ppm (11.4 mg/m3) as the maximum of running 8-hour means, to be achieved by 2005.
2.4.3 Standards in some other countries
86$The USA National Ambient Air Quality Standard for CO is 9 ppm (10.3 mg/m3) as 8-hournon-overlapping average not to be exceeded more than once per year.
-DSDQThe air quality standards of Japan set a limit of 10 ppm (11.4 mg/m3) to the average dailyconcentration and a limit of 20 ppm (22.8 mg/m3) to the 8-hour mean concentration.
2.5 Thresholds to be considered as starting values for EU standards
In this paragraph proposals for the thresholds will be made on the basis of health criteria andpractical considerations regarding administrative and monitoring feasibility. Economic aspectswill be dealt with in Chapter 4, and may be a reason to reconsider the proposals later. Thissection first selects the most significant threshold(s) from the set of WHO guidelines, thenproceeds to the definition of a corresponding limit value and finally discusses publicinformation, including the possibility of an alert threshold.
2.5.1 Comparison of the protectiveness of the four WHO guideline values
The WHO recommends four concentration levels as guidelines, each with its own averagingtime, aimed at preventing the COHb level in blood to exceed 2.5%. An important question iswhether all four levels should be taken as starting points for limit values. If one of theguideline levels is in practice never exceeded without any of the others being also violated,there is no reason to use it as a limit value. Including unnecessary limit values would increasethe amount of work to be done by Member States without increasing the protection for humanhealth.
���PJ�P��IRU����PLQXWHVWhen comparing the protectiveness of the guideline for the 30-minutes average to that forhourly averages it is easy to see that it is less protective: if the 30-minutes averagedconcentration is above the guideline of 60 mg/m3, the 1-hour concentration mustmathematically be above the guideline value of 30 mg/m3. Consequently the 30-minutesguideline is not useful as a basis for the limit value.
����PJ�P��IRU����PLQXWHV

CO position paper - draft version 5.2
25
To exceed the 15-minutes guideline of 100 mg/m3 without exceeding the hourly averageguideline, would require that during the remaining 45 minutes in the same hour the averageconcentration would be less than 7 mg/m3. This seems unlikely in normal situations. Inexceptional cases it can be imagined that a short peak, H�J� during a few minutes, in anotherwise clean situation would bring the 15-minutes average between 100 and 120 mg/m3,which would leave the hourly concentration just below 30 mg/m3. However, if the 15-minutesaverage would be above 120 mg/m3, the hourly average guideline would be also be exceeded.So, in practice the hourly guideline is expected to be virtually always more or equallyprotective compared with the 15-minutes guideline.
In addition to the improbability of situations where the 15-minutes guideline would be moreprotective than the 1-hour one, the compliance of a 15-minutes limit value would beextremely difficult to assess. From the measuring point of view, many stations would beneeded to cover the exceptional cases mentioned above, and the larger amount of data to behandled could pose logistic problems. From the modelling point of view, meteorological oremission data on a 15-minutes basis are not available.
Consequently, it is proposed not to fix a threshold on a 15-minutes basis.
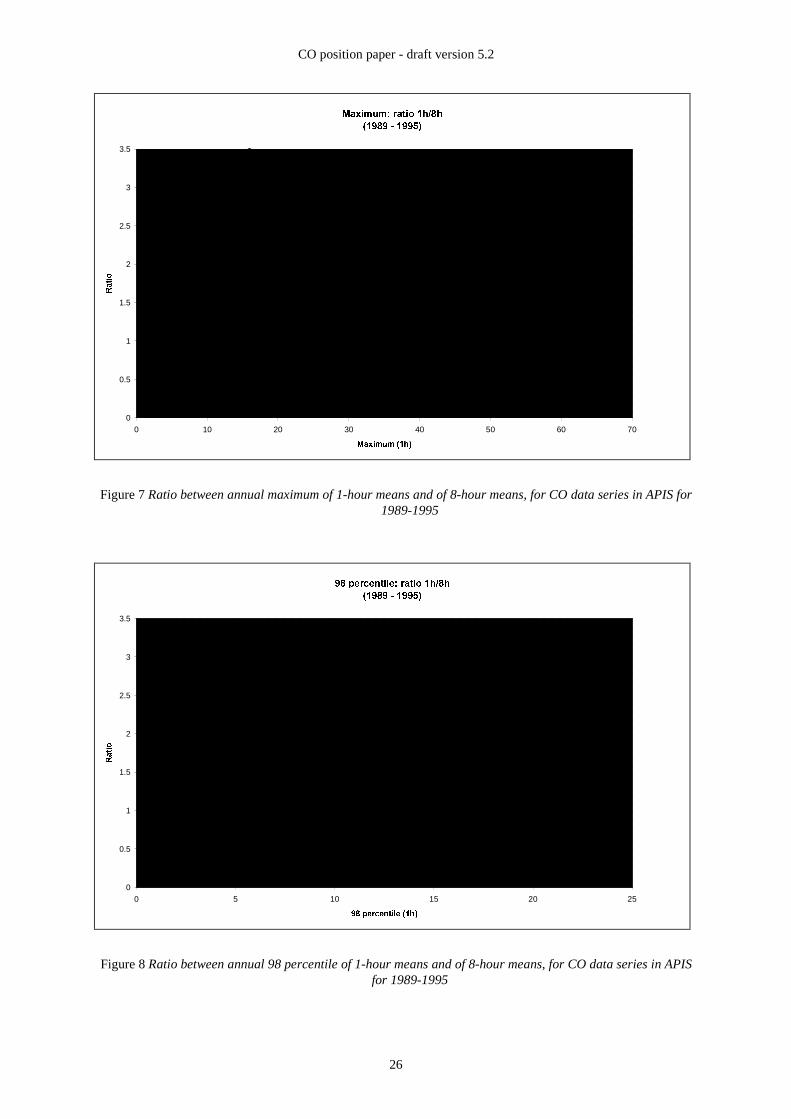
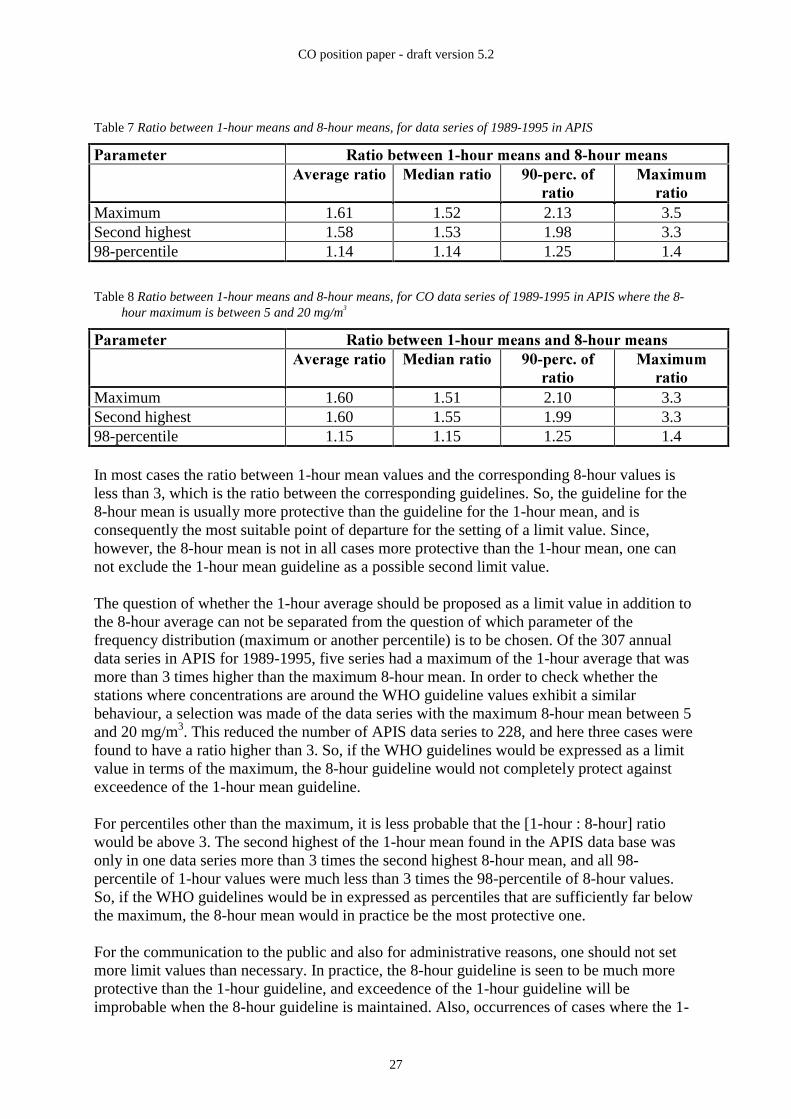
���PJ�P��IRU���KRXU�DQG����PJ�P��IRU���KRXUVIt is not D�SULRUL clear which of the two remaining guidelines is the most protective one.Mathematically, 30 mg/m3 during an hour in combination with 7 hours at the backgroundlevel of 0.2 mg/m3 would yield an 8-hour average of 4 mg/m3, which is well below the 8-hourguideline of 10 mg/m3. Conversely, it is clear that mathematically the 8-hour average of 10mg/m3 can be exceeded without violation of the hourly average of 30 mg/m3. Empiricalinformation is needed to compare the protectiveness of the two guidelines. Table 7 and Table8 give the results of an analysis of all yearly data series in the APIS data base in 1989-1995,for the maximum, the second highest and for the 98-percentile. Figure 7 and Figure 8 illustratethis for the maximum and the 98-percentile. (It is remarked that the non-random fine-structurein the pattern of data points in Figure 8 is due to rounding off in the concentration values.)
CO position paper - draft version 5.2
26
0D[LPXP��UDWLR��K��K
�������������
0
0.5
1
1.5
2
2.5
3
3.5
0 10 20 30 40 50 60 70
0D[LPXP���K�
5DWLR
Figure 7 Ratio between annual maximum of 1-hour means and of 8-hour means, for CO data series in APIS for1989-1995
���SHUFHQWLOH��UDWLR��K��K
�������������
0
0.5
1
1.5
2
2.5
3
3.5
0 5 10 15 20 25
���SHUFHQWLOH���K�
5DWLR
Figure 8 Ratio between annual 98 percentile of 1-hour means and of 8-hour means, for CO data series in APISfor 1989-1995
CO position paper - draft version 5.2
27
Table 7 Ratio between 1-hour means and 8-hour means, for data series of 1989-1995 in APIS
3DUDPHWHU 5DWLR�EHWZHHQ���KRXU�PHDQV�DQG���KRXU�PHDQV$YHUDJH�UDWLR 0HGLDQ�UDWLR ���SHUF��RI
UDWLR0D[LPXP
UDWLRMaximum 1.61 1.52 2.13 3.5Second highest 1.58 1.53 1.98 3.398-percentile 1.14 1.14 1.25 1.4
Table 8 Ratio between 1-hour means and 8-hour means, for CO data series of 1989-1995 in APIS where the 8-hour maximum is between 5 and 20 mg/m3
3DUDPHWHU 5DWLR�EHWZHHQ���KRXU�PHDQV�DQG���KRXU�PHDQV$YHUDJH�UDWLR 0HGLDQ�UDWLR ���SHUF��RI
UDWLR0D[LPXP
UDWLRMaximum 1.60 1.51 2.10 3.3Second highest 1.60 1.55 1.99 3.398-percentile 1.15 1.15 1.25 1.4
In most cases the ratio between 1-hour mean values and the corresponding 8-hour values isless than 3, which is the ratio between the corresponding guidelines. So, the guideline for the8-hour mean is usually more protective than the guideline for the 1-hour mean, and isconsequently the most suitable point of departure for the setting of a limit value. Since,however, the 8-hour mean is not in all cases more protective than the 1-hour mean, one cannot exclude the 1-hour mean guideline as a possible second limit value.
The question of whether the 1-hour average should be proposed as a limit value in addition tothe 8-hour average can not be separated from the question of which parameter of thefrequency distribution (maximum or another percentile) is to be chosen. Of the 307 annualdata series in APIS for 1989-1995, five series had a maximum of the 1-hour average that wasmore than 3 times higher than the maximum 8-hour mean. In order to check whether thestations where concentrations are around the WHO guideline values exhibit a similarbehaviour, a selection was made of the data series with the maximum 8-hour mean between 5and 20 mg/m3. This reduced the number of APIS data series to 228, and here three cases werefound to have a ratio higher than 3. So, if the WHO guidelines would be expressed as a limitvalue in terms of the maximum, the 8-hour guideline would not completely protect againstexceedence of the 1-hour mean guideline.
For percentiles other than the maximum, it is less probable that the [1-hour : 8-hour] ratiowould be above 3. The second highest of the 1-hour mean found in the APIS data base wasonly in one data series more than 3 times the second highest 8-hour mean, and all 98-percentile of 1-hour values were much less than 3 times the 98-percentile of 8-hour values.So, if the WHO guidelines would be in expressed as percentiles that are sufficiently far belowthe maximum, the 8-hour mean would in practice be the most protective one.
For the communication to the public and also for administrative reasons, one should not setmore limit values than necessary. In practice, the 8-hour guideline is seen to be much moreprotective than the 1-hour guideline, and exceedence of the 1-hour guideline will beimprobable when the 8-hour guideline is maintained. Also, occurrences of cases where the 1-
CO position paper - draft version 5.2
28
hour exceeds the WHO guideline while the 8-hour averages does not, are difficult to coverwith a fixed monitoring network or to calculate by modelling.
Logistically, there is no clear preference for a 1-hour or 8-hour average: CO measuring dataare always available as hourly averages, and it is easy to calculate 8-hour averages fromhourly averages.
6LQFH�WKH���KRXU�DYHUDJH�JXLGHOLQH�LV�QRUPDOO\�WKH�PRVW�SURWHFWLYH��LW�LV�SURSRVHG�WR�WDNHWKLV�YDOXH�DV�WKH�VWDUWLQJ�YDOXH�IRU�WKH�OLPLW�YDOXH�
It should be noted that short-term exposure to high concentrations of CO can occur insituations which would not normally be regarded as ambient air as defined in the Air QualityFramework Directive. This is discussed in Annex I to this paper.
2.5.2 Choosing the limit value
1XPEHU�RI�H[FHHGHQFHV�WR�EH�DOORZHGWhen defining a limit value, one should consider whether exceedences should be allowed ornot. For the general public a limit value expressed as a level that is allowed to be exceededseveral times is more difficult to understand than a maximum allowed value. Also, amaximum allowed value can be chosen as a direct equivalent of the WHO guideline.
On the other hand, there are strong arguments against expressing the limit value as themaximum. Of all statistical parameters, the maximum concentration is the most variableone. This would mean that a zone may, from year to year, fluctuate in and out compliancewith the limit value. Since this variation is often mainly due to meteorological conditions,the compliance state would have a large variation that can not be influenced by air qualitymanagement. From the administrative point of view one should attempt to minimise suchfluctuations. A second reason often given for not choosing the maximum, is that themaximum concentration can not be assessed very reliably. Models can not calculate themaximum concentration accurately. Measuring the maximum reliably may be difficult dueto instrumental malfunction or to interruptions for maintenance and calibration. Anomalousmaximum values may also occur as a result of unrepresentative sampling during a smallperiod, H�J� because of a very incidental source such as the exhaust of an incorrectly placedtruck during a short time. It was however agreed by the Steering Group during discussionson sulphur dioxide, nitrogen dioxide, particulate matter and lead that problems of thissecond type should be dealt with by good quality control regimes rather than by increasingnumbers of allowed exceedences.
If a certain number of exceedences would be allowed, exceedence of the WHO guidelinewould also be allowed to occur, unless the limit value is set so far below the WHO guidelinethat exceedence of it would be highly improbable. The frequency distribution of the highestconcentrations varies not only between stations, but also from year to year. Consequently,selecting a very low limit value for this reason, would result in a limit value that is overlystringent in most situations.
In view of these considerations, the Steering Group proposed to allow exceedences for thevarious limit values of the pollutants mentioned above. In the special case of CO, however,the Steering Group felt that the situation is different. Road traffic is almost the sole cause ofexceedence of the WHO guideline. Since the EU-wide measures will cause large reduction of
CO position paper - draft version 5.2
29
CO traffic emissions in all Member States, the Steering Group expected that in the next fewyears the exceedence of the WHO guideline will disappear altogether. The disadvantages of alimit value defined in terms of a maximum not to be exceeded were considered less importantthan the merit of directly implementing the WHO guideline.
,W�LV�SURSRVHG�WR�VHW�WKH�OLPLW�YDOXH�DV�WKH���KRXU�DYHUDJH�FRQFHQWUDWLRQ�RI����PJ�P��ZKLFKLV�QRW�WR�EH�H[FHHGHG�
2.5.3 Further specifications of the limit value
6SDWLDO�VSHFLILFDWLRQ�RI�WKH�OLPLW�YDOXHThe Framework Directive not only designates measurements, but also mathematical methodssuch as computer models as assessment tools. Since models have more potential thanmeasurements to assess the concentration distribution in space, it is better to describe thespatial aspects of the limit values not in terms of measurement strategy, as is usually done, butalso at the level of the definition of the limit value.
The limit value should apply to concentrations at heights between 1.5 and 4 metres at alllocations in the EU territory that are accessible to the public.
In the assessment of small-scale peaks by measurement or modelling, peaks of very small sizeshould not be taken into account in the comparison with the limit value. The exposure timeneeded for the health effect to build up is an important criterion for choosing this minimumsize. The limit value is proposed to be an 8-hour average concentration, but one should realisethat this value has been chosen with the intention to protect against exceedence of all WHOguidelines for CO in ambient outdoor air, including the one for 15 minutes. Since for COpeaks roads are of main importance, the micro-scale specification will be explicitly related totraffic situations, in particular busy streets. As a guideline, a sampling point should be sited tobe representative of air quality in a surrounding area of no less than 200 m2 at trafficorientated sites. Near road traffic, concentrations to be compared with the limit value shouldbe at places at least 25 metres from the edge of major street junctions and at least 4 metresfrom the centre of the nearest traffic lane. The concentrations to be assessed should also be nofurther than 5 metres from the kerbside.
In publicly accessible pedestrian areas in confined spaces, such as tunnels and traffic parkinggarages, good air quality should be maintained. As a result of high traffic emissions incombination with limited ventilation, CO concentrations can be very high, and it is veryimportant that measures are taken to protect the public against high exposure. Annex Adiscusses this matter in more detail. It is not proposed to achieve health protection in suchareas by applying the limit value for ambient air quality there directly. It can be regulatedmore appropriately by ventilation regulations. It is remarked that a similar situation exist forother traffic related pollutants such as NO2 and particulate matter.
0DUJLQ�RI�WROHUDQFHThe Framework Directive allows to set a margin of tolerance, in order to avoid that MemberStates need to report actions plans for zones where limit value exceedences are likely todisappear within a few years. This is particularly relevant in the case of CO, since levels nearroads are generally expected to decrease as a result of the gradual replacement of the currentcar fleet by cleaner vehicles (see also Chapter 1).

CO position paper - draft version 5.2
30
,W�LV�SURSRVHG�WR�VHW�WKH�0DUJLQ�RI�7ROHUDQFH�DW�����RI�WKH�OLPLW�YDOXH�DQG�WR�GHFUHDVH�LWOLQHDUO\�WR�]HUR�LQ������
2.5.4 Public information on ambient concentrations
In its proposal for a Council Directive relating to limit values for sulphur dioxide, oxides ofnitrogen, particulate matter and lead (COM (97) 500) the Commission has included aprovision which would require Member States to make up-to-date information on thesepollutants routinely available to the public as well as appropriate organizations such asenvironmental and consumer organisations, organizations representing the interests ofsensitive populations and other pertinent health care bodies. This information could beprovided by means, for example, of broadcast media, press, information screens or computernetwork services. It is proposed to apply this important provision also to CO. The informationon ambient concentrations of CO should be updated on at least a daily basis, and whereverpracticable, on an hourly basis. The information should include any exceedences of the limitvalue. It should provide a short assessment in relation to the limit value and informationregarding effects on health.
2.5.5 Alert threshold
The Framework Directive opens the possibility to establish also an alert value, to immediatelyinform the population in case of short-term high concentrations. In the case of SO2 and NO2 itwas decided to set such an alert value. Since CO has also short-term effects, this approachcould be followed here as well. If the reasoning used for SO2 and NO2 would be followed, analert value of 100 mg/m3 would be found for CO. This level is so high that even in the recentpast it was unlikely to be exceeded anywhere in outdoor ambient air. After implementation ofthe CO Directive, when the downward trend of CO levels will have proceeded further, thisvalue would have no practical meaning. A second consideration to take into account is that analert would be issued via the media and consequently a considerable size of people should beaffected to justify alerts. Although high CO levels could under adverse meteorologicalconditions occur simultaneously in several highly trafficked streets in a large area, the highCO levels would still often be of a local character. In the case of CO, it does not seem feasibleto inform the public with the purpose to take protective action, because it would be verydifficult to address the information to the public exposed in the particular streets, withoutusing a prediction system. So, adding CO to the list of Alert Values is felt to have moreimportant drawbacks than merits. ,W�LV�WKHUHIRUH�SURSRVHG�QRW�WR�VHW�DQ�DOHUW�YDOXH.

CO position paper - draft version 5.2
31
3. Assessment of concentrations
3.1 Introduction
The Framework Directive gives general criteria and prescriptions on the air qualityassessment, which have to be detailed for each pollutant in the Daughter Directive concerned.The concentrations must be assessed over the whole area of the Member States. Prior to theentry into force of the Directive, a preliminary analysis has to be made to determine theconcentration distributions over the territories in order to enable the Member States to define,before the Directive enters into force, appropriate monitoring networks and other assessmenttechniques.
The use of several assessment techniques will be possible, subject to minimum requirementsregarding the number of measuring points, the type of measuring techniques and mathematicaltechniques; these requirements depend on the ratio between the concentration and the limitvalue.
3.2 Principles and assessment regimes based on the Directive on Ambient Air QualityAssessment and Management
3.2.1 Purpose of the assessment
In the Framework Directive the following aims of air quality assessment are addressed:1. checking whether the limit value is exceeded anywhere over the territory of MemberStates;2. supporting the management of air quality where the limit value is exceeded;3. making adequate information available to the public.
3.2.2 Targets addressed
In principle, human health, ecosystems and also materials are targets to be protected under theFramework Directive. In the case of CO, however, the air quality assessment needs only torefer to the human health. Assessment of CO in relation to the effect on ozone formation orother indirect effects of CO is outside the scope of the CO Daughter Directive.
3.2.3 Assessment regimes
Article 6 of the Framework Directive gives prescriptions regarding the assessment methods tobe applied. It stipulates that in "agglomerations" (zones which have a special status in theFramework Directive) measurements are always mandatory if an alert value has been set, andfurther it links assessment regimes to two threshold levels below the limit value which serveas criteria to distinguish between these regimes. These two assessment thresholds will be

CO position paper - draft version 5.2
32
described hereafter as Upper Assessment Threshold (UAT) and Lower Assessment Threshold(LAT), at x% and y% of the limit value respectively (see Figure 9).
Margin ofTolerance
Figure 9 Principle of the limit value: UAT (x%) and LAT (y%); margin of tolerance
Both the compliance state and the assessment regime are linked to entire zones. It is importantto note that exceedence of the limit value determines whether the air quality within a zone isin compliance or not, and does not differentiate between the assessment regimes prescribedfor that zone. Conversely, exceedence of the UAT or LAT determines which assessmentregime is prescribed in the zone, while it has no implications for air quality management.Figure 10 illustrates this.
/HYHO
/9
8$7��[��
/$7��\��
&RPSOLDQFH $VVHVVPHQW
non-compliance
compliance
regime 1
regime 2
regime 3
/9
8$7��[��
/$7��\��
Figure 10 Implication of exceedence of the limit value, UAT and LAT for compliance judgement and assessmentrequirements in a zone
CO position paper - draft version 5.2
33
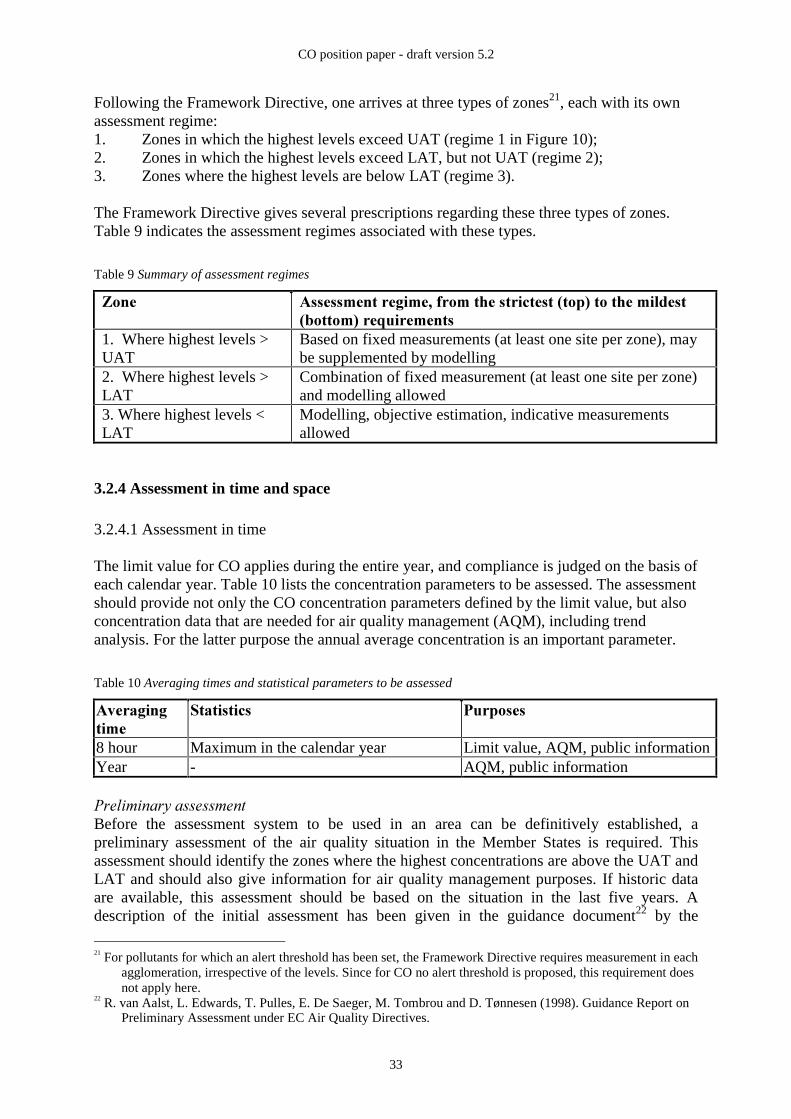
Following the Framework Directive, one arrives at three types of zones21, each with its ownassessment regime:1. Zones in which the highest levels exceed UAT (regime 1 in Figure 10);2. Zones in which the highest levels exceed LAT, but not UAT (regime 2);3. Zones where the highest levels are below LAT (regime 3).
The Framework Directive gives several prescriptions regarding these three types of zones.Table 9 indicates the assessment regimes associated with these types.
Table 9 Summary of assessment regimes
=RQH $VVHVVPHQW�UHJLPH��IURP�WKH�VWULFWHVW��WRS��WR�WKH�PLOGHVW�ERWWRP��UHTXLUHPHQWV
1. Where highest levels >UAT
Based on fixed measurements (at least one site per zone), maybe supplemented by modelling
2. Where highest levels >LAT
Combination of fixed measurement (at least one site per zone)and modelling allowed
3. Where highest levels <LAT
Modelling, objective estimation, indicative measurementsallowed
3.2.4 Assessment in time and space
3.2.4.1 Assessment in time
The limit value for CO applies during the entire year, and compliance is judged on the basis ofeach calendar year. Table 10 lists the concentration parameters to be assessed. The assessmentshould provide not only the CO concentration parameters defined by the limit value, but alsoconcentration data that are needed for air quality management (AQM), including trendanalysis. For the latter purpose the annual average concentration is an important parameter.
Table 10 Averaging times and statistical parameters to be assessed
$YHUDJLQJWLPH
6WDWLVWLFV 3XUSRVHV
8 hour Maximum in the calendar year Limit value, AQM, public informationYear - AQM, public information
3UHOLPLQDU\�DVVHVVPHQWBefore the assessment system to be used in an area can be definitively established, apreliminary assessment of the air quality situation in the Member States is required. Thisassessment should identify the zones where the highest concentrations are above the UAT andLAT and should also give information for air quality management purposes. If historic dataare available, this assessment should be based on the situation in the last five years. Adescription of the initial assessment has been given in the guidance document22 by the
21 For pollutants for which an alert threshold has been set, the Framework Directive requires measurement in each
agglomeration, irrespective of the levels. Since for CO no alert threshold is proposed, this requirement doesnot apply here.
22 R. van Aalst, L. Edwards, T. Pulles, E. De Saeger, M. Tombrou and D. Tønnesen (1998). Guidance Report onPreliminary Assessment under EC Air Quality Directives.

CO position paper - draft version 5.2
34
EEA/TCAP and the European Commission (JRC and DGXI) with the assistance of MemberStates.
5HYLVLRQV�RI�WKH�DVVHVVPHQW�UHJLPHWhen the assessment regime needed in a certain area has been determined on the basis of thepreliminary assessment, the assessment system will be set up. However, the assessmentregime, which depends on whether the limit values are in danger of being exceeded, maychange due to long-term trends in the concentrations. A period of one year would be too shortto judge this, since exceedence rates fluctuate due to annual meteorological variations.Consequently, in zones where the highest levels are normally somewhat below the limit value,these levels may fluctuate to values above it in an unfavourable year. The introduction of theUpper Assessment Threshold attempts to avoid that in situations where the limit values are indanger to be exceeded, less stringent assessment requirements would enter into force after ayear when no exceedences happened to occur. If the assessment regime would yearly be fixedby exceedences of UAT in the previous year, it would also fluctuate from year to year. Toavoid the assessment requirements to change yearly, a period of five years for revision of theassessment regime is proposed. The assessment regime could be based on the median value ofthe five annual exceedence rates of the UAT: if three or more years were in exceedence theassessment regime will be based on exceedence, if only less than three years were inexceedence the assessment regime will be based on no exceedence.The same applies to assessment regimes based on exceedence of LAT. The numerical valuesfor the UAT and LAT will be proposed in Section 3.2.5.In case the levels undergo a rapid and structural change, H�J� due to the introduction ofimportant sources, an additional half-term assessment is needed to determine whether theassessment system should be adapted to the new assessment needs.
7HPSRUDU\�0DUJLQ�RI�7ROHUDQFHFor CO a Margin of Tolerance was introduced in Chapter 2. It is important to note that theassessment regimes are not linked to the Margin of Tolerance (see also Figure 9), so theMargin of Tolerance will not affect the assessment procedures.
7UHQGVFor trend analysis purposes it is important that stations remain in operation for a long period.
3.2.4.2 Assessment in space
Each Member State must divide its territory into zones and specify the borders of each zone.In the directive on CO this is not to be limited, but possibilities for a common approach maybe explored while developing general guidance on the implementation of the DaughterDirectives in the near future. A question to be discussed could be whether a single zone maycontain several non-contiguous built-up areas that are smaller than agglomerations within it.
The assessment should be carried out in accordance with the definition of the limit value asdescribed in Section 2.5. Since the limit value applies everywhere in ambient air, the COconcentrations have to be assessed everywhere. The assessment should take into account thatvery small-scale peaks are not to be tested against the limit value.
3.2.5 Upper and Lower Assessment Thresholds

CO position paper - draft version 5.2
35
���������8SSHU�$VVHVVPHQW�7KUHVKROG
The UAT will be chosen on the basis of the interannual variation of the concentrations. If inthree out of five years (see Section 3.2.4) the concentrations are above the UAT, the moststringent assessment regime applies. If these concentrations are below the UAT, theFramework Directive relaxes the obligations regarding the assessment system somewhat. Theaccuracy of this less stringent assessment methodology should be sufficient to make itreasonably certain that the concentrations found near the UAT will in reality not be above thelimit value.
The numerical value of the UAT is derived from empirical data on the interannual variabilityof the concentrations. Although many data series exist to investigate this, a problem is that noinformation on industrial sites exists. In general, it can be expected that the maximumconcentrations around point sources fluctuate from year to year more widely than maximumvalues near roads. Since no data on industrial sites are available, and also because it is unclearwhether exceedences should be expected at such locations, the value of the UAT will be basedon the traffic data.
An analysis of the interannual fluctuations for the APIS data series covering the entire periodof 1989-1995 was carried out. It was found to comprise 12 stations with at least five years ofdata, which were located in Greece, the Netherlands and the UK. Table 11 presents thenormalised standard deviation for the highest 8-hour mean per year. The interannual variationitself also fluctuates between the stations, which is illustrated by the two last columns.
Table 11 Normalised standard deviation of daily maximum 8-hour averaged CO concentration for the 12complete data series in APIS for 1989-1995
$YHUDJH /RZHVW +LJKHVWMaximum 8-h mean 30% 16% 60%
The analysis indicates that the standard deviation is typically 30%. In a separate analysis of 40Austrian sites a value of 25% was found. If the 95% confidence range for not exceeding thelimit value is chosen as the criterion for the UAT, the limit value should be above the UAT bytwice the standard deviation:
/LPLW�9DOXH� �8$7� �����������[������
From this the value for UAT is calculated at 63% of the limit value. The percentage foundfrom the Austrian set is somewhat higher, on the other hand some individual stations willhave a larger interannual variability than the average value, including stations near CO pointsources. A further pragmatic consideration is that the assessment regimes mentioned in theFramework Directive are to be set at the time of the implementation of the DaughterDirective, so already before the year 2005, the first year in which the limit value is to be met.Since CO levels are generally going down, this would mean for some zones that although thelevels will be expected to be below the UAT by 2005, they are not yet at the time ofimplementation of the directive. So stations will have to be put up, even though they will notbe needed anymore in 2005. Because of this the Steering Group preferred to round thepercentage upwards in setting UAT to 70% of the limit value.
,W�LV�SURSRVHG�WR�VHW�WKH�8SSHU�$VVHVVPHQW�7KUHVKROG�DW�����RI�WKH�OLPLW�YDOXH�

CO position paper - draft version 5.2
36
���������/RZHU�$VVHVVPHQW�7KUHVKROG
The Framework Directive allows to use the mildest assessment regime when theconcentrations are sufficiently far below the limit values, L�H� below the Lower AssessmentThreshold (LAT). Taking the approach to base LAT on three times the standard deviation, asused earlier in the position paper for particulate matter, LAT can be calculated according to:
/LPLW�9DOXH� �/$7� �����������[������
which results in a value of LAT of 57% of the limit value. Rounding this value upwardswould result in a LAT only 10% below UAT. It was however considered prudent to besomewhat more conservative in delineating the mildest assessment regime, so the calculatedvalue is rounded down in the case of LAT.
,W�LV�SURSRVHG�WR�VHW�WKH�/RZHU�$VVHVVPHQW�7KUHVKROG�DW�����WKH�OLPLW�YDOXH�
3.3 Measurement strategy
3.3.1 General
7KHRU\�YHUVXV�SUDFWLFHBefore specifying the measuring strategy for CO, it is remarked that the design of monitoringnetwork is in practice always a compromise of theoretical considerations and practicalrestrictions. The assessment criteria given here should be approached as much as is reasonablypossible. This holds especially true for multi-pollutant stations in urban areas. Theprescriptions should, where possible, be harmonised with those of other Daughter Directivepollutants and possibilities to measure several pollutants at one station should be promoted.
0HDVXUHPHQWV�DORQH�DUH�LQVXIILFLHQW�IRU�DVVHVVPHQW�DQG�DLU�TXDOLW\�PDQDJHPHQWThe Framework Directive gives certain prescriptions concerning the measurement strategy(see Section 3.2). Even a dense measuring network can not give a complete picture of theconcentrations in a zone, since it does not measure everywhere. At least there should be, inaddition to the measurements, an interpretation of the measurement results. So, a meaningfulmeasurement strategy can not be defined without considering how the measurement resultswill be complemented with some sort of additional assessment (see also Section 3.5).
5HODWLRQ�ZLWK�³RWKHU�DVVHVVPHQW�PHWKRGV�The Framework Directive stipulates that the air quality in Member States should be assessedon the basis of common methods and criteria. For the EU as a whole it would be desirable toimplement a sophisticated combination of measuring and other assessment methods in allMember States. However, the methodology of combining measurements and other assessmentmethods is still in development and far from completion. The practice and the experience inthe various Member States are very different. Because of this, two assessment methods ofdifferent sophistication are proposed to be allowed:1. an assessment essentially based on measurements alone,2. an assessment based on measurements and supplementary assessment.The first method is the purely measurement-based approach that has been employed in manynetworks, but which provides no basis to estimate concentrations at locations where no station

CO position paper - draft version 5.2
37
is present. Consequently, a relatively large number of stations is required to give a satisfactorypicture of the concentration distribution in a zone.The second method uses existing scientific knowledge in addition to monitoring results andrequires less stations to give a satisfactory description of the concentration distribution in azone. Especially for CO, for which air pollution near roads is the most important type ofpollution situation, this type of generalisation can be very efficient. Although dispersionconditions can vary strongly from street to street, traffic related pollution situations tend to bemore homogeneous than industry related pollution situations.
&RQWLQXLW\For trend analysis purposes it is important that stations remain in operation for a long period.This should be an major consideration in revising and optimizing a network.
3.3.2 Network density in the case of no supplementary assessment
0LQLPXP�VWDWLRQ�GHQVLWLHVFor the determination of the network density the station density will be expressed as thenumber of stations per inhabitant. For rural stations a specification per zone is not useful,because only few stations in a large area are needed. Since rural levels can be assumed to bebelow the LAT, a specification is not given here.It is recommended to define the station density requirements consistent with those for otherpollutants with similar characteristics. The requirements for NO2 in the Common Position forthe first Daughter Directive is used as guidance for CO. Table 12 gives the proposed numberof stations for diffuse sources.
Table 12 Minimum number of stations per zone in case of no supplementary assessment
3RSXODWLRQ�RIDJJORPHUDWLRQ�RU�]RQH�PLOOLRQV�
,I�PD[LPXP�FRQFHQWUDWLRQVH[FHHG�8$7
,I�PD[LPXP�FRQFHQWUDWLRQV�DUHEHWZHHQ�8$7�DQG�/$7
<0.25-0.5-0.75-1-1.5-2-2.753.75-4.75-6>6
122345678910
11112233445
If >1, to include at least oneurban background station andone traffic oriented station
It is not useful to specify numbers of stations around point sources, since the stations neededto assess the air quality sufficiently depend strongly on the source characteristics. For theassessment of pollution in the vicinity of point sources, the number of sampling stations
CO position paper - draft version 5.2
38
should be calculated taking into account emission densities, the likely distribution patterns ofambient air pollution and potential exposure of the population.
3.3.3 Network density in the case of supplementary assessment
1HWZRUN�GHQVLW\�GHSHQGV�RQ�WKH�VXSSOHPHQWDU\�DVVHVVPHQW�PHWKRGThe added value of the supplementary assessment should at least compensate the reduction inthe number of stations compared to the case of no supplementary assessment. As long as thisassessment method has not been described, it is difficult to express its added value in terms ofthe numbers of stations that can be omitted. It is recommended that the supplementaryassessment will result in an annual report on the spatial distribution of the concentrations ineach zone, including territory-covering information on the exceedences, and that this reportwill be forwarded to the Commission together with the measurement data from the measuringstations. For the rural and probably also the urban scales the CO levels are so low that maps,as proposed for some other pollutants, are not needed. Instead, spatial statistics covering thesescales is sufficient. For the local scale, streets and industrial locations should be distinguished.For streets, spatial statistics should be given, H�J� in the form of accumulated street length withlevels above the limit value. For industrial locations the total area where exceedence occurred(in km2) should be quantified. See also Chapter 5 on reporting.The spatial statistics should be of sufficient accuracy, but it is very difficult to quantify thisaccuracy. It would be meaningless to require that the quality of the information in thestatistics should be equivalent to that of a network that would exist in the case of nosupplementary assessment, since the concentration in such a network is specified only where astation is present.The minimum number of stations would at least be the minimum that the FrameworkDirective prescribes: fixed measurements should be done in each agglomeration and in eachzone where the levels are above the LAT. So, in those zones the minimum number of stationshould at least be one. It is expected that the supplementary assessment will allow togeneralise measured concentrations from one location to other similar situations. In the caseof industrial stations, however, very different situations are imaginable, between which theconcentration patterns can not be related. Only for situations that can be generalised to othersimilar situations a reduction of the measuring effort is possible.
3.3.4 Siting criteria
The strategy for the siting of monitoring stations can be separated into two main elements:criteria for the PDFUR�VLWLQJ (or network design), which describe how the stations of a networkshould be distributed within the entire concentration field that is to be assessed, and criteriafor the PLFUR�VLWLQJ, which describe how the station should be exactly positioned within thearea that was chosen on the basis of macro-siting, in particular with respect to very small-scale concentration gradients.
0DFUR�VLWLQJ
Macro-siting should optimise the information on the concentration distribution within theterritory to be assessed. A second aim of macro-siting is to optimise the generation of airquality management information, L�H� data for the analysis of source contributions to the levelsand of trends, but this will not be discussed here.

CO position paper - draft version 5.2
39
Before elaborating macro-siting criteria, the concept of representativeness will be discussed inmore detail. Also the concentration data that the assessment should produce should first beaddressed.
The concept of UHSUHVHQWDWLYHQHVV�is particularly important for the assessment of numeroussimilar small-scale situations, like streets or small industries, which can not be individuallyassessed by monitoring or modelling. One often assumes that the results of an assessment ofone location can be used (are representative) for other, similar locations. Some examples mayclarify this. It is often assumed that concentrations monitored in one or a few streets arerepresentative for the other relevant streets. The background levels in a city are often assumedto be characterised by one or two stations. A set of model calculations of the concentrationdistribution around a few small industrial sources can be assumed to be representative forsimilar sources elsewhere. The essence of using the concept of representativeness is that datafor a small set of locations can be translated/extrapolated to data for a much larger area(though with limited accuracy). This is also the essence of macro-siting strategy.
Section 3.4 below discusses "other" assessment methods, including methods to extrapolatemeasurement data to other locations. It is advantageous to take the potential of these methodsinto account in the macro-siting strategy. However, since a generally accepted methodologydoes not yet exist, it is not possible to have a particular method in mind when describing amacro-siting strategy here. The strategy described here will therefore be general and flexibleenough to link up to the existing way of working, and on the other hand it will incorporate thepotential of combining measurements with mathematical methods.
In Chapter 5 it is discussed how the concentration distribution should be reported. It isproposed that the reports should not be restricted to merely the air quality at the stations, butalso give information on locations without a station. A practical way to do this and to link thisto the measuring network is to divide the entire territory in areas of types that correspond tostation type (traffic, industrial, urban background, rural). The spatial concentrationdistribution over each type of area can be derived from the concentration data of the station(s)of the corresponding type. (Further subdivisions in area types could be made if the availabledata allow this, H�J� various street types.)
Departing from the goals of the assessment, the macro-siting strategy can now be described. Itwill be expressed only in general terms here and its further elaboration will be left to thecommittee attached to the Directive. The basic principle was stated already above: PDFUR�VLWLQJ�RI�VWDWLRQV�VKRXOG�RSWLPLVH�WKH�LQIRUPDWLRQ�RQ�WKH�VSDWLDO�FRQFHQWUDWLRQ�GLVWULEXWLRQZLWKLQ�WKH�]RQHV�
The network designer should answer the question how the spatial distribution of exceedencescan best be described. (Since the measurements are continuous in time, the temporaldistribution needs no special consideration.) The designer should first estimate ZKHUHexceedences may be expected (in the first stage of implementation of the Directive this will bethe preliminary assessment, later it will be the revision of the assessment). Then the designershould distinguish DW�ZKLFK�W\SHV�RI�ORFDWLRQV the exceedences are expected. For CO this istypically near busy streets and possibly near particular industrial sites. It can not be excludedthat situations occur where the urban background is not negligible. Information on rural levelsis of importance to understand the levels, but is hardly important for managing exceedences ofthe limit value. Consequently three types of stations are expected to be relevant:• Traffic stations

CO position paper - draft version 5.2
40
• Industrial stations• Urban background stations The designer should then investigate how a limited number of stations should be distributed togive the best description of the exceedences in the territory. Each relevant location type should be covered by one or more stations of the correspondingtype. Out of the very large number of locations of a certain type that are to be assessed, thedesigner should select one or several locations that are, as well as possible, representative ofall other locations of this type. The designer should consider the possibilities to generalise themeasured concentrations, L�H� translate the results to the other locations of the type considered(see Section 3.4). Depending on the type of locations, this could H�J� be done by mathematicalinter/extrapolation (not very useful for CO), by modelling or (as is currently often done) bydemonstrating without using formalised methods that the stations are representative for certainareas. Based on the possibilities to generalise the results of measurements at individuallocations, the designer should then determine the measurement locations. The designer shouldreport the estimated or calculated representativeness of each station for the entire set oflocation types that it represents (H�J� by reporting whether a street station represents the worstcase (maximum) in the area or a typical (median) busy street - this should be elaborated inmore detail). In the case of no supplementary assessment (Section 3.3.2), the set of stations byitself should be as much as possible representative of the exceedence situations that occur inthe zone. In the case of supplementary assessment (Section 3.3.3), this would also beimportant, but then, in addition, the station locations should be chosen so as to optimise thepossibilities for generalisation. The above procedure hypothetically assumes that the existing network can be completelyredesigned. In practice, the possibilities for restructuring the network are more limited. Also,for reasons of continuity (H�J� for trend analysis) one should change the locations of existingstations only as a last resort. The existing network should, however, be analysed according tothe above procedure, and for existing stations that are not changed, the information on therepresentativeness should be reported. For reasons of efficiency, the possibilities of co-locating monitoring sites for pollutants withsimilar spatial concentration distributions should also be taken into account. 0LFUR�VLWLQJ The purpose of micro-siting is to position the inlet of the station so that the measuredconcentration approaches as closely as possible the local level that should be assessed. Apartfrom practical criteria such as accessibility, safety, availability of electrical power, which willnot be elaborated here, the major decision is to choose the exact position within the area thatwas chosen on the basis of the macro-siting strategy. Vertically, the height of the inlet should be between 1.5 metre (the breathing zone) and 4metres above the ground. The horizontal position should be chosen so that the measurement should capture the small-scale peaks that are just large enough to be relevant for testing against the limit value. Thisimplies that too small-scale peaks (or dips) in the concentration should be avoided. For trafficstations, this means that the inlet should not be closer than 25 metres from the edge of majorstreet junctions, and that the inlet should be less than 5 metres from the kerb side.

CO position paper - draft version 5.2
41
Measurement at industrial sites should typically be representative of areas of 100 metres indiameter or more. At urban background stations such small scale peaks are not expected tooccur. Concentration gradients due to sinks of CO (due to deposition or chemical removalfrom the atmosphere) are generally negligible on the micro-scale.
3.4 Measurement methods The measurement of CO can be divided in three separate steps:
• the sampling method;• the measurement or analysis method;• the calibration method (when the analysis method is not absolute).
The following tables gives the most current used methods and their main advantages anddisadvantages.
3.4.1 Existing sampling methods Table 13 gives an overview of existing sampling methods.
Table 13 Existing sampling methods
0HWKRG�� 'HVFULSWLRQ 5HIHUHQFH $GYDQWDJHV�'LVDGYDQWDJHV
1. Laminar flowmethod
Flow 150 l/min, tube diameter 15cm Inert material: glass, stainlesssteel, Teflon
EPA + isokinetic sampling,sample unaffected
2. Turbulent flowmanifold
Modular sugar cane design Inert material: glass, stainlesssteel, Teflon
+ low cost, modularconstruction
3. Samplingwithout manifold
Direct connection of analyserinlet to station sampling head
+ low cost, efficientsampling
1 Instruction manual for Air Pollution Monitoring" Vol. I: Sulfur Dioxide Monitoring, EUR14550/IEN
3.4.2 Existing measuring methods Table 14 gives an overview of existing measuring methods.

CO position paper - draft version 5.2
42
Table 14 Existing measuring methods
0HWKRG 'HVFULSWLRQ 5HIHUHQFH $GYDQWDJHV�'LVDGYDQWDJHV
1. Manualmethods
+ cost effective - discontinuous and timeconsumingmeasurements
1.1 Gaschromatographicmethod
CO is separated on a GC columnfrom the components of the airsample, catalytic reduction ofCO, measurement of CH4 by FID
ISO 8186 + free from interferences
1.2 Diffusivesampling
Diffusive sampling ontoabsorbent + photometry orelectrochemical detection
+ cost effective - possible interferences - integratedmeasurement overseveral days
2. Automatedmethods
+ continuous, real timemeasurement - requires regularcalibration andmaintenance
2.1 NDIR Measurement of IR absorption ISO/DIS4224
+ sensitive, stable,accurate
2.2 Hot HgO-method 1
Reaction of CO and HgOfollowed by photometricdetermination of Hg vapour.
- use of mercury - possible interferences
1 W. Seiler, H. Giehl and P. Roggendorf. Detection of Carbon Monoxide and Hydrogen byConversion of Mercury Oxide to Mercury Vapor. Atmospheric Technology, 1980 (12).
3.4.3 Existing calibration procedures Table 15 gives an overview of existing calibration methods.

CO position paper - draft version 5.2
43
Table 15 Existing calibration methods
0HWKRG 'HVFULSWLRQ 5HIHUHQFH $GYDQWDJHV�'LVDGYDQWDJHV
1. Staticvolumetricmethod
A known volume of CO is addedto a known volume ofcomplementary gas, undercontrolled temperature andpressure conditions
ISO 6144 + good precision andaccuracy + cost effective (alsosuited for otherpollutants) - difficult handling - Control of CO purityrequired
2. Gravimetricmethod (high orlow concentrationmixtures
A chamber is weighed before andafter introduction of a certainquantity of CO, then filled upwith air or N2 and pressurised.
ISO 6142 + easy handling + good precision forhigh concentrationmixtures + gas cylinderscommercially available
3. Dynamicvolumetricmethod
Introduction of a given flow rateof a gas into a constant flow rateof a complementary gas. The gasis usually a high concentrationgas mixture obtained by thegravimetric method.
ISO 6145 + easy handling + good precision - unknown accuracy
3.4.4 Reference measurement method The following reference method is proposed:
• analysis and calibration according to ISO/DIS 4224: non-dispersive infraredspectrometer (NDIR) method.
3.4.5 Screening techniques The on-line monitoring of atmospheric pollutants in the air quality monitoring networksgenerally requires expensive and sophisticated measurement techniques. Simplermeasurement techniques, called indicative or screening techniques, may offer a cost-effectivealternative to the conventional techniques. Among them, the diffusive sampling technique orthe use of a mobile laboratory for grid monitoring is an interesting screening element. A diffusive sampler consists of a tube, one end containing a chemical substance that fixes thepollutant. The pollutant is sampled onto the absorbent at a rate controlled by the moleculardiffusion of the pollutant in the air. The amount of pollutant collected by the sampler is afunction of the ambient air concentration integrated over the sampling period. After exposureof the samplers over a few days’ periods, the tubes are closed and returned to the laboratory

CO position paper - draft version 5.2
44
for analysis by colorimetric techniques. This sampling technique applied for CO is not verypopular and further investigation has to be made. A guide for the selection and the applicationof the diffusive sampling technique is currently being prepared by CEN/TC 264 - WG 11.Diffusive samplers for a direct reading measurement of CO are commercially available("Dräger-Röhrchen") but not yet validated. The main advantage of the diffusive sampler is that it does not require any pump or electricalpower and that it runs unattended during the sampling period. It yields a time-integratedmeasurement over a certain period (H�J� 8 hours), but concentration peaks such as thoseoccurring during short episodes are hardly detected. A screening based on the use of a mobile laboratory for grid monitoring is also of interest asthe pollutant spatial distribution over a larger area can be assessed. Grid monitoring isperformed by dividing the particular area of interest into a grid of squares, and by measuringthe pollution levels in each grid cell. The measurements are made during short periods of timeat each intersection of the grid lines, and repeated over the course of a year. The dates andhours for the measurements are chosen randomly but in such a way that they are evenlydistributed over the months, the days of the weeks and the hours of a day. The measuringschedule is laid out so that no neighbouring intersections are measured at the same day. Thesingle values measured at the four corners of each grid are used to calculate the meanconcentration value for each grid cell.
3.5 Mathematical methods *HQHUDO The Framework Directive explicitly mentions the possibility to use models (or, moregenerally, mathematical methods) in cases that the concentrations are higher than the UAT orLAT, and allows the sole use of modelling where the LAT is not exceeded. In general, anymethods that are able to expand the measuring results where the limit values are approachedor exceeded can be of great value, both for analysing the extent of exceedences and for airquality management. 0RGHOOLQJ�VRXUFH�FRQWULEXWLRQV�DQG�FRQFHQWUDWLRQ�GLVWULEXWLRQV Two important applications of modelling should be distinguished: (a) the analysis of thecauses of air pollution, L�H� the contributions from the various sources of air pollution, and (b)the description of the concentration distribution in time and space. The first type, althoughvery important for the management of air pollution, will not be discussed here. Modelling forthe description of the concentration distribution in time and space will be discussed in moredetail in the following paragraphs. &RPELQDWLRQV�RI�PRGHOV�DQG�PHDVXUHPHQWV In the following the term model will be used for any formalised (algorithmical) method tocalculate concentrations. In this section some important examples of the application ofmathematical models and the relation with measurements are discussed. D��8VLQJ�PRGHOV�ZLWKRXW�ORFDO�PHDVXUHPHQWV In situations where no local measurement data are available and where directinter/extrapolation of the results of the nearest stations can not be applied (H�J� near a small
CO position paper - draft version 5.2
45
point source) models can be used to estimate the local concentrations. The credibility of theresults depends on the quality of the emissions and meteorological input parameters, and onthe results of (earlier) model validation studies. E��,QWHJUDWLQJ�PRGHOOLQJ�DQG�PHDVXULQJ�UHVXOWV In general, the quality and credibility of modelling results will improve when calculatedconcentrations are directly compared with concentrations that are measured within the timeperiod and the area that the calculations pertain to. A very important question is howdifferences between calculated and measured concentrations should be dealt with. Often,inaccuracies of the model input (emissions, meteorology) are large enough to explain thedifferences. In such cases, it is justified to improve the modelled concentration field byadjusting the input (within the uncertainty range) to improve the agreement. This procedurecan be regarded as intelligent extrapolation of measurements, rather than modelling. It has theadvantage that it adds information on emissions and dispersion to the information given by themonitoring stations, without degrading the monitoring results. Objective mathematicalmethods can be used to do this, but one should note that this approach usually relies onsubjective evaluations of the uncertainty ranges of the various adjustable parameters. Especially when the model has been specially designed for this procedure, it can be apowerful assessment tool. It should be noted that this procedure is not (yet) generally applied.An example of an operational procedure is the CAR model as used in the Netherlands. Thismodel contains a few adjustable parameters, which are annually fitted to the results of tenstreet stations and is subsequently used to calculate concentrations in complete networks ofstreets. F��,QWHUSRODWLRQ�RI�PHDVXULQJ�UHVXOWV More common than the intelligent interpolation described above is the direct interpolationwhich does not take information on emissions or dispersion into account. This is useful foruniform areas, but one should be aware that small-scale variations can not be identified. Thismethod is often used for larger scale patterns, but for describing CO levels near the limit valueit is of little use. 0DWKHPDWLFDO�PRGHOV�IRU�&2 Many computer models for the dispersion of gaseous substances such as CO have beendeveloped and applied. These models need input regarding emissions, meteorology andsometimes topography. In most areas many sources contribute to the concentrations, and so acomprehensive calculation of the concentrations would require a very extensive emission database. Because rural and urban background concentrations of CO are generally below levels ofconcern, model applications for CO are usually directed at the local scale, and calculate onlythe contribution of sources in their direct vicinity, while the contributions of other, moreremote sources are taken into account by adding measured background concentrations. Since the highest CO levels occur near traffic, in particular low speed traffic in the urbanenvironment, street models are the most important model types for CO. These models form aspecial class, that is different from the type of models that is commonly used for the pointsources such as chimneys. In the street models, the individuals cars are not distinguished, butaggregated to a line source or a 3-dimensional volume representation of the traffic. Becauseboth the emission pattern and the dispersion between buildings are very difficult to modelaccurately, decades of research have still not resulted in models that are both comprehensiveand accurate. Most street models have a limited range of applicability. In particular, many
CO position paper - draft version 5.2
46
models describe the dispersion within idealised street canyons, but can not be used at streetjunctions or where building lines are interrupted. Most models are have difficulty to calculatethe air quality parameter corresponding to the limit value (maximum 8-hour average). Windtunnel models, in which the atmospheric dispersion in specific street configurations arephysically modelled, are not very suitable, because of the high costs per configuration andbecause they can not quantify the emissions. Some models aim at broad applicability insteadof the highest accuracy. For individual streets the performance is poorer than specialisedmodels, but for generating a comprehensive overview of the air quality around streets in azone they are probably the only truly operational model type. The accuracy of such a modelcan be improved if it is adjusted to measurements; the model can then be used as ageneralisation method for measurements. For the dispersion around chimneys of H�J� industrial sources numerous variations of theGaussian plume model are in use. Probably many models need to be adapted to calculate themaximum 8-hour average concentration. Models for the dispersion at regional and largerscales exist, but are not relevant here. &ULWHULD�IRU�PRGHOV Since there are no standard methods available that can be prescribed as the only methodsallowed or as reference methods, the requirements of the models (and other mathematicalmethod) will need to be described in other ways, preferentially in terms of the accuracy of theresults. It should be noted that it would be unrealistic to require that the model results are moreaccurate than the results of a (dense) monitoring network, which also have several inherentshortcomings. A distinction should be made between the requirements for the variousassessment regimes. The accuracy requirements for models are given in Section 3.6.
3.6 Data quality objectives Data quality objectives must be established in order to comply with the assessment objectives.They will be defined in terms of required precision and accuracy, minimum time coverage andminimum data capture. Below, these requirements are preliminary expressed as the expectedcapabilities of the assessment methods. For the time being, the possibilities to relate therequirements directly to the assessment regime is not considered. Required accuracy:
• Fixed measurements (continuous): 15 % (individual measurements);• Indicative measurements: 25 % (individual measurements);• Modelling: 50 % for 8h means;• Objective estimation: 75 %.
The accuracy of the measurements is defined as laid down in the “Guide to the Expression ofUncertainty of Measurements” (ISO 1993), or in ISO 5725-1 “Accuracy (trueness andprecision) of measurement methods and results” (ISO 1994). The percentages are given forindividual measurements, averaged over the period considered by the limit value, for a 95%confidence interval (bias + two times the standard deviation). The accuracy for fixedmeasurements should be interpreted as being applicable in the region of the appropriate limitvalue. The accuracy for modelling and objective estimation is defined as the maximumdeviation of the measured and calculated concentration levels, over the period considered bythe limit value, without taking into account the timing of the events.

CO position paper - draft version 5.2
47
The values proposed are based on the performances that can be achieved by implementingtechniques corresponding to the current state of the art for the various methods, and on thebasis of approval of measuring devices. The accuracies given for modelling and indicativeestimation should however be regarded as indicative, since current knowledge does not allowto give generally applicable accuracy numbers. Minimum time coverage of the measurements:
• Fixed measurements: 100 % (continuous or quasi-continuous);• Indicative measurements: 14 % (one measurement per week at random, evenly
distributed over the year, or 8 weeks evenly distributed over the year). Minimum data capture:
• Fixed (continuous) measurements: 90 %. A 90 % data availability requires a well-planned maintenance, which should not be carried out when concentrations can beexpected to be high.
The requirements for minimum data capture and time coverage do not include losses of datadue to the regular calibration or the normal maintenance of the instrumentation.
3.7 Quality Assurance and Quality Control of measurements Quality assurance is a system of procedures that ensures that:
• measurements are precise and accurate;• results are comparable and traceable;• data are representative of ambient conditions;• optimum use is made of resources.
The major constituents of a quality assurance program concern:
• network design (Section 3.3): number of stations, siting criteria;• measurement technique (Section 3.4): sampling, analytical and calibration procedure;• equipment evaluation and selection: validation of methods, test of instrumentperformances;• routine site operation: calibration in field conditions, maintenance, management andtraining.
QA/QC procedures are described in the WHO UNEP GEMS/AIR Methodology ReviewHandbook Series, Volume 1, "Quality Assurance in Urban Air Quality Monitoring". Currently QA/QC programs only exist in a few monitoring networks of the EU MemberStates and with a variable degree of efficiency. With the change of the monitoring networks foreseen with the implementation of theFramework Directive, it is expected that a lot of new laboratories, with among them a greatnumber of private companies, will be in charge of the monitoring task. This will requireparticular measures to assure the quality of the measurements and the capability of thelaboratories:

CO position paper - draft version 5.2
48
• Accreditation of laboratories: different standardised QA/QC systems have beendeveloped in recent years such as the Good Laboratory Practice (OECD), the ISO9000 and the EN 45000 laboratory accreditation procedures. The EN 45001 procedurewas developed by CEN in collaboration with the European Commission and is bestadapted for testing laboratories in the field of air pollution measurements. Laboratoriesapplying for accreditation are audited by a national or international accreditationorganisation. This audit mainly concerns aspects such as laboratory installation andequipment, qualification and training of personnel, proper quality control, technicalaudit and traceability of the measurements. The request for laboratory accreditation isthe only enforceable way to ensure an effective QA/QC procedure.
• Validation of the measurement methods and standardisation at CEN or ISO level.• Certification of equipment, test of instrument performances (the development of a
standardised CEN test procedure is therefore urgently needed).• Organisation of intercomparison at EU level: organisation by the European
Commission of EU-wide intercomparison exercises (round-robin tests, inter-laboratoryexercises, spot checks in the monitoring networks) to ensure comparability of themeasurements at international level.
• Publication by the European Commission of guidance documents, organisation oftraining’s and workshops.

CO position paper - draft version 5.2
49
4. Cost implications In Chapter 2 recommendations for a limit value for CO have been given on the basis of anassessment of the risks of CO. A limit value defined in the Daughter Directive on CO will bebinding from the date by which it must be met. Because of this, practical considerationsshould be taken into account; in particular costs and benefits of meeting the limit value andthe consequences of not doing so should be identified. This evaluation of costs and benefits isone of several inputs to the decision making process. Economic analysis is a specialist task. DGXI therefore engaged a team of consultants, led byAEA Technology, and asked them: to assess likely concentration concentrations of CO acrossthe Union in the year 2005, taking into account the effects of existing and planned legislation;to determine whether further action would be needed to reach by 2005 a possible limit valueof 10 mg/m3 either as maximum 8-hour mean concentration or as second highest 8-hour meanconcentration; and if further action would be needed, to identify the least cost means; to assessthe benefits of meeting these limit values. The study also included benzene. At several stagesof the work interim results were discussed by the Steering Group. The remainder of this chapter has been taken from the Executive Summary of the draft finalreport on this study23. The methodology for the air quality assessment within this study was largely based onextrapolation of the results of the Auto-Oil programme. Auto-Oil provided detailed modelledassessments of urban background air quality across 7 cities, these cities being broadlyrepresentative with respect to air quality of all cities in the European Union. Auto-Oil alsoprovided a set of data and assumptions that had been widely reviewed, discussed and agreedby European decision makers and other interested parties already. Accordingly it formed agood position from which to start. The analysis considered 3 cities in detail, Athens, Cologneand London, and then extrapolated results for these three cities to the level of the EU as awhole. Given the earlier results of the Auto-Oil programme there was little point in investigating COpurely from the perspective of urban background concentrations. This indicated that proposedlimits would not be exceeded anywhere in the EU in 2005. Hence this study focused on thehot-spots where high concentrations are most likely to be found (for example close to busyroads). This was not an easy task, given the scale over which concentrations vary in suchlocations. Rather than model hot spot concentration from emissions and data on topographyand local meteorology, it was decided to extrapolate [urban background:hot spot] ratios fromcomparable monitoring sites in the same city. This gave the advantage of using data from realmonitoring locations, and thus it was hoped would be reasonably indicative of measurementsto be made in the future. Three ‘baseline’ scenarios were defined. First conditions were considered without accountbeing taken of the existing draft directives on fuel quality and passenger car emissions thathad been produced as a result of the findings of the first Auto-Oil programme. This allowedthe approach taken for extrapolation of Auto-Oil data to be checked against the results of
23 M.R. Holland (1998). Economic evaluation of air quality targets for CO and benzene. AEA Technology, draft
final report.

CO position paper - draft version 5.2
50
Auto-Oil. The next scenario introduced the draft Auto-Oil directives on fuel quality andvehicle emissions, which were currently in the form of Common Position. Next (for Athensalone) measures were introduced which had been identified in the earlier economic evaluationstudy of possible air quality limits for SO2, NOx, PM10 and lead. According to that studyAthens was the only city of the three considered here likely to experience exceedences of limitvalues. To meet the limits in Athens it was suggested that road pricing and the use of busesrunning on compressed natural gas (CNG) or liquid petroleum gas (LPG) would beintroduced. The occurrence of exceedence in the three cities is summarised in Table 16, considering themost restrictive scenario for each.
Table 16 Occurrence of exceedence in three cities, considering the most restrictive scenario for each
/LPLW $WKHQV &RORJQH /RQGRQ 8UEDQ�EDFNJURXQG
10 mg/m3 highest 8 hour mean no exceedence no exceedence no exceedence 10 mg/m3 2nd highest 8 hourmean
no exceedence no exceedence no exceedence
+RW�VSRWV
10 mg/m3 highest 8 hour mean exceedence no exceedence exceedence 10 mg/m3 2nd highest 8 hourmean
exceedence no exceedence exceedence
The extent to which emissions are reduced across each of the cities in response to legislationon air quality would be dependent on the type of measures introduced to combat excess levels.Small localised exceedences would be most likely to be addressed by local trafficmanagement measures, with limited effect on emissions elsewhere (assuming that they do notdisplace traffic to other areas). Larger exceedences affecting broad areas of a city may need tobe addressed through further action on fuel quality or vehicle design. Such measures couldaffect emissions everywhere. Analysis of CO effects based on available epidemiological data is subject to muchuncertainty, given the limited amount of data that exist. Three exposure response functionshad been reported in the literature, for acute (short term) effects on mortality, ischaemic heartdisease (disease associated with a lack of blood supply to the heart) and congestive heartfailure (CHF). Of these only the last appears reasonably robust, once account has been takenof other pollutants. However, the logic of including one type of heart disease but not anotherfor which there appears reasonable grounds for believing that there should be an associationwith CO may be questionable. Equally, including heart disease, but not premature mortalitymay also be questionable. At the same time it has to be said that the effect of CO exposurefrom ambient air may just be to bring the date of hospitalisation or death forward by a limitedtime: the primary cause of heart disease or the timing of death may lie elsewhere (e.g.smoking, diet, lack of exercise, etc.). The epidemiology unfortunately does not provideanswers to these questions. Available ‘response profiles’ showing the effects linked todifferent concentrations of carboxyhaemoglobin (COHb) in blood are reasonably wellaccepted but are not amenable to application in this type of analysis. Estimated impacts andassociated costs given for CO here should thus be regarded as very uncertain, with this

CO position paper - draft version 5.2
51
uncertainty reflecting the limited attention that has so far been given to CO in epidemiologicalstudies. Results are given only for Athens and London as no exceedences were calculated for Cologne.In Athens, for the scenario in which both the Auto Oil Directives are in force, and theproposed air quality standards for NOx and PM10 are adopted, the number of cases reduced bysetting the limit values investigated ranged from 78 (against the 10 mg/m3 as second highest 8hour mean concentration annually) to 121 (against the 10 mg/m3 as highest 8 hour meanconcentration). Estimated annual benefits associated with this were 0.6 million ECU and 0.9million ECU respectively. In London, results were similar with reduced incidence of cases of68 and 216 per year against the two limit values, and with benefits of 0.5 and 1.7 million ECUper year. The following secondary benefits have been identified in the study for measures that could beused to reduce CO levels though most were not quantified:
$EDWHPHQW�PHDVXUH %XUGHQ�DIIHFWHG ,PSDFWV�DIIHFWHG Traffic calming, publictransport subsidies, etc.
Emission of all transportpollutants (SO2, NOx, PM10,VOCs, CO2 etc.)
Effects on health, materials,ecology
Risk of accidents Death and injury, material damage
Congestion Travel time Noise Amenity Emission constraints Emission of all transport
pollutants (SO2, NOx, PM10,VOCs, CO2 etc.)
Effects on health, materials,ecology
Some of these effects could be easily quantified using the models available to the study team.However, consideration of the additional benefits of reducing emissions of other pollutantsappeared to the team to go against the spirit of the Framework Directive on Ambient AirQuality. Essentially the study could end up justifying CO controls through reductions in otherpollutants (particularly SO2, PM, NOx) below limit values already agreed by the EU. The teamfelt strongly that it would be preferable to conduct a much broader analysis when theDirectives come forward for revision, including for example all transport related emissions ina single study. Table 17 presents results at the European Union level (following extrapolation from the 3cities). For both limits costs at the EU level were found to be greater than the benefits ofreducing emissions in hot-spots (though not of course in the urban background where noexceedences were seen).
Table 17 Summary of benefits and costs at the EU level
/LPLW 1R��RI�FDVHV %HQHILWV�0(&8 &RVWV�0(&8 Urban background 10 mg/m3 max no exceedence
10 mg/m3 2nd
highest no exceedence

CO position paper - draft version 5.2
52
Hot-spot 10 mg/m3 max 5000 39.3 105 - 122 10 mg/m3 2nd
highest 2600 20.8 45 - 53
The most important sensitivities from this analysis are:• Assessment of ratios between urban background and hot-spot concentrations;• Assessment of the effects on CO and benzene levels of the limit values proposed for NOx,
SO2 and PM10;• The extent to which traffic calming and other measures will be introduced to reduce
congestion, noise and accidents;• The real nature of the health effects of CO. The largest constraint arises from this last point. A robust cost-benefit assessment of CO couldnot be carried out until better data are available on the extent and severity of associated healtheffects. In the context of the overall assessment made, i.e. including also benzene, costs wouldlargely be shared between the two pollutants, given that many of the measures identified forcontrol are the same.

CO position paper - draft version 5.2
53
5. Reporting the results Article 11 and Annex 4 of the Framework Directive lay down the information that MemberStates will have to report to the European Commission. Depending on the levels, the requiredinformation may include data on the concentration levels in the zones, the causes of thepollution and other air quality management information. This chapter focuses on how data onthe levels in the zones could be reported to the Commission. &RXQWLQJ�H[FHHGHQFHV When exceedences of the limit value occur and have to reported to the Commission, thequestion of how the 8-hour periods of the limit value are to be counted becomes relevant. If allrunning averages would be counted, exceedences could overlap, e.g. one could have 24exceedences in one day. To avoid overlapping time windows, fixed time windows could bechosen, e.g. 0-8, 8-16 and 16-24h. This would, however, overlook in many cases the highest8-hour mean of the day; in particular the morning traffic peak period would be divided overtwo periods. If the time window would not be fixed, the procedure of finding the maximumnumber of exceedences of non-overlapping periods would not be very transparent. It isproposed to choose the method of daily 8-hour maximum: select the highest daily 8-houraverage from the 24 moving averages and test this value against the threshold. This procedurecounts the “exceedence days”. For a complete specification the assignment of the 8-hourperiod to a calendar day should also be defined: it is proposed to assign each 8-hour period tothe day of its last hour (so the period 17-1h is the first 8-hour period of a day). 6SDWLDO�FRQFHQWUDWLRQ�GLVWULEXWLRQ In Chapter 3 it was remarked that the assessment strategy and the requirements for reportingthe results of the assessment can not be developed independently. Even more so, theassessment strategy should be directly aimed at generating the results that should be reported.Since the form of the results of the new assessment tools introduced by the FrameworkDirective, in particular mathematical models, differs very much from the form ofmeasurement results, the currently existing reporting procedure should be reconsidered. Until now, the reports of results of air quality assessment in the framework of EU air qualitydirectives have been limited to statistics of measurement results. This is basically a report ofthe temporal pattern of concentrations at a limited number of points in space (station sites).For reasons of harmonisation the European Commission has spent much effort in definingstandardised reporting formats. In addition to the concentration statistics, also an extensive description of the stations isreported to the Commission, including information on the surroundings of the stations, such asthe type (urban, suburban or rural), character (residential, commercial, industrial, agricultural,natural) and nearby sources. Although this typification gives satisfactory information on thestation itself, it does not include any information on how representative the station is for otherlocations of the same type. Since it is known that Member States currently apply differentmeasuring strategies, particularly regarding the location of stations with respect to the highestvalues, it is not possible to extrapolate the reported data to territory-covering information. InSection 3.3 on measuring strategy it was proposed to add to the information on stations at leastadditional information on how representative a station is for the type of locations that itbelongs to (is it an "average" site, or the worst case in the zone).

CO position paper - draft version 5.2
54
The Framework Directive allows the use of modelling in zones where the levels are below theLAT and requires reports on these zones every three years. It would be very useful to developa common form for reporting such modelling results for the future Daughter Directives. Thisalso applies to the results of supplementary assessment according to Section 3.3.3 in areaswhere the concentrations are above the UAT/LAT. When a combination of modelling andmeasuring is applied, it would be unsatisfactory when the reports to the Commission would belimited to the data of the monitoring stations. The Commission would receive less (thoughbetter defined) data in the case of supplementary assessment than in cases without it. A reporting format for the concentrations should be developed that includes, besides statisticsof the temporal distribution of concentrations, information on the spatial concentrationdistribution in the zones. It is proposed to develop statistical parameters on the spatialconcentration, analogous to the temporal statistics that are now being reported by monitoringstations. It is questionable whether maps of CO would give information that is useful at theEU level. The most relevant example for CO would be the total street length above the limitvalue.

CO position paper - draft version 5.2
55
Annex A Special Areas of Potentially High CO concentrations 7KH�1HHG�WR�&RQVLGHU�6SHFLDO�$UHDV Certain publicly accessible pedestrian areas in confined spaces, such as tunnels and parkinggarages, can experience a build up of high concentrations of pollutants emitted from vehicles.It has therefore been suggested that the limit value for CO should apply in these special areas.However, the Council Directive on Ambient Air Quality�Assessment and Management(96/62/EC) is intended to improve DPELHQW air quality, defined as “outdoor air in thetroposphere, excluding work places”. It is not clear whether these special areas fall within theDirective’s definition of ambient air quality. Furthermore, the mechanisms of the FrameworkDirective, dividing territories into zones, developing action plans etc., may not provide asuitable means of dealing with them. Obviously, the limit value does apply to CO levels in ambient air near outlets of tunnel air. +HDOWK�(IIHFWV�RI�6KRUW�7HUP�([SRVXUH�WR�+LJK�&RQFHQWUDWLRQV�RI�&2 As mentioned in Chapter 2, the COHb level increases rapidly at the onset of exposure to highCO concentrations. Thus concerning the effects of CO exposure not only average but alsopeak concentrations should be considered. Exposure during several hours to an approximately constant CO concentration (for exampleonly small variations from an 8h average value) results in a comparatively slow increase ofthe COHb level until it reaches a steady state. In contrast, peak concentrations may lead to avery rapid increase of the COHb level. Taking for example a 1h average concentration ofabout 30 mg/m3 as a basis, a 60 minutes exposure to a constant CO concentration results in alinear increase of COHb from 1 to about 2% at the end of the 1h period. The same COHblevel may be reached after only 10 minutes exposure to 140 mg/m3, remaining at 1.9% at theend of the 1h period even though the CO concentration in the remaining part of the hourwould be as low as 5 mg/m3 (healthy non-smoker, light activity). A rapid COHb increase mayaffect especially organs like the heart or the brain, and in sensitive groups levels of concernmay be reached. 7\SHV�RI�6SHFLDO�$UHDV
• Indoor Car Parks: are considered to be outside the provisions of the Framework Directive,so are not covered in this Annex.
• Road Tunnels: the case is less clear. Road tunnels are public highways and this is clearlya public health issue. For these reasons, concentrations of CO in tunnels are consideredfurther in this Annex and suggestions are made for managing risk within them.
&RQFHQWUDWLRQV�RI�&2�LQ�5RDG�7XQQHOV In road tunnels CO levels can be much higher than near roads due to the limited ventilation intunnels. In measuring campaigns in Belgium the levels in some tunnels in Brussels were

CO position paper - draft version 5.2
56
found to be about ten times higher than those in a street canyon24. In Germany CO levels of115 mg/m3 and more were measured25. The Permanent International Association of Road Congresses has recommended criteria forpollutant concentrations inside tunnels. The recommended criteria for CO are presented intable A1. Table A1 3,$5&�UHFRPPHQGHG�PD[LPXP�SHUPLVVLEOH�&2�FRQFHQWUDWLRQV�LQVLGH�WXQQHOV��
&2�OLPLW�DW�SHDN�WUDIILF��SSP���
7\SH�RI�7XQQHO 6PRRWK�WUDIILF &RQJHVWHG�WUDIILF�RUVWDQGVWLOO
Urban tunnels(used to capacity)
Daily congested 100 100
Seldom congested 100 250 Inter-urbantunnels
Highway ormountain
150 250
1 ppm = 1.165 mg/m3
7XQQHO�9HQWLODWLRQ�DQG�)DFWRUV�$IIHFWLQJ�9HQWLODWLRQ Road tunnels can be ventilated both passively and actively. Passive ventilation relies onnatural air movements (i.e. in very short tunnels) or a through-draught created by trafficmoving inside the tunnel ‘pushing’ air along in their own direction of travel. Slotted orperforated ceiling also allow passive dispersion of pollutants. Active systems include ceilingfans fitted in the tunnel headspace or ventilation through side vents along the tunnel’s walls. In modern tunnels of any significant length, a combination of active and passive ventilation isnormal. Shorter or older tunnels may rely solely on passive ventilation. A number circumstances can lead to the build up of undesirable CO concentrations:• inadequate tunnel ventilation;• traffic accidents/congestion - emissions increase and through-draught is reduced;• traffic-counterflows within a single tunnel bore - can decrease the through-draft compared
with traffic flowing in the same direction within the single tunnel bore;• failure of active ventilation systems;• vehicle fires within the tunnel. Tunnel mouth and vents serve as point sources of CO, which can affect local air quality inadjacent areas. 5LVN�0DQDJHPHQW�0HWKRGV
24 P. vanderstraeten and A. Derouane. Road tunnels and air pollution. Proceedings of the Congress on Air Quality
in European Cities, Brussels, October 1995. 25 E. Lahmann. Luftverunreiniging - Luftreinhaltung. Eine Einführung in ein interdisziplinäres Wissensgebiet.
Paul Parey Verlag. 1990. 26 Permanent international Association of Road Congresses, XVIIIth World Road CongressRoad Tunnels, Brussels 13-19 September 1987, Technical Committee Report No. 5.

CO position paper - draft version 5.2
57
In taking measures to reduce exposure to undesirable concentrations of CO in road tunnels, itis worth noting the following factors:• CO concentrations in the tunnel;• CO concentrations in vehicles versus in the tunnel;• time spent by different tunnel users within the tunnel (or series of tunnels) - e.g.
pedestrians, cyclists, motorcyclists, motorists, children, adults;• degree of CO uptake of different tunnel users - e.g. pedestrians, cyclists, motorcyclists,
motorists, children, adults;• the numbers of each type of tunnel user. The above factors will vary with time of day, traffic conditions etc. and it is important toquantify the degree, number and duration of any undesirable exposures that may occur. Thefollowing texts outlines a number of risk management steps that may be cost-effectivedepending upon the specific circumstances of concern.
���*HQHUDO�PHDVXUHV�WR�UHGXFH�&2�FRQFHQWUDWLRQV�LQ�WXQQHOV Traffic management measures to ease congestion will also help to reduce CO concentrations and
exposure to CO in tunnels. Examples include the scheduling of maintenance work at night toavoid congestion or traffic-counterflows during busy periods. In cases of severe congestion, accident, or fire it may be necessary to prevent vehicles fromentering the tunnel altogether. Where traffic is stationary within a tunnel and this situation islikely to persist for some significant period, electronic signs can be used to advise drivers toswitch off engines. In certain cases it may be possible to reduce CO concentrations in the tunnel morepermanently by retrofitting existing tunnels with improved active ventilation systems or airpurification systems (see the section below). It is important to note that many tunnels may notlend themselves to such retrofits, e.g. where headspace is so limited that there is insufficientroom for installing ventilation fans. In such circumstances the cost of increasing the tunneldiameter/height may be prohibitive. ���6SHFLILF�PHDVXUHV�WR�UHGXFH�&2�H[SRVXUH�RI�PRWRULVWV�LQ�WXQQHOV Measures to limit concentrations in the tunnel will also limit the exposure of motorists if thein-vehicle CO concentrations are influenced by the tunnel CO concentrations. However,simple short-term risk management methods may be much more cost-effective. Suchmeasures include closing windows/sunroofs, recirculating air within the vehicle, or switchingoff vehicle ventilation system altogether, before entering the tunnel and for the duration of thetunnel journey. Road signs can help to prompt motorists to take these actions for themselves.If motorists are delayed inside the tunnel, electronic information systems may help to reducean individual’s CO uptake by reducing stress.
���6SHFLILF�PHDVXUHV�WR�UHGXFH�&2�H[SRVXUH�RI�QRQ�PRWRULVWV�LQ�WXQQHOV Measures to limit concentrations in the tunnel will also limit the exposure of non-motorists using
the tunnel. In certain circumstances it may be appropriate to deny access to non-motorists, e.g.pedestrians and cyclists. Such limitations on access might be denied at all times or only duringthose periods of the day that are of concern. 7XQQHO�DLU�SXULILFDWLRQ�V\VWHPV
CO position paper - draft version 5.2
58
Purification of tunnel air is difficult because of the need to treat large volumes of aircontaining particulate and multiple gaseous pollutants in low concentrations. Unfortunately,these various demands place different requirements on the air purification system and thesetend to be mutually exclusive and therefore expensive to achieve. A study carried out for the US Federal Highway Administration in the years 1974 to 1977concluded that an air purification system would need to have three basic units:• electrostatic precipitators to remove particulate;• catalytic oxidation with Hopcalite to oxidize CO to CO2 (and another catalyst to oxidizeNO);• activated carbon to remove NO2 and hydrocarbons.
Very few tunnels in the world employ any form of air purification system. Norway appears tobe the most advanced in investigating the possibilities of these techniques and started aresearch programme to determine the possibility of cleaning polluted tunnel air in 1987.Practical experience exists regarding particulates and NOx
27.
2WKHU�SROOXWDQWV
It is remarked that the tunnel levels of other traffic related pollutants, e.g. NO2, particulatematter and hydrocarbons, are often higher than in streets. CO inside the tunnel used to be thetrigger for forced ventilation, but since CO levels have declined in the past years, it tends to bereplaced by NOx as the ventilation criterion. Obviously, ventilation triggered by a singlepollutant will have a beneficial effect on the levels of the other pollutants as well.
27 H.J. Eirik and B.K Ottar. Ventilation and air cleaning technologiy for road tunnels - Particlecleaning and NOx cleaning. Publication of Public Roads Administration, Directorate of Publicroads, Norway, undated.


