47
Positive Behavioral Interventions and Supports Going to Scale in Maryland’s Local School Systems www.pbismaryland.or
| Date post: | 23-Dec-2015 |
| Category: |
Documents |
| Upload: | lindsay-ward |
| View: | 214 times |
| Download: | 0 times |
Positive Behavioral Interventions and
Supports
Going to Scale in Maryland’s Local School
Systems
www.pbismaryland.org
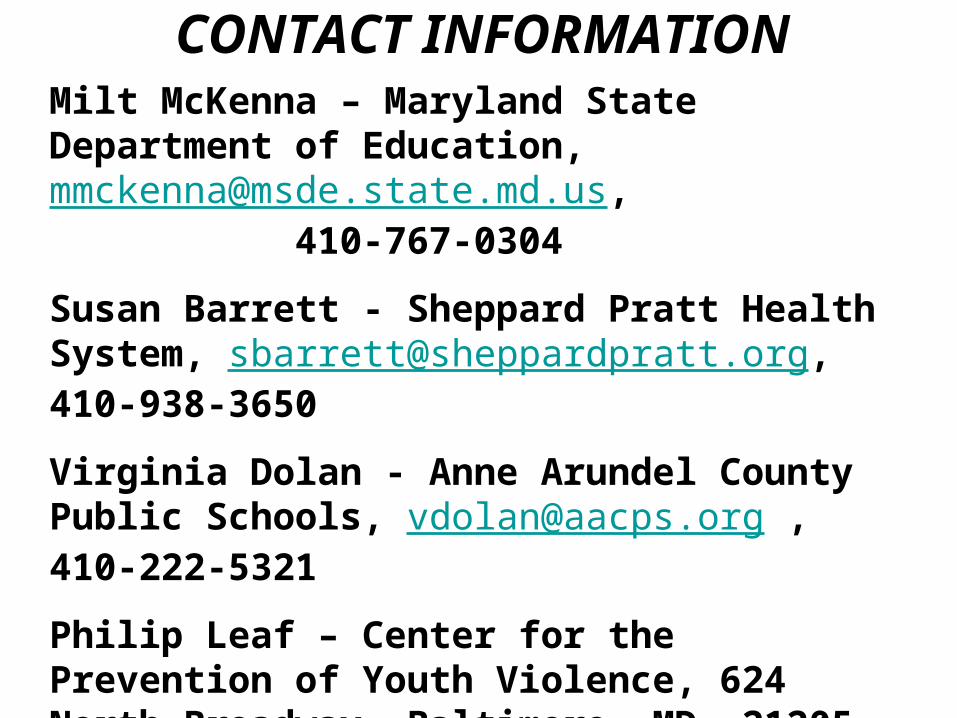
CONTACT INFORMATIONMilt McKenna – Maryland State Department of Education, [email protected], 410-767-0304
Susan Barrett - Sheppard Pratt Health System, [email protected], 410-938-3650
Virginia Dolan - Anne Arundel County Public Schools, [email protected] , 410-222-5321
Philip Leaf – Center for the Prevention of Youth Violence, 624 North Broadway, Baltimore, MD, 21205 [email protected] 410 955-3962
Jerry Bloom - Sheppard Pratt Health System, [email protected] , 410.938.4661

ACKNOWLWEDGEMENTS
• Maryland State Department of Education
• Sheppard Pratt Health System
• Johns Hopkins University
• 24 Local School Systems
• University of Oregon
Presentation Team
• Milt McKenna
• Susan Barrett
• Jerry Bloom
• Virginia Dolan
• Phil Leaf
Advanced Organizer
• Evolution of PBIS in MD
• Organization and Implementation Activities
• Evaluation Structure
• Lessons Learned
• Anne Arundel County School System
• Project Target (Evaluation)

Pennsylvania
Delaw
are
D.C.
Virginia
West Virginia
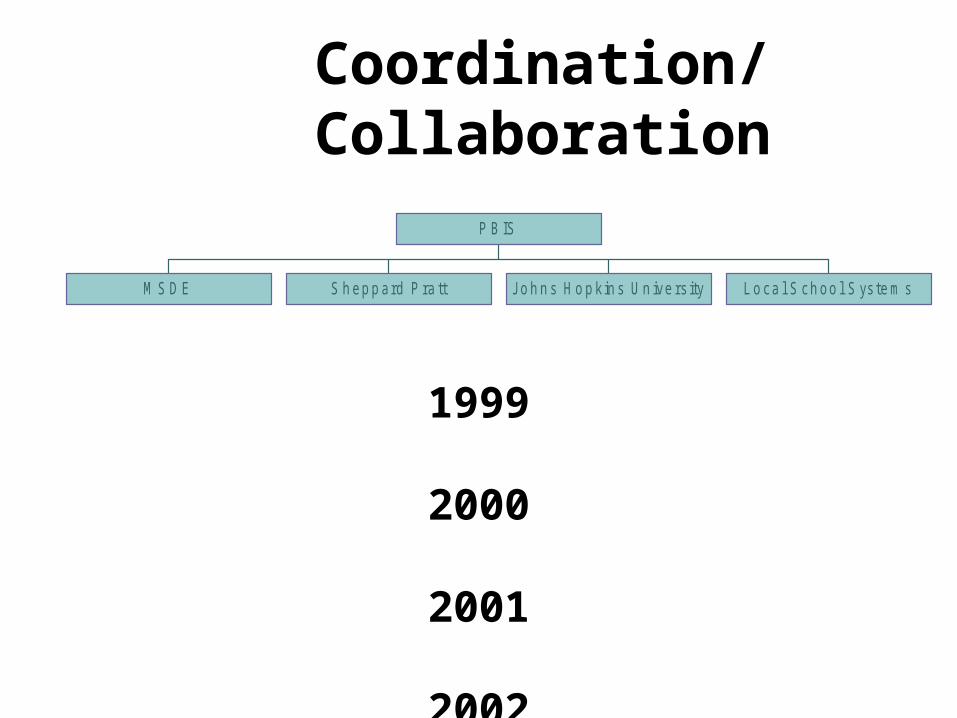
Coordination/ Collaboration
M S D E S h ep p ard P ra tt Jo h n s H o p k in s U n ive rs ity L o ca l S ch oo l S ys te m s
P B IS
1999 2000 2001 2002 2003 2004 2005

Participating PBIS Schools
Total Public Schools: 1380Elementary: 829Middle: 233Senior: 236Combined: 40Other 42Nonpublic 1157
:
PBIS Schools trained total: 276Participating: 228ES: 109K-8: 1MS: 73HS: 21Special: 10Alternative:14
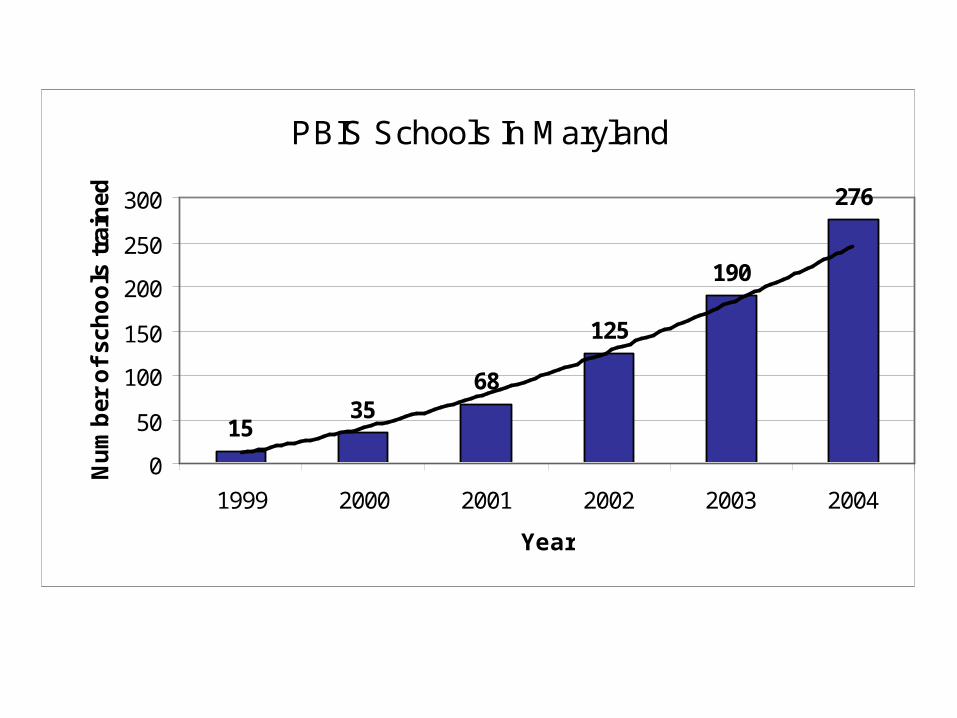
PBIS Schools In Maryland
1535
68
125
190
276
0
50
100
150
200
250
300
1999 2000 2001 2002 2003 2004
Year
Nu
mb
er o
f sc
ho
ols
tra
ined
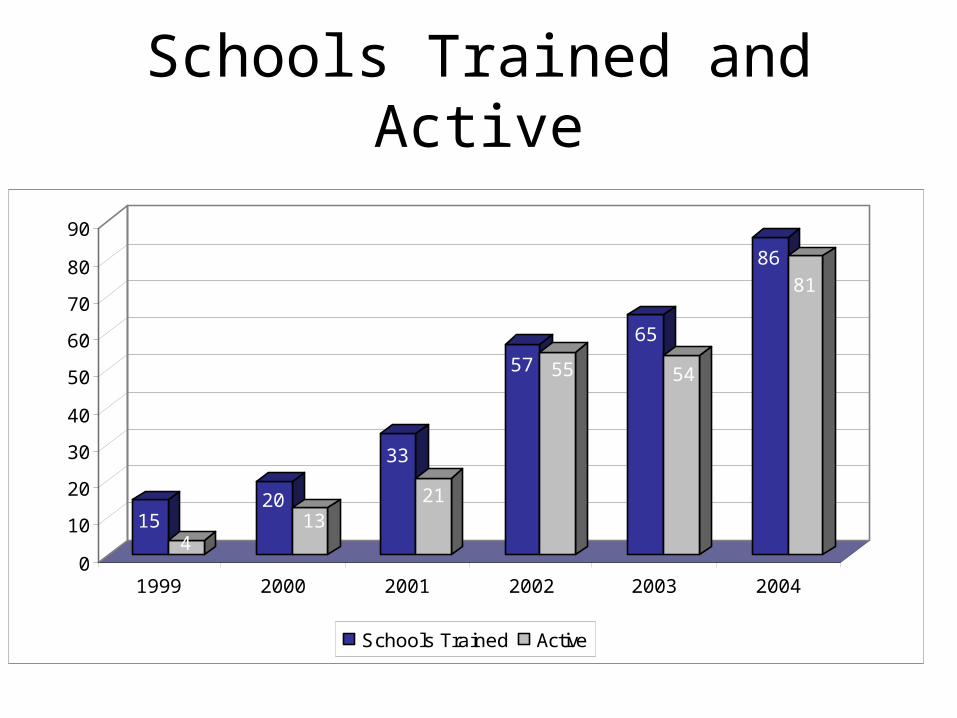
Schools Trained and Active
154
2013
33
21
57 55
65
54
86
81
0
10
20
30
40
50
60
70
80
90
1999 2000 2001 2002 2003 2004
Schools Trained Active
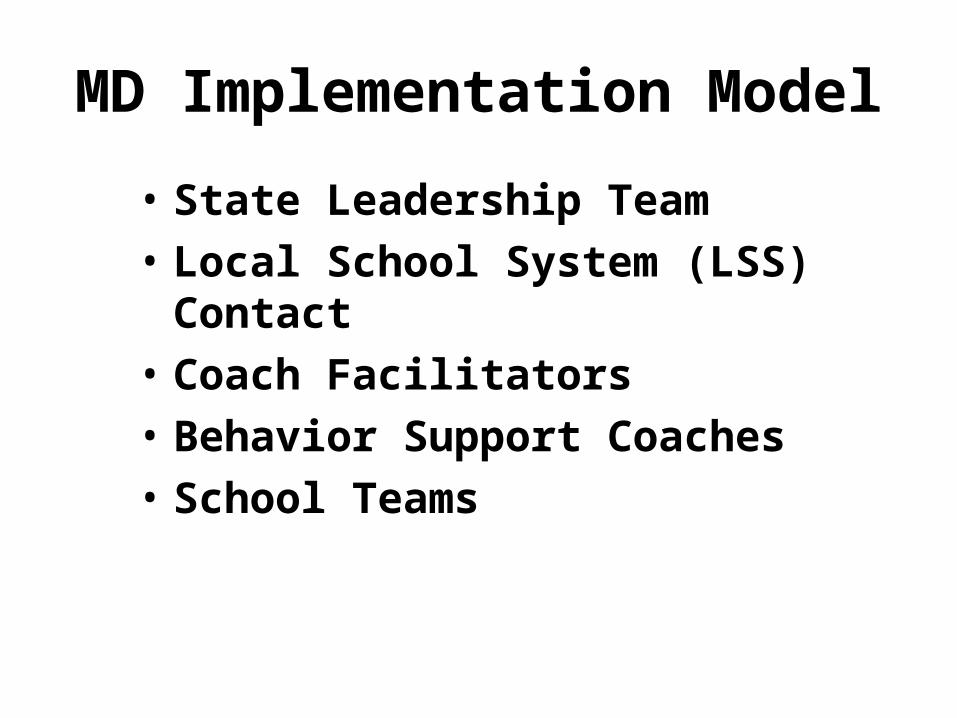
MD Implementation Model
• State Leadership Team
• Local School System (LSS) Contact
• Coach Facilitators
• Behavior Support Coaches
• School Teams
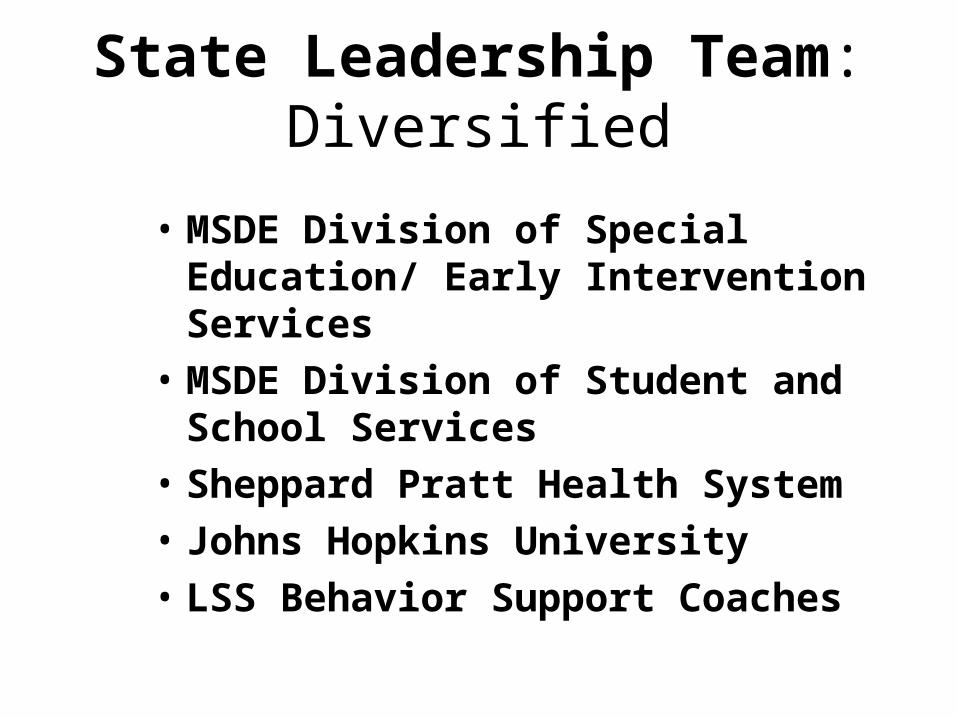
State Leadership Team:Diversified
• MSDE Division of Special Education/ Early Intervention Services
• MSDE Division of Student and School Services
• Sheppard Pratt Health System• Johns Hopkins University• LSS Behavior Support Coaches
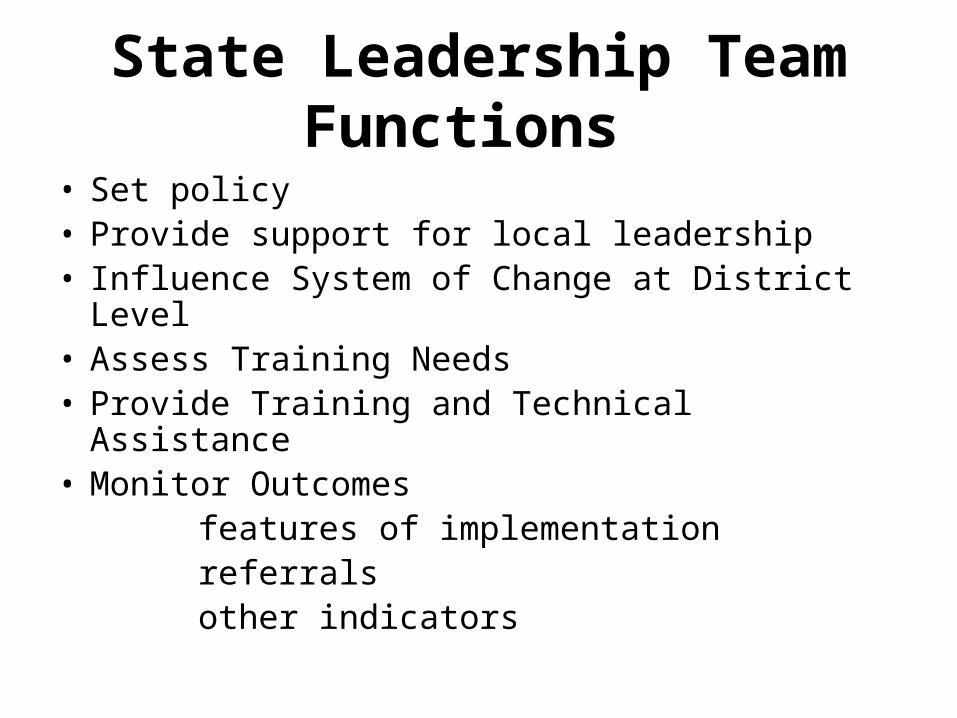
State Leadership Team Functions
• Set policy• Provide support for local leadership• Influence System of Change at District Level• Assess Training Needs• Provide Training and Technical Assistance• Monitor Outcomes features of implementation referrals other indicators
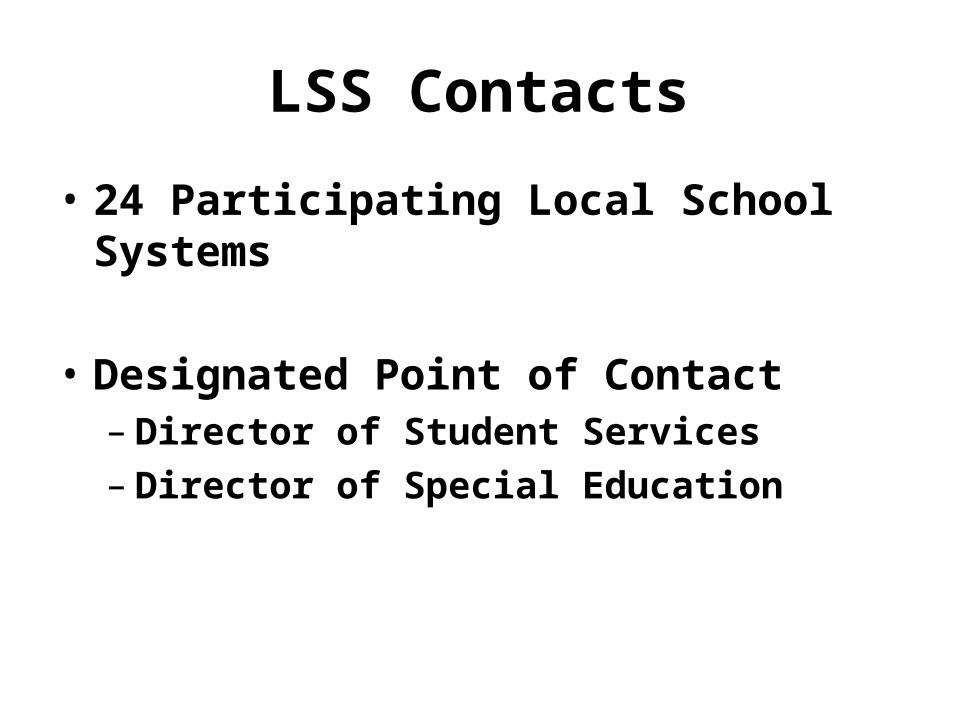
LSS Contacts
• 24 Participating Local School Systems
• Designated Point of Contact– Director of Student Services– Director of Special Education
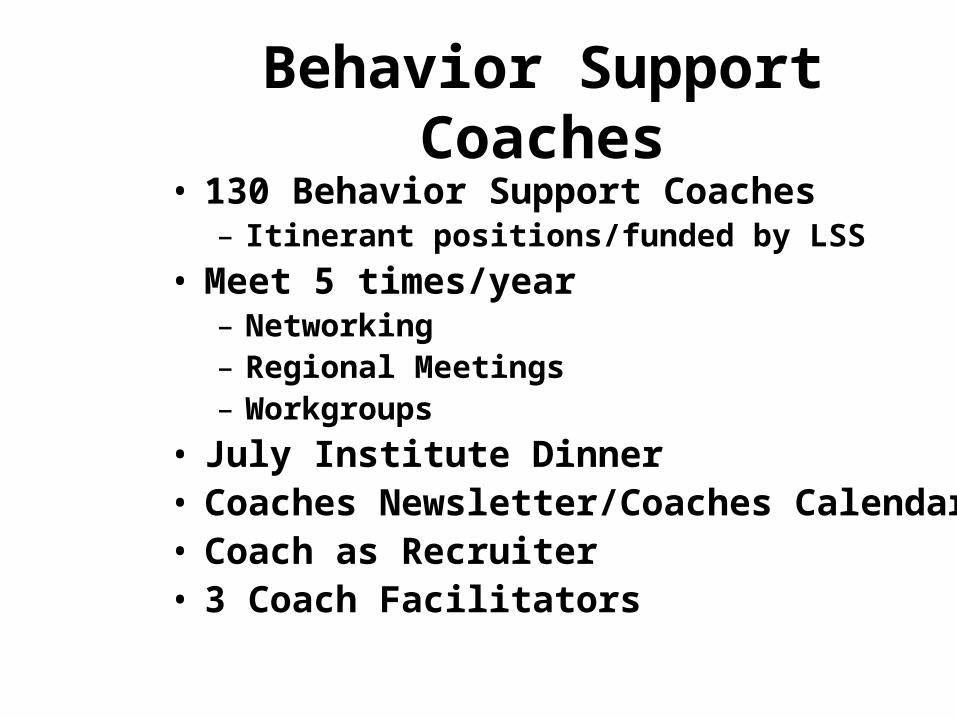
Behavior Support Coaches
• 130 Behavior Support Coaches– Itinerant positions/funded by LSS
• Meet 5 times/year– Networking– Regional Meetings– Workgroups
• July Institute Dinner• Coaches Newsletter/Coaches Calendar• Coach as Recruiter• 3 Coach Facilitators
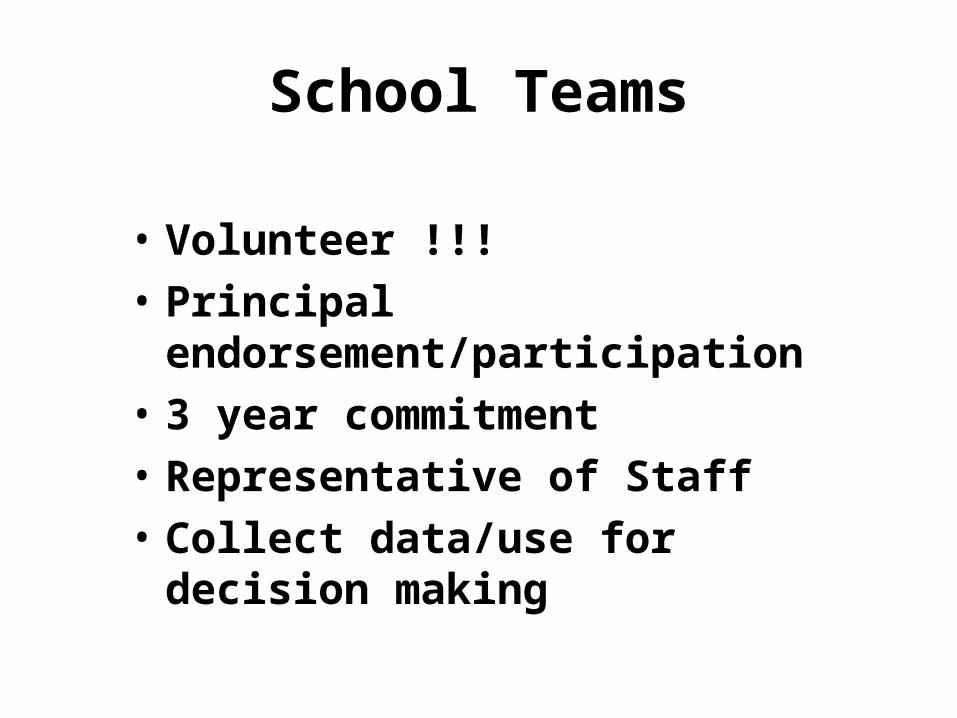
School Teams
• Volunteer !!!
• Principal endorsement/participation
• 3 year commitment
• Representative of Staff
• Collect data/use for decision making

Annual Events
• Spring Forum (May 4th)• July Institute (July 18-21)• Coaches Meetings (5/year)• Regional Team Leader/Coach Meetings
(2/year)• Schools serving students with special
needs - MANSEF (2/year)• High Schools – (2/year)
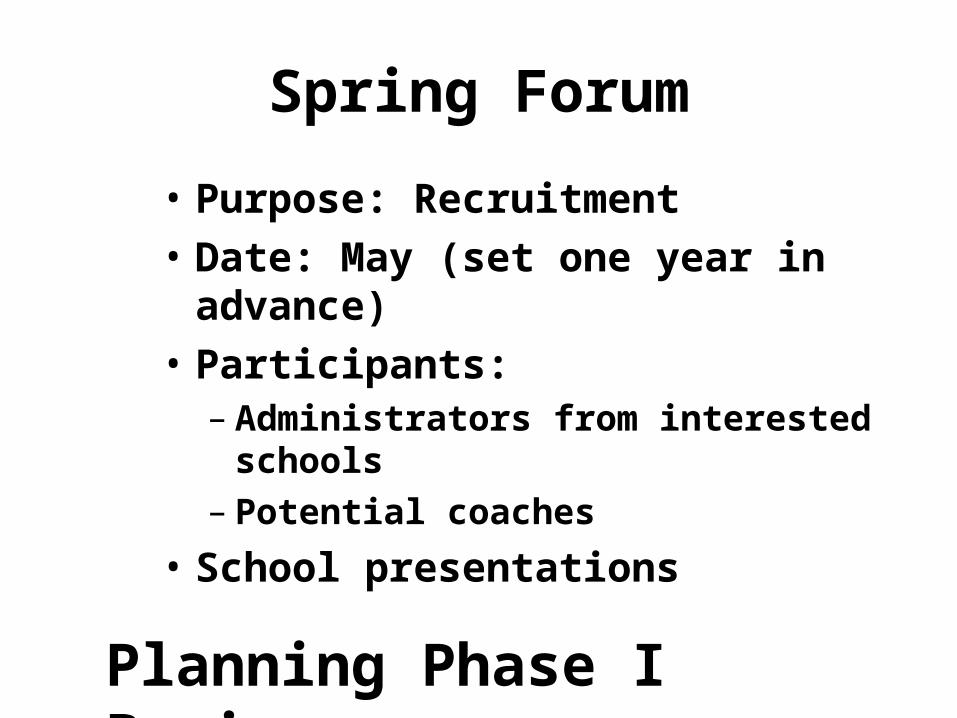
Spring Forum
• Purpose: Recruitment • Date: May (set one year in
advance)• Participants:
– Administrators from interested schools
– Potential coaches
• School presentations
Planning Phase I Begins
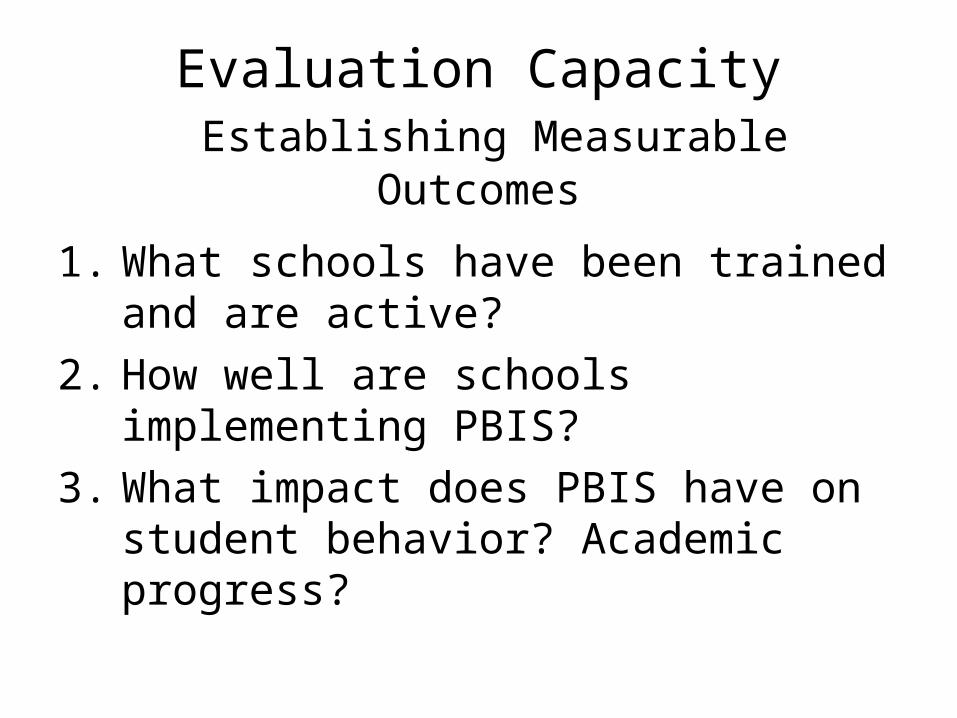
Evaluation Capacity Establishing Measurable Outcomes
1. What schools have been trained and are active?
2. How well are schools implementing PBIS?
3. What impact does PBIS have on student behavior? Academic progress?
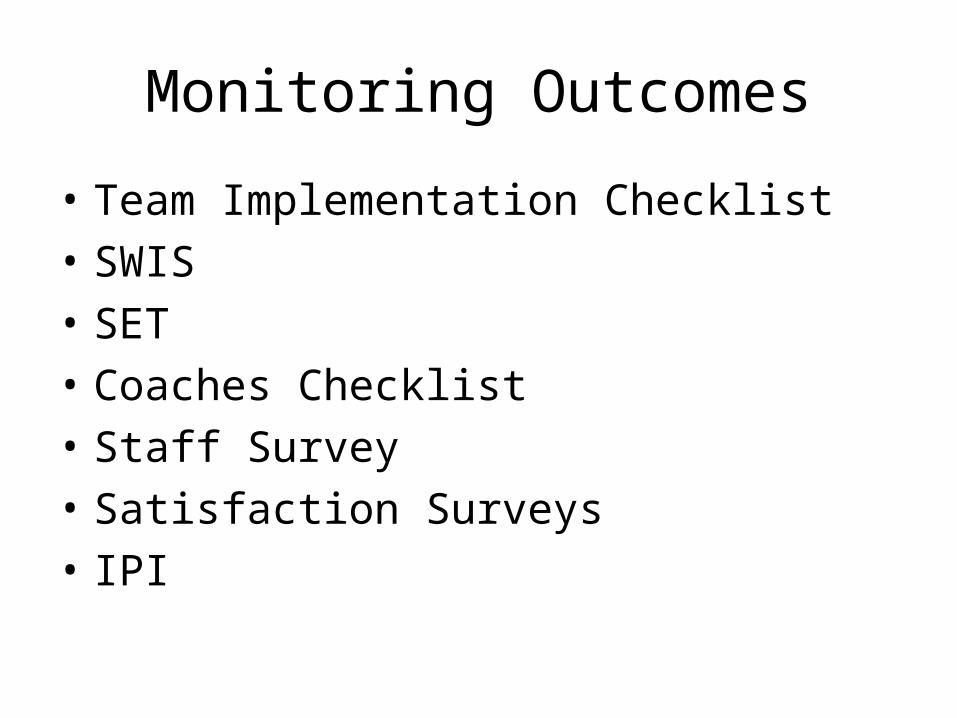
Monitoring Outcomes
• Team Implementation Checklist
• SWIS
• SET
• Coaches Checklist
• Staff Survey
• Satisfaction Surveys
• IPI
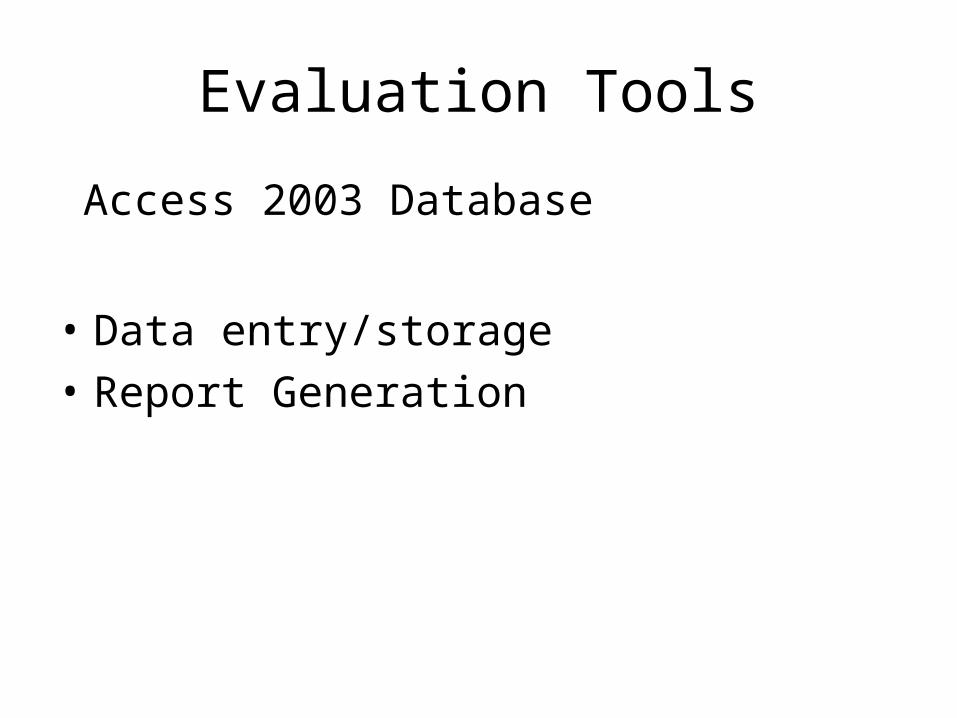
Evaluation Tools
Access 2003 Database
• Data entry/storage
• Report Generation
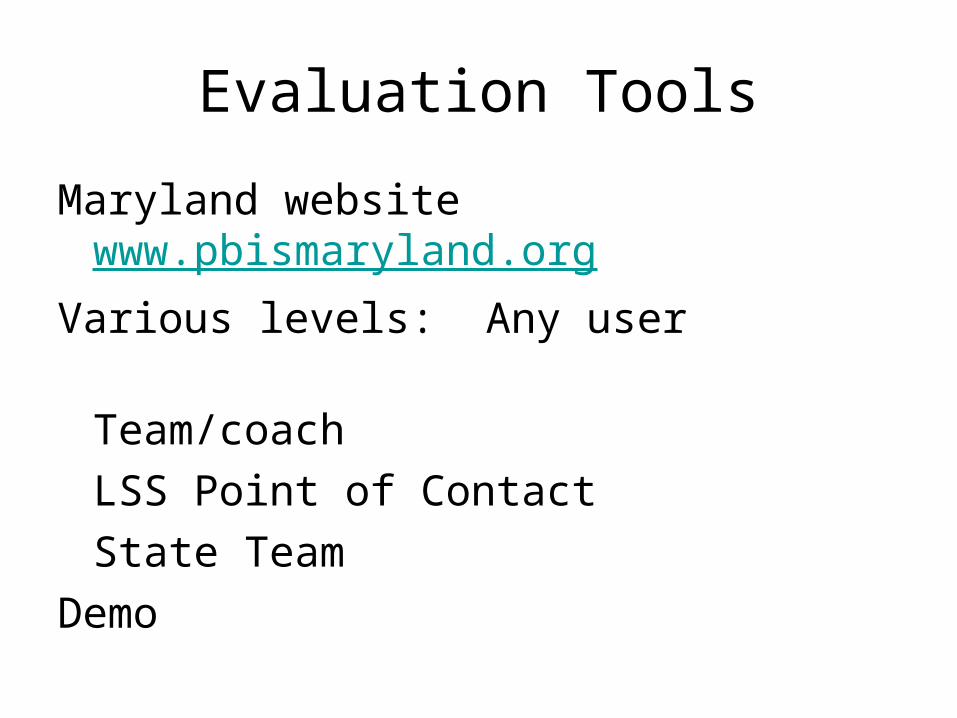
Evaluation Tools
Maryland website www.pbismaryland.org
Various levels: Any user
Team/coach
LSS Point of Contact
State Team
Demo
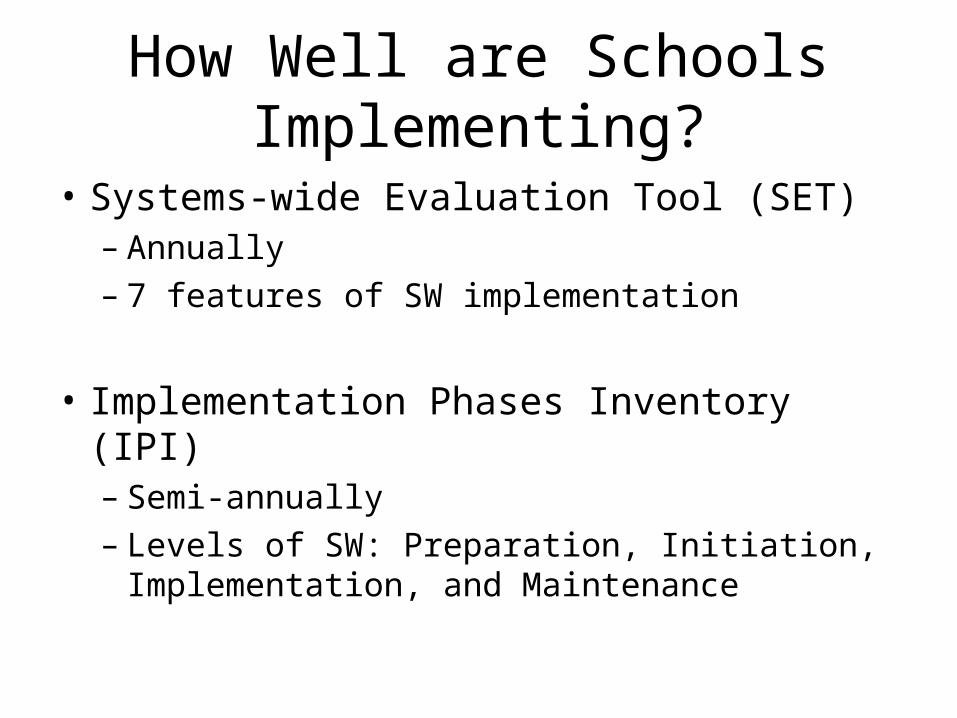
How Well are Schools Implementing?
• Systems-wide Evaluation Tool (SET)– Annually– 7 features of SW implementation
• Implementation Phases Inventory (IPI)– Semi-annually– Levels of SW: Preparation, Initiation,
Implementation, and Maintenance
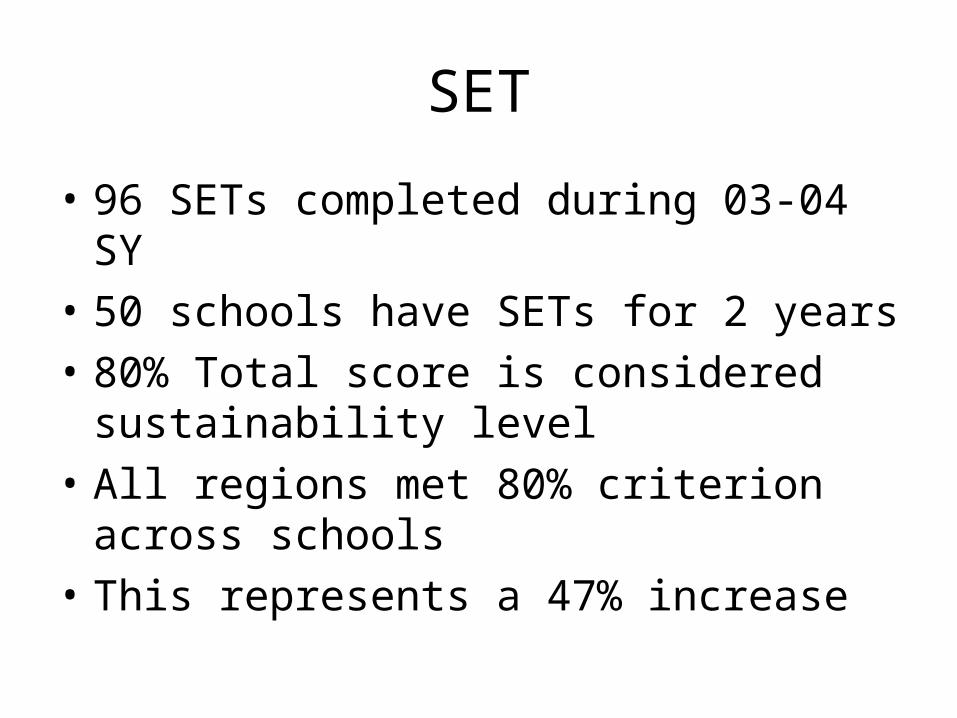
SET
• 96 SETs completed during 03-04 SY
• 50 schools have SETs for 2 years
• 80% Total score is considered sustainability level
• All regions met 80% criterion across schools
• This represents a 47% increase
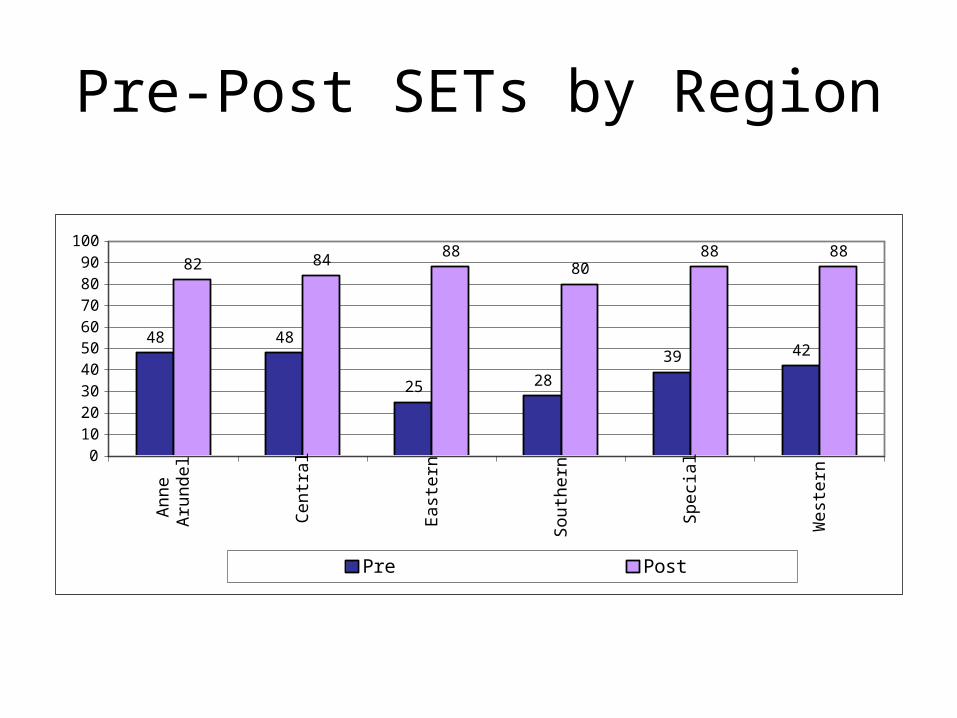
Pre-Post SETs by Region
48 48
25 28
39 42
82 8488
808888
0102030405060708090
100
Ann
eA
rund
el
Cen
tral
Eas
tern
Sou
ther
n
Spe
cial
Wes
tern
Pre Post
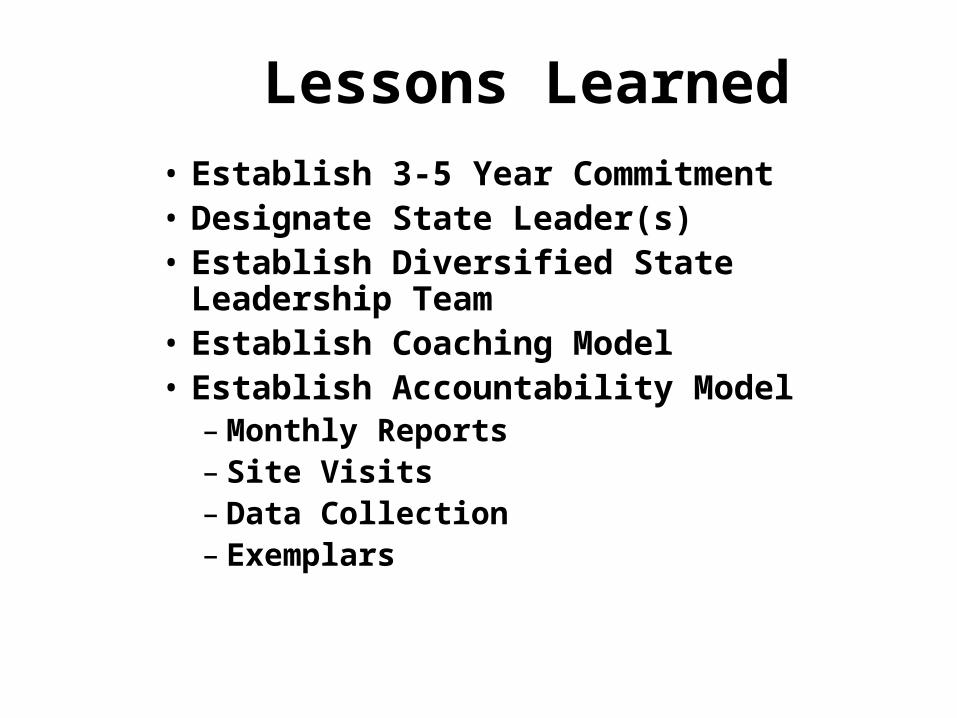
Lessons Learned
• Establish 3-5 Year Commitment• Designate State Leader(s)• Establish Diversified State Leadership
Team• Establish Coaching Model• Establish Accountability Model
– Monthly Reports– Site Visits– Data Collection– Exemplars
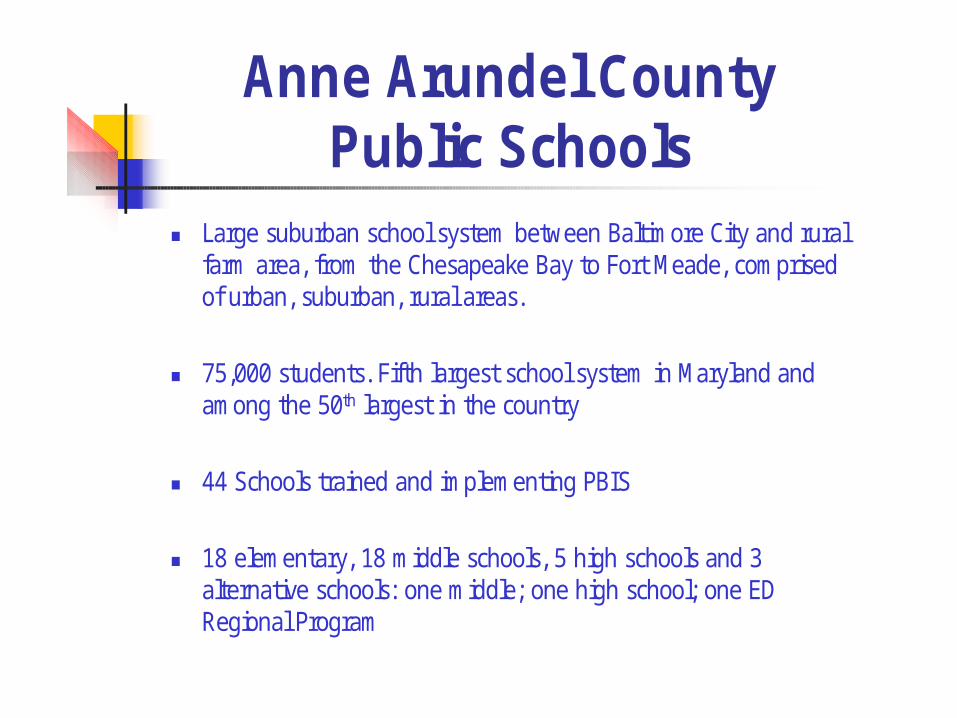
Anne Arundel County Public Schools
Large suburban school system between Baltimore City and rural farm area, from the Chesapeake Bay to Fort Meade, comprised of urban, suburban, rural areas.
75,000 students. Fifth largest school system in Maryland and among the 50th largest in the country
44 Schools trained and implementing PBIS
18 elementary, 18 middle schools, 5 high schools and 3 alternative schools: one middle; one high school; one ED Regional Program

Anne Arundel County Schools Trained
1 2
8
44
19
0
5
10
15
20
25
30
35
40
45
50
2000 2001 2002 2003 2004
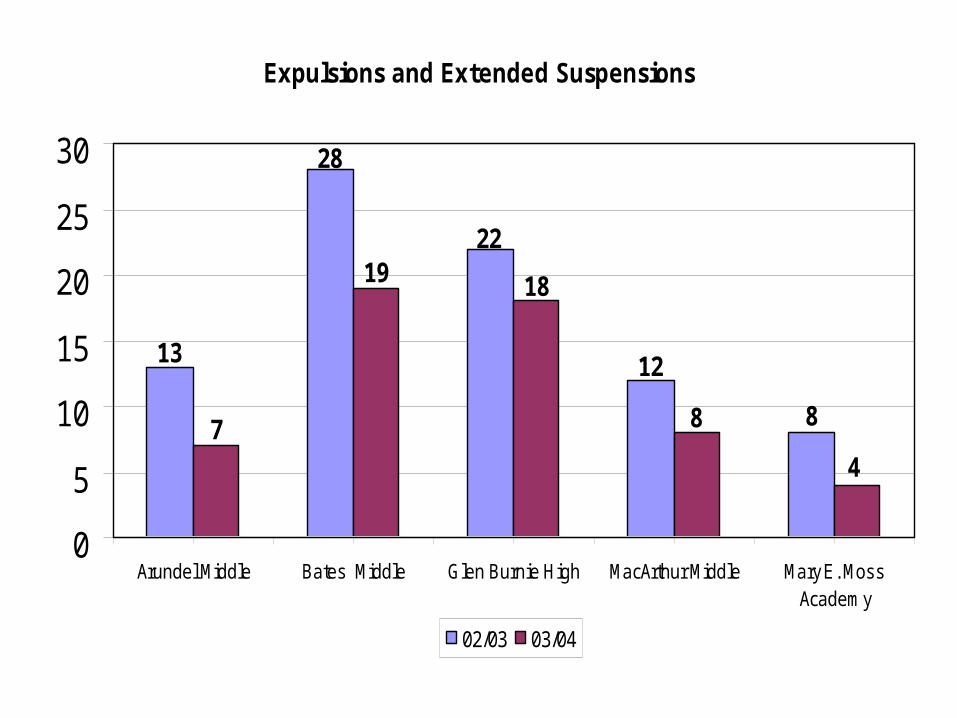
Expulsions and Extended Suspensions
8
1213
28
22
7
18
8
4
19
0
5
10
15
20
25
30
Arundel Middle Bates Middle Glen Burnie High MacArthur Middle Mary E. MossAcademy
02/03 03/04
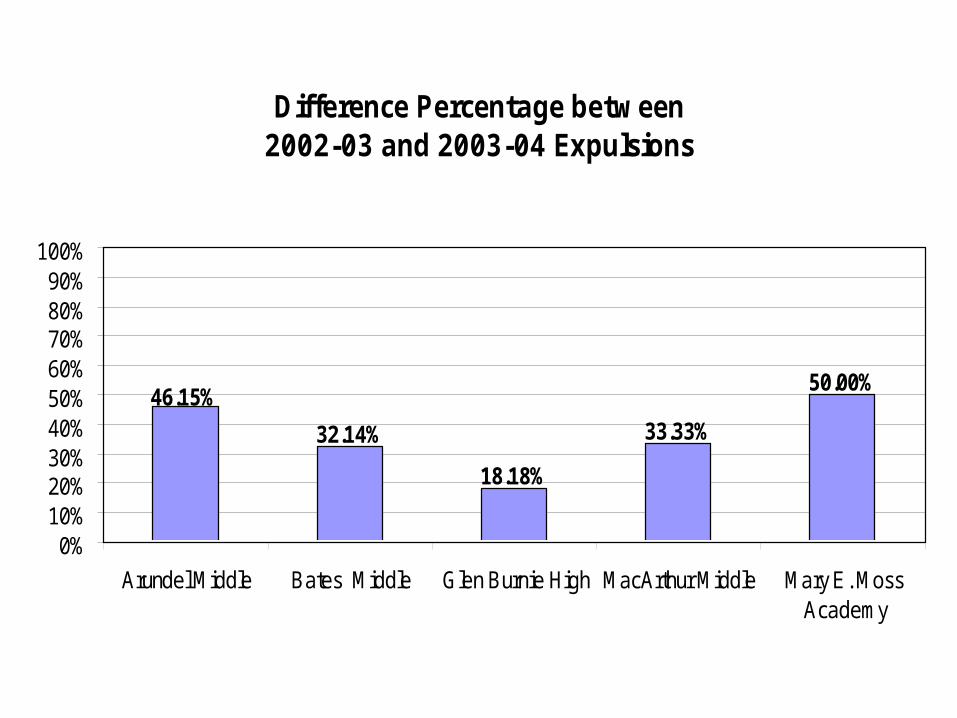
Difference Percentage between 2002-03 and 2003-04 Expulsions
50.00%
33.33%
18.18%
32.14%
46.15%
0%10%20%30%40%50%60%70%80%90%
100%
Arundel Middle Bates Middle Glen Burnie High MacArthur Middle Mary E. MossAcademy
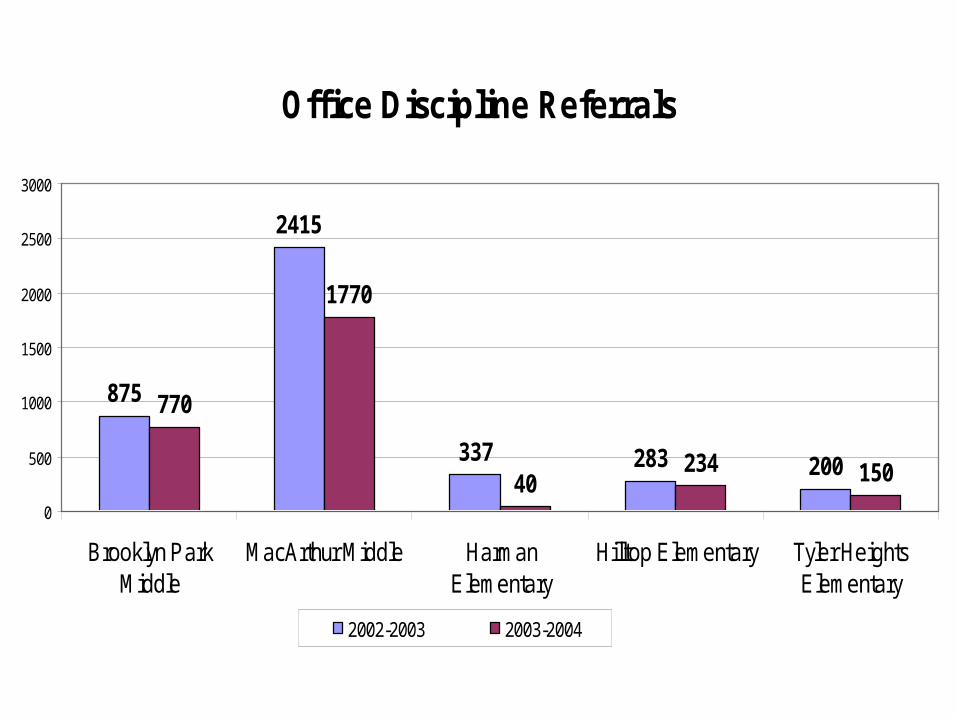
Office Discipline Referrals
875
2415
337 283 200
770
1770
40234 150
0
500
1000
1500
2000
2500
3000
Brooklyn ParkMiddle
MacArthur Middle HarmanElementary
Hilltop Elementary Tyler HeightsElementary
2002-2003 2003-2004
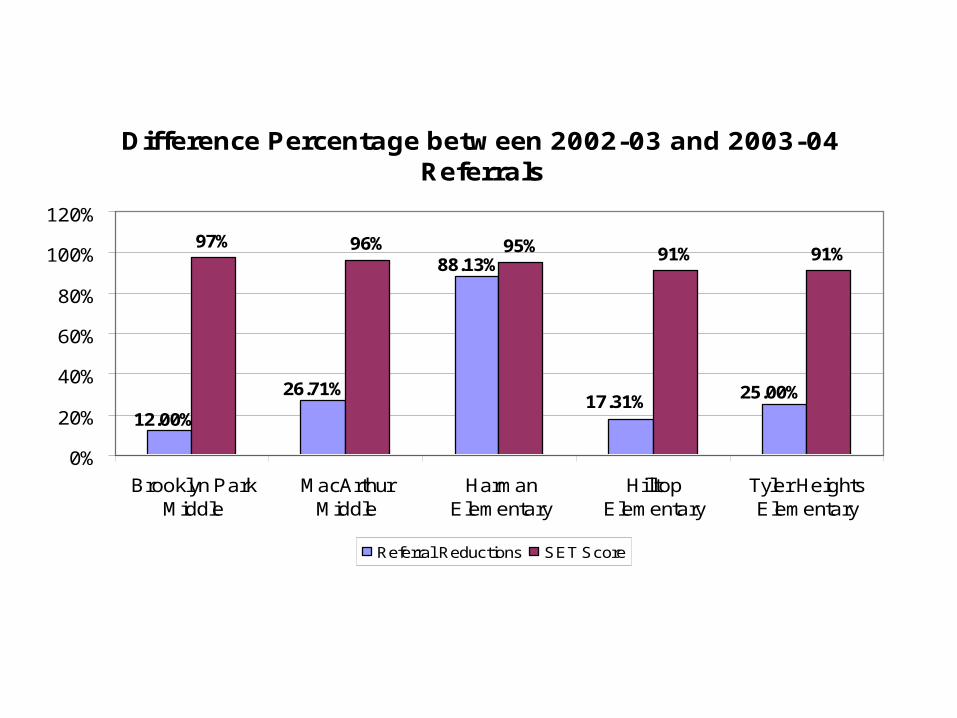
Difference Percentage between 2002-03 and 2003-04 Referrals
97% 96% 95% 91% 91%
25.00%
88.13%
26.71%
12.00%17.31%
0%
20%
40%
60%
80%
100%
120%
Brooklyn ParkMiddle
MacArthurMiddle
HarmanElementary
HilltopElementary
Tyler HeightsElementary
Referral Reductions SET Score
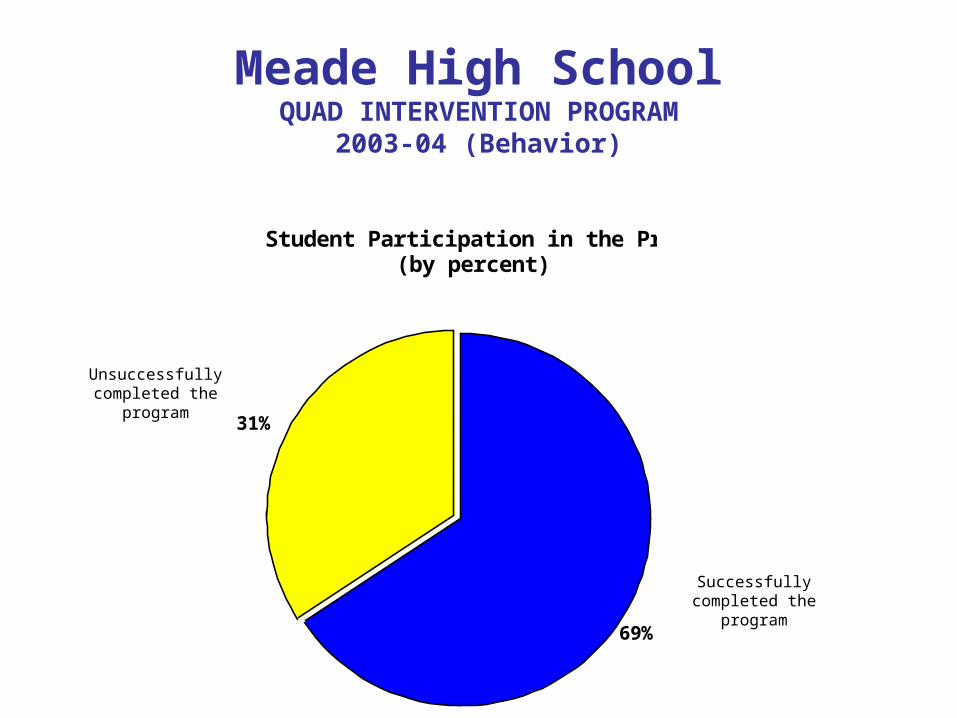
Student Participation in the Program (by percent)
31%
69%
Meade High SchoolQUAD INTERVENTION PROGRAM
2003-04 (Behavior)
Unsuccessfullycompleted the
program
Successfullycompleted the
program
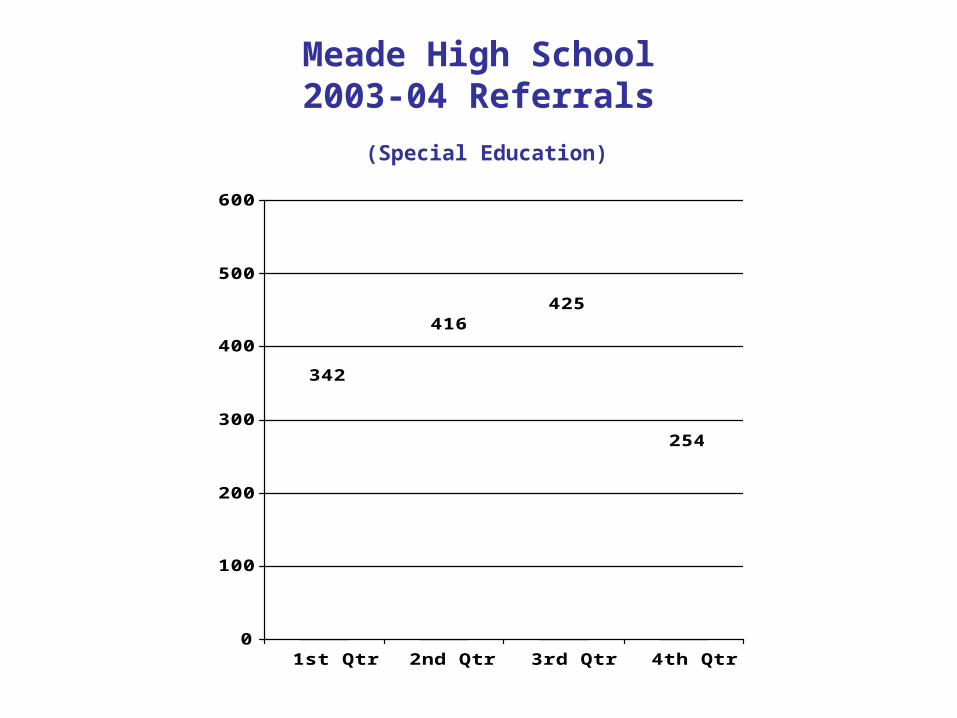
416
342
425
254
0
100
200
300
400
500
600
1st Qtr 2nd Qtr 3rd Qtr 4th Qtr
Meade High School2003-04 Referrals
(Special Education)

600
404
683
461
0
100
200
300
400
500
600
700
1st Qtr 2nd Qtr 3rd Qtr 4th Qtr
Meade High School2003-04 Referrals
(9TH Grade)

MacArthur Middle School Discipline Data
486
1040
889
636
716
829
0
200
400
600
800
1000
1200
6th Grade 7th Grade 8th Grade
Nu
mb
er o
f O
ffic
e R
efer
rals
2003
2004
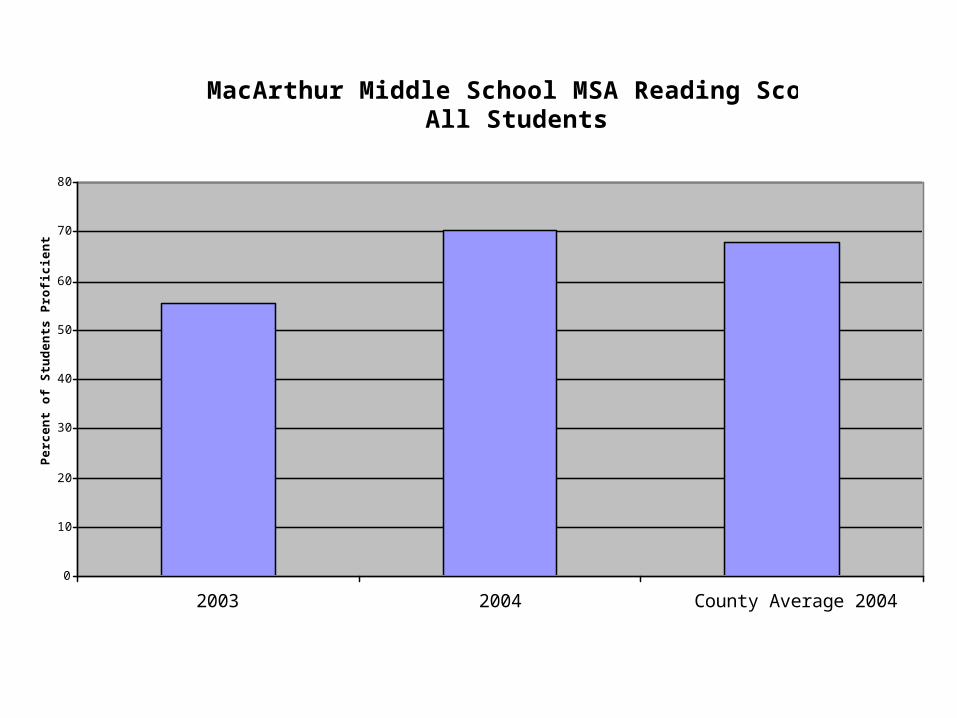
MacArthur Middle School MSA Reading Scores - All Students
0
10
20
30
40
50
60
70
80
2003 2004 County Average 2004
Per
cen
t o
f S
tud
ents
Pro
fici
ent
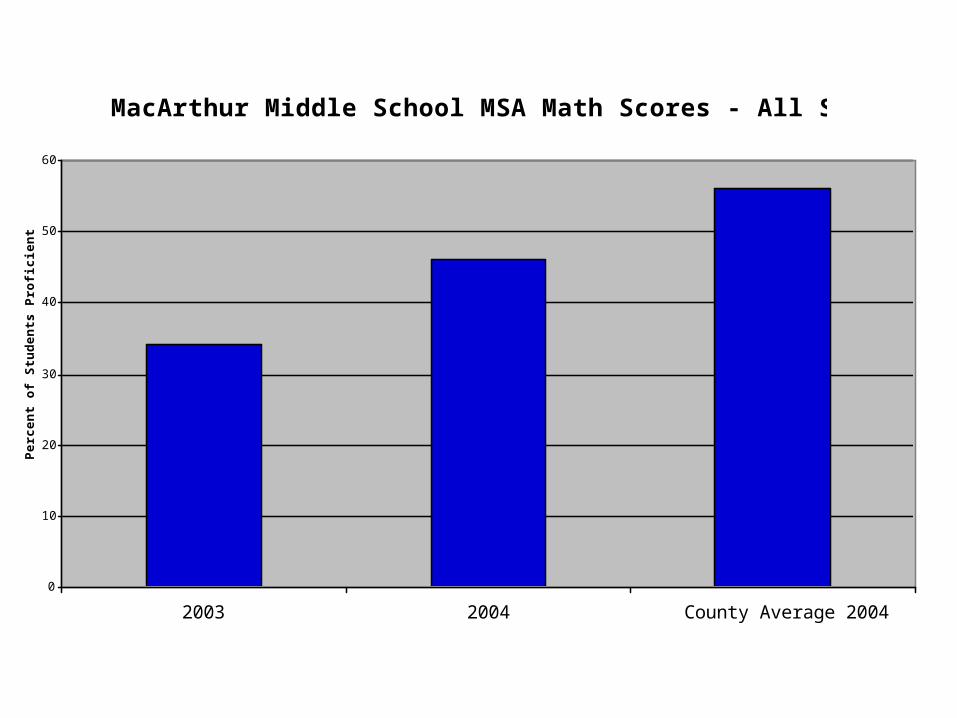
MacArthur Middle School MSA Math Scores - All Students
0
10
20
30
40
50
60
2003 2004 County Average 2004
Per
cen
t o
f S
tud
ents
Pro
fici
ent
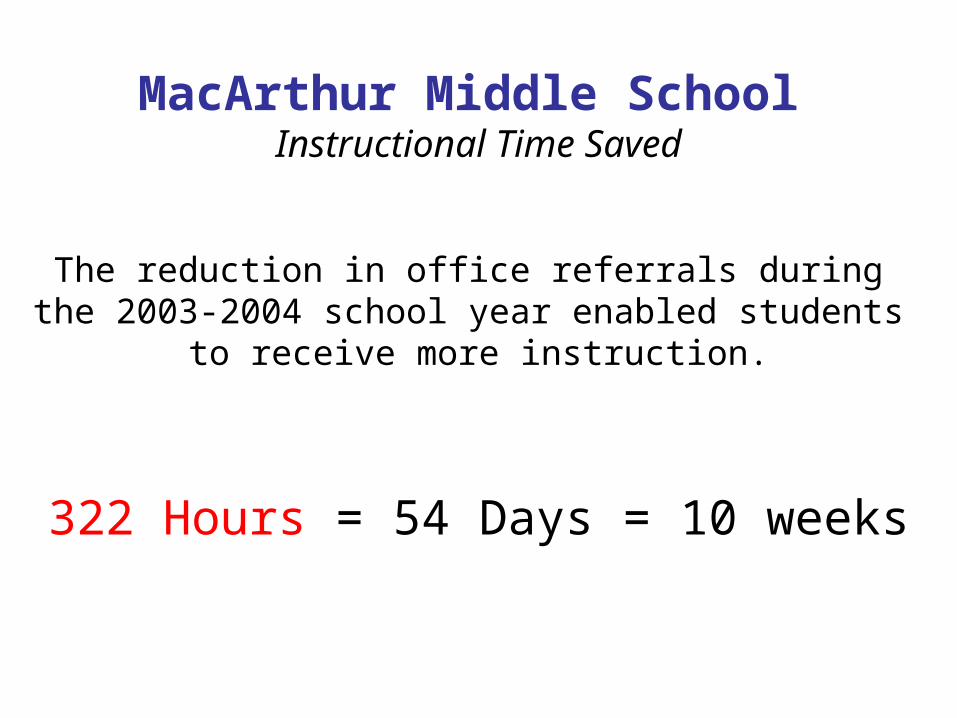
MacArthur Middle School Instructional Time Saved
The reduction in office referrals during the 2003-2004 school year enabled students
to receive more instruction.
322 Hours = 54 Days = 10 weeks

Linking Behavior Improvements to Academic Achievement-
Percent Advanced & Proficient on MSA
0
10
20
30
40
50
60
70
80
90
100
3rd gradereading
3rd grade Math 5th gradereading
5th grade math
2002-2003
2003-2004
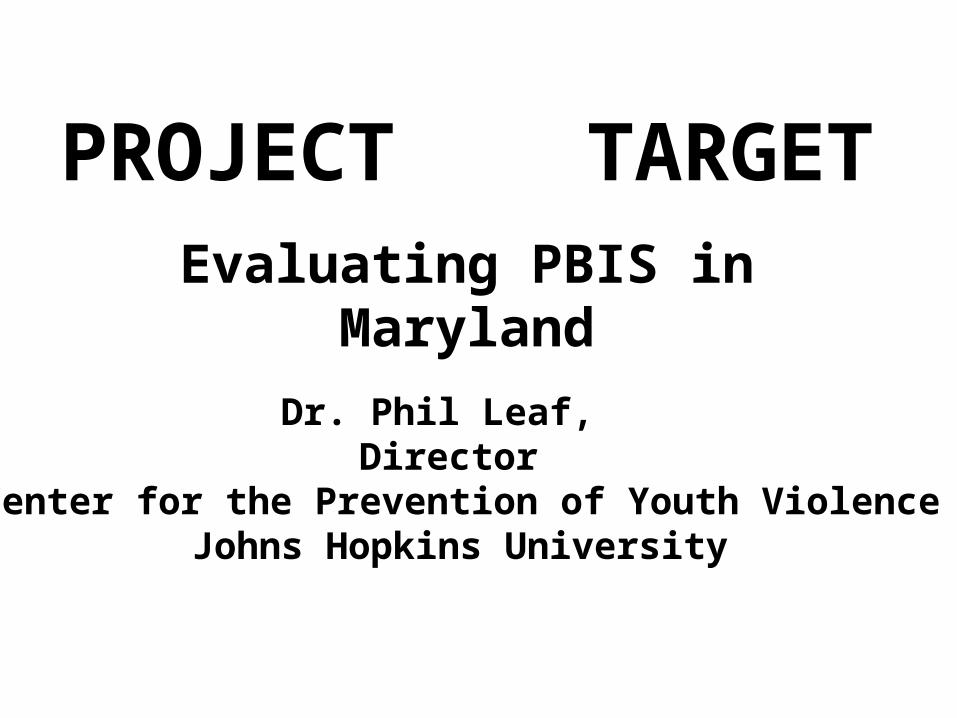
PROJECT TARGETEvaluating PBIS in Maryland
Dr. Phil Leaf, Director
Center for the Prevention of Youth ViolenceJohns Hopkins University

Big picture …..How do you change individual behavior in schools?
How do you create school environments that sustain change?
What system-level mechanisms and infrastructure are necessary to sustain and bring to scale interventions that create desired change?
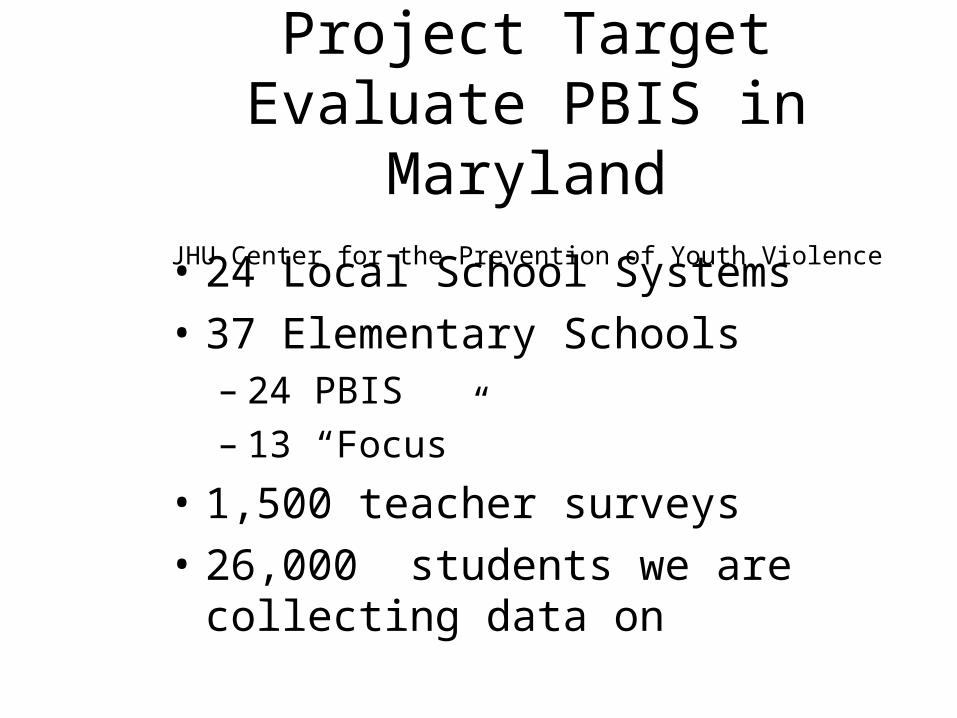
Project TargetEvaluate PBIS in Maryland
JHU Center for the Prevention of Youth Violence • 24 Local School Systems
• 37 Elementary Schools– 24 PBIS– 13 “Focus”
• 1,500 teacher surveys
• 26,000 students we are collecting data on

Project TargetEvaluate PBIS in Maryland
JHU Center for the Prevention of Youth Violence
Academic Achievement Suspensions and Expulsions Teacher Ratings of Disruptive Behavior Referrals for Special Education Services Staff Satisfaction and Turnover Student Assessment of Climate

So What Have We Discovered ??

Useful Web Links
• Maryland
– www.pbismaryland.org
• Oregon
– www.pbis.org