Copyright 2017 FUJITSU LIMITED Arm HPC Workshop Application Development Tools for Post-K Supercomputer 13 th December 2017 Tomotake NAKAMURA Performance Analysis Dept. Compiler Development Div. Next Generation Technical Computing Unit FUJITSU LIMITED 0
Transcript
Copyright 2017 FUJITSU LIMITED
Arm HPC Workshop
Application Development Toolsfor Post-K Supercomputer
13th December 2017Tomotake NAKAMURAPerformance Analysis Dept. Compiler Development Div.Next Generation Technical Computing UnitFUJITSU LIMITED
0
Copyright 2017 FUJITSU LIMITED
Profiler, debugger and IDE for K computer
Direction of tools’ enhancements for Post-K
Cases of collaboration with OSSmpiP
Eclipse PTP
Exporting profilers’ data in XML format
Summary
Outline
1
Copyright 2017 FUJITSU LIMITED
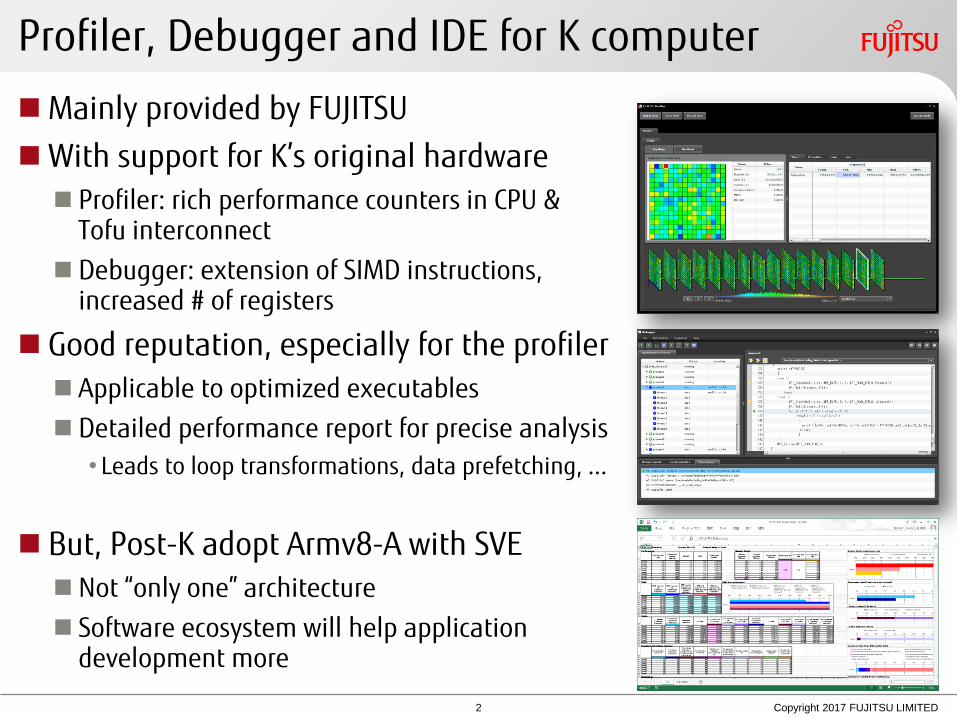
Mainly provided by FUJITSU
With support for K’s original hardware Profiler: rich performance counters in CPU &
Tofu interconnect
Debugger: extension of SIMD instructions,increased # of registers
Good reputation, especially for the profiler Applicable to optimized executables
Detailed performance report for precise analysis
•Leads to loop transformations, data prefetching, ...
But, Post-K adopt Armv8-A with SVE Not “only one” architecture
Software ecosystem will help applicationdevelopment more
Profiler, Debugger and IDE for K computer
2
Copyright 2017 FUJITSU LIMITED
Many OSS middleware on K computer Linux OS, Lustre file system (customized), Open MPI (customized), GCC, ...
As profilers: mpiP (customized), VampirTrace (integrated), Score-P, TAU, ...
Advantages of OSS-based development tools Lowering barrier for new users by compatibility and existing know-how
Various attempts in user interfaces for usability
For Post-K, while enhancing own profilers’ capability,Fujitsu will integrate OSS technologies for the above advantages
Direction of Tools’ Enhancements for Post-K
3
IDE for K computerEclipse PTP
Copyright 2017 FUJITSU LIMITED
mpiP: lightweight profiling library for MPI applications Generates simple report in text format, in contrast to much info. by Fujitsu’s one
Customized and provided by Fujitsu since PRIMEHPC FX100 Enhancement: additional MPI_Barrier before/after collective communications
•To distinguish wasted time caused by load imbalance among processes
More than one choice is reasonable for profilers Degree of richness of generated reports
Various attempts in user interfaces for performance analysis
Cases of Collaboration with OSS: mpiP
4
Communication Statistics by Fujitsu’s Profiler Example of mpiP Report
Copyright 2017 FUJITSU LIMITED
Eclipse PTP: IDE for development of parallel applications Editing source code, job submission & monitoring, …
Adopted to simplify workflow of development & perf. analysis Key feature: “synchronized project” functionality
Switching from WWW-based framework, offline work becomes easy
Integration of profilers is under development
Cases of Collaboration with OSS: Eclipse PTP
5
(Source: Eclipse PTP Tutorial)
Copyright 2017 FUJITSU LIMITED
Fujitsu’s profilers gather much data and generate detailed reports
But, there could be too many analysis views to be covered by the product
On Post-K, profilers’ data can be exported in XML as well as text and CSV formats Tool developers and perf. engineers are welcome to collaborate on UIs
Colored according to bottlenecksred: cache&memory blue: calculation
green: well-executed
Copyright 2017 FUJITSU LIMITED
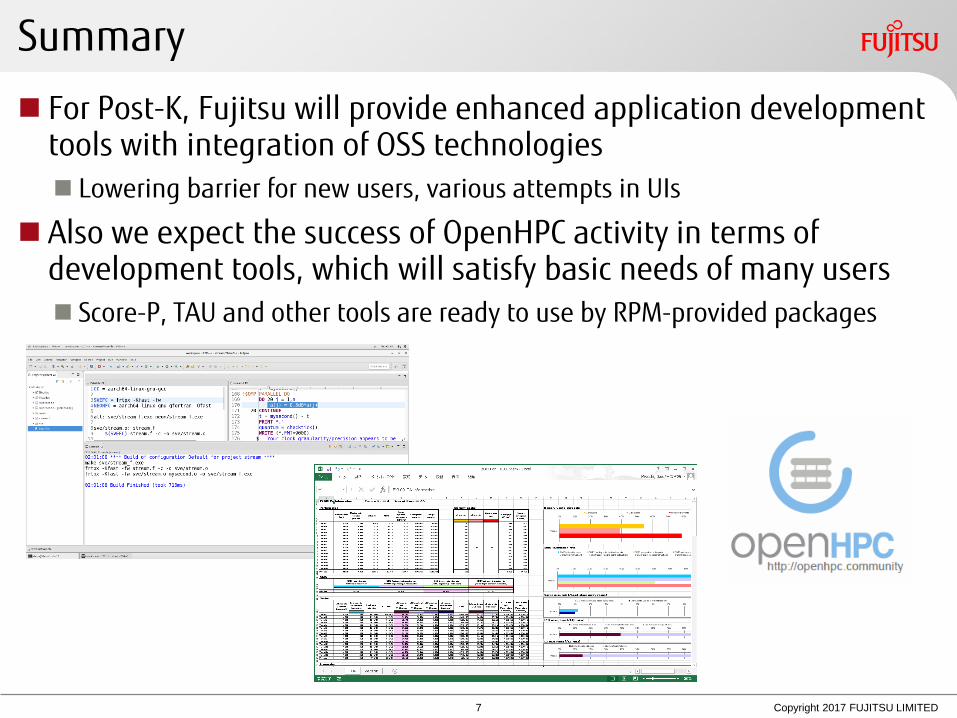
For Post-K, Fujitsu will provide enhanced application development tools with integration of OSS technologies Lowering barrier for new users, various attempts in UIs
Also we expect the success of OpenHPC activity in terms of development tools, which will satisfy basic needs of many users Score-P, TAU and other tools are ready to use by RPM-provided packages