Post-transcriptional knowledge in pathway analysis increases the accuracy of phenotypes classification This manuscript has been published in Oncotarget Vol 7, No 34. If you are using this work please refer to: Alaimo, S., Giugno, R., Acunzo, M., Veneziano, D., Ferro, A., & Pulvirenti, A. (2016). Post-transcriptional knowledge in pathway analysis increases the accuracy of phenotypes classification. Oncotarget.(http://dx.doi.org/10.18632/oncotarget.9788)
Transcript
Post-transcriptional knowledge inpathway analysis increases the accuracyofphenotypesclassification
AbstractMotivation:Predictionofphenotypesfromhigh-dimensionaldataisacrucialtaskinprecisionbiologyandmedicine. Many technologies employ genomic biomarkers to characterize phenotypes. However, suchelementsarenotsufficienttoexplaintheunderlyingbiology.Toimprovethis,pathwayanalysistechniqueshavebeenproposed.Nevertheless,suchmethodshaveshownlackofaccuracyinphenotypesclassification.
Results: HereweproposeanovelmethodologycalledMITHrIL(MirnaenrIchedpaTHwayImpactanaLysis)for theanalysisof signalingpathways,whichhasbuilton topof theworkofTarcaetal.,2009. MITHrILextendspathwaysbyaddingmissingregulatoryelements,suchasmicroRNAs,andtheir interactionswithgenes.Themethodtakesas input theexpressionvaluesofgenesand/ormicroRNAsandreturnsa listofpathways sorted according to their deregulation degree, together with the corresponding statisticalsignificance (p-values).Our analysis shows that MITHrIL outperforms its competitors even in theworstcase.Inaddition,ourmethodisabletocorrectlyclassifysetsoftumorsamplesdrawnfromTCGA.
IntroductionThe prediction of phenotypes, such as diseases, or of responses to therapies from the large amount ofgenotypichigh-dimensionaldataobtainedthroughNext-GenerationSequencingtechniquesisanextremelyimportanttaskintranslationalbiologyandprecisionmedicine.However,thegapbetweencurrentanalysistechniquesandtheabilitytoobtainaccurateknowledgeisbroad.
High-throughput sequencing and gene profiling techniques are radically transforming medical research,allowingthefullmonitoringofabiologicalsystem.Theuseofthesetechnologiestypicallygeneratesalistofdifferentiallyexpressedelements(i.e.genesormicroRNAs)whosebehaviorvariessignificantlyamongthephenotypesunderexamination.
Furthermore, compared to traditional gene expression extraction techniques (eg. Microarray), deepsequencing methods, such as RNA-Seq, provide much larger lists of differentially expressed genes,increasing, therefore, the complexity of the analysis. The common approach to simplify and make theanalysis of such datamore fruitful consisted in grouping genes into smaller sub-sets according to somerelationship, leveragingonexistingknowledge-bases suchasontologiesorpathways.Theanalysisof this
*Towhomcorrespondenceshouldbeaddressed.
type of data at the functional level is crucial since it allows a strong reduction of dimensionality, thusprovidinggreaterinsightsonthebiologyofthephenomenonunderstudy[1].
An extensive class of techniques known asPathwayAnalysis [2] goes in this direction. In the past, suchtermhasbeenassociatedtotheanalysisofontologicalterms,protein-proteininteraction(PPI)networks,orto the inference of gene regulatory networks from expression data. More recently, great interest hasshifted toward a class of methods called Knowledge base-driven pathway analysis [3]. Such methodsleverage on existing databases, such as the Kyoto Encyclopedia of Gene and Genomes (KEGG) [4, 5] orPathwayCommons[6],toidentifythosepathwaysthatmaybeaffectedbytheexpressionchangesintheobserved phenotype. Knowledge base-driven pathway analysis techniques can be grouped into threegenerationsofapproaches[3]:i)Over-RepresentationAnalysis(ORA);ii)FunctionalClassScoring(FCS);iii)PathwayTopology-based(PT).
First-generationmethodsstatisticallyevaluate thenumberofalteredgenes inapathwaywith respect tothesetofallanalyzedgenes.Afterfilteringtheresultinggenesetofanexpressionassessmentexperiment,ORAstrategies[7-13]typicallydividethelistofgenesaccordingtothepathwayeachgenebelongsto.Byapplyinganhypothesistest(i.e.hypergeometric,chi-square,orbinomial)theyareabletodetermineifthenumber of such genes is over- or under-represented. These methods, however, have some majorlimitations. Firstly, considering only the number of differentially expressed genes, while omitting theirexpression,impliesthatthemagnitudeoftheirchangebeunimportantforpathwayactivity.Furthermore,consideringonlystatisticallysignificantdifferentialexpressionmayexcludethosegeneswhosecoordinatedalterationmay lead to remarkable effects, although their differential expressionmay not be statisticallysignificant.Finally,theyconsiderindividualgenesandpathways,respectively,inanmannerindependentofthesurroundingbiologicalcontext,eludingwhattrulyhappensinreality.
Afirstgenerationmethod,DIANA-miRPath[14],assessestheimpactofmiRNAsinbiologicalprocessesbyidentifying the pathways in which they are significantly involved. The software employs a functionalannotationofoneormoremiRNAsbymeansofahypergeometricdistribution,oranunbiasedempiricaldistribution, or a statistical meta-analysis. Moreover, it allows the identification of sub-sets of miRNAswhichsignificantlyregulatesacollectionofpathway,onthebasisofexperimentaldata.
Second-generationmethods compensated some of the disadvantages of ORA approaches. Typically FCSmethodscomputeagene-levelstatisticfromtheirexpressionlevels,bymeansofastatisticalapproach(i.e.ANOVA, Q-statistic, signal-to-noise ratio, t-test, or Z-score). Such a statistic is calculated considering allgenes in a pathway [15-21] and its statistical significance is estimated through an appropriate nullhypothesis [16,22-24]. FCSmethodsavoid someof the limitationsof theORAapproachesby rankingallgenesthroughtheirexpressionlevelandbyconsideringthedependencieswithinapathway.However,byusing gene expression only to sort genes, they do not take into account the fact that such values canchangepathwaysactivity.
InDraghicietal.[26],ananalyticaltechniquecalledimpactfactor(IF)wasintroduced.Theimpactfactorisapathway-levelscorethattakesintoaccountbiologicalfactorssuchasthemagnitudeofchangeingenesexpression, the typeof interactions between genes, and their location in the pathway. InDraghici et al.[26], each pathway is modeled as a graph in which nodes represent genes, while edges representinteractionsbetweenthem.Authorsalsodefineagene-level statistic (calledperturbation factor,PF)asalinearfunctionofthechangeingeneexpressionandtheperturbationofitsneighborhood.Suchastatisticis then combined for each element in a pathway, and a p-value is computed by means of exponentialdistribution.
TheanalysismethodpresentedbyDraghicietal.[26],hasbeenfurtherimprovedbytheSPIAalgorithm[27]whichattenuatesthedominanteffectexercisedbythechangeinexpressionwithinPFscomputation,whilereducing the high rate of false positives when the input list of genes is small. SPIA uses a bootstrapprocedure toevaluate thesignificanceof theobservedperturbation in thepathway.All this is combinedwith a p-value computed in ORA style to make a full assessment of the statistical significance of theperturbationofeachpathway.
To reduce the number of false positives, and to obtain a more significant analysis, Vaske et al. [28]presentedthePARADIGMalgorithm,whichhasbeenfurtherimprovedby[29].PARADIGMisamethodtoinfer patient-specific genetic activity by incorporating information regarding interactions between genesprovided in a pathway. The method predicts the degree of alteration in the activity of a pathway byemployingaprobabilisticinferencealgorithm.TheauthorsshowthattheirmodelobtainssignificantlymorereliableresultsthanSPIA.However,Mitreaetal.[25]statedtheycouldnotreproducetheresultsreportedinVaskeetal.[28],despitethefullcooperationofitsauthors.
However,bothSPIAandPARADIGMcompletelyignorepost-transcriptionalregulatoryinteractionsenactedbymiRNAs.To fill thisgap,Caluraetal.developedanewapproach,Micrographite [30],which isable tointegratepathwaywithpredictedandvalidatedmiRNA-target interactions.Themethod,byperformingatopological analysis based on expression profiles, is able to identify significant gene circuits specific of aphenotype. The main advantage of the methodology is the ability to accurately describe the cellularscenariothatledtotheinputexpressiondata.
Here,wepresentMITHrIL(miRNAenrichedpathwayimpactanalysis),atechniquethatextendsthemethodin [26] and SPIA [27], by combining their effectiveness and improves the reliability of the results. Thestrength ofMITHrIL lies in the enrichment of pathways with information regarding microRNAs, post-transcriptionalregulatoryelementswhoseadditionisclearlyessentialtothegreatermeaningfulnessoftheresults.Ourmethod,startingfromexpressionvaluesofgenesand/ormicroRNAs,returnsalistofpathwayssorted according to the degree of their de-regulation, together with the corresponding statisticalsignificance (p-values), and a predicted degree of alteration for each endpoint (a pathway node whosealteration,basedoncurrentknowledge,affectsthephenotypeinaspecificway).
To evaluate our algorithm,we used the decoy pathwaymethodology introduced in Vaske et al. [28] onexpressiondatasetsobtainedfromTheCancerGenomeAtlas.Weshowedthataddinginformationontheotherwisemissingregulatoryelementsprovestobepivotalinimprovingthereliabilityofpathwayanalysismethodologies.Asfurtherevidenceofthereliabilityofourpathwayimpactanalysismethod,weemployedouralgorithmfortheclassificationofphenotypes.Theresultshighlighttheabilityofourmethodologytostronglyreducethedimensionalityofthedatawhilemaintainingaveryhighclassificationquality.
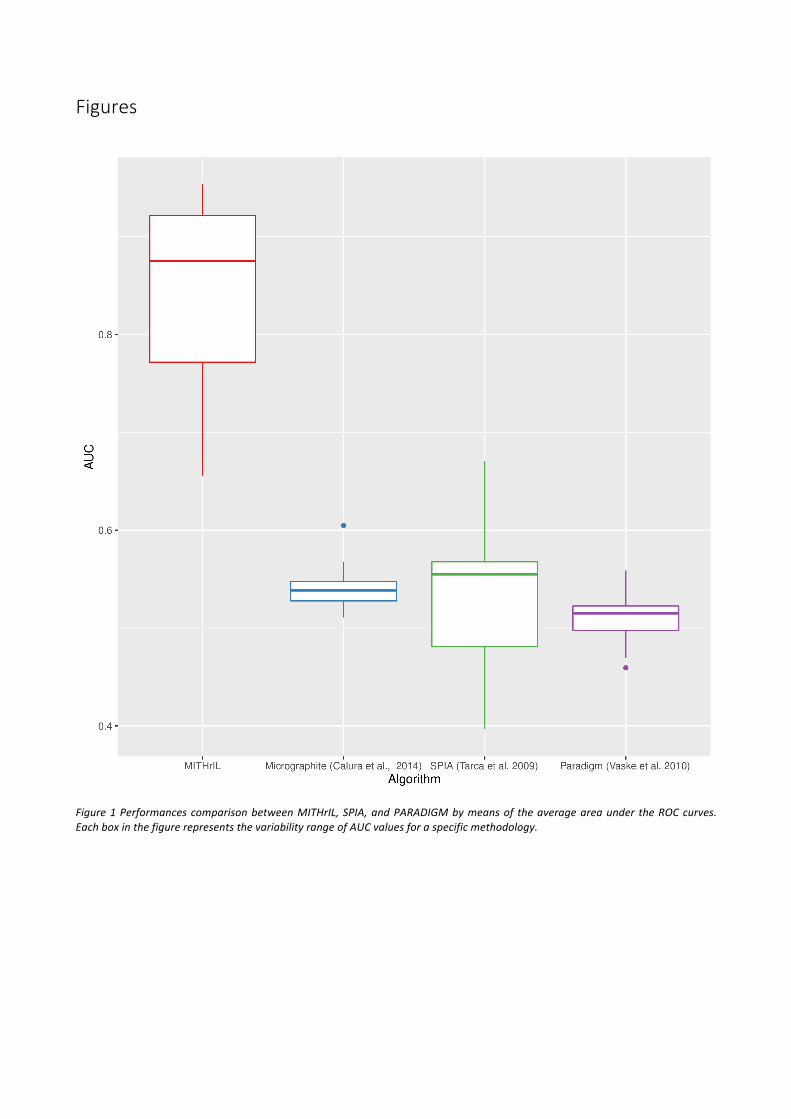
ResultsBiological soundness.WecomparedourmethodologywithPARADIGM [28],SPIA [27]andMicrographite[30]byemployingthetechniquedefinedinVaskeetal.2010.Theaimistoestablishwhethertherankingcomputedwithapathwayanalysisalgorithmisbiologicallysignificant.Thisisachievedbydefiningrandompathways(calleddecoypathways)withthesametopologyastherealonesbutrandomlyselectednodes.All pathways are then evaluated by each algorithm, estimating the ability of each method to properlyseparatedecoypathways from real onesbymeansof a receiveroperating characteristic (ROC) curve. Inprinciple, a method that can correctly distinguish real pathways from decoys should yield biologicallysignificantresults.
We performed comparisons betweenMITHrIL, SPIA, PARADIGM andMicrographiteon a set of selectedcancer types (see Table 1). Such a comparison allowed us, by ranking the datasets according to
performance, to identify the single cancer type in which our algorithm had the lowest quality results,namely,Lungsquamouscellcarcinoma(LUSC).
Theresultsofthefourmethodologieswererankedasfollows:PARADIGMaccordingtotheaveragenumberofsignificantscores,asdescribedin[28];SPIAaccordingtotheadjustedp-valueasobtainedthroughtheirsoftwareimplementation;Micrographiteaccordingtothepathwayprioritizationphase;MITHrILaccordingtotheadjustedp-valueandtheaccumulator.Moreprecisely,inMITHril,alltheresultsaresortedfirstbyp-value and, thereafter, in the presence of equal p-values their corresponding accumulator is taken intoaccount to determine their order. In Supplementary Figures 1-3, we present the results of the detailedcomparisonineachTCGAdataset.OutanalysisclearlyshowsthatMITHrILgivesthebestperformances.Asfurtherproofofthegoodnessofourmethodology,wecomputedtheaverageareaundereachROCcurve(AUC).TheresultsweresummarizedinFigure1(moredetailscanbefoundinSupplementaryTable1).Thefour boxes in the figure represent the AUC variability range for the four compared methodologies,respectively.
Prediction of cancer types.We also evaluated our algorithm by assessing its performances in terms ofcapabilitytopredictthecancertype.Todothis,weelectedtotrainthePAMr[31]classificationalgorithmandevaluateditsperformancebymeansofa10-foldcrossvalidation(CV)procedure.PAMrisanapproachdevised topredict cancer class fromgeneexpressionprofiling,basedonanenhancementof thenearestshrunkencentroidclassifier.Thealgorithmisableto identifysubsetsofgenesthatbestcharacterizeeachclass.Thetechnique isgeneralandcanbeused inmanyotherclassificationproblems.TheCVproceduretakesas inputall thefeatureprofilesofeachpatient,anddividestheminto10subsets,bybalancingtheelementsofeachclassineachsubset.Asubsetis,then,removed(testset),andtheclassifieristrainedontheremainingninesets(trainingset),inordertoprioritizeandselectthefeatures.Eachprofileinthetestsetisthenclassified,andtheresultsareusedtoestimatetheerror.Themethodologyisrepeatedsothateachsubsetisusedonceasthetestset.TheCVprocedurewasdesignedinordertoremoveoverfittingandoverestimationoftheresults.
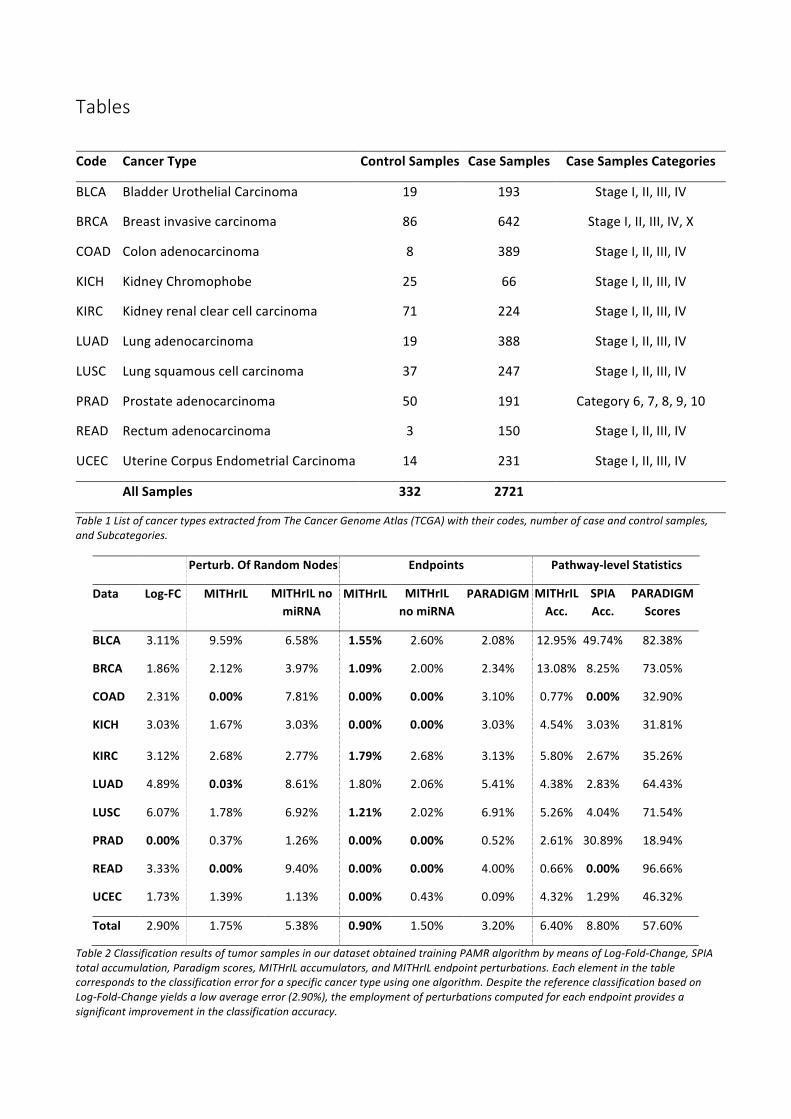
A reference classificationwas thus established by applying such a procedure to the Log-Fold-Change ofdifferentially expressed genes of our cancer cases. The rationale behind such a choice is to show thatpathwayperturbation,whichtakesintoaccountnetworkstructure,increasesthebiologicallysoundnessoftheresultswithrespecttoaplainLog-Fold-Change-basedapproach,widelyusedasagoldstandard.Firstwecomputedalldifferentiallyexpressedgenesforeachtumortype,obtainingatotalof17,326genesthatappear to be de-regulated in at least one disease. Next, we calculated their Log-Fold-Change in eachsample, trained a classifier and verified its performance using the above described CV procedure. Theresults (Table 2) demonstrate that such a classification is quite reliable since it yields a very small error.NoticethatMicrographiteisnotabletocomputepathwayrankingforasinglesample,thereforewedidnotperformanyclassificationusingsuchamethod.Hence,weranMITHrIL,SPIAandPARADIGMonallsamplesofoursetofselectedcancertypes,andtrainedthreeclassificationmodelsusingtotalaccumulationscores. As before, we performed a 10-fold cross validation and evaluated errors in each class (Table 2).Furthermore,leveragingtheabilityofMITHrILandPARADIGMtoreturntheperturbationforeachof3,165pathwayendpoints,wetrainedadditionalclassifiersbasedonsuchvalues.SinceSPIAcomputespathway-level statistic by means of a linear equation system, it could not return perturbations of endpoints.Therefore we elected to use MITHrIL without miRNAs to establish the classification performances ofendpoints,whensuchelementsaremissing.
Ouranalysis clearly shows thatperformancesareconsiderably improvedover referenceclassification,bytakingintoaccountendpointperturbations(Table2).Moreover,wecannoticeasignificantdimensionalityreductionofourdata,sincebyusingperturbationofpathwayendpoints,computedbymeansofEquation1(see the sectionMaterials andMethod), we are able to train PAMR on about3165genes (18%of thenumberofdifferentiallyexpressedones).
Table2reportsalsotheclassificationsbasedonMITHrILpathwayaccumulators.Werecallthataccumulatorsummarizes,withasinglevalue,thegeneralperturbationweobservewithinapathway.Hence,asafurthereffect this yields a stronger dimensionality reduction. Although we notice a slight increase inmisclassificationerror,comparedtoreferenceclassification,it isimportanttohighlightthatwewereableto reduce to 237 the number of features onwhichPAMR classifier was trained. Pathway Accumulatorswere computed according to Equation 5. The last two columns of Table 2 report the classificationperformancesobtainedbySPIAaccumulatorsandPARADIGMscores.AllofthisshowsthattheadditionofmiRNA information is crucial inorder toobtainmore reliable results.Notice thatwe cannotdeduceanyinformation about the performances of PARADIGM extendedwithmicroRNAs, since no implementationwithsuchaknowledgeisavailable,andthisgoesbeyondthescopeofourpaper.
To further highlight the biological relevance of endpoints, we performed a set of experiments withrandomlyselectednodeswithinpathways(seethirdandfourthcolumnsofTable2).Theresultsshowthatthechoiceofendpointsisreasonable,sinceendpointssynthetizeperturbationsofupstreamnodes.
Coherenceofthepredictionofpathwaynodesstate.Asafurthervalidationourmethodology,wechoseto verify the percentage of endpoints for which a coherent prediction of the deregulation is obtained.Initially,weappliedMITHrILwithandwithoutmiRNAstoestimatetheperturbationsforeachendpointofeachsample(excludingtheexpressionvaluesoftheendpoints inordertoavoid introducingabias inourresults).Subsequently,wecomputedthepercentageofendpointsforwhichthesignofperturbationagreeswiththatofthelog-FoldChange.ThisvalidationestimatesthereliabilityofthepredictionsofourmethodandtheimportanceoftheadditionofmiRNAknowledgetoourmodel.Theresults(Figure2)highlightthatplugging quantitative information on miRNAs is crucial to establish a far more comprehensive andmeaningful estimation of phenotype activity. Therefore, using perturbation without miRNAs could bemisleading.
DiscussionInthelastdecade,miRNAshaveevermorerevealedtobecrucial inthemodulationofnumerouscellularpathwaysviatheexertionoftheirimportantregulatoryfunctionwhentargetingkeygenes.SincethefirstconnectionbetweenmiRNAsandcancerwasmadein2002[32],miRNAderegulationhasbeenproventobeindeedattherootofthepathogenesisofallcancers[33].Itsufficestoconsider,forinstance,howthederegulationofevenasinglemiRNAiscapabletocausecancer,asinthecaseofmiR-155whichhasbeenshown to be responsible for the onset of Acute Lyphoblastic Leukemia/high-grade lymphoma inmouse[34].Additionally,thepredominantrolesplayedbymiRs21,221and222inseveralcancertypesprovetheimportance these small RNAmolecules have in tumor pathogenesis and progression,while also being adeterminingfactor indrugresistance[33]. In lightof thisandmanyotherevidencesdiscovered inrecentyears, the integrationofmiRNAexpressionwhenevaluatingcancerpathwayperturbationhasbecomeofutmost importance. The proper consideration of the crucial effects yielded by the action of these smallnon-coding RNA molecules on overall gene expression indeed contributes to a more comprehensivedepiction of the biological reality, providing a more accurate means for pathway assessment andphenotypecategorization. In fact, given thevery importantbiological roleplayedbymiRNAs, integratingtheirevaluationcangreatlyhelp in thediscernmentofeven finechanges in thecellulargeneexpressionprofile,whichcouldmakethedifferencebetweenanormalandabnormalphenotypes,alreadyatdiseaseonset.
Here we presented a novel knowledge base-driven pathway analysis methodology calledMITHrIL. ByenrichingKEGGpathwayswithexperimentallyvalidatedinteractionsbetweengenesandmiRNAs,MITHrILiscapabletoclearlyimprovethereliabilityofpathway-basedanalysisofphenotypes.
Through the enrichment with miRNA information,MITHrIL can greatly improve predictions over SPIA,PARADIGM,andMicrographite.Infact,whiletheothermethodologiescannotproperlydistinguishbetweendecoypathwaysandrealones,MITHrILiscapableofobtainingmuchbetterresults.Evenourworstcasehad superior results than our three competitors. From a biological standpoint, the ability to distinguishdecoypathwaysfromrealonesaddressesthefundamentalnecessitytobeabletoproperly interprettheactualcellularmechanismsaspossessingabiologicalcriterionwhichiscrucialtothelifeofthecellandnottheresultofrandomphenomena.
Therefore, we focused our analysis on the ability of ourmethodology to synthesize information gainedfromgeneexpressiondataand thusprovidenovelbiological clues. For thispurpose,byusing thePAMRalgorithm,weperformeddifferent typesofclassification, takingas reference the resultsarising fromtheclassificationbaseddirectlyonLog-Fold-Changes.Our findingsdemonstrated thecapabilityofMITHrIL tosynthesize biological information contained in the data, while yielding high classification accuracy.Furthermore,MITHrIL greatly reduces thedimensionalityofdataof about73times compared toanaiveLog-Fold-Changebasedmethod.Thissignificantdimensionalityreductionmayalsomaketheanalysismoreaccurate since it could reduce the noise that can be introduced by the technologies used to gatherexpression data from samples. Furthermore, when knowing the phenotype that is being analyzed, it ispossibletofurtherreducethenumberofdimensionsbyfocusingonlyonthosepathwaysthatareknowntobesomehowinvolvedinit.
Compared to SPIA, MITHrIL can also return the perturbation computed for pathway endpoints, whosesubsequentanalysiscanleadtoimportantadditionalinsightsaboutthebiologyunderlyingthephenomenaunder study. Indeed, theproperevaluationofpathwayendpoints can contribute to a farmoreaccuratephenotypeassessment,asamoredetaileddiversificationbetweenpathologicalphenotypesatthepathwaylevelisreflectedmoreattheendpointsratherthaninanyothernodeofthepathwaynetwork.Thisallowstomore effectively distinguish pathologies sharing even a very similar set of deregulated genes (as youcouldmoreeasilydistinguishsimilaryetdifferenttreesmoreeasilybyconfrontingtheirleavesratherthantheirroots).Byleveragingonendpointperturbation,wearealsoabletogreatlyreducethemisclassificationerror,althoughweareabletoreducedatadimensionalitybyonly5times.Thisallowsustostressthefactthatgeneperturbationsarecapabletodiscriminateamongthepathologicalclassesofourdata.
Leveraging on the potential provided bymiRNA enrichment in pathway analysis, MITHrIL represents abioinformaticresourcecapableofafarmoreaccurateevaluationofpathwayderegulation incancer.Thiscanprovideadecisivecontributiontocancer research in termsofdirecting researchersmoreeffectively,reducingcostsandtimerequirements.Specifically,MITHrILcancontributetoanearlierdiagnosis,anearlyandmoreaccuratedrugresistanceassessment,aswellastomorepreciseprognosisintermsofpredictingfuturediseasedevelopment.
Nevertheless,ourresultscanbefurtherimprovedgiventhatpathwaysarestillincomplete,thuspotentiallyresulting in partial or erroneous conclusions. Future development in pathway analysis methodologiesshould take into account additional regulatory elements, such as long non-coding RNA (lncRNAs), alongwithepigenetic information, suchasmethylationpatterns, variants, or copynumber variants.Mutationscouldbeexploitedbyconsideringtheirimpactonthemodulationof𝛽function(seethesectionMaterialsandMethod for the definition of𝛽), for example by assessing the difference in interaction strength bymeansof freeenergy.Wecouldalsodefinethe𝛽functionbyevaluatingthecorrelationbetweenpatientexpressionprofilesandcorrespondingphenotype.
Inorder toachieve this,wedownloadedall validated inhibition interactionsbetweenmiRNAand targetsfrommiRTarBase [35] andmiRecords [36].We also obtained interactions between transcription factors(TFs)andmiRNAs fromTransmiR [37].By taking intoaccountTFsactivatingmiRNAgenesweareable toincreasetheknowledgestoredwithineachpathway.Wethenstandardizedallidentifiersintheirrespectivedatabasestoavoidduplicates.ThemappingofmiRNAidentifierswasperformedbyusingmiRBaserelease20 [38-42] as reference database. For each target, we performed a twofoldmapping procedure: firstly,eachgeneidentifierhasbeenconvertedtoitsEntrezone;then,bytakingadvantageofKEGGRESTAPI,wemapped each Entrez Id to the corresponding KEGG Id. This standardized list of interactions was, lastly,filtered to remove all duplicates. Such a procedure allowed us to build a knowledge base of10,537experimentallyvalidatedinteractionsbetween385miRNAsand3,080genes.
PathwayenrichmentwasperformedbydefininganewtypeofnodesrepresentingmiRNAsinthepathwaynotation,alongwith two typesofdirectededges, formiRNA-target inhibition interactionsandTF-miRNAinteractions,respectively.TheenrichmentisthusperformedautomaticallybyaddingtoeachpathwayonlymiRNAsthatinteractwithatleastoneelementwithinit.
Finally,inordertoacquireinformationonwhichendpointsarecontainedineachpathway,weemployedadepth-first search algorithm (DFS) [43] to automaticallymarkwhich genes are located at the endof thechainsofreactionsineachpathway.Thesearchforendpointsinapathwaystartsfromarandomnode.TheDFS algorithm follows the interactions down to the nodes from which no other one can be reached(putativeendpoints).Theprocedureisrepeateduntilallnodeshavebeenanalyzed.Putativeendpointsare,then,manually screened to determine if they are associatedwith phenotypic changes as stated on theKEGGdatabase.Only the latter are taken as pathway endpoint. An example of endpoints is reported inSupplementaryFigure4.
AlgorithmOur methodology consists in an extension of Draghici et al. [26] and Tarca et al. [27]. It requires acase/control expression data set from which statistically differentially expressed features have beenextracted (genes,miRNAs,orboth).For suchelements, thecomputationof their Log-Fold-Change isalsoneeded. Starting from such information,MITHrIL computes, for each gene in a pathway, aPerturbationFactor (PF), which is an estimate of how much its activity is altered considering its expression and 1-neighborhood. Positive (negative) values of PF indicate that the gene is likely activated (inhibited). Byappropriately combining each PF of a pathway, our algorithm is, therefore, able to calculate an ImpactFactor (IF) and anAccumulator (Acc). The IF of a pathway is ametric expressing how important are thechanges detected in the pathway, the greater the value, themost significant are the changes. TheAccindicatesthetotallevelofperturbationinthepathwayandthegeneraltendencyofitsgenes:positiveAccvaluesindicateamajorityofactivatedgenes(orinhibitedmiRNAs),whilenegativeonescorrespondstoanabundance of inhibited genes (or activated miRNAs). To the Acc is also assigned a p-value which is anestimateoftheprobabilityofgettingsuchaccumulatorbychance.Finally,byapplyingthe[44]method,weestimatethefalsediscoveryrateandp-valuesareadjustedonmultiplehypotheses.
whereΔ𝐸 𝑛 is the Log-Fold-Change computed for the node𝑛 ,𝑈 𝑛, 𝑃. and𝐷 𝑛, 𝑃. are the set ofupstreamanddownstreamnodesof𝑛inpathway𝑃. respectively, and𝛽 𝑢, 𝑛 is a function that indicatesthestrengthandtypeofinteractionbetweengenes𝑢and𝑛.Inparticular,negativevaluesof𝛽indicateaninhibitoryeffect,whilepositivevaluesanactivatingone.Toensurethattheperturbationcomingfromanupstream node is divided to its downstream ones, proportionally to the strength of their interactions,without altering the total perturbation, a normalization is applied dividing by the sum of the weightsabsolute values. By exploiting themethodology described in Draghici et al. [26] we compute an impactfactor,𝐼𝐹 𝑃. ,whichreflectstheimportanceofthechangesobservedinapathway,as:
𝑃., addressing the dominant effect of the expression change in the PF computation by subtracting suchvalues. We can now compute total perturbation accumulation,𝐴𝑐𝑐 𝑃. , which measures whether thepathwayislikelyactivatedorinhibited.TheintroductionofmiRNAsinourmodeladdressesthenecessitytotakeintoaccountthefactthatanincreased(decreased)expressionofsuchelementsresultsinaninhibition(activation)ofthepathway.Wecompute𝐴𝑐𝑐 𝑃. as:
P-value estimation is then performed by combining the Z-scores, computed through an inverseStandardized Normal distribution, associated to two probabilistic terms: the first is the probability ofobtaining by chance a number of differentially expressed genes in the pathway at least equal to theobservedone,whilethesecondconsists intheprobabilityofobservingbychanceanaccumulatorhigherthan the computedone.The first termcorresponds to𝑝 𝑃. introduced inequation2. The second term,instead,hastobeestimatedthroughapermutationtest. Insuchatest,weassign,toarandomgroupofgenes in the pathway in question, a Log-Fold-Change selected randomly from the input ones, so as tocompute a random accumulator. The procedure is repeated several times and the final probability isestimatedastheratiobetweenthenumberofrandomaccumulatorsgreaterthan𝐴𝑐𝑐 𝑃. andthenumberofrepetitionsperformed.Inourexperiments,therepetitionsweresetto2000inordertoobtainmaximumprecisionuptotwodecimalplaces.
Atthisstagewearealsoabletoestimateexpectedvalue𝐸 𝐴𝑐𝑐 𝑃. as themedianvalueof therandomaccumulators.
Therefore, the final result of our algorithm consists of a list of pathways alongwith their impact factor,accumulatorandadjustedp-values.Suchlistissortedbyp-valueandAcc.
ExpressionDataSourcesToperformacomprehensivetestofouralgorithm,weexploitedexpressiondataprovidedbyTheCancerGenome Atlas (beginning of 2014).We downloaded all patient expression profiles of genes (RNASeqV2obtained through platforms Illumina Genome Analyzer and Illumina HiSeq) and miRNAs (miRNASeqobtained through platforms IlluminaGenomeAnalyzer and Illumina HiSeq). The initial datasetwas thenfilteredby removingallpatients forwhichoneof the two typesofexpressionwasunavailable.We theneliminatedalltumorsamplesforwhichnohealthycontrolswereavailable.Byapplyingsuchaprocedure,webuilt adatasetof3,053expressionprofiles (2,721case samplesand332control samples)ofpatientsaffectedby10distincttumorpathologies(seeTable1formoredetails).Casesampleswerefurtherdividedbydiseasestage.
Torunouralgorithm,weperformedadifferentiallyexpressedgenesanalysisbyusingtheRNASeqpipelinebasedonLimma[45].TheexpressionmatricesforeachdiseasewerefirstlynormalizedbyusingtheVoomalgorithm [46], then a linearmodelwas trainedwith Limma and differentially expressed genes for eachstage of the diseasewere extracted alongwith their Log-Fold-Change. In our analysiswe considered asdifferentiallyexpressedonlythosegenesforwhichanadjustedp-valuewaslowerthan0.01ascomputedbyLimma.
PerformanceAssessmentTocompareouralgorithmwithothermethodologies,PARADIGM[28],SPIA[27]andMicrographite[30],weusedthedecoypathwaytechniqueintroducedinVaskeetal.2010[28].Foreachpathwayinourinternaldatabase,webuiltadecoyoneobtainedbymaintainingthesamestructureandsubstitutingeachgene(ormiRNA)withonerandomlychosenfromthesetofallpossiblegenes.As inVaskeetal.2010[28],all thecomplexesandabstractprocesseswerekeptunchanged.Aftertheexecutionofthethreealgorithms,thepathwayswere classified by eachmethod and the fraction of real pathways versus the total number ofpathwaysconsideredwascomputed.Thehigherthefractionofrealpathways,thebettertheabilityofanalgorithmtoextractbiologicallysoundresults.Lastly,toachieveafaircomparisonwithSPIA,wechosethesame𝛽function as Tarca et al. 2009 [27]:𝛽 𝑢, 𝑛 = 1for all interactions that increase node expressionlevel,𝛽 𝑢, 𝑛 = −1for those that have the effect of decreasing node expression level,𝛽 𝑢, 𝑔 = 0forirrelevant ones. However, the𝛽function introduces a huge concealed potential inMITHrIL,which pavesthewayforpossiblefutureextensions.
AcknowledgementsThe results shown here are in whole or part based upon data generated by the TCGA ResearchNetwork: http://cancergenome.nih.gov/.V.D.wassupportedbyItalianFoundationforCancerResearch(FIRC)(16572).
Figure2Significanceof theadditionofmiRNA inourmodelbymeansofacomparisonof thepercentagesof correctlypredictedendpointsforeachsamplebetweenourmethodwithandwithoutmiRNAs.Eachboxinthefigurerepresentsthevariabilityrangeofthe percentage of correctly predicted endpoints for the patients of a specific tumor type. A prediction is correct when thederegulationobserved intheoriginaldatacorrespondtotheone inferredbyouralgorithm.Namely, thesignofanendpoint log-Fold-Changecorrespondstothesignofitsperturbationvalue.