1
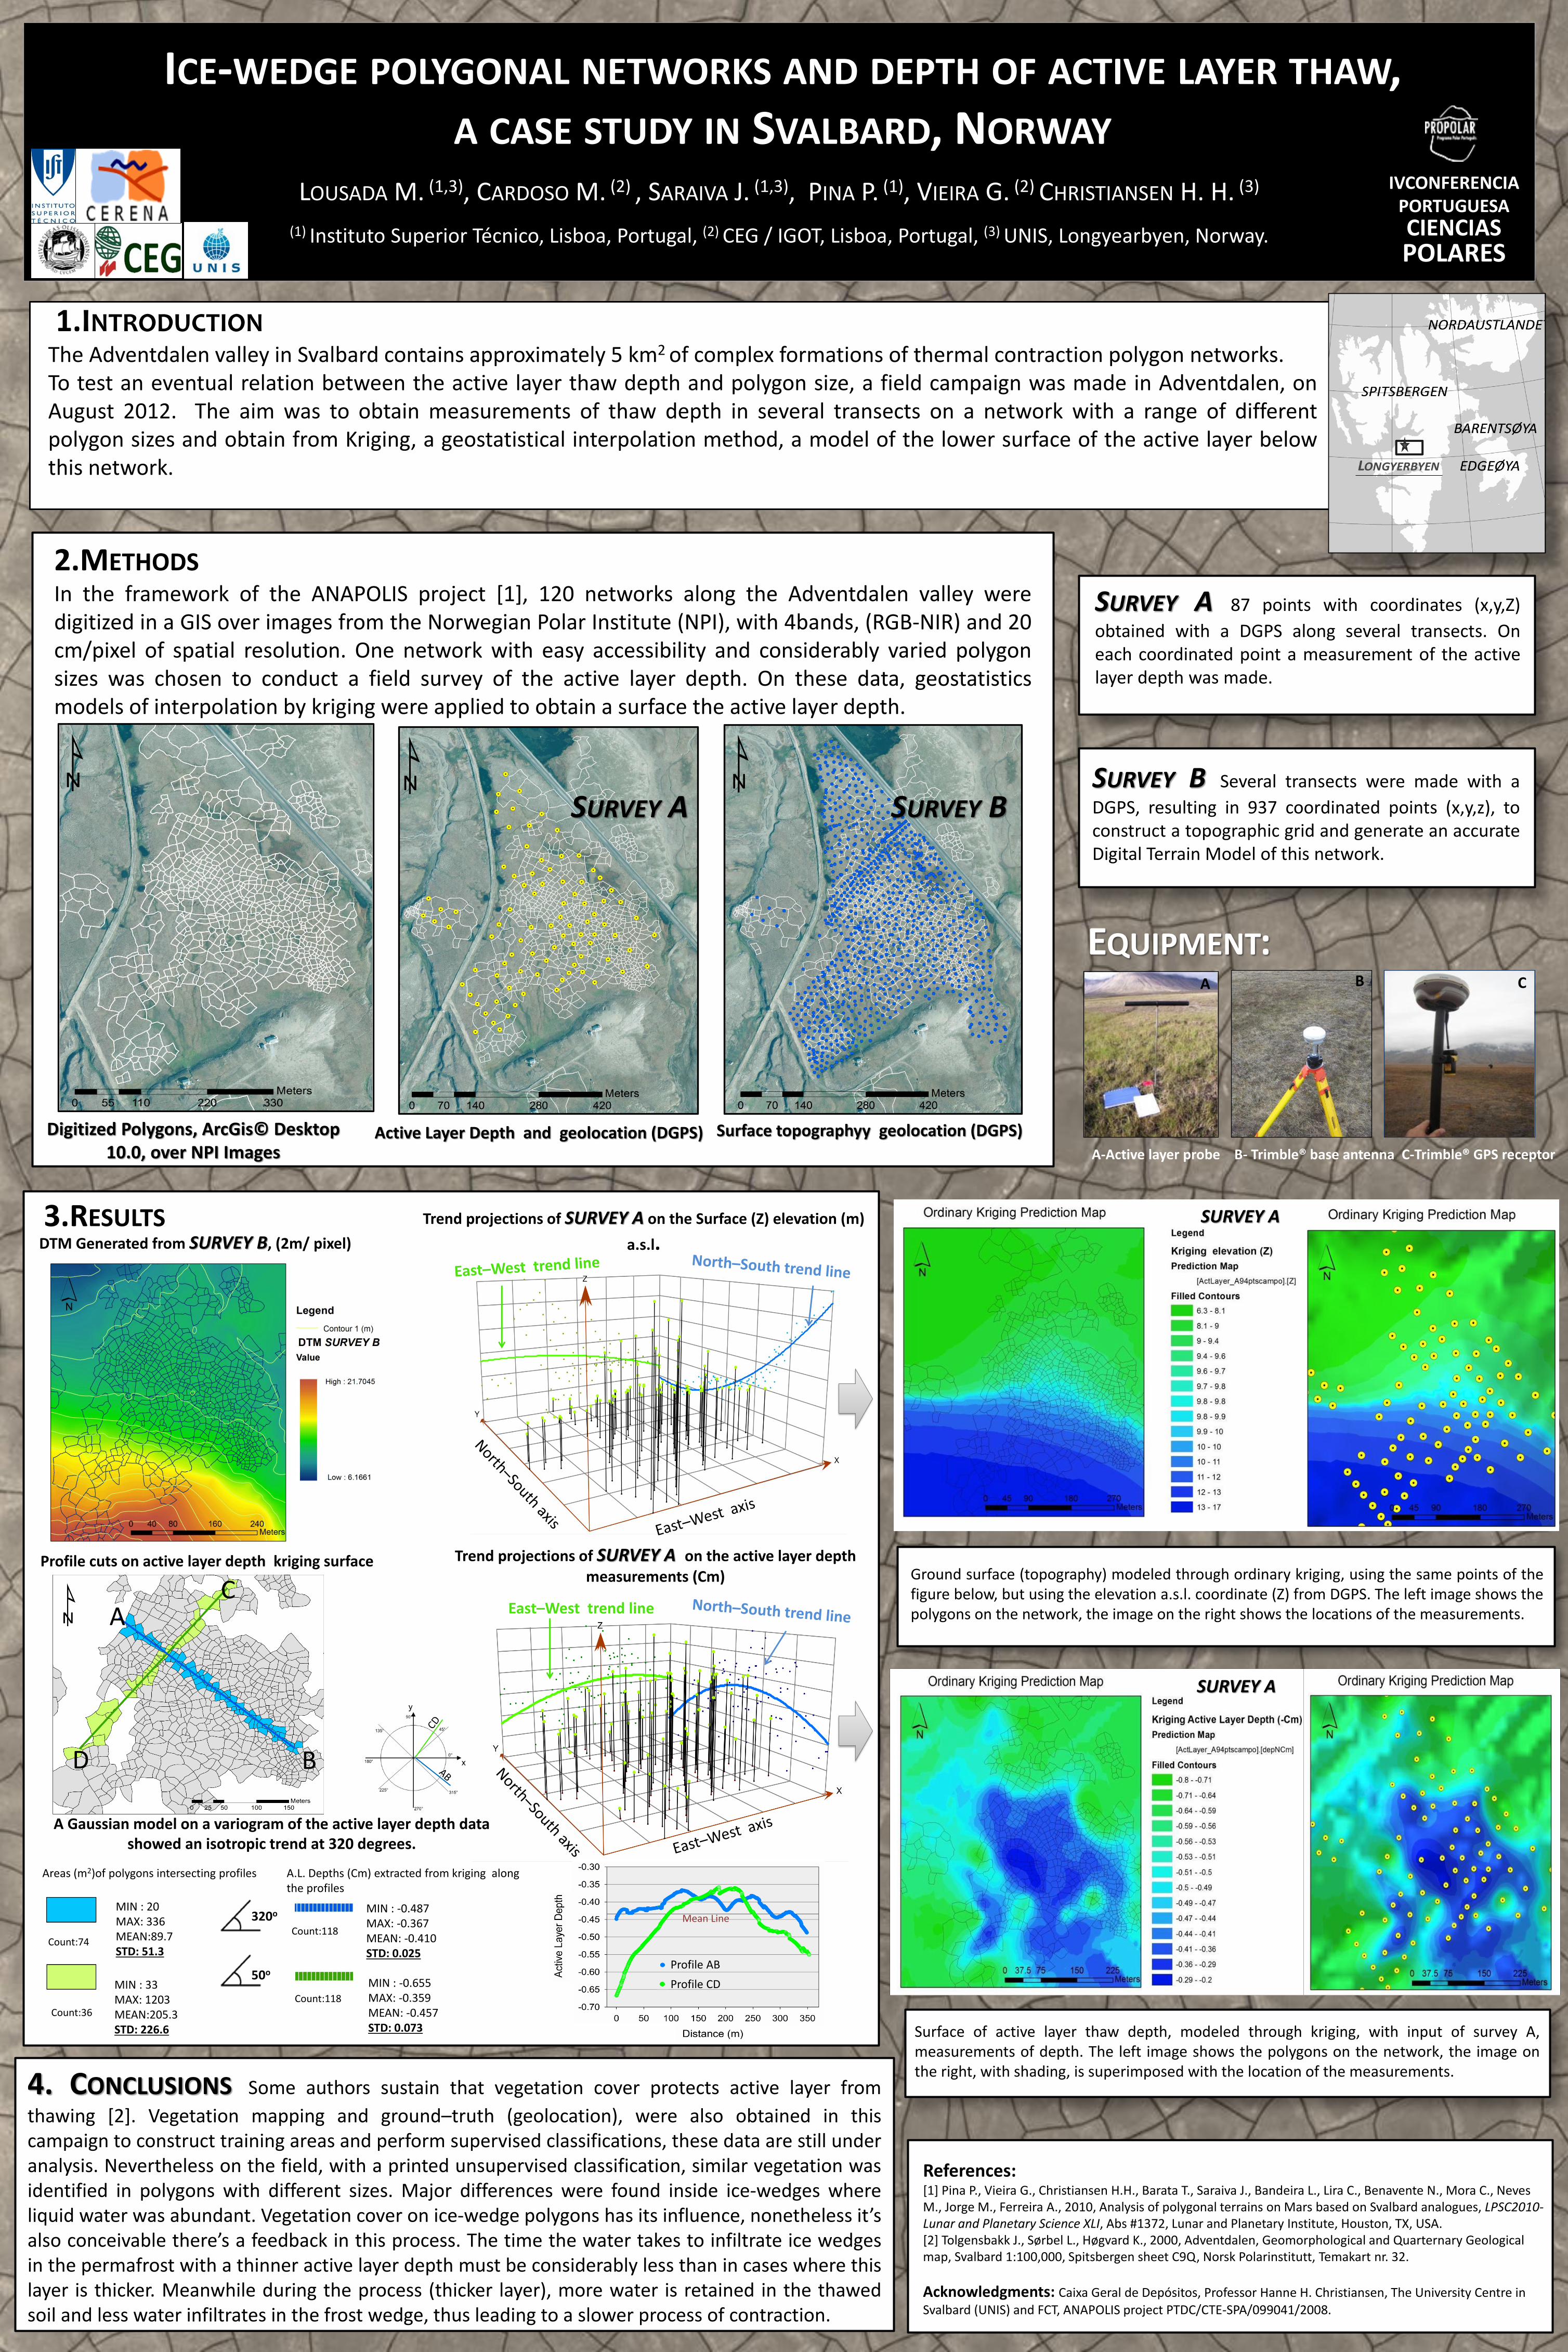
Digitized Polygons, ArcGis© Desktop 10.0, over NPI Images Surface topographyy geolocation (DGPS) Active Layer Depth and geolocation (DGPS) 1.INTRODUCTION The Adventdalen valley in Svalbard contains approximately 5 km 2 of complex formations of thermal contraction polygon networks. To test an eventual relation between the active layer thaw depth and polygon size, a field campaign was made in Adventdalen, on August 2012. The aim was to obtain measurements of thaw depth in several transects on a network with a range of different polygon sizes and obtain from Kriging, a geostatistical interpolation method, a model of the lower surface of the active layer below this network. E QUIPMENT : Trend projections of SURVEY A on the Surface (Z) elevation (m) a.s.l. SURVEY A SURVEY B ICE-WEDGE POLYGONAL NETWORKS AND DEPTH OF ACTIVE LAYER THAW , A CASE STUDY IN S VALBARD , NORWAY SURVEY A 87 points with coordinates (x,y,Z) obtained with a DGPS along several transects. On each coordinated point a measurement of the active layer depth was made. 3.RESULTS L OUSADA M. (1,3) , CARDOSO M. (2) , SARAIVA J. (1,3) , PINA P. (1) , VIEIRA G. (2) CHRISTIANSEN H. H. (3) (1) Instituto Superior Técnico, Lisboa, Portugal, (2) CEG / IGOT, Lisboa, Portugal, (3) UNIS, Longyearbyen, Norway. East–West trend line SURVEY B Several transects were made with a DGPS, resulting in 937 coordinated points (x,y,z), to construct a topographic grid and generate an accurate Digital Terrain Model of this network. 2.METHODS In the framework of the ANAPOLIS project [1], 120 networks along the Adventdalen valley were digitized in a GIS over images from the Norwegian Polar Institute (NPI), with 4bands, (RGB-NIR) and 20 cm/pixel of spatial resolution. One network with easy accessibility and considerably varied polygon sizes was chosen to conduct a field survey of the active layer depth. On these data, geostatistics models of interpolation by kriging were applied to obtain a surface the active layer depth. Trend projections of SURVEY A on the active layer depth measurements (Cm) References: [1] Pina P., Vieira G., Christiansen H.H., Barata T., Saraiva J., Bandeira L., Lira C., Benavente N., Mora C., Neves M., Jorge M., Ferreira A., 2010, Analysis of polygonal terrains on Mars based on Svalbard analogues, LPSC2010- Lunar and Planetary Science XLI, Abs #1372, Lunar and Planetary Institute, Houston, TX, USA. [2] Tolgensbakk J., Sørbel L., Høgvard K., 2000, Adventdalen, Geomorphological and Quarternary Geological map, Svalbard 1:100,000, Spitsbergen sheet C9Q, Norsk Polarinstitutt, Temakart nr. 32. Acknowledgments: Caixa Geral de Depósitos, Professor Hanne H. Christiansen, The University Centre in Svalbard (UNIS) and FCT, ANAPOLIS project PTDC/CTE-SPA/099041/2008. 4. CONCLUSIONS Some authors sustain that vegetation cover protects active layer from thawing [2]. Vegetation mapping and ground–truth (geolocation), were also obtained in this campaign to construct training areas and perform supervised classifications, these data are still under analysis. Nevertheless on the field, with a printed unsupervised classification, similar vegetation was identified in polygons with different sizes. Major differences were found inside ice-wedges where liquid water was abundant. Vegetation cover on ice-wedge polygons has its influence, nonetheless it’s also conceivable there’s a feedback in this process. The time the water takes to infiltrate ice wedges in the permafrost with a thinner active layer depth must be considerably less than in cases where this layer is thicker. Meanwhile during the process (thicker layer), more water is retained in the thawed soil and less water infiltrates in the frost wedge, thus leading to a slower process of contraction. IVCONFERENCIA PORTUGUESA CIENCIAS POLARES A-Active layer probe B- Trimble® base antenna C-Trimble® GPS receptor A B C DTM Generated from SURVEY B, (2m/ pixel) Profile cuts on active layer depth kriging surface Profile AB Profile CD Mean Line A B D C A Gaussian model on a variogram of the active layer depth data showed an isotropic trend at 320 degrees. Areas (m 2 )of polygons intersecting profiles A.L. Depths (Cm) extracted from kriging along the profiles MIN : 20 MAX: 336 MEAN:89.7 STD: 51.3 MIN : 33 MAX: 1203 MEAN:205.3 STD: 226.6 MIN : -0.487 MAX: -0.367 MEAN: -0.410 STD: 0.025 MIN : -0.655 MAX: -0.359 MEAN: -0.457 STD: 0.073 320 o 50 o Count:74 Count:36 Count:118 Count:118 SURVEY A SURVEY A Surface of active layer thaw depth, modeled through kriging, with input of survey A, measurements of depth. The left image shows the polygons on the network, the image on the right, with shading, is superimposed with the location of the measurements. Ground surface (topography) modeled through ordinary kriging, using the same points of the figure below, but using the elevation a.s.l. coordinate (Z) from DGPS. The left image shows the polygons on the network, the image on the right shows the locations of the measurements.