Page 1
POSTER INTRODUCTION
CHEMICAL REACTION ENGINEERING LABORATORY
CREL Annual Meeting
October 28, 2004
Chemical Reaction Engineering Laboratory
Department of Chemical Engineering
St.Louis, MO 63130
Page 2
(SLURRY) BUBBLE COLUMN AND GAS-LIQUID
STIRRED TANK REACTORS
A. Experimental Techniques and Measurements
Page 3
Ashfaq Shaikh
Bubble Column Reactors
Hydrodynamics
Hydrodynamics of High Pressure Bubble Column Slurry Reactor
Combination of two single modal tomographic techniques for three
dynamic phase flow imaging
Flow Regime Transition
Evaluation of CT for regime identification
New technique and its ‘flow regime identifiers’ developed
Scale-up A new hypothesis proposed
Experimental evaluation of proposed hypothesis
Development of ANN correlations for hydrodynamic parameters
Hydrodynamics Flow Regime Transition Scale-up
Page 4
Characterization of Hydrodynamic Flow regime in
Bubble Column via Computed Tomography
Homogeneous/Bubbly
Flow
Heterogeneous/Churn-
turbulent Flow
Different hydrodynamic characteristics
Explored the potential of CT for flow regime delineation in
bubble column
Evaluated the developed approach with traditional
methods such as Drift Flux method
Investigated the effect of operating pressure on flow regime
transition
Page 5
Slurry Bubble Column Reactors • Vertical cylindrical vessels, three-phase gas-liquid-solid systems with
solid particle sizes in the range 5-150µm and solids loading up to 50% by volume
• Simple to construct and do not involve any mechanically moving parts
• Exhibit excellent heat and mass transfer characteristics
Applications:
– Fischer-Tropsch (FT) Synthesis
– oxidation and hydrogenation
– chlorination and alkylation
– polymerization, methanol synthesis
– waste water treatment
– bio and biochemical processes
G – Reactant L – Reactant and/or Product S – Catalyst
The goal of this work is to measure the gas-liquid volumetric mass transfer
coefficient, kLa, in SBC with high gas velocity/pressure/solid loading, with
assistance of hydrodynamic information obtained using CARPT/CT
methodology.
Mass Transfer Measurement Techniques
for Slurry Bubble Column Reactors Lu Han, Muthanna Al-Dahhan. CREL, Oct. 2004
G
L+S
G
L+S
Page 6
Optical Oxygen Probe
Probe Tip
Light from the blue LED
going to the probe tip Sol-Gel
Collected fluorescence
going to the spectrometer
Overcoat
O2
O2
O2
Sol-GelSol-Gel475 nm 475 nm
600 nm600 nm
O2
O2
Comparison of Data Fitting Using
CSTR and ADM models
B.C. DC8”, air-water, 0.1MPa,
SGV 12cm/s, z/L=0.8
0
0.2
0.4
0.6
0.8
1
1.2
0 20 40 60 80
t, s
C/C* Exp.
ADM Fitting
CSTR Fitting
Gas Tracer Technique
Gas Tracer Response Fitting Using
ADM Model (RTD)
B.C. DC8”, air-water, 0.1MPa, SGV
2cm/s
0
0.2
0.4
0.6
0.8
1
1.2
0 10 20 30 40
t, s
Norm
aliz
ed C
T
He TracerResp.
ADM Fitting
Page 7
Flows Dynamics in An Internal Loop Airlift Column
Bioreactor
Hu-Ping Luo, Muthanna H. Al-Dahhan
Chemical Reaction Engineering Laboratory (CREL)
Bioprocess & Bioreactor Engineering Laboratory (BBEL)
Chemical Engineering Department
Washington University in St.Louis
CREL Annual Meeting
October 2004
A Novel Modeling Approach for Predictions of the Dynamic
Growth of Microalgae in Multiphase Photo-bioreactors
CHEMICAL REACTION ENGINEERING LABORATORY
Producing And Carbonylating of Dimethyl Carbonate: A
Process Development Study
Page 8
A Novel Modeling Approach for Predictions of the Dynamic Growth of
Microalgae in Multiphase Photo-bioreactors
Substrates
Bubbles Bubbles
td
Cell 1
Product 1
tr1
td Bubbles
Cell 2
Product 1
tr2 Final Products
td
Complex interactions among
microorganisms (cells) metabolism,
kinetics, transportation, and
hydrodynamics in Bioreactors
Challenges in Reactor Design and Scale-up
How to see through the system
for LOCAL PHENOMENA of the
flow pattern in bioreactors
? A Case Study
Airlift Column Photobioreactor:
Integrating metabolism of autotrophic
microorganism with flow dynamics
Mass transfer in Bioreactors
0
10
20
30
40
50
60
70
80
0 100 200Time, hr
Cell'
s C
oncentr
ation,
*106
cell/
ml
SC_1cms SC_5cmsDC_5cms DC_1cmsBC_5cms
Photosynthesis Kinetics Bioreactor Performance
CARPT &
CT
Findings
Please stop by this
poster if interest
Page 9
Flows Dynamics in An Internal Loop Airlift Column Bioreactor
RIS
ER
3 cm
9 cm
150
cm
13 cm
105
cm
RIS
ER
3 cm
9 cm
150
cm
13 cm
105
cm
CARPT CT
Study the macro- and micro-mixing and the liquid flow field in the
fully developed flow region as well as the Top and the Bottom
regions
Investigate the effects of superficial gas velocity and top and
bottom clearance on the hydrodynamics
Form the knowledge base for airlift reactors’ design and scale-up,
and provide a database for CFD modeling validations.
Please stop
by this
poster for
details if
interest Bypassing and Stagnant may significant in
both the Top and the Bottom regions
RTD analysis Local Gas Holdups
Page 10
Producing And Carbonylating of Dimethyl Carbonate:
A Process Development Study Hu-Ping Luo, Wen-De Xiao, Kai-Hong Zhu
East China University of Science and Technology, Shanghai, China
WHY Dimethyl Carbonate? •Environmentally benign chemicals
•Environmentally benign processes
•An excellent gesoline additives
•A building block: containing both the carbonyl
and the methyl group, an effective
carbonylation agent, a useful methylation agent
•An important organic solvent
Trans-esterification: producing
and carbonylating DMC
H3COCOC2H5
O
C2H5OH CH3OHH3COCOCH3
O
++cat
C2H5OCOC2H5
O
C2H5OH CH3OHC2H5OCOCH3
O
++
cat
Kinetic
Thermodynamic
Reactive Distillation
'
'
'
' ' ' ' ''' ' '
"
"""" " " "
""""
0 10 20 30 40 50 60 70 80 90
Time(min)
0
0.1
0.2
0.3
0.4
0.5
0.6
0.7
0.8
0.9
1
DM
C c
on
ver
sio
n o
r D
EC
sel
ecti
vit
y
Conversion Selectivity" '
Add new reactants
Catalyst E+P
0.0 0.2 0.4 0.6 0.8 1.0
340
350
360
Methanol(1)+DMC(2)
Exp
UNIFAC prediction (old
parameters,Pattern 1)
UNIFAC prediction (old
parameters,Pattern 2)
UNIFAC prediction (this
work)
Tem
pera
ture
(K)
x1, y
1
0 20 80 10050
40
30
20
10 Methanol
Ethanol
DMC
MEC
DEC
Sta
ge n
um
ber
Liquid composition (mol%)Phase Equilibrium Catalytic System Reactive Distillation Simulation
Page 11
CHEMICAL REACTION ENGINEERING LABORATORY
Heat Transfer Coefficient
Measurement
Technique in High Pressure Slurry
Bubble Column Chengtian Wu, Muthanna Al-Dahhan
• The instantaneous heat transfer coefficient(hi) can be obtained from the
heat transfer flux(Q) and temperature difference between the probe
surface(Ts) and the bulk(Tb).
– The probe measures the instantaneous local heat flux(Q) and the
surface temperature(Ts).
– Three thermocouples are used to measure the bulk temperature(Tb).
)/( bsi TTQh
Page 12
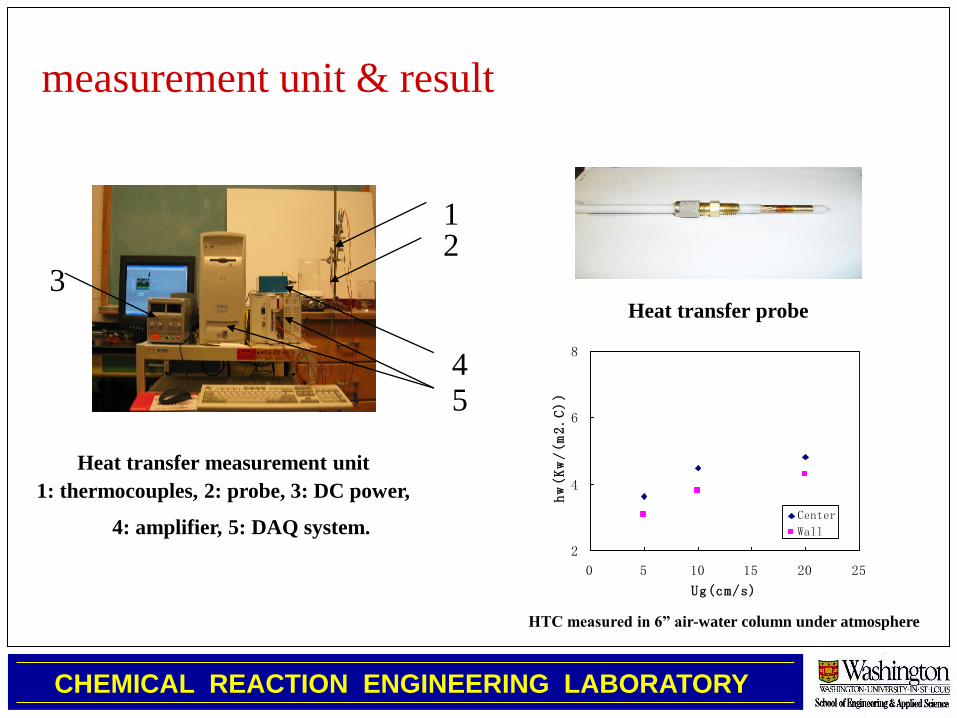
measurement unit & result
Heat transfer probe
CHEMICAL REACTION ENGINEERING LABORATORY
1 2
4 5
3
Heat transfer measurement unit
1: thermocouples, 2: probe, 3: DC power,
4: amplifier, 5: DAQ system.
HTC measured in 6” air-water column under atmosphere
2
4
6
8
0 5 10 15 20 25
Ug(cm/s)
hw(Kw/(m2.C))
Center
Wall
Page 13
CHEMICAL REACTION ENGINEERING LABORATORY
dfiber=0.2 mm
Bubble Velocity, Chord Length and Specific Interfacial Area
Measurements in Bubble Columns Using Four-point Optical Probe
The performance of (slurry)
bubble columns is governed
by the hydrodynamics.
Validation of Computational
Fluid Dynamics (CFD) codes
requires also local
information on bubble
properties.
The measurement of bubble
properties is difficult,
especially in churn-turbulent
flow. A four-point optical
probe is employed in this
study to measure the bubble
properties.
Liquid/Slurry Outlet
Gas Outlet
Gas Inlet
Liquid/Slurry Inlet
Probe
A/D unit and computer
Liquid/Slurry Outlet
Gas Outlet
Gas Inlet
Liquid/Slurry Inlet
Probe
A/D unit and computer
Junli Xue, M. H. Al-Dahhan, M. P. Dudukovic, R. F. Mudde
Cofiguration of the Four-Point
Optical Probe
Page 14
CHEMICAL REACTION ENGINEERING LABORATORY
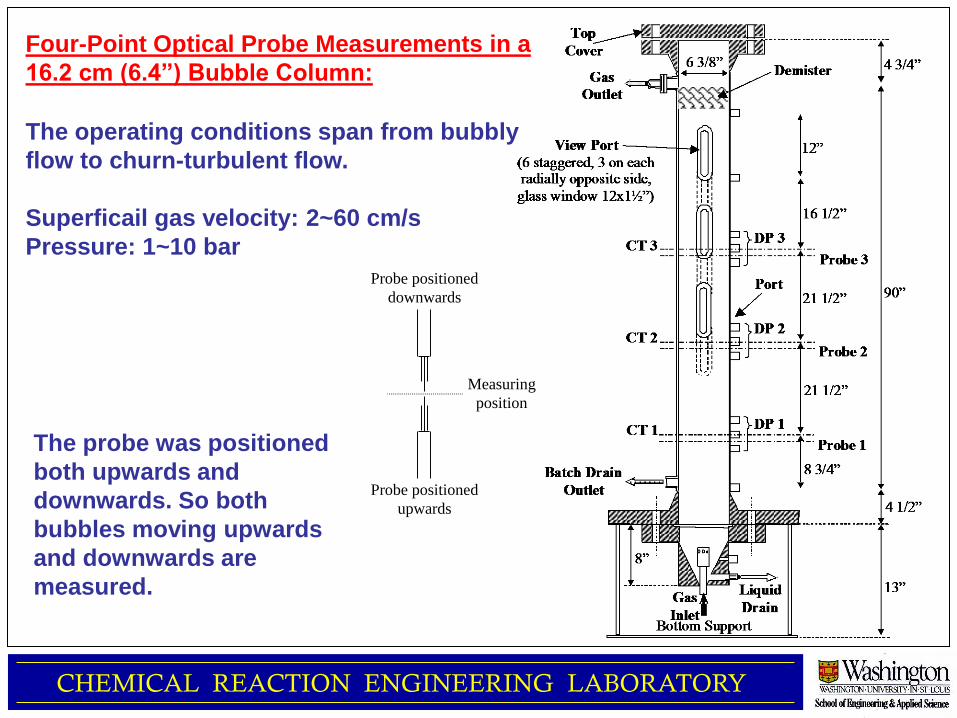
The operating conditions span from bubbly
flow to churn-turbulent flow.
Superficail gas velocity: 2~60 cm/s
Pressure: 1~10 bar
Four-Point Optical Probe Measurements in a
16.2 cm (6.4”) Bubble Column:
Measuring
position
Probe positioned
downwards
Probe positioned
upwards
The probe was positioned
both upwards and
downwards. So both
bubbles moving upwards
and downwards are
measured.
Page 15
25, Ch de la Tavallaz, CH-1816 Chailly s/Montreux, Switzerland - Tel.: +41 21 989 2121 - Telefax: +41 21 989 2120 - www.biazzi.com
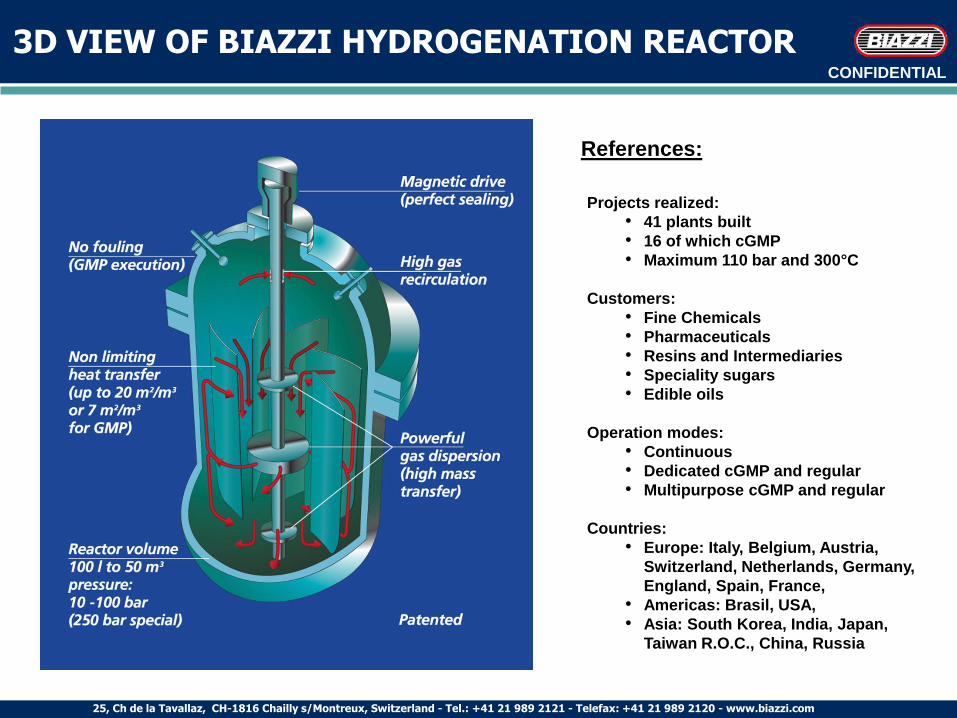
CONFIDENTIAL
3D VIEW OF BIAZZI HYDROGENATION REACTOR
Projects realized:
• 41 plants built
• 16 of which cGMP
• Maximum 110 bar and 300°C
Customers:
• Fine Chemicals
• Pharmaceuticals
• Resins and Intermediaries
• Speciality sugars
• Edible oils
Operation modes:
• Continuous
• Dedicated cGMP and regular
• Multipurpose cGMP and regular
Countries:
• Europe: Italy, Belgium, Austria,
Switzerland, Netherlands, Germany,
England, Spain, France,
• Americas: Brasil, USA,
• Asia: South Korea, India, Japan,
Taiwan R.O.C., China, Russia
References:
Page 16
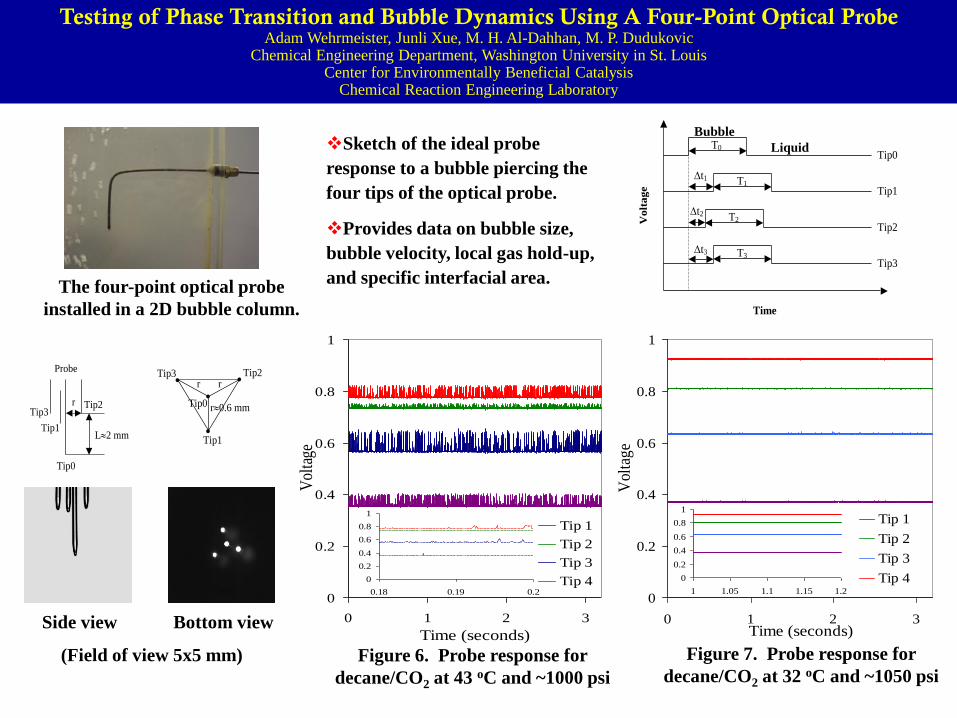
Testing of Phase Transition and Bubble Dynamics Using A Four-Point Optical Probe Adam Wehrmeister, Junli Xue, M. H. Al-Dahhan, M. P. Dudukovic
Chemical Engineering Department, Washington University in St. Louis Center for Environmentally Beneficial Catalysis
Chemical Reaction Engineering Laboratory
The four-point optical probe
installed in a 2D bubble column.
Sketch of the ideal probe
response to a bubble piercing the
four tips of the optical probe.
Provides data on bubble size,
bubble velocity, local gas hold-up,
and specific interfacial area.
T0
T1
T2
T3
Tip0
Tip1
Tip2
Tip3
t1
t2
t3
Time
Vo
lta
ge
Bubble
Liquid
0
0.2
0.4
0.6
0.8
1
0 1 2 3Time (seconds)
Vol
tag
e
Tip 1
Tip 2
Tip 3
Tip 40
0.2
0.4
0.6
0.8
1
1 1.05 1.1 1.15 1.2
Figure 7. Probe response for
decane/CO2 at 32 oC and ~1050 psi
Figure 6. Probe response for
decane/CO2 at 43 oC and ~1000 psi
0
0.2
0.4
0.6
0.8
1
0 1 2 3
Time (seconds)
Vol
tage
Tip 1
Tip 2
Tip 3
Tip 40
0.2
0.4
0.6
0.8
1
0.18 0.19 0.2
Side view
L2 mm
r
Probe
Tip0
Tip3
Tip1
Tip2
Tip1
Tip3 Tip2
Tip0
r r
r0.6 mm
Bottom view
(Field of view 5x5 mm)
Page 17
B. Modeling and Computational Fluid Dynamics (CFD)
(SLURRY) BUBBLE COLUMN AND GAS-LIQUID
STIRRED TANK REACTORS
Page 18
Peng Chen and M. P. Dudukovic
CREL Meeting, 2004
Predicting Gas Holdup, Liquid Velocity Profiles
and Mixing in Bubble Column Flows
Accounting for Coalescence-Breakup
CHEMICAL REACTION ENGINEERING LABORATORY
Page 19
CHEMICAL REACTION ENGINEERING LABORATORY
The CT Setup at CREL (Kumar, 1994)The CT Setup at CREL (Kumar, 1994)
Dzz
Drr
uz(r)
1-eL(r)
0 -R R
CT CT SCAN
CARPT
FLOW PATTERN
CFD + CARPT + CT
0 100 200 300 400
AFDU
0 100 200 300 400
1 0.8 0.6 0.4 0.2 0
Detector Level 1
1 0.8
0.6
0.4
0.2
0
Detector Level 6
Run 14.6
0.0
0.2
0.4
0.6
0.8
1.0
0 20 40 60 80 100
Time (sec)
No
rma
lize
d R
es
po
ns
e
Sim_L1
Exp_L1
Sim_L4
Exp_L4
Sim_L7
Exp_L7
Pressure = 50 atm
Temperature =250 Deg. C
Ug = 25 cm/s
0 20 40 60 80 100
1 0.8
0.6 0.4
0.2
0
7
6
5
4
3
2
1
Liquid
Tracer
Gas Tracer Gas
Gas
DET.
Data
Model
Prediction
time (s)
time (s)
time (s)
CHEMICAL REACTION ENGINEERING LABORATORY
Page 20
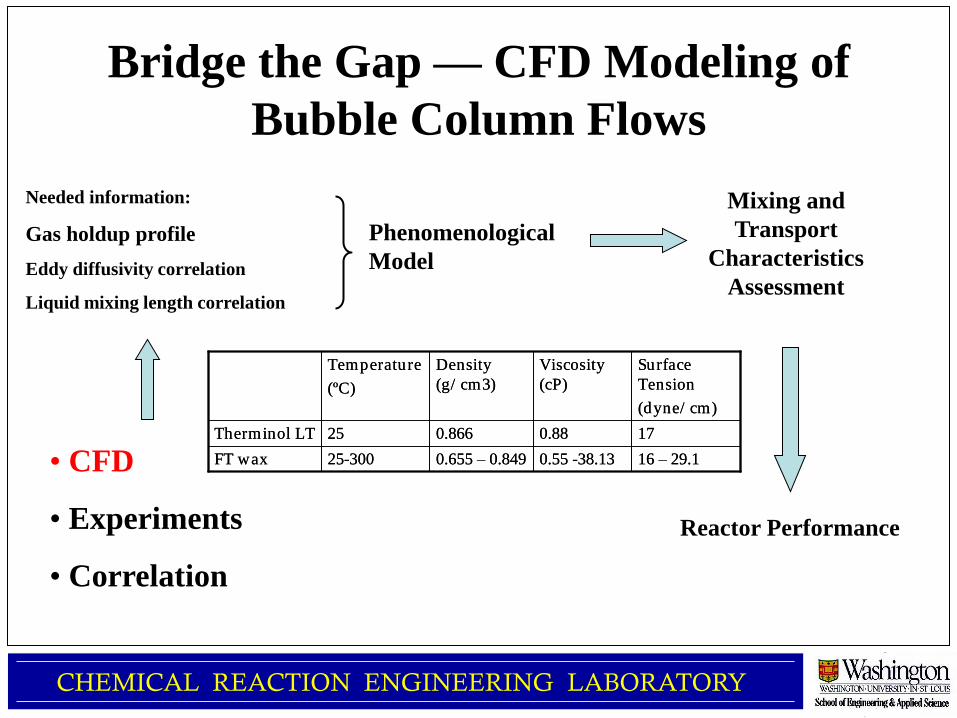
Bridge the Gap — CFD Modeling of
Bubble Column Flows
Phenomenological
Model
Reactor Performance
Mixing and
Transport
Characteristics
Assessment
Needed information:
Gas holdup profile
Eddy diffusivity correlation
Liquid mixing length correlation
• CFD
• Experiments
• Correlation
CHEMICAL REACTION ENGINEERING LABORATORY
16 – 29.10.55 -38.130.655 – 0.84925-300FT wax
170.880.86625Therminol LT
Surface
Tension
(dyne/ cm)
Viscosity
(cP)
Density
(g/ cm3)
Temperature
(ºC)
16 – 29.10.55 -38.130.655 – 0.84925-300FT wax
170.880.86625Therminol LT
Surface
Tension
(dyne/ cm)
Viscosity
(cP)
Density
(g/ cm3)
Temperature
(ºC)
Page 21
Outlines
•Hydrodynamics of bubble columns
•Eulerian-Eulerian Two-Fluid model
•Algebraic Slip Mixture Model (ASMM)
•Hydrodynamics of (passive) tracers (gas/liquid) in bubble column flows
Computational Modeling of Gas-Liquid Flow in Bubble Columns P. Chen, M. Rafique and M. P. Dudukovic
Page 22
CFD-based Compartmental
Modeling of Single Phase Stirred
Tank Reactors
Debangshu Guha, M.P.Dudukovic & P.A.Ramachandran
CREL Annual Meeting, 2004
CHEMICAL REACTION ENGINEERING LABORATORYCHEMICAL REACTION ENGINEERING LABORATORY
Page 23
Motivation
Reactor Performance = f (kinetics, flow pattern and mixing)
CHEMICAL REACTION ENGINEERING LABORATORYCHEMICAL REACTION ENGINEERING LABORATORY
Mixing = f (flow pattern and turbulence characteristics)
The performance prediction can be improved if flows and
turbulence characteristics can be used from CFD
Most available phenomenological models for mixing do not
account for the flow pattern and the turbulence
inhomogeneities in the reactor
Page 24
CFD-based Approach
CHEMICAL REACTION ENGINEERING LABORATORYCHEMICAL REACTION ENGINEERING LABORATORY
i,j,k
i,j,k+1
i,j,k-1
i-1,j,k i+1,j,k
i,j-1,k
i,j+1,k
u
u
ur ur
uz
uz
Solve macroscopic
equations for all
compartments
simultaneously
Solve flow equations
using CFD to
generate the flow
field in the tank
Calculate flows in and out
of the compartments;
Estimate the exchanges
due to fluctuations
Macroscopic equation consists of convection due to main flow, dispersion due toturbulence and the reaction terms
i,j,k
i,j,k+1
i,j,k-1
i-1,j,k i+1,j,k
i,j-1,k
i,j+1,k
u
u
ur ur
uz
uz
i,j,k
i,j,k+1
i,j,k-1
i-1,j,k i+1,j,k
i,j-1,k
i,j+1,k
u
u
ur ur
uz
uz
i,j,k
i,j,k+1
i,j,k-1
i-1,j,k i+1,j,k
i,j-1,k
i,j+1,k
u
u
ur ur
uz
uz
Solve macroscopic
equations for all
compartments
simultaneously
Solve flow equations
using CFD to
generate the flow
field in the tank
Calculate flows in and out
of the compartments;
Estimate the exchanges
due to fluctuations
Macroscopic equation consists of convection due to main flow, dispersion due toturbulence and the reaction terms
Page 25
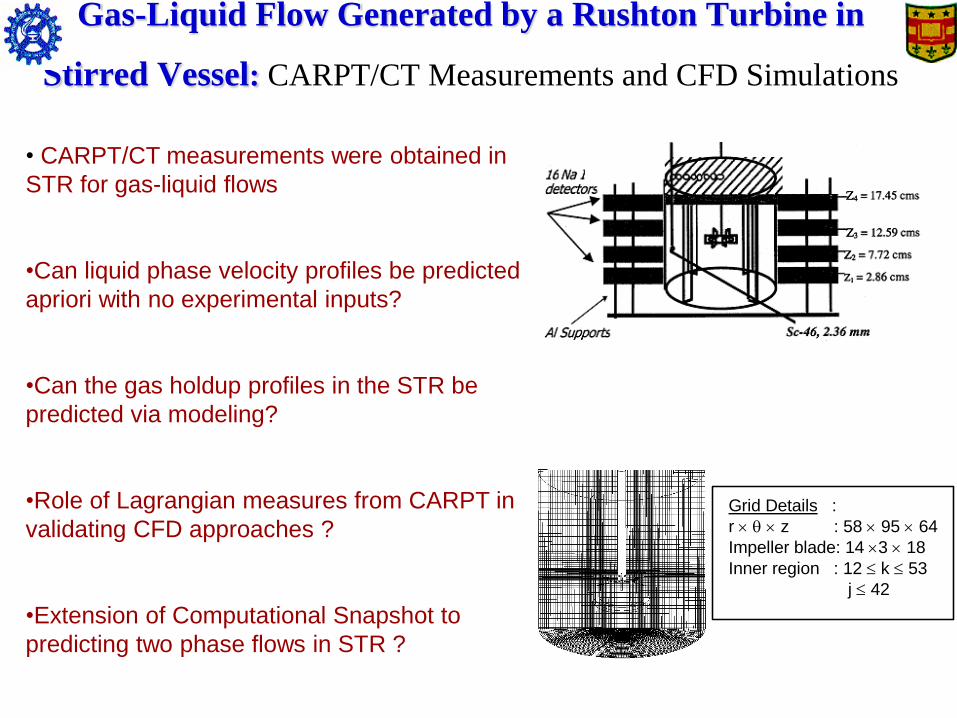
Gas-Liquid Flow Generated by a Rushton Turbine in
Stirred Vessel: CARPT/CT Measurements and CFD Simulations
Grid Details :
r z : 58 95 64
Impeller blade: 14 3 18
Inner region : 12 k 53
j 42
• CARPT/CT measurements were obtained in
STR for gas-liquid flows
•Can liquid phase velocity profiles be predicted
apriori with no experimental inputs?
•Can the gas holdup profiles in the STR be
predicted via modeling?
•Role of Lagrangian measures from CARPT in
validating CFD approaches ?
•Extension of Computational Snapshot to
predicting two phase flows in STR ?
Page 26
PACKED BED, STRUCTURED BED,
CRICULATING FLUIDIZED BED
Page 27
CHEMICAL REACTION ENGINEERING LABORATORY
Satish Bhusarapu,
M. H. Al-Dahhan and M. P. Duduković
CREL Annual Meeting
October 28, 2004
Chemical Reaction Engineering Laboratory
Department of Chemical Engineering
St.Louis, MO 63130
Poster 1
Solids Flow Mapping in a Fast Fluid Bed
Page 28
CHEMICAL REACTION ENGINEERING LABORATORY
Air
inlet
Riser
section
7.9 m (26’)
tall
15.2 cm
(6”) I.D.
Downcom
er
5.5 m
(18’) tall
5.1 cm
(2”) I.D.
Mechanical
valve
To air
filter
Cyclone
1 m (3.3’) tall
0.1m (4”) I.D.
4.4 ft3 Feed
hopper
Disengage
ment
section
1.5 m (5’)
tall
0.6 m (24”)
I.D.
Splash
plate
Mechanical
valve
Air
inlet
Riser
section
7.9 m (26’)
tall
15.2 cm
(6”) I.D.
Downcom
er
5.5 m
(18’) tall
5.1 cm
(2”) I.D.
Mechanical
valve
To air
filter
Cyclone
1 m (3.3’) tall
0.1m (4”) I.D.
4.4 ft3 Feed
hopper
Disengage
ment
section
1.5 m (5’)
tall
0.6 m (24”)
I.D.
Splash
plate
Mechanical
valve
z = 5.85 m
L/D = 38.5
z = 4.6 m
L/D = 30.5
Challenge : Obtain solids flow mapping in the riser
CARPT in a Pilot-plant set-up
46Sc particle coated with a polymer (Parylene®
density 1.1 g.cm-3 ) to adjust the density and
prevent attrition of the radioactive tracer
Soft glass beads
r= 2.5 g.cm-3 ; dp (sauter mean) = 150 mm
Radioactive tracer particle
46Sc particle
(136 mm)
ParyleneN coating
(7 mm thickness)
Page 29
CHEMICAL REACTION ENGINEERING LABORATORY
Satish Bhusarapu,
M. H. Al-Dahhan and M. P. Duduković
CREL Annual Meeting
October 28, 2004
Chemical Reaction Engineering Laboratory
Department of Chemical Engineering
St.Louis, MO 63130
Poster 2
Solids RTD in a Gas-Solid Riser at Low and High Fluxes:
Single Radioactive Particle Tracking
Page 30
CHEMICAL REACTION ENGINEERING LABORATORY
Challenge : To obtain RTD in an “open” system like riser
Impulse responses in “open-open” systems are
not representative of the RTD. Naumann &
Buffham, 1983.
In recirculating systems like CFBs, first passage
times in the riser cannot be determined uniquely
from impulse responses. Shinnar et al., 1971.
0 1 4 50
0.05
0.1
0.15
t
0
0.5
1
Solids FPTD in the Riser with "closed-closed" Boundaries
F -
curv
e
0
0.01
0.03
0.04
0 1 4 50
0.5
1Solids RTD in the Riser with "open -open" Boundaries
t
F -
curv
e
0 1 2 3 4 50
0.01
0.02
0 1 2 3 4 50
0.5
1Transient Response Function from a Conventional Tracer Experiment
t
F -
curv
e
Mean of FPTD = 13.52 sec
Stdev of FPTD = 33.6 sec
Dz = 2.1 m2/s
sec
Mean of RTD = 39.7 sec
Stdev of RTD = 59.94 sec
Dz = 0.8 m2/s
sec
Mean of TConv. = 65.13 sec
Stdev of TConv. = 81.9 sec
Dz = 0.5 m2/s
sec
Single Radioactive Particle Tracking
Transient response function as would be
obtained from conventional tracer injection
Overestimates:
Mean residence time by 64%
Underestimates:
Dimensionless variance by 31%
Dispersion coefficient by 38%
Page 31
Poster 3
CHEMICAL REACTION ENGINEERING LABORATORY
Satish Bhusarapu,
M. H. Al-Dahhan and M. P. Duduković
CREL Annual Meeting
October 28, 2004
Chemical Reaction Engineering Laboratory
Department of Chemical Engineering
St. Louis, MO 63130
An Alternating Minimization Algorithm for Image
Reconstruction in Computed Tomography
Page 32
CHEMICAL REACTION ENGINEERING LABORATORY
Challenge: To improve image quality of the CT data
Phase holdup profiles at
various axial positions
Estimation - Maximization -
Beer Lambert’s Law -
l
ijijeff
o
lI
IA ,ln mr
K
ijKijKijeff ,,, emrmr
An approximation is made in
the solution which is true only
for low attenuation values
Implement an Alternating Minimization (AM) algorithm (O’Sullivan
and Benac, 2001), where each step of minimization is exact.
Page 33
Trickle Bed Reactors
Maxime Capitaine
M.P. Dudukovic, M.H. Al-Dahhan
Chemical Reaction Engineering Laboratory (CREL)
Washington University in St. Louis
St. Louis, MO
J. Bousquet, D. Védrine, P. Tanguy
Centre Européen de Recherche et Technique, TOTAL
Harfleur, FRANCE
Page 34
Hydrodynamics Parameters
• Liquid Distribution
• Pressure Drop
• Liquid Hold Up
Measurement Methods
• Collector Tray
• Computed Tomography
Results
• Effects of liquid and gas superficial velocities and packed bed height
Page 35
Cell Network Modeling For
Catalytic Trickle-Bed Reactors
CHEMICAL REACTION ENGINEERING LABORATORY
J. Guo, Y. Jiang, P. A. Ramachandran,
M. Al-Dahhan, M. P. Dudukovic
Washington University
St. Louis, Missouri
CREL Annual Meeting
10.28.2004
Page 36
Gas Liquid
Gas Liquid
Inlet
Outlet
Cell operated
as C STR
Completely dry
Completely w etted
Half
wettedLiquid path
Gas Liquid
Gas Liquid
Inlet
Outlet
Cell operated
as C STR
Completely dry
Completely w etted
Half
wettedLiquid path
Single Cell
CHEMICAL REACTION ENGINEERING LABORATORY
Cell (i, j)
Cell (i+1, j)
Layer i
Layer i+1
Cell (i+2, j) Layer i+2
Layer i+3 Cell (i+3, j)
1D Cell-Stack 2D Cell-Network
i,j
Mixing
Splitting
i, j i, j+1 i, j-1
i-1, j
i+1, j
Page 37
Dynamics of Coupling Exothermic &
Endothermic Reactions in Directly Coupled
Adiabatic Reactors
R C Ramaswamy
Advisors
P A Ramachandran, M P Duduković
CREL Annual Meeting
Fall, 2004
CHEMICAL REACTION ENGINEERING LABORATORY
Page 38
A B
C D
-ΔH
+ΔH
Directly Coupled Adiabatic Reactor
(De Groote et. al. 1996, De Smet et. al. 2001, Hohn
and Schmidt 2001)
Endothermic
Exothermic
Counter Current Reactor
(Frauhammer et. al. 1999, Veser et. al. 2001, Kolios et. al.
2001, Kolios et. al. 2002)
Exothermic Endothermic
Reverse Flow Reactor
( Kulkarni and Dudukovic 1996, Kolios et. al. 2000)
Endothermic
Exothermic
Co-Current Reactor (Ismagilov et. al. 2001, Kolios et. al. 2002, Zanfir et. al.
2003)
Regenerative
Coupling
Recuperative
Coupling
Exothermic
Reaction
Endothermic
Reaction
Heat
Coupling
Page 39
Exothermic
Reaction
- Combustion
Endothermic
Reaction
- Synthesis Gas
Generation
Heat
Regenerative Coupling
Directly Coupled Adiabatic Reactors
Mixed Catalyst Bed
(Exothermic &
Endothermic Catalysts)
Simultaneous DCAR Sequential DCAR
Products
Reactants
Exothermic
Catalyst Bed
Endothermic
Catalyst Bed
Page 40
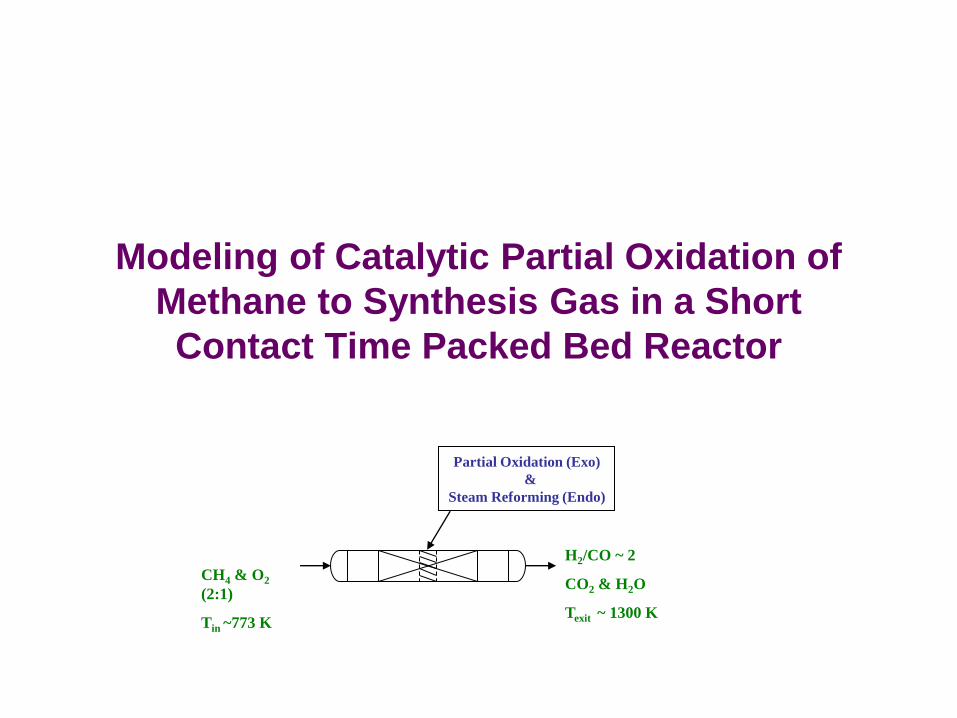
Modeling of Catalytic Partial Oxidation of
Methane to Synthesis Gas in a Short
Contact Time Packed Bed Reactor
CH4 & O2
(2:1)
Tin ~773 K
H2/CO ~ 2
CO2 & H2O
Texit ~ 1300 K
Partial Oxidation (Exo)
&
Steam Reforming (Endo)
Page 41
Synthesis Gas (mixture of H2 and CO) (Pena et. al. 1996)
– Feed stock for synthesis of liquid fuels, methanol
– Source of hydrogen for fuel cells
– Feed stock for ammonia plant, hydrogenation plant etc
MolKJHHCOOHCO
MolKJHHCOOHCH
MolKJHHCOOHCH
MolKJHOHCOOCH
K
K
K
K
/37,)4(
/185,42)3(
/222,3)2(
/800,22)1(
773222
7732224
773224
7732224
Catalytic Partial Oxidation of Methane to Syngas (De Smet et. al., CES 56 , 2001)
High Active Catalysts (Rh)
Short Contact Time
Reactors
(4-15 milli seconds) Hohn & Schmidt, 2001
Page 42
YSOA
XSD
SDSOO
SASOP
k
k
k
k
4
3
2
1
21
32
41
32
41
kk
kk
kk
XSDSOO
YSASOPkk
kOk
Rearranging,
•A is the desired product
•X & Y deactivate the catalyst
The configurations to consider are
•CSTR (both P & O in low conc)
•P in high conc (Plug flow)
and O in low conc – CSTR in
series with addition of O in each
CSTR
Reactor Modeling and Design for Solid Acid
Catalysis Test Bed
Iso-butane (P) + Butene (O) Alkylate (A - gasoline)
Page 43
Performance studies of a solid-catalyzed gas-liquid monolith reactor: Effect of flow maldistribution
Shaibal Roy Muthanna Al-Dahhan
CHEMICAL REACTION ENGINEERING LABORATORY
CREL Annual Meeting
28th October 2004
Introduction
• Multiphase reactors (for solid catalyzed gas-liquid reaction) used extensively in petroleum, petrochemical, biochemical, material, and environmental industries
•Catalytic monolith reactor have shown promise to overcome some of the drawbacks of conventional reactors as well as give higher productivity (Krautzer et al. 2003, Nijhaus et al., 2001)
Gas out
Gas in
Liquid out
Gas in Gas out
Liquid in
Liquid out
Gas in
Gas out
Gas
in
Gas
out
Liquid
in
Liquid
out
Page 44
Background
Previous researches have assumed uniform flow distribution across a monolith cross-section in the Taylor flow regime.
However, this is not always the case as demonstrated by recent non-invasive flow measurement techniques (Mewes et al., 1999; Gladden et al., 2003)
Nijhaus et al., 2001 Krautzer et al., 2003 Liu, 2001
Experimental performance studies (small diameter reactor)
Monolith reactor performance modeling (single channel model)
Edvinsson et al. 1994 Cybulski et al. 1999 Nijhaus et al., 2003
Objectives •What is the effect of the following operating parameters on the flow distribution:
•Gas and liquid velocities
•Type of liquid distributor
•Cell density and void fraction of monolith
•How is the performance of monolith reactor (conducted in a large diameter reactor) affected by flow distribution
•How does monolith reactor performance compare with trickle bed reactor
•Does monolith scale reactor model (integrating flow distribution in the model) fare better than
single tube model
Gladden et al 2003 using MRI
Mewes et al. 1999 using Capa. Tomo.
Page 45
Developing User Friendly
Modules for Modeling
Multiphase Reactors
By
Canan Tunca
Page 46
Two friendly user simulation packages have been developed.
User specifies several parameters needed in reactor design
calculations.
Liquid-solid circulating bed
reactor for alkylation process
Trickle bed reactor for
phenol oxidation process
Page 48
Micro Reactors Evaluation for Environmentally Benign Processes
• Radmila Jevtic, Milorad Dudukovic, and Muthanna Al-Dahhan
CHEMICAL REACTION ENGINEERING LABORATORY
(taken from http://www.mikroglas.com)
Page 49
Introduction
The potential advantages of using
microreactors instead of
conventional reactors are
(Jensen, 2001):
• Higher surface to volume ratio
• Higher mass and heat transfer
rates
• More aggressive reaction
conditions with higher yields
• Safer operation
• Higher throughputs
• Minimal environmental hazards
CHEMICAL REACTION ENGINEERING LABORATORY
Page 50
OH OO2 HNO
3
+Caprolactam
& Adipic acid
Nylon 6 and Nylon 66
KA-mixture
>120 C ~15 bars
cobalt catalysts
4% conversion of cyclohexane ;
80% selectivity is for cyclohexanol and cyclohexanone.
The reaction has been performed under atmospheric pressure,
both at room and the elevated temperatures (up to 90oC), with or
without catalyst (cobalt naphthenate), and with various oxidants
(air, oxygen, ozone, and hydrogen peroxide).
CHEMICAL REACTION ENGINEERING LABORATORY
Test Reaction and Methodology
Page 51
CATALYSIS CHARACTERIZATION AND
DEVELOPMENT
Page 52
Heterogeneous Kinetics and Particle Chemistry Laboratory
Department of Chemical Engineering
Washington University, St. Louis MO
Research Personnel:
Professor John Gleaves Mrs. Rebecca Fushimi Miss. Pam Buzzetta
Professor Gregory Yablonsky Mr. Mike Rude Mr. Sean Mueller
Dr. Anne Gaffney Mr. David French Mr. Joseph Swisher
Mr. Josh Searcy
Atomic Tailoring of Catalyst
Surfaces for High Selectivity:
Partial Oxidation of Propane
Funded by the National Science Foundation’s GOALI (Grant Opportunities for Academic Liaison
with Industry) Initiative
Monomers Research
727 Norristown Road, PO Box 904
Spring House, Pennsylvania
Page 53
Changing the Surface Transition Metal Composition of Bulk
Catalysts
Creating Nanoscale Concentration Gradients of Transition Metal Species on Bulk
Metal Oxide Catalysts
Transition metal source
Catalyst particle
Atomic beam Laser beam
Sample holder in transfer arm
(Vacuum - 10-8 torr)
Vibrate bed
Page 54
0
0.2
0.4
0.6
0.8
1
0 20 40 60 80 100
VPO - Te Deposition
VPO
VPO - Cu Deposition
Bu
ten
e
Con
ve
rsio
n
Pulse Number
0
0.2
0.4
0.6
0.8
1
0 20 40 60 80 100
VPO
VPO - Te
VPO - Cu
Pulse Number
Norm
aliz
ed
Fu
ran
Yie
ld
Changing the Surface Transition Metal Composition of Bulk
Catalysts
Preliminary Results
Pulsed Hydrocarbon
Reduction
ROx
+ O2
POx, TRx, tRx
VPO catalyst
Oxygen-enriched
nanolayer
Butene Furan
Page 55
TAP Vacuum Pulse Response and Normal
Pressure Studies of Propane Oxidation over
MoVTeNb Oxide Catalyst
1Dept. of Chem. Eng., Washington University 2Rohm & Haas Company
Rebecca Fushimi1, Sergiy O. Shekhtman1, Michael Rude1, Anne
Gaffney2, Scott Han2, Gregory S. Yablonsky1, John T. Gleaves1
Page 56
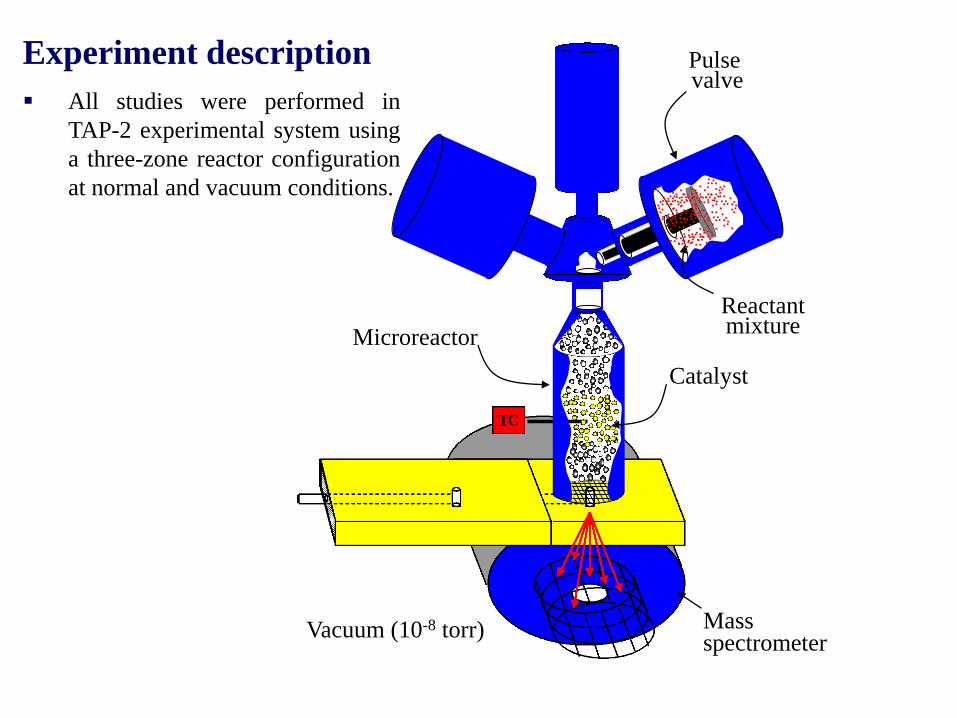
Experiment description
All studies were performed in
TAP-2 experimental system using
a three-zone reactor configuration
at normal and vacuum conditions.
TC
Pulse valve
Microreactor
Mass spectrometer
Catalyst
Vacuum (10-8 torr)
Reactant mixture
Page 57
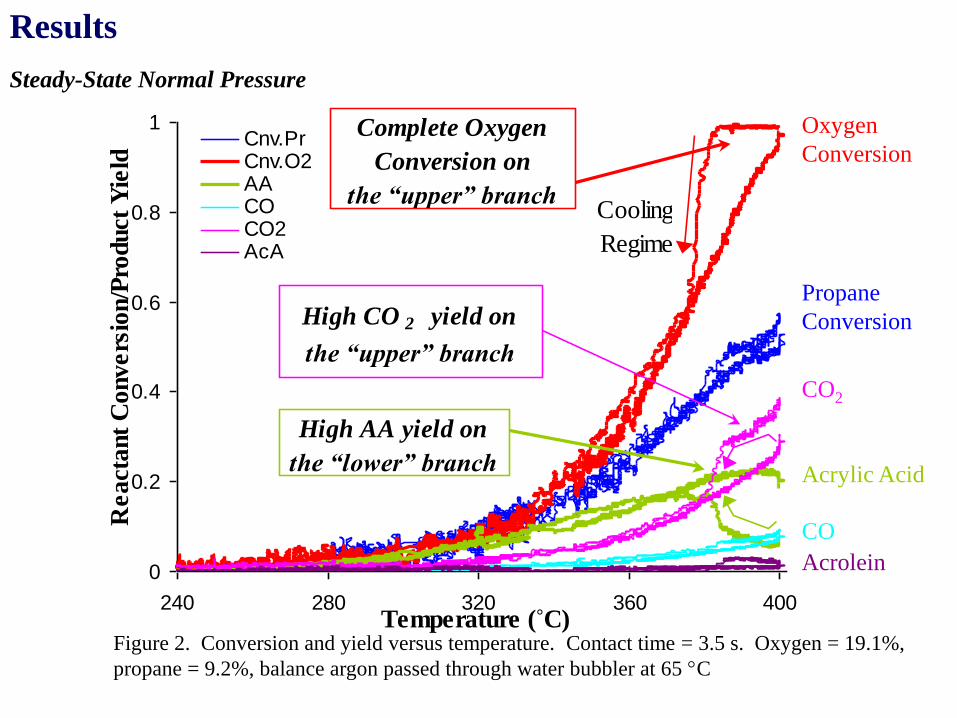
Results
Steady-State Normal Pressure
0
0.2
0.4
0.6
0.8
1
240 280 320 360 400
Cnv.PrCnv.O2AACOCO2AcA
High AA yield on
the “lower” branch
Complete Oxygen
Conversion on
the “upper” branch
High CO 2 yield on
the “upper” branch
Cooling
Regime
Re
act
an
t C
on
ve
rsio
n/P
rod
uct
Yie
ld
Temperature (˚C)
Oxygen
Conversion
Propane
Conversion
CO2
Acrylic Acid
CO
Acrolein
Figure 2. Conversion and yield versus temperature. Contact time = 3.5 s. Oxygen = 19.1%,
propane = 9.2%, balance argon passed through water bubbler at 65 C
Page 58
Statistical Analysis of Complex Diffusion-
Reaction Process in a Temporal Analysis of
Product (TAP) System
Elizabeth Maroon, Zhengjun Zhang, Michael Rude, Gregory S. Yablonsky
Department of Mathematics, Washington University
Department of Chemical. Engineering, Washington University
Page 59
Pure Diffusion – is it Normally Distributed?
Page 60
BIO-REACTORS, ENVIRONMENTAL
Page 61
A Bioenergy-Based Bench-Scale Experiment for
Undergraduate Engineering Students Using Fermiol Super HA®
Bia Henriques, Fan Mei, Kursheed Karim, Muthanna Al-Dahhan
Chemical Reaction Engineering Laboratory
Objectives: To create an experiment for undergraduate chemical engineering students that exposes
them to bioprocesses and biofuels
To give the students hands-on experience and knowledge about the dry grind corn to
ethanol process
To determine the effects of different sets of parameters on the fermentation process
To study the effect of initial substrate concentration on ethanol production and yeast
growth
To examine the following: 1) Effects of different yeast strains on fermentation
2) Optimization of parameters of a kinetic model and prediction of fermentation performance
3) Effects of various design and operation parameters on corn syrup fermentation and product inhibition
Accomplishments: Studied the effect of substrate concentration on corn syrup fermentation using a specific
strain of Saccharomyces cerevisiae
Collecting and analyzing data to validate existing kinetic models with and without the
product inhibition term
Optimized batch model parameters using experimental data
Page 62
Simulation and Design of a Process Control System for a Pilot
Plant-Scale Distillation Unit Bia Henriques, Jonathan Lowe, Robert Heider, Terry Tolliver, Rachel Vazzi, Kwaku Opoku-Mensah
Chemical Reaction Engineering Laboratory
Objectives: To simulate the distillation unit of SIU-E corn to ethanol pilot plant in HYSYS
To study the design of the distillation unit by configuring its process control system in
DeltaV
To interface HYSYS and DeltaV to provide optimum process and process control design
to SIU-E
To study the behavior of the distillation unit’s control system and devise the best tuning
method for the system
To create an interactive model of the distillation unit in order to teach operators how the
system works for better use of controls
Accomplishments: Created an interactive learning model of SIU-Es pilot plant distillation unit
Studied the effect of different tuning methods on the distillation process control
Developed interface to use process simulation in HYSYS to control the system in DeltaV
Optimized process performance by studying the behavior of the process control system
Modeled all piping and instrumentation equipment found in SIU-E’s distillation unit
Page 63
Anaerobic Digestion of
Animal Waste
Rebecca Hoffmann, Khursheed Karim,
Muthanna Al-Dahhan, Lars Angenent
Chemical Reaction Engineering Laboratory (CREL)
Bioprocessing and Bioreactor Engineering Laboratory (BELL)
2004 CREL Annual Meeting
October 28, 2004
Page 64
Background Anaerobic Digestion
Breakdown of organic molecules by microorganisms to produce methane gas which can be used as an energy source
Waste management option that is a renewable energy source
Role of mixing Substrate and microorganism distribution throughout the reactor
Ensures uniform pH and temperature
Prevents stratification and scum accumulation in dilute waste slurry
Prevents accumulation of inert solids which decreases the active volume of a digester
Effect of mixing is not well understood. Past research shows contradictory findings
Page 65
Effect of Shear on Performance and Microbial Community
in Anaerobic Digesters Treating Cow Manure
Objective:
Study the effect of mixing intensity, or applied shear, on digester performance, microbial ecology, and syntrophic relationships
Hypotheses:
Higher mixing intensities have a detrimental effect upon reactor stability.
Different mixing intensities selectively create different microbial communities within each reactor.
Higher mixing intensities break up and/or prevent the formation of larger flocs of syntrophic microorganisms
Page 66
Evaluation of Upflow Anaerobic Solids Removal
(UASR) Digester for Animal Waste Digestion
Objective:
Evaluate the UASR as a new approach for animal waste slurry
digestion and bioenergy production, focusing on the effect of
increased solids concentration on digester performance
Page 67
CHEMICAL REACTION ENGINEERING LABORATORYCHEMICAL REACTION ENGINEERING LABORATORY
Development of a Predictive Model
for Distiller’s Dried Grains/Solubles
M.N. May and R.L. Heider
Page 68
Introduction
• DDGS
– Co-product of dry grind ethanol process
– Used in animal feed
• Goal
– Develop predictive models for chemical and physical properties of DDGS
• Improve quality of DDGS product
• Neural Networks
– Derive meaning from complicated data and detect trends
– Applicable in any industry to gain insight and answers to process questions
Page 69
Rajneesh Varma Muthanna Al-Dahhan
Chemical Reaction Engineering Laboratory (CREL)
Bioprocess and Bioreactors Engineering Laboratory (BBEL)
CREL Annual Meeting October 28th 2004
CHEMICAL REACTION ENGINEERING LABORATORY
Gas Holdup Studies With CT In Anaerobic Bioreactors
Page 70
ANIMAL WASTE :Environmental Perspective and
motivation for Treatment
Unsafe and improperly disposed
Surface & groundwater contamination Ammonia leaching Methane emission Odors
Waste can be used to generate Methane Methane = Energy, 1 m3 biogas = 1.7 kWh of electricity
Biomass has applications of fertilizer and land fill Gas mixed anaerobic bioreactors are found to most the popular
choice.
Objective of The Present Work
Study the gas distribution with the aid of CT in the draft tube of a
gas mixed anaerobic bioreactor.
Compare the efficiency of ejectors ( single point gas injection system) versus a sparger is gas mixed bioreactors.
CHEMICAL REACTION ENGINEERING LABORATORY
38 mm
334 mm
140 mm
153 mm
26mm
25 0 Angle
40 mm
Level 2
Level 1
50 m m
153 mm Diameter
100 mm
50 m m
Angle
22
0 m
m
15
0 m
m
38 mm
33
4 m
m
140 mm
153 mm
26mm 25
0
40 mm
Level 1
Level 1
50
m m
100 mm
mm
Gas
injection
port
Page 71
Key Results
o X-ray diffraction and VSM
results of the powder
collected show the
presence of pure Fe2 O3
with high saturation
magnetization.
o Flame pyrolysis of Iron
pentacarbonyl gives
Maghemite, Ferrocene
gives Magnetite; whereas
Iron nitrate gives Hematite.
oPost heat treatment of
maghemite and magnetite
showed to gradually
transform to hematite at
500o C.
Prakash Kumar, M. P. Dudukovic, Da-Ren Chen, Richard Axelbaum, Ronald Indeck, Pratim Biswas
Structural and magnetic properties of flame aerosol
synthesized nanoparticles as a function of size
Biomedical Applications
o Biocompatible ferromagnetic particles for targeted drug delivery
o Selective deposition of magnetic particles for Tumor necrosis
o Magnetic particles guided by external magnetic field for Aneurysm
treatment
Modified DMA Flame Reactor
SEM –γ Fe2O3
Page 72
Product Development in ChE:
• New Courses Added:
– New Product and Process Development (ChE 450)
– Product Development Methodologies (ChE 452)
• Unconventional Topics:
– Creativity and Innovation
– Intellectual Property
– The Theory of Inventive Problem Solving (TRIZ)
– Design of Experiments
– Impact of the Customer/Consumer
– Fermi Problems
– Product Focused Economics
• The Instructor:
– Nick Nissing, Adjunct Faculty
– Ex-P&G product development
– Patent agent
– Corporate IP Consultant
• How could we be useful to
industry?
– Brainstorming?
– Consumer testing?
– New Product Ideas?
– In class or outside of class?