SUNY Plasburgh Digital Commons @ SUNY Plasburgh Center for Earth and Environmental Science Student Posters Center for Earth and Environmental Science 5-1-2014 Survey of Migratory Waterfowl on Krystal Lake Quarry Pond, Chazy, NY Michelle Berrus SUNY Plasburgh, [email protected]Follow this and additional works at: hp://digitalcommons.plasburgh.edu/cees_student_posters is Article is brought to you for free and open access by the Center for Earth and Environmental Science at Digital Commons @ SUNY Plasburgh. It has been accepted for inclusion in Center for Earth and Environmental Science Student Posters by an authorized administrator of Digital Commons @ SUNY Plasburgh. Recommended Citation Berrus, Michelle, "Survey of Migratory Waterfowl on Krystal Lake Quarry Pond, Chazy, NY " (2014). Center for Earth and Environmental Science Student Posters. Book 7. hp://digitalcommons.plasburgh.edu/cees_student_posters/7
Transcript
SUNY PlattsburghDigital Commons @ SUNY PlattsburghCenter for Earth and Environmental ScienceStudent Posters Center for Earth and Environmental Science
5-1-2014
Survey of Migratory Waterfowl on Krystal LakeQuarry Pond, Chazy, NYMichelle BerrusSUNY Plattsburgh, [email protected]
Follow this and additional works at: http://digitalcommons.plattsburgh.edu/cees_student_posters
This Article is brought to you for free and open access by the Center for Earth and Environmental Science at Digital Commons @ SUNY Plattsburgh. Ithas been accepted for inclusion in Center for Earth and Environmental Science Student Posters by an authorized administrator of Digital Commons @SUNY Plattsburgh.
Recommended CitationBerrus, Michelle, "Survey of Migratory Waterfowl on Krystal Lake Quarry Pond, Chazy, NY " (2014). Center for Earth andEnvironmental Science Student Posters. Book 7.http://digitalcommons.plattsburgh.edu/cees_student_posters/7
Survey of Migratory Waterfowl on Krystal Lake Quarry Pond, Chazy, NY Michelle Berrus ([email protected])
Faculty Mentor: Danielle Garneau Ph.D., David Franzi Ph.D., and Jacob Straub Ph.D.
SUNY Plattsburgh - Center for Earth and Environmental Science Plattsburgh, NY 12901
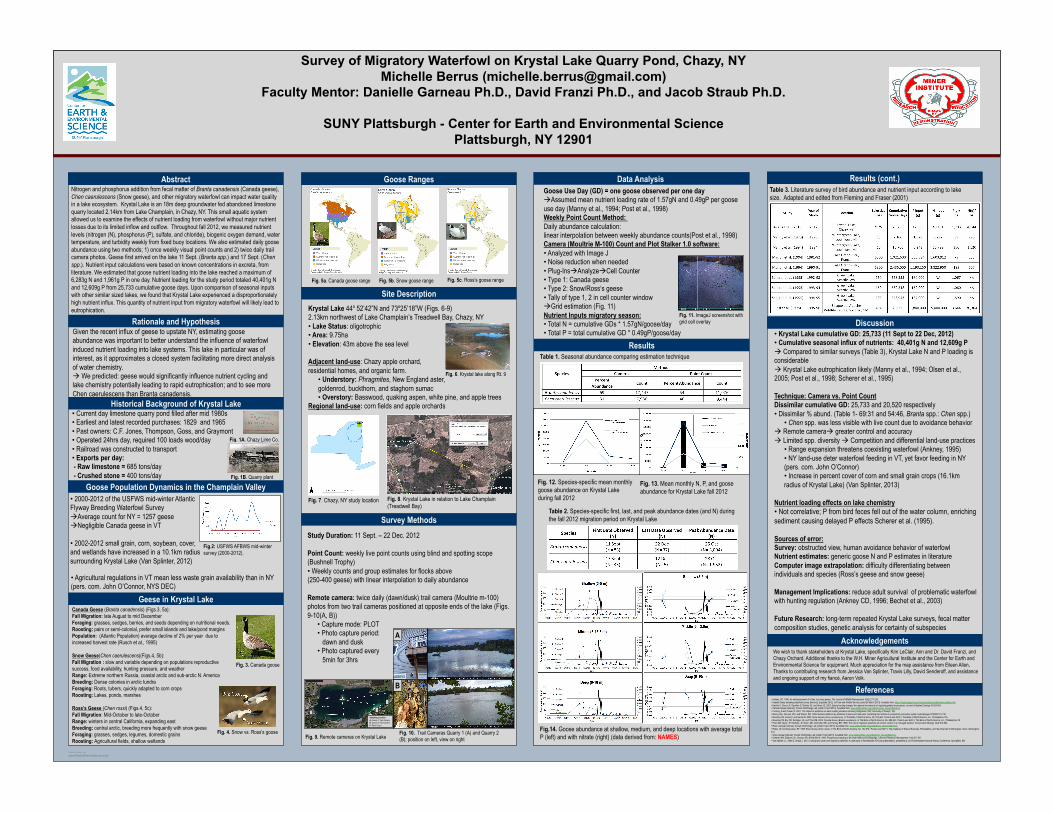
Abstract Nitrogen and phosphorus addition from fecal matter of Branta canadensis (Canada geese), Chen caerulescens (Snow geese), and other migratory waterfowl can impact water quality in a lake ecosystem. Krystal Lake is an 18m deep groundwater fed abandoned limestone quarry located 2.14km from Lake Champlain, in Chazy, NY. This small aquatic system allowed us to examine the effects of nutrient loading from waterfowl without major nutrient losses due to its limited inflow and outflow. Throughout fall 2012, we measured nutrient levels (nitrogen (N), phosphorus (P), sulfate, and chloride), biogenic oxygen demand, water temperature, and turbidity weekly from fixed buoy locations. We also estimated daily goose abundance using two methods; 1) once weekly visual point counts and 2) twice daily trail camera photos. Geese first arrived on the lake 11 Sept. (Branta spp.) and 17 Sept. (Chen spp.). Nutrient input calculations were based on known concentrations in excreta, from literature. We estimated that goose nutrient loading into the lake reached a maximum of 6,283g N and 1,961g P in one day. Nutrient loading for the study period totaled 40,401g N and 12,609g P from 25,733 cumulative goose days. Upon comparison of seasonal inputs with other similar sized lakes, we found that Krystal Lake experienced a disproportionately high nutrient influx. This quantity of nutrient input from migratory waterfowl will likely lead to eutrophication.
Geese in Krystal Lake
Site Description Krystal Lake 44⁰ 52’42”N and 73⁰25’18”W (Figs. 6-9) 2.13km northwest of Lake Champlain’s Treadwell Bay, Chazy, NY • Lake Status: oligotrophic • Area: 9.75ha • Elevation: 43m above the sea level
Adjacent land-use: Chazy apple orchard, residential homes, and organic farm.
• Understory: Phragmites, New England aster, goldenrod, buckthorn, and staghorn sumac • Overstory: Basswood, quaking aspen, white pine, and apple trees
Regional land-use: corn fields and apple orchards
Survey Methods Study Duration: 11 Sept. – 22 Dec. 2012
Point Count: weekly live point counts using blind and spotting scope (Bushnell Trophy) • Weekly counts and group estimates for flocks above (250-400 geese) with linear interpolation to daily abundance
Remote camera: twice daily (dawn/dusk) trail camera (Moultrie m-100) photos from two trail cameras positioned at opposite ends of the lake (Figs. 9-10(A, B))
• Capture mode: PLOT • Photo capture period: dawn and dusk • Photo captured every 5min for 3hrs
Data Analysis
Discussion
Acknowledgements
References
We wish to thank stakeholders at Krystal Lake, specifically Kim LeClair, Ann and Dr. David Franzi, and Chazy Orchard. Additional thanks to the W.H. Miner Agricultural Institute and the Center for Earth and Environmental Science for equipment. Much appreciation for the map assistance from Eileen Allen. Thanks to contributing research from Jessica Van Splinter, Travis Lilly, David Senderoff, and assistance and ongoing support of my fiancé, Aaron Volk.
• Ankney, CD. 1996. An embarrassment of riches: too many geese. The Journal of Wildlife Management. 60(2):217-233. • Atlantic flyway breeding waterfowl survey [Internet]. [Updated 2012]. US Fish and Wildlife Service; [cited 29 March 2013]. Available from: https://migbirdapps.fws.gov/mbdc/databases/afbws/aboutafbws.htm • Bechet A, Giroux JF, Gauthier G, Nichols JD, and Hines JE. 2003. Spring hunting changes the regional movements of migrating greater snow geese. Journal of Applied Ecology 40:553-564. • Canada Goose [Internet]. Cornell Ornithology Lab; [cited 01 April 2013]. Available from: www.allaboutbirds.org/guide/Canada_Goose/lifehistory. • Fleming, R and Fraser, H. 2001. The impact of waterfowl on water quality [Literature Review]. Ridgetown (ON): University of Guelph. 15p. • Manny, BA, Johnson, WC, and Wetzel, RG. 1994. Nutrient additions by waterfowl to lakes and reservoirs: predicting their effects on productivity and water quality. Hydrobiologia 279/280:121-132. • Mowbray TB, Cooke F, and Ganter B. 2000. Snow Goose (Chen caerulescens). In The Birds of North America, No. 514 (Ed.: Poole A and Gill F.). The Birds of North America, Inc., Philadelphia, P.A. • Mowbray TB, Ely, CR, Sedinger, JS, and Trost RE. 2002. Canada Goose (Branta canadensis). In The Birds of North America, No. 682 (Ed.: Poole A and Gill F.). The Birds of North America, Inc., Philadelphia, PA • Post, DM, Taylor, JP, Kitchelle, JF, Olson, MH, Schindler, DE, and Herwig, BR. 1998. The role of migratory waterfowl as nutrient vectors in a managed wetland. Conservation Biology 12(4):910-920. • Ross’s Goose [Internet]. Cornell Ornithology Lab; [cited 01 April 2013]. Available from: www.allaboutbirds.org/guide/Rosss_Goose/lifehistory. • Ryder, JP, and Alisauskas, RT. 1995. Ross’ Goose (Chen rossii). In The Birds of North America, No. 162 (Ed.: Poole A and Gill F). The Academy of Natural Sciences, Philadelphia, and the American Ornithologists’ Union, Washington, D.C. • Snow Goose [Internet]. Cornell Ornithology Lab; [cited 01 April 2013]. Available from: www.allaboutbirds.org/guide/Snow_Goose/lifehistory. • Scherer, NM, Gibbons, HL, Stoops, KB, and Muller M. 1994. Phosphorous loading of an urban lake by bird droppings. Lake and Reservoir Management 11(4):317-327. • Van Splinter J L, Allen E, Straub J. 2013. Linking land cover and migratory waterfowl: A case study in Northeastern NY [oral presentation]. presented at: 2013 Northeastern Natural History Conference, Springfield, MA.
Historical Background of Krystal Lake
Goose Use Day (GD) = one goose observed per one day !Assumed mean nutrient loading rate of 1.57gN and 0.49gP per goose use day (Manny et al., 1994; Post et al., 1998) Weekly Point Count Method: Daily abundance calculation: linear interpolation between weekly abundance counts(Post et al., 1998) Camera (Moultrie M-100) Count and Plot Stalker 1.0 software: • Analyzed with Image J • Noise reduction when needed • Plug-Ins!Analyze!Cell Counter • Type 1: Canada geese • Type 2: Snow/Ross‘s geese • Tally of type 1, 2 in cell counter window ! Grid estimation (Fig. 11) Nutrient Inputs migratory season: • Total N = cumulative GDs * 1.57gN/goose/day • Total P = total cumulative GD * 0.49gP/goose/day
• Current day limestone quarry pond filled after mid 1980s • Earliest and latest recorded purchases: 1829 and 1965 • Past owners: C.F. Jones, Thompson, Goss, and Graymont • Operated 24hrs day, required 100 loads wood/day • Railroad was constructed to transport • Exports per day: - Raw limestone = 685 tons/day - Crushed stone = 400 tons/day
Goose Population Dynamics in the Champlain Valley
Canada Geese (Branta canadensis) (Figs.3, 5a): Fall Migration: late August to mid December Foraging: grasses, sedges, berries, and seeds depending on nutritional needs. Roosting: pairs or semi-colonial, prefer small islands and lake/pond margins Population: (Atlantic Population) average decline of 2% per year due to increased harvest rate (Rusch et al., 1995)
Snow Geese(Chen caerulescens)(Figs.4, 5b): Fall Migration : slow and variable depending on populations reproductive success, food availability, hunting pressure, and weather Range: Extreme northern Russia, coastal arctic and sub-arctic N. America Breeding: Dense colonies in arctic tundra Foraging: Roots, tubers, quickly adapted to corn crops Roosting: Lakes, ponds, marshes
Ross’s Geese (Chen rossi) (Figs.4, 5c): Fall Migration: Mid-October to late-October Range: winters in central California, expanding east Breeding: central arctic, breeding more frequently with snow geese Foraging: grasses, sedges, legumes, domestic grains Roosting: Agricultural fields, shallow wetlands
Fig. 1A. Chazy Lime Co.
Fig. 1B. Quarry plant
Fig. 8. Krystal Lake in relation to Lake Champlain (Treadwell Bay)
Fig. 10. Trail Cameras Quarry 1 (A) and Quarry 2 (B); position on left, view on right
B
Fig. 11. ImageJ screenshot with grid cell overlay
Results
Fig. 12. Species-specific mean monthly goose abundance on Krystal Lake during fall 2012
Table 3. Literature survey of bird abundance and nutrient input according to lake size. Adapted and edited from Fleming and Fraser (2001)
Table 2. Species-specific first, last, and peak abundance dates (and N) during the fall 2012 migration period on Krystal Lake
Fig. 7. Chazy, NY study location
Fig. 4. Snow vs. Ross’s goose
Fig. 3. Canada goose
Fig. 13. Mean monthly N, P, and goose abundance for Krystal Lake fall 2012
Fig.2: USFWS AFBWS mid-winter survey (2000-2012).
• 2000-2012 of the USFWS mid-winter Atlantic Flyway Breeding Waterfowl Survey ! Average count for NY = 1257 geese ! Negligible Canada geese in VT
• 2002-2012 small grain, corn, soybean, cover, and wetlands have increased in a 10.1km radius surrounding Krystal Lake (Van Splinter, 2012)
Results (cont.)
Fig. 9. Remote cameras on Krystal Lake
Goose Ranges
Fig. 5a. Canada goose range Fig. 5b. Snow goose range Fig. 5c. Ross’s goose range
Fig. 6. Krystal lake along Rt. 9
• Agricultural regulations in VT mean less waste grain availability than in NY (pers. com. John O’Connor, NYS DEC)
Rationale and Hypothesis Given the recent influx of geese to upstate NY, estimating goose abundance was important to better understand the influence of waterfowl induced nutrient loading into lake systems. This lake in particular was of interest, as it approximates a closed system facilitating more direct analysis of water chemistry. ! We predicted: geese would significantly influence nutrient cycling and lake chemistry potentially leading to rapid eutrophication; and to see more Chen caerulescens than Branta canadensis.
• Krystal Lake cumulative GD: 25,733 (11 Sept to 22 Dec, 2012) • Cumulative seasonal influx of nutrients: 40,401g N and 12,609g P ! Compared to similar surveys (Table 3), Krystal Lake N and P loading is considerable ! Krystal Lake eutrophication likely (Manny et al., 1994; Olsen et al., 2005; Post et al., 1998; Scherer et al., 1995)
Technique: Camera vs. Point Count Dissimilar cumulative GD: 25,733 and 20,520 respectively • Dissimilar % abund. (Table 1- 69:31 and 54:46, Branta spp.: Chen spp.)
• Chen spp. was less visible with live count due to avoidance behavior ! Remote camera! greater control and accuracy ! Limited spp. diversity ! Competition and differential land-use practices
• Range expansion threatens coexisting waterfowl (Ankney, 1995) • NY land-use deter waterfowl feeding in VT, yet favor feeding in NY (pers. com. John O’Connor) • Increase in percent cover of corn and small grain crops (16.1km radius of Krystal Lake) (Van Splinter, 2013)
Nutrient loading effects on lake chemistry • Not correlative; P from bird feces fell out of the water column, enriching sediment causing delayed P effects Scherer et al. (1995).
Sources of error: Survey: obstructed view, human avoidance behavior of waterfowl Nutrient estimates: generic goose N and P estimates in literature Computer image extrapolation: difficulty differentiating between individuals and species (Ross’s geese and snow geese)
Management Implications: reduce adult survival of problematic waterfowl with hunting regulation (Ankney CD, 1996; Bechet et al., 2003)
Future Research: long-term repeated Krystal Lake surveys, fecal matter composition studies, genetic analysis for certainty of subspecies