Page 1
Yamashita et al. Symmetry of 64-cell retinal thicknesses by SD-OCT
1
Title: 1
Posterior pole asymmetry analyses of retinal thickness of upper and lower 2
sectors and their association with peak retinal nerve fiber layer thickness in 3
healthy young eyes 4
5
Takehiro Yamashita, Taiji Sakamoto, Naoko Kakiuchi, Minoru Tanaka, Yuya Kii, 6
Kumiko Nakao 7
Department of Ophthalmology, Kagoshima University Graduate School of Medical 8
and Dental Sciences, Kagoshima, Japan 9
10
Running head: Symmetry of 64-cell retinal thicknesses by SD-OCT 11
Corresponding author: Taiji Sakamoto, Department of Ophthalmology, Kagoshima 12
University Graduate School of Medical and Dental Sciences, Kagoshima, Japan. Tel: 13
(81) 99-275-5402, Fax: (81) 99-265-4894. 14
e-mail: [email protected] 15
16
Word count: abstract 250 words, text 3407 words. Figures: 5. Table: 1. 17
Supplementary Table: 3 18
19
20
IOVS Papers in Press. Published on August 12, 2014 as Manuscript iovs.13-13828
Copyright 2014 by The Association for Research in Vision and Ophthalmology, Inc.
Page 2
Yamashita et al. Symmetry of 64-cell retinal thicknesses by SD-OCT
page 2
PURPOSE: To determine the symmetry of the retinal thicknesses (RT) between 21
the 32 pairs of superior and inferior sectors by posterior pole asymmetrical analysis 22
(PPAA) of the spectral domain optical coherence tomographic (SD-OCT) images in 23
healthy eyes. In addition, to determine their association with the position of the 24
peak retinal nerve fiber layer (RNFL) thickness. 25
METHODS: A prospective observational cross sectional study of 64 right eyes. The 26
Spectralis SD-OCT was used to obtain the images, and the PPAA determined the 27
RT of the 64 cells within the central 24° area. The program also compared the 28
thicknesses of corresponding cells across the fovea-disc axis. Circular scans were 29
used to measure the supra- and infra-temporal RNFL peak angle differences (PADs). 30
The relationships between the RT of the corresponding cells and the relationship 31
between the differences of the RT of the corresponding cells and PAD were 32
investigated by linear regression analysis. 33
RESULTS: The mean differences between the RT of corresponding cells ranged 34
from 3.1 to 23.2 µm. The RT of all upper cells were significantly correlated with the 35
RT of the corresponding lower cells (R=0.45-0.97, P <0.001). The coefficients of 36
correlation between the corresponding pairs of central-macular and temporal-37
macular cells were higher than that of the peripheral and nasal-macular cells. The 38
differences of the pairs of nasal-macular cells RT were significantly correlated with 39
the PAD. 40
CONCLUSIONS: The symmetry of the RT between the upper and lower cells was 41
high in the central and temporal-macular areas but not in the peripheral and nasal-42
macular areas. 43
44
Page 3
Yamashita et al. Symmetry of 64-cell retinal thicknesses by SD-OCT
3
Precis 45
46
Posterior pole analyses of healthy young eyes showed that the symmetry between 47
upper and lower retinal thicknesses in the central-macular and temporal-macular 48
areas was high but moderate in the nasal-macular area. Special caution is needed 49
when assessing the symmetry between these sectors in diseased eyes. 50
51
Page 4
Yamashita et al. Symmetry of 64-cell retinal thicknesses by SD-OCT
page 4
INTRODUCTION 52
53
Evidence has been accumulating that the retinal thickness (RT) determined by 54
optical coherence tomography (OCT)1-3 is an important parameter for diagnosing 55
different types of retinal diseases.4-6 Recently, an asymmetry test, called posterior 56
pole asymmetry analysis (PPAA) by OCT, was introduced for diagnosing glaucoma 57
and is expected to improve the accuracy of diagnosing glaucoma.6 The PPAA, 58
installed in the Spectralis-OCT, can calculate the RT of 64 (8 x 8) cells within the 59
central 24° area and can also perform comparisons of the corresponding cells 60
across the fovea-disc axis. Its diagnostic accuracy was reported to be similar to 61
that obtained by retinal nerve fiber layer (RNFL) thickness circle scans.7-10 62
63
The PPAA is based on the hypothesis that the hemispherical symmetry of the RT is 64
altered by an asymmetrical thinning of the RNFL, ganglion cell layer, and inner 65
plexiform layer in glaucomatous eyes.6 However to the best of our knowledge, 66
there is no detailed report on the symmetry of the retinal thicknesses in normal 67
subjects especially in the data obtained by SD-OCT PPAA. An earlier study 68
showed that a significant correlation was present between the RNFL thicknesses of 69
the supra-temporal to infra-temporal cells across the fovea-disc axis.11 However, 70
the coefficient of determination was only 0.112, a correlation coefficient 0.335.11 In 71
addition, there were some healthy eyes with asymmetry of the thick retinal nerve 72
fiber bundles in the superior and inferior sectors. Thus, this asymmetry of the RNFL 73
thickness may not be rare or there may be a factor that alters the hemispherical 74
symmetry of the RT. 75
76
Page 5
Yamashita et al. Symmetry of 64-cell retinal thicknesses by SD-OCT
5
To improve the diagnostic accuracy of PPAA, it is necessary to know the actual 77
symmetry of healthy eyes and the factors affecting the measurements. Thus, we 78
first investigated the relationship between corresponding cells across the fovea-disc 79
axis. Then, with the hypothesis that the deviation of RNFL peak affects the 80
hemispherical symmetry, the correlation of the RNFL peak and the RT symmetry of 81
healthy eyes was evaluated. 82
83
METHODS 84
85
All of the procedures used conformed to the tenets of the Declaration of Helsinki. A 86
written informed consent was obtained from all of the subjects after an explanation of 87
the procedures to be used. The study was approved by the Ethics Committee of 88
Kagoshima University Hospital, and it was registered with the University Hospital 89
Medical Network (UMIN)-clinical trials registry (CTR). The registration title was, 90
“Morphological analysis of the optic disc and the retinal nerve fiber in myopic eyes” 91
and the registration number was UMIN000006040. A detailed protocol is available 92
at https://upload.umin.ac.jp/cgi-open-93
bin/ctr/ctr.cgi?function=brows&action=brows&type=summary&recptno=R00000715494
&language=J. The results presented in this manuscript are part of the overall study. 95
96
Subjects 97
98
This was a cross sectional, prospective, observational study of 72 eyes of 72 99
volunteers that were examined between February 1, 2011 and February 20, 2012. 100
The volunteers had no eye diseases as determined by examining their medical 101
Page 6
Yamashita et al. Symmetry of 64-cell retinal thicknesses by SD-OCT
page 6
history and our examinations. The data from only the right eyes were analyzed. 102
The inclusion criteria were: age ≥20 years but ≤40 years; eyes normal by slit–lamp 103
biomicroscopy, ophthalmoscopy, and OCT; best-corrected visual acuity of ≤0.1 104
logarithm of the minimum angle of resolution (logMAR) units; and intraocular 105
pressure (IOP) ≤21 mmHg. The exclusion criteria were: eyes with known ocular 106
diseases such as glaucoma, staphyloma, and optic disc anomaly; eyes of subjects 107
with known systemic diseases such as hypertension and diabetes; presence of 108
visual field defects; and prior refractive or intraocular surgery. None of the eyes 109
was initially excluded because of poor OCT image quality caused by poor fixation. 110
Seventy-two Japanese volunteers were screened for this project. One eye was 111
excluded due to a superior segmental optic disc hypoplasia, and two eyes because 112
of prior refractive surgery. Five other eyes were excluded because of segmentation 113
error in the retinal thicknesses. In the end, the right eyes of 64 individuals (42 men 114
and 22 women) were used for the analyses. 115
116
Measurement of axial length, refractive error, and RT of 64 sectors in posterior 117
pole 118
119
All of the eyes had a standard ocular examination consisting of slit-lamp 120
biomicroscopy of the anterior segment, ophthalmoscopy of the ocular fundus, IOP 121
measurements with a pneumo-tonometer (CT-80, Topcon, Tokyo, Japan), and axial 122
length measurements with the AL-2000 ultrasound instrument (TOMEY, Japan). 123
The refractive error (spherical equivalent) was measured with the Topcon KR8800 124
auto-refractometer/keratometer. 125
126
Page 7
Yamashita et al. Symmetry of 64-cell retinal thicknesses by SD-OCT
7
The retinal thickness was measured with the Spectralis SD-OCT (Heidelberg 127
Engineering, Germany) using the images obtained by PPAA scans. In this protocol, 128
the OCT instrument automatically draws a line connecting the center of the fovea 129
and the center of the optic disc as a reference line. Then, 61 line scans (1024 A 130
scans/line) parallel to the reference line within the central 25° x 30° are recorded. 131
In this protocol, B-scan observations were made by averaging 5 overlapping B-132
scans/image on each line scan. These 5 scans were used to obtain the RT values 133
for each cell. The embedded OCT software determined the distance between the 134
internal limiting membrane and the Bruch’s membrane and recorded this distance as 135
the RT. Then, 3D RT maps were created based upon these data. The quality of 136
the scans is indicated by a color scale at the bottom of the scanned images, and it 137
had to be in the green range to be considered a good quality scan. In addition, the 138
SD-OCT macular map provided a color scale representation of the topographic RT 139
which helped evaluate the image quality. Initially, we examined all of the B-scan 140
images of each eye to determine whether there were any segmentation errors in the 141
images. The following criteria were used to identify segmentation errors in the B-142
scans: obvious disruptions or abrupt 5% consecutive changes at a border or 20% 143
cumulative of the entire image.7,12 Five eyes were excluded because of 144
segmentation error in the RT. These excluded cases were perfectly matched by 145
these two methods, i.e., the color scale and B-scan images. 146
147
The average RT of each 8 by 8 (3° by 3°) sector which made up the 64 sectors was 148
determined. Our earlier study showed that the inter-observer and the inter-visit 149
reproducibilities of the PPAA were excellent.13 Therefore, one scan was sufficient 150
to measure the mean RT of the 64 cells in the PPAA scan. The 64 cells were 151
Page 8
Yamashita et al. Symmetry of 64-cell retinal thicknesses by SD-OCT
page 8
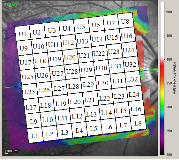
numbered as in Figure 1. 152
153
Measurement of position of supra and infra temporal peak RNFL thickness 154
angles and calculation of difference between angles 155
The RNFL thickness was measured with the Spectralis SD-OCT using the RNFL 156
circle scan. The temporal-superior-nasal-inferior-temporal (TSNIT) thickness 157
curves were used to measure the angle between supra-temporal or infra-temporal 158
peaks of the RNFL thickness and the fovea-disc axis. We determined the peak 159
angles in the TSNIT thickness profile of the RNFL thickness analyses. The 160
distance between the peak RNFL thickness for the supra-temporal or infra-temporal 161
RNFL peaks and fovea-disc axis were determined by dragging a vertical line in the 162
profile graph in the Spectralis OCT software and Photoshop. The position of fovea-163
disc axis was determined as the intersection between the fovea-disc axis of the 164
PPAA scan and the scan circle of RNFLT. Then, the distance between the fovea-165
disc axis and supra-temporal (X1a+X1b of Figure 2) or infra-temporal RNFL peaks 166
(X2 of Figure 2) was converted to an angular value by dividing by the entire distance 167
(Y) and multiplying by 360 (Figure 2).14,15 The peak angle difference (PAD) was 168
calculated as the difference between the supra-temporal peak RNFL angle and the 169
infra-temporal peak RNFL angle. 170
171
Statistical Analyses 172
173
All statistical analyses were performed with the SPSS statistics 21 for Windows 174
(SPSS Inc., IBM, Somers, New York, USA). The relationships between the 32 175
corresponding upper and lower RT pairs were determined by the Pearson 176
Page 9
Yamashita et al. Symmetry of 64-cell retinal thicknesses by SD-OCT
9
coefficients of correlation. The relationships between the RT of each of the 177
difference between corresponding upper and lower RT of 32 pairs and the PAD were 178
determined by the Spearman coefficients of correlation. 179
180
RESULTS 181
182
The mean ± standard deviation of the age was 26.0 ± 4.5 years (range, 22 to 40 183
years), and the mean refractive error (spherical equivalent) was -4.1 ± 3.1 diopters 184
(D) (range, -14.3 to 0.0 D). The mean axial length was 25.0 ± 1.3 mm (range, 22.4 185
to 28.2 mm), and the mean PAD was -1.9 ± 11.5 degrees (range, -27.4 to 23.5 186
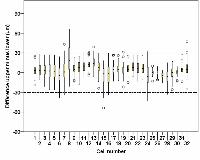
degrees). The differences between corresponding upper and lower RT of the 32 187
pairs are shown in Figure 3. 188
189
Pearson coefficients of correlation between corresponding upper and lower 190
RT cells 191
192
The RTs of the corresponding upper and lower 32 pairs of cells were significantly 193
correlated (R = 0.45 to 0.97, P <0.001; Table 1). The correlation coefficients of the 194
pairs of central (12° by 12°) and temporal macular cells were higher than that of the 195
pairs of nasal-macular cells. 196
Page 10
Yamashita et al. Symmetry of 64-cell retinal thicknesses by SD-OCT
page 10
197
198
Spearman correlation coefficient of differences between RT of corresponding 199
cells and PAD 200
201
The PAD was significantly correlated with the differences between corresponding 202
RTs of the 8 nasal pairs (R = 0.25 to 0.45, P <0.05) but was not significantly 203
correlated with the differences between the corresponding RTs of the central and the 204
24 temporal macular pairs (P >0.05; Table 1). 205
206
Correspondingcell number
Mean ± SD RangeAbsolute
valueMean ± SD
R p value R p value
1 3.2 ± 8.3 -19 ~ 25 6.6 ± 5.7 0.74 <0.001* 0.04 0.792 4.1 ± 9.2 -11 ~ 28 8.1 ± 6 0.75 <0.001* 0.07 0.603 3.7 ± 10.3 -21 ~ 27 8.7 ± 6.5 0.72 <0.001* 0.05 0.724 2.7 ± 12.2 -26 ~ 27 10.2 ± 7.1 0.66 <0.001* 0.18 0.155 2.8 ± 12.8 -26 ~ 27 10.5 ± 7.8 0.70 <0.001* 0.16 0.226 -3.9 ± 14.2 -39 ~ 24 11.8 ± 8.6 0.68 <0.001* 0.14 0.287 2.8 ± 15.1 -34 ~ 43 11.9 ± 9.7 0.64 <0.001* 0.11 0.398 21.5 ± 21 -21 ~ 66 23.2 ± 18.8 0.45 <0.001* 0.06 0.669 5.4 ± 7.8 -13 ~ 23 7.6 ± 5.6 0.77 <0.001* -0.14 0.2710 8 ± 9.1 -18 ~ 25 10.1 ± 6.7 0.74 <0.001* -0.08 0.5311 9.6 ± 8.3 -7 ~ 31 10.1 ± 7.7 0.80 <0.001* 0.01 0.9312 12.2 ± 7.6 -4 ~ 31 12.4 ± 7.2 0.85 <0.001* 0.22 0.0813 14.8 ± 8.4 -6 ~ 39 15 ± 8 0.84 <0.001* 0.25 0.04*14 7.9 ± 10.1 -24 ~ 30 10.7 ± 7.1 0.80 <0.001* 0.43 <0.001*15 -5 ± 14.3 -54 ~ 18 11.4 ± 9.9 0.72 <0.001* 0.45 <0.001*16 -2.5 ± 16.1 -34 ~ 29 13.3 ± 9.1 0.68 <0.001* 0.35 0.01*17 4.9 ± 7.4 -13 ~ 27 6.8 ± 5.7 0.81 <0.001* 0.07 0.5618 5.9 ± 7.1 -12 ~ 26 7.2 ± 5.8 0.86 <0.001* 0.21 0.1019 3.8 ± 8 -22 ~ 31 6.5 ± 5.9 0.86 <0.001* 0.08 0.5220 5.7 ± 7.3 -15 ~ 25 7.3 ± 5.6 0.89 <0.001* 0.10 0.4321 8.9 ± 8.4 -6 ~ 27 9.6 ± 7.6 0.87 <0.001* 0.19 0.1422 7.1 ± 8.4 -13 ~ 26 8.8 ± 6.6 0.87 <0.001* 0.25 0.05*23 6.7 ± 9 -11 ~ 26 8.9 ± 6.8 0.84 <0.001* 0.32 0.01*24 -3.1 ± 15.9 -43 ~ 32 12.8 ± 9.4 0.74 <0.001* 0.40 <0.01*25 0.2 ± 4.3 -13 ~ 10 3.3 ± 2.7 0.95 <0.001* -0.05 0.7126 -0.6 ± 4.2 -11 ~ 9 3.3 ± 2.7 0.96 <0.001* -0.01 0.9627 -3.9 ± 3.9 -16 ~ 3 4.2 ± 3.6 0.97 <0.001* 0.04 0.7628 -5.5 ± 11.3 -33 ~ 15 10 ± 7.6 0.77 <0.001* 0.24 0.0629 -0.5 ± 9.1 -26 ~ 17 7.1 ± 5.7 0.86 <0.001* 0.11 0.4130 0.8 ± 4 -13 ~ 9 3.1 ± 2.7 0.97 <0.001* 0.16 0.2231 4.8 ± 5.9 -14 ~ 28 5.8 ± 4.8 0.94 <0.001* 0.27 0.03*32 6.3 ± 11.1 -25 ~ 47 8.6 ± 8.9 0.81 <0.001* 0.05 0.69
SD: standard deviation, *:statistically significant correlation (p < 0.05)
Pearson correlation coefficient Spearman correlation coefficient
Difference between correspondingupper and lower cells retinal thickness
(μm)
Table 1. Difference and correlation between corresponfing upper and lower cells retinal thickness and its relationship with peakangle difference.
Corresponding upper and lowercells retinal thickness
Difference between correspondingcells retinal thickness and peak
angle difference
Page 11
Yamashita et al. Symmetry of 64-cell retinal thicknesses by SD-OCT
11
DISCUSSION 207
208
Our results showed that the RT of cells in the temporal and central areas of the 209
central fundus were quite similar to the corresponding cells across the fovea-disc 210
axis, indicating that the symmetry was good in these areas. The differences in the 211
thicknesses between the upper and lower counterparts across the fovea-disc axis 212
was mostly less than 30 µm (2000/2048 cells, 97.7 %). Seo et al reported that the 213
diagnostic ability of PPAA for detecting localized RNFL defects was good with good 214
sensitivity.7 In their algorithm, a difference of 30 µm or greater was used as the 215
cutoff value for the cell-to-cell comparisons. The area under the receiver operating 216
characteristic (AUROC) of the PPAA based on the number of black cells was 0.958 ± 217
0.013 in 84 open angle glaucoma subjects with localized, wedge-shaped-RNFL 218
defects in the red-free RNFL photographs and 122 eyes of healthy subjects.7 This 219
cutoff value was selected based on the findings reported by previous studies.8,9 220
Because the symmetry of upper and lower cells was good with the values generally 221
less than 30 µm in healthy eyes in our study, this value would be reasonable and 222
acceptable. Additionally, because the differences of the corresponding cells in the 223
lateral macular area (cell numbers 25, 26, and 27) was very small in healthy eyes, 224
even a 10 µm cut-off value might be acceptable in identifying an alteration of the 225
symmetry for cells of that area in early glaucomatous eyes. For example, Um et al 226
divided the macular thickness values into those corresponding to the superior and 227
inferior macular thickness zones, and then evaluated the symmetry between 228
corresponding superior and inferior macular zones. They considered that the 229
results of these comparisons were more sensitive than the RNFL thickness for 230
detecting early stage glaucoma. The cutoff values of the zones, as obtained by 231
Page 12
Yamashita et al. Symmetry of 64-cell retinal thicknesses by SD-OCT
page 12
comparison with reference group data varied, and the cutoff values of the temporal 232
zone (cell number 25, 26 and 27) were the smallest (7.7 µm).10 233
234
However, the symmetry was not well preserved in the nasal-peripheral macular 235
areas (number of corresponding cells: 1-10, 15, 16, 24), and the correlation 236
coefficient of nasal-peripheral macular area was less than that of the central- and 237
temporal-macular areas (number of corresponding cells: 11-14, 17-23, 25-32; Figure 238
4). In some cases, the differences were found to be greater than 30 µm, and these 239
eyes had asymmetry of the thick retinal nerve fiber bundles in the superior and 240
inferior sectors (Figure 5). 241
242
We assumed that the structural asymmetry between the supra- and infra-temporal 243
RNFL bundles across the fovea-disc axis may be the cause of these differences. 244
Thus, we compared the difference of the PAD across the fovea-disc axis and the 245
differences of the corresponding cells. Our findings showed that the differences of 246
the corresponding cells, e.g., paired-cells such number as 13, 14, 15, 16, and 22, 23, 247
24 and 31, were significantly and positively correlated with the difference of the PAD 248
(Figure 5). This is a new finding and can affect the accuracy of the diagnosis of 249
early stage glaucomatous eyes. 250
251
An earlier study showed that the sectorial retinal thickness was significantly 252
correlated with the axial length.13 Thus, the axial length may affect the relationship 253
between the superior and inferior retinal thickness. A partial correlation analysis 254
was performed to determine the relationship between the superior and inferior retinal 255
thicknesses with an exclusion of the effect of the axial length. The results showed 256
Page 13
Yamashita et al. Symmetry of 64-cell retinal thicknesses by SD-OCT
13
that even after excluding the effect of the axial length, the corresponding superior 257
and inferior cells retinal thickness were highly correlated (R = 0.30 to 0.96, P = 0.02 258
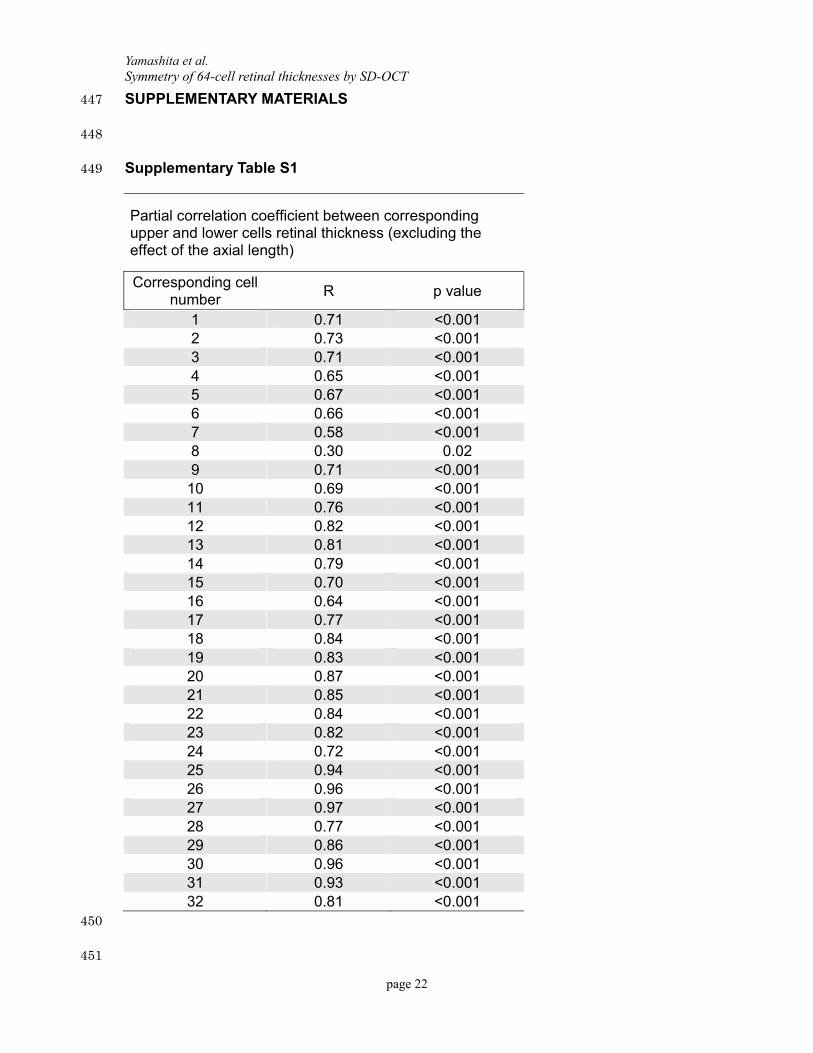
to <0.001, supplementary Table S1). 259
260
In the earlier study of the symmetry of retinal thicknesses between the upper-lateral 261
and lower-lateral areas, the correlation coefficient was 0.335 or a coefficient of 262
determination of 0.112 which is smaller than our results with a correlation coefficient 263
of 0.45 to 0.97. It is possible that the area studied earlier was larger than the area 264
studied in this study. This is important because the larger the area studied, the 265
greater will be the variations of the retinal thicknesses. Additionally, our subjects 266
were young and had healthy eyes. In addition, the ageing changes and media 267
opacities were minimal which could account for the higher coefficients of correlation. 268
269
Because the location of the large superior and inferior vessels are supposedly 270
located at the sites of the peak RNFL,15-17 and because these vessels are not 271
necessarily symmetrical across the fovea-disc axis, their locations can affect the 272
symmetry of upper and lower retinal thicknesses. We measured the supra- and 273
infra-temporal artery and vein angles in the RNFL thickness scan circle using the 274
same method as the peak RNFL locations. The artery angle difference (AAD) and 275
the vein angle difference (VAD) were calculated as the difference between the 276
supra-temporal artery or vein angles and the infra-temporal artery or vein angles. 277
The peak angle difference (PAD) was significantly correlated with the AAD (R = 0.44, 278
P <0.001) and the VAD (R = 0.32, P = 0.012). The AAD was significantly correlated 279
with the differences between corresponding RTs of the 5 nasal pairs (R = 0.26 to 280
0.33, P <0.05) but was not significantly correlated with the differences between the 281
Page 14
Yamashita et al. Symmetry of 64-cell retinal thicknesses by SD-OCT
page 14
corresponding RTs of the other pairs (P >0.05; Supplementary Table S2). These 282
correlations on the relationship between the PAD and the difference between 283
corresponding RTs are weak. The VAD was significantly correlated with the 284
differences between corresponding RTs of only one pair (sector 31, R = 0.27, P = 285
0.03; Supplementary Table S2). These results suggest that the AAD can be 286
substituted for the PAD in assessing the symmetry between upper and lower retinal 287
thicknesses. They also indicate that the asymmetry of the superior and inferior 288
retinal artery position of the peripapillary area across the fovea-disc axis would break 289
the symmetry of the RT across the fovea-disc axis. 290
291
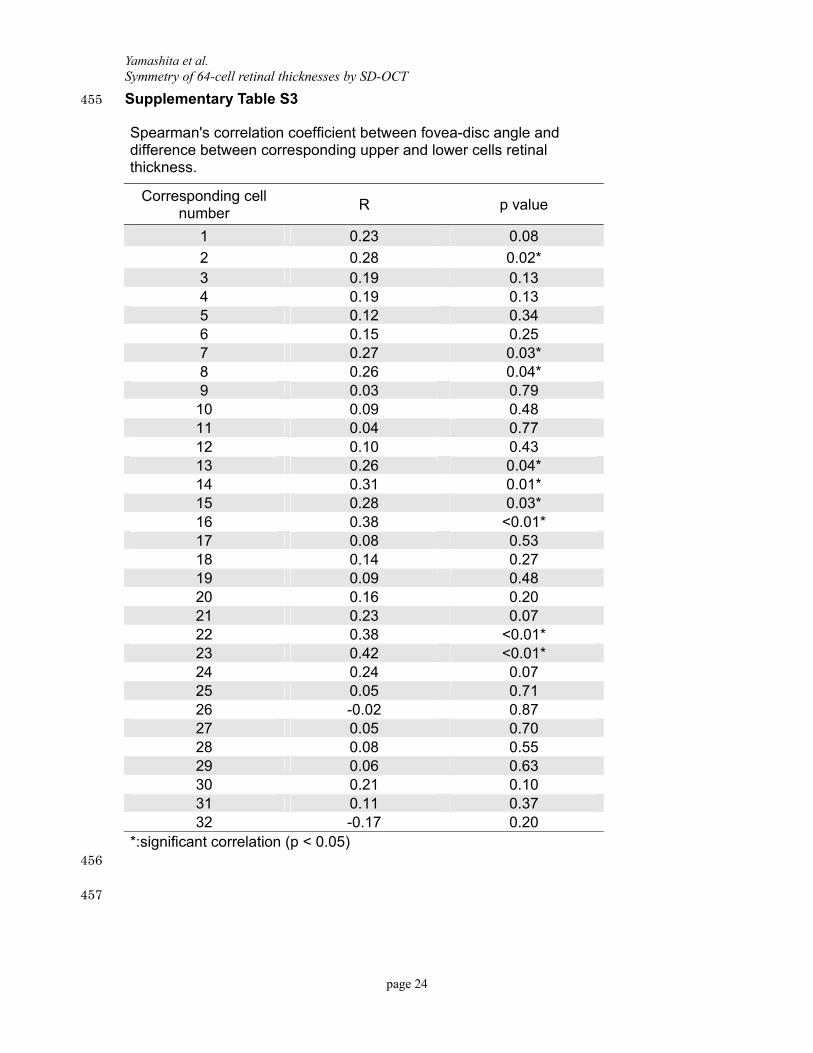
The angle of the fovea-disc axis may be correlated with the PAD. Therefore, we 292
investigated the fovea-disc angle and the relationship between the PAD and the 293
differences between corresponding RTs. The fovea-disc angle was calculated by 294
dividing the fovea disc axis (X1b of Figure 2) by the entire distance and multiplying 295
by 360 (Figure 2). The fovea-disc angle was significantly correlated with the 296
differences between corresponding RTs of the 8 nasal pairs (R = 0.26 to 0.42, P 297
<0.05) and one peripheral pair (R = 0.28, P = 0.02) but was not significantly 298
correlated with the differences between the corresponding RTs of the other pairs (P 299
>0.05; Supplementary Table S3). These results are similar to the correlations 300
between the PAD and the differences of the corresponding RTs. In addition, the 301
fovea-disc angle was significantly correlated with the PAD (R = -0.43, P <0.001). 302
These results suggest that the fovea-disc angle may be substituted for the PAD in 303
assessing the symmetry between upper and lower retinal thicknesses in the different 304
sectors. 305
306
Page 15
Yamashita et al. Symmetry of 64-cell retinal thicknesses by SD-OCT
15
The earliest sign of glaucoma is usually a focal reduction of the retinal thickness of 307
the RNFL bundle especially in the superior or inferior lateral areas. The structural 308
asymmetry of these areas might interfere with the diagnostic accuracy of PPAA. 309
Indeed, Seo et al reported that the sensitivity and specificity of PPAA in detecting 310
localized RNFL defects using two, three, and four consecutive black cells (black 311
indicating differences of retinal thickness of >30 µm) were 95.2% vs 81.1%, 83.3% 312
vs 92.6%, and 69.0% vs 98.4%.7 Additionally, Sullivan-Mee et al reported that the 313
sensitivity and specificity of the PPAA for detecting early stage glaucoma using 314
absolute differences between the overall superior and inferior macular thicknesses, 315
were 77.3% and 80.0%, respectively.18 Thus, a simple symmetry theory does not 316
necessarily satisfy both of sensitivity and specificity of the PPAA analysis. However, 317
modifying the asymmetry analyses using the PAD should be considered. 318
319
Adjusting for the asymmetrical using the PAD is an interesting possibility. However, 320
a line drawn through the middle of the thickest inferior and superior arcuate RNFL 321
bundle does not pass through the fovea. At present, we do not have a good 322
method to adjust for the asymmetry using the PAD, but it will be an important issue 323
in our future study. 324
325
This study has several limitations. First, the study was not a population-based study. 326
Epidemiological studies have shown that the Japanese population is one of the most 327
myopic groups,19 and the present study group was university students who are 328
known to be myopic. Thus, our results describe the characteristics of young myopic 329
eyes, but might not necessarily hold for older and non-myopic populations. On the 330
other hand, the reliability of the examination is very high because no pathological 331
Page 16
Yamashita et al. Symmetry of 64-cell retinal thicknesses by SD-OCT
page 16
factors such as cataract or vitreal opacities were present in the young healthy 332
individuals and the understanding of the examination procedures was high. 333
Furthermore, the narrow range of age prevented the study from interference of the 334
cohort effects and the age effects. A second limitation was that segmentation 335
errors were found in cell number 32 (lateral of optic disc) in 20 eyes out of 64 eyes. 336
Most of these eyes had an optic disc conus. Therefore, the reliability of the 337
measurements of retinal thickness were not good for this cell. However, there were 338
few segmentation errors for other cells. The third limitation of this study was that 339
the circular scan was not adjusted for ocular magnification. According to studies on 340
scan circle size and RNFL thickness,20,21 this may have introduced some errors in 341
the mean RNFL thickness profiles and the mean angles of maximums determined. 342
However, considering the extension of the peripapillary retinal nerve fibers, the 343
angles of peak thicknesses seem to be less affected by ocular magnification. To 344
the best of our knowledge, this is the first study to investigate the symmetry between 345
the RT of corresponding cells by PPAA. However, additional studies with a larger 346
sample size and broad range of ages are needed to determine whether there are 347
patterns in the symmetry between individuals corresponding to the upper and lower 348
RT of the 64 cells. 349
350
In summary, we found by PPAA that the symmetry of the RT between corresponding 351
upper and lower cells was high in the central and temporal macular areas, but not so 352
high in the peripheral and nasal-macular area. The structural asymmetry of 353
superior and inferior RNFL bundles of the nasal macular area would break the 354
symmetry of the RT across the macula-disc axis. This information would be 355
important for interpreting the PPAA for diagnosing early glaucoma. 356
357
Page 17
Yamashita et al. Symmetry of 64-cell retinal thicknesses by SD-OCT
17
REFERENCES 358
1. Huang D, Swanson EA, Lin CP, et al. Optical coherence tomography. Science. 359
1991;254:1178 –1181. 360
2. Paunescu LA, Schuman JS, Price LL, et al. Reproducibility of nerve fiber 361
thickness, macular thickness, and optic nerve head measurements using Stratus 362
OCT. Invest Ophthalmol Vis Sci. 2004;45:1716–1724. 363
3. Gurses-Ozden R, Teng C, Vessani R, et al. Macular and retinal nerve fiber layer 364
thickness measurement reproducibility using optical coherence tomography (OCT-3). 365
J Glaucoma. 2004;13:238–244. 366
4. Campbell RJ, Coupland SG, Buhrmann RR, Kertes PJ. Optimal optical coherence 367
tomography-based measures in the diagnosis of clinically significant macular edema: 368
retinal volume vs foveal thickness. Arch Ophthalmol. 2007;125:619-623. 369
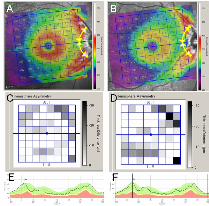
5. Liu YY, Ishikawa H, Chen M, et al. Computerized macular pathology diagnosis in 370
spectral domain optical coherence tomography scans based on multiscale texture 371
and shape features. Invest Ophthalmol Vis Sci. 2011;52:8316-8322. 372
6. Asrani S, Rosdahl JA, Allingham RR. Novel software strategy for glaucoma 373
diagnosis: asymmetry analysis of retinal thickness. Arch Ophthalmol. 374
2011;129:1205–1211. 375
7. Seo JH, Kim TW, Weinreb RN, et al. Detection of localized retinal nerve fiber layer 376
defects with posterior pole asymmetry analysis of spectral domain optical coherence 377
tomography. Invest Ophthalmol Vis Sci. 2012;53:4347-4353. 378
8. Bagga H, Greenfield DS, Knighton RW. Macular symmetry testing for glaucoma 379
detection. J Glaucoma. 2005;14:358–363. 380
9. Inuzuka H, Kawase K, Sawada A, Aoyama Y, Yamamoto T. Macular Retinal 381
Thickness in Glaucoma With Superior or Inferior Visual Hemifield Defects [published 382
Page 18
Yamashita et al. Symmetry of 64-cell retinal thicknesses by SD-OCT
page 18
online ahead of print August 29, 2011]. J Glaucoma. 2011 383
10. Um TW, Sung KR, Wollstein G, et al. Asymmetry in hemifield macular thickness 384
as an early indicator of glaucomatous change. Invest Ophthalmol Vis Sci. 385
2012;53:1139-1144. 386
11. Hong SW, Ahn MD, Kang SH, Im SK. Analysis of peripapillary retinal nerve fiber 387
distribution in normal young adults. Invest Ophthalmol Vis Sci. 2010;51:3515-3523. 388
12. Ishikawa H, Stein DM, Wollstein G, Beaton S, Fujimoto JG, Schuman JS. 389
Macular segmentation with optical coherence tomography. Invest Ophthalmol Vis Sci. 390
2005;46:2012–2017. 391
13. Yamashita T, Tanaka M, Kii Y, Nakao K, Sakamoto T. Association between retinal 392
thickness of 64 sectors in posterior pole determined by optical coherence 393
tomography and axial length and body height. Invest Ophthalmol Vis Sci. 394
2013;54:7478-7482. 395
14. Yoo YC, Lee CM, Park JH. Changes in peripapillary retinal nerve fiber layer 396
distribution by axial length. Optom Vis Sci. 2012;89:4-11. 397
15. Yamashita T, Asaoka R, Tanaka M et al. Relationship between position of peak 398
retinal nerve fiber layer thickness and retinal arteries on sectoral retinal nerve fiber 399
layer thickness. Invest Ophthalmol Vis Sci. 2013;54:5481-5488. 400
16. Hood DC, Fortune B, Arthur SN, et al. Blood vessel contributions to retinal nerve 401
fiber layer thickness profiles measured with optical coherence tomography. J 402
Glaucoma. 2008;17:519-528. 403
17. Hood DC, Salant JA, Arthur SN, Ritch R, Liebmann JM. The location of the 404
inferior and superior temporal blood vessels and interindividual variability of the 405
retinal nerve fiber layer thickness. J Glaucoma. 2010;19:158-166. 406
18. Sullivan-Mee M, Ruegg CC, Pensyl D, Halverson K, Qualls C. Diagnostic 407
Page 19
Yamashita et al. Symmetry of 64-cell retinal thicknesses by SD-OCT
19
precision of retinal nerve fiber layer and macular thickness asymmetry parameters 408
for identifying early primary open-angle glaucoma. Am J Ophthalmol. 2013;156:567-409
577. 410
19. Sawada A, Tomidokoro A, Araie M, et al. Refractive errors in an elderly Japanese 411
population: the Tajimi study. Ophthalmology. 2008;115:363-370. 412
20. Skaf M, Bernardes AB, Cardillo JA, et al. Retinal nerve fiber layer thickness 413
profile in normal eyes using third-generation optical coherence tomography. Eye. 414
2006;20:431–439. 415
21. Gabriele ML, Ishikawa H, Wollstein G et al. Peripapillary nerve fiber layer 416
thickness profile determined with high speed, ultrahigh resolution optical coherence 417
tomography high-density scanning. Invest Ophthalmol Vis Sci. 2007;48:3154–3160. 418
419
Page 20
Yamashita et al. Symmetry of 64-cell retinal thicknesses by SD-OCT
page 20
FIGURE LEGENDS 420
421
Figure 1. The numbering of the 64 cells of the posterior pole asymmetry analysis. 422
423
Figure 2. Measurement of the angle between the supra- and infra-peak retinal nerve 424
fiber layer thickness. 425
426
Figure 3. Differences of retinal thickness between corresponding upper and lower 427
32 pairs of sectors. 428
429
Figure 4. Correlation coefficients of each pair are shown in the upper cells. The 430
gray tone also indicates the value of each cell as on the right scale bar. The 431
correlation coefficient equal to or lower than 0.7 are shown in white. T: temporal, F: 432
fovea, N: nasal. 433
434
Figure 5. A: and B: Grid of 64 cells superimposed on fundus photographs. The 435
thickness of each cell is designated numerically and also color-coded. The fovea-436
disc axis is shown by the slanted green-blue line. The supra temporal and infra 437
temporal peak retinal nerve fiber layer (RNFL) position are shown by the yellow dots. 438
Supra and infra peak RNFL angles are shown by yellow two-way arrows. C: and D: 439
Hemisphere asymmetry analysis obtained by posterior pole asymmetry analysis. E: 440
and F: The supra temporal and infra temporal peak RNFL positions are shown by the 441
black lines and the fovea-disc axis is shown by the blue line in the RNFL profile. 442
The sites of the angles of the supra temporal and infra temporal peak thickness of 443
the RNFL against the fovea-disc axis were approximately the same for case shown 444
Page 21
Yamashita et al. Symmetry of 64-cell retinal thicknesses by SD-OCT
21
in A, C, and E and different for case shown in B, D, and F. 445
446
Page 22
Yamashita et al. Symmetry of 64-cell retinal thicknesses by SD-OCT
page 22
SUPPLEMENTARY MATERIALS 447
448
Supplementary Table S1 449
Partial correlation coefficient between corresponding upper and lower cells retinal thickness (excluding the effect of the axial length)
Corresponding cell number
R p value
1 0.71 <0.001 2 0.73 <0.001 3 0.71 <0.001 4 0.65 <0.001 5 0.67 <0.001 6 0.66 <0.001 7 0.58 <0.001 8 0.30 0.02 9 0.71 <0.001 10 0.69 <0.001 11 0.76 <0.001 12 0.82 <0.001 13 0.81 <0.001 14 0.79 <0.001 15 0.70 <0.001 16 0.64 <0.001 17 0.77 <0.001 18 0.84 <0.001 19 0.83 <0.001 20 0.87 <0.001 21 0.85 <0.001 22 0.84 <0.001 23 0.82 <0.001 24 0.72 <0.001 25 0.94 <0.001 26 0.96 <0.001 27 0.97 <0.001 28 0.77 <0.001 29 0.86 <0.001 30 0.96 <0.001 31 0.93 <0.001 32 0.81 <0.001
450
451
Page 23
Yamashita et al. Symmetry of 64-cell retinal thicknesses by SD-OCT
23
452 Supplementary Table S2 453
Spearman's correlation coefficient between artery or vein angle difference and difference between corresponding upper and lower cells retinal thickness.
Corresponding cell number
Artery angle difference vs paired cells retinal thickness
difference
Vein angle difference vs paired cells retinal thickness
difference
R p value R p value
1 0.23 0.08 0.07 0.59
2 0.19 0.13 0.10 0.45 3 0.02 0.86 0.07 0.60 4 -0.02 0.90 -0.03 0.81 5 -0.07 0.58 -0.03 0.84 6 -0.01 0.96 0.07 0.57 7 0.33 <0.01* 0.15 0.25 8 0.30 0.02* 0.14 0.29 9 0.07 0.61 0.04 0.75 10 0.16 0.23 0.03 0.85 11 0.13 0.31 -0.02 0.86 12 0.07 0.59 0.08 0.54 13 0.13 0.30 0.18 0.16 14 0.07 0.57 0.15 0.23 15 0.04 0.78 0.10 0.42 16 0.34 <0.01* 0.14 0.29 17 0.09 0.48 0.13 0.33 18 0.09 0.50 0.18 0.17 19 0.15 0.24 0.06 0.63 20 0.16 0.20 0.11 0.39 21 0.29 0.02* 0.11 0.07 22 0.26 0.04* 0.23 0.06 23 0.13 0.32 0.24 0.73 24 -0.12 0.38 0.05 0.07 25 -0.05 0.71 0.04 0.78 26 0.01 0.96 0.07 0.57 27 0.01 0.92 0.07 0.58 28 -0.23 0.08 0.10 0.44 29 -0.09 0.51 0.14 0.26 30 0.20 0.12 0.22 0.09 31 -0.01 0.99 0.27 0.03* 32 -0.23 0.08 -0.12 0.34
*:significant correlation (p < 0.05) 454
Page 24
Yamashita et al. Symmetry of 64-cell retinal thicknesses by SD-OCT
page 24
Supplementary Table S3 455
Spearman's correlation coefficient between fovea-disc angle and difference between corresponding upper and lower cells retinal thickness.
Corresponding cell number
R p value
1 0.23 0.08
2 0.28 0.02* 3 0.19 0.13 4 0.19 0.13 5 0.12 0.34 6 0.15 0.25 7 0.27 0.03* 8 0.26 0.04* 9 0.03 0.79 10 0.09 0.48 11 0.04 0.77 12 0.10 0.43 13 0.26 0.04* 14 0.31 0.01* 15 0.28 0.03* 16 0.38 <0.01* 17 0.08 0.53 18 0.14 0.27 19 0.09 0.48 20 0.16 0.20 21 0.23 0.07 22 0.38 <0.01* 23 0.42 <0.01* 24 0.24 0.07 25 0.05 0.71 26 -0.02 0.87 27 0.05 0.70 28 0.08 0.55 29 0.06 0.63 30 0.21 0.10 31 0.11 0.37 32 -0.17 0.20
*:significant correlation (p < 0.05) 456
457