Unequal Family Income and Unequal Educational Opportunity: 1970 to 2015 By Tom Mortenson Postsecondary Education OPPORTUNITY Number 287 2017-1 Higher education has been in- creasingly essential to the welfare of people, families, communities, cities, states, and countries since the late 1970s. Those with the most higher education prosper, while others with the least educa- tion are left behind. Understand- ing the distribution of higher edu- cation opportunity and attainment is critically important to under- standing who gets these benefits and who does not, and improving human welfare. As fundamental as this reality ap- pears, and as often as it has been studied and reported, this proposi- tion has been widely and perva- sively ignored in public policy making, and program design and funding in the United States. Since 1980, states have been sharply reducing their annual investment effort in higher ed- ucation. The 2017 state invest- ment effort in higher education is 52% of what it was in 1980. 6.2% 12.1% 10.9% 20.4% 14.9% 35.3% 40.2% 57.9% 0% 10% 20% 30% 40% 50% 60% 70% 1970 1975 1980 1985 1990 1995 2000 2005 2010 2015 Bachelor's Degree Attainment Rate (moving 3-year average) Source: Calculated from October Current Population Survey File (Formerly Table 14 in Census Bureau's School Enrollment Report) Estimated Baccalaureate Degree Attainment by Age 24 by Family Income Quartile 1970 to 2015 Top Income Quartile Bottom Income Quartile Second Income Quartile Third Income Quartile
Transcript
Unequal Family Income and Unequal Educational Opportunity: 1970 to 2015
By Tom Mortenson
Postsecondary Education OPPORTUNITY
Number 287 2017-1
Higher education has been in-creasingly essential to the welfare of people, families, communities, cities, states, and countries since the late 1970s. Those with the most higher education prosper, while others with the least educa-tion are left behind. Understand-ing the distribution of higher edu-cation opportunity and attainment is critically important to under-standing who gets these benefits and who does not, and improving human welfare. As fundamental as this reality ap-pears, and as often as it has been studied and reported, this proposi-tion has been widely and perva-sively ignored in public policy making, and program design and funding in the United States. Since 1980, states have been
sharply reducing their annual investment effort in higher ed-ucation. The 2017 state invest-ment effort in higher education is 52% of what it was in 1980.
6.2%
12.1%10.9%
20.4%14.9%
35.3%
40.2%
57.9%
0%
10%
20%
30%
40%
50%
60%
70%
1970 1975 1980 1985 1990 1995 2000 2005 2010 2015
Bac
helo
r's D
egre
e A
ttain
men
t Rat
e(m
ovin
g 3-
year
ave
rage
)
Source: Calculated from October Current Population Survey File (Formerly Table 14 in Census Bureau's School Enrollment Report)
Estimated Baccalaureate Degree Attainment by Age 24 by Family Income Quartile
1970 to 2015
Top Income Quartile
Bottom Income Quartile
Second Income Quartile
Third Income Quartile
Page 2 Postsecondary Education OPPORTUNITY
The Pell Institute for the Study of Opportunity in Education
Published periodically throughout the year. $250 for print edition issues or $200 for an electronic subscription. All subscribers get full website access including all back issues, spreadsheets, state date books, and posters. To start a subscription, please use the sub-scription order form at http://community.coenet.us/peoarchive/subscribe-renew
This research letter is founded on two be-liefs. First, sound public social policy re-quires accurate, current, independent, and focused information on the human condi-tion. Second, education is essential to the development of human potential and re-sources for both private and public benefit. Therefore, the purpose of this research letter is to inform those who formulate, fund, and administer public policy and programs about the condition of and influ-ences that affect postsecondary education opportunity for all Americans.
If this trend continues, state investment effort will reach zero around 2056. States that are leading this race to the bot-tom and will reach zero soon-est are: Alaska (2021), Colo-rado (2026), Illinois (2029), Arizona (2030), Massachu-setts and Rhode Island (2031), and Louisiana and Pennsylvania (2032).
The federal investment in high-er education has been about 10% of total higher education revenues since 1966. However, this higher education financing shifted away from grants tar-geted on students from low-income families and funded by taxpayers, toward education loans funded by students them-selves and most recently to-ward tax credits not available to people too poor to pay taxes.
Despite declining social invest-ment in higher education, high-er education remains a clear and compelling need for indi-viduals. Individuals with high-er education live longer, healthier, happier lives. Col-lege educated workers earn far more money from their em-ployment than do people with-out college educations. Their employment, economic securi-ty, social status, income, and employment benefits like paid vacations, paid time-off, retire-ment, and health care are wide-ly understood and appreciated.
Unfortunately, opportunity for higher education is unequally dis-tributed. At birth. some fortunate
babies are destined for higher ed-ucation and the lives that higher education prepares for them. Oth-er less fortunate babies are des-tined for denial of that opportuni-ty. Through no fault of their own, the circumstances of utterly inno-cent babies born poor put them on a path filled with obstacles to and through higher education, thus shutting them out of the world of rich benefits available to the fortunate who inherited a path cleared of these obstacles. The sharp curtailment of state and federal investment in higher education compounds these ob-stacles for babies born into fami-lies with limited resources such as income, social, and cultural capital. The social costs and re-sponsibilities of addressing their developmental needs have been kicked down the road to be ad-dressed later, if at all. Family Income This analysis is focused on how students from different family income backgrounds move through the education system to bachelor’s degree attainment by age 24. This movement is meas-ured at five points: high school graduation, college continuation, college participation, estimated college completion, and estimat-ed bachelor’s degree attainment by age 24. This movement is also measured by gender, race/ethnicity, where students enroll, and their enrollment status in col-lege.
Page 3 Postsecondary Education OPPORTUNITY
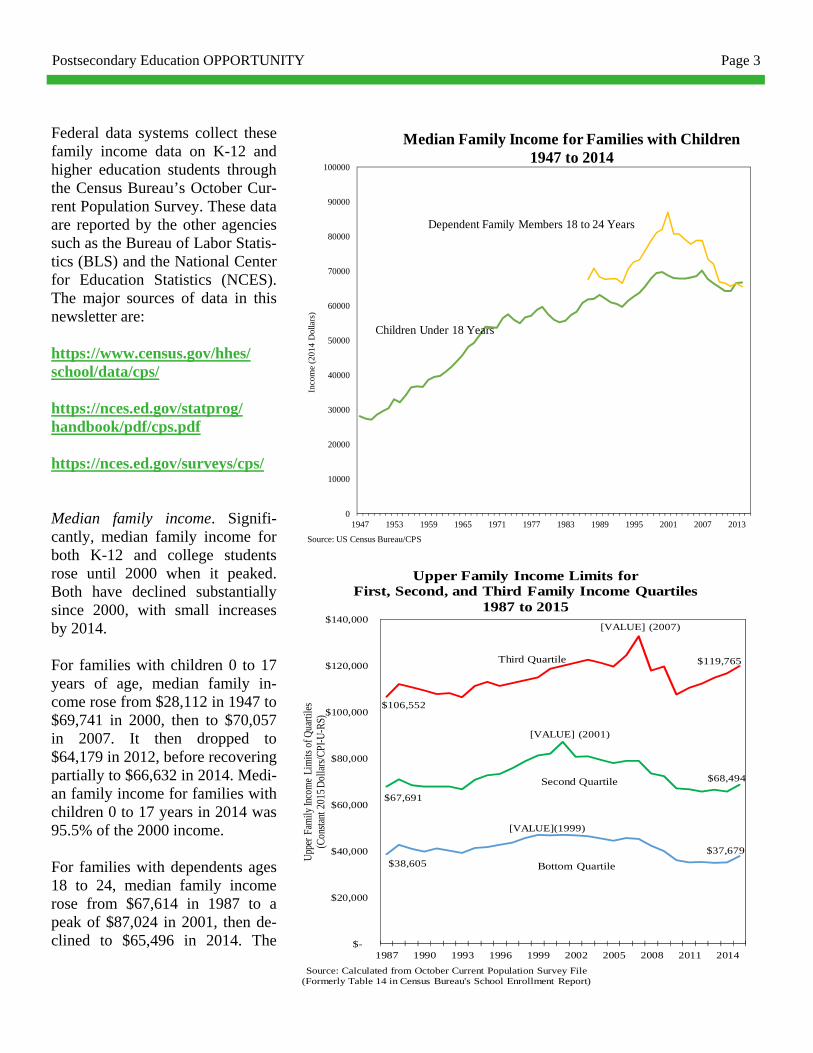
Federal data systems collect these family income data on K-12 and higher education students through the Census Bureau’s October Cur-rent Population Survey. These data are reported by the other agencies such as the Bureau of Labor Statis-tics (BLS) and the National Center for Education Statistics (NCES). The major sources of data in this newsletter are: https://www.census.gov/hhes/school/data/cps/ https://nces.ed.gov/statprog/handbook/pdf/cps.pdf https://nces.ed.gov/surveys/cps/ Median family income. Signifi-cantly, median family income for both K-12 and college students rose until 2000 when it peaked. Both have declined substantially since 2000, with small increases by 2014. For families with children 0 to 17 years of age, median family in-come rose from $28,112 in 1947 to $69,741 in 2000, then to $70,057 in 2007. It then dropped to $64,179 in 2012, before recovering partially to $66,632 in 2014. Medi-an family income for families with children 0 to 17 years in 2014 was 95.5% of the 2000 income. For families with dependents ages 18 to 24, median family income rose from $67,614 in 1987 to a peak of $87,024 in 2001, then de-clined to $65,496 in 2014. The
Median Family Income for Families with Children1947 to 2014
Children Under 18 Years
Dependent Family Members 18 to 24 Years
$38,605
[VALUE](1999)
$37,679
$67,691
[VALUE] (2001)
$68,494
$106,552
[VALUE] (2007)
$119,765
$-
$20,000
$40,000
$60,000
$80,000
$100,000
$120,000
$140,000
1987 1990 1993 1996 1999 2002 2005 2008 2011 2014
Upp
er F
amily
Inco
me
Lim
its o
f Qua
rtile
s(C
onst
ant 2
015
Dol
lars
/CPI
-U-R
S)
Source: Calculated from October Current Population Survey File (Formerly Table 14 in Census Bureau's School Enrollment Report)
Upper Family Income Limits forFirst, Second, and Third Family Income Quartiles
1987 to 2015
Bottom Quartile
Third Quartile
Second Quartile
Page 4 Postsecondary Education OPPORTUNITY
2014 income median was 75.3% of the 2001 number. By 2013, me-dian family income for families with children 18 to 24 years old had fallen below the median in-come for families with children 0 to 17 years. This continued in 2014 when median family income for families with older children was 98.2% of that of families with younger children. Family income quartiles. This analysis constructs quartiles of family income for 18 to 24 year old dependent family members. In 2015, these quartiles were defined as: Bottom quartile: $0 to
$37,679 Second quartile: $37,679 to
$68,494 Third quartile: $68,494 to
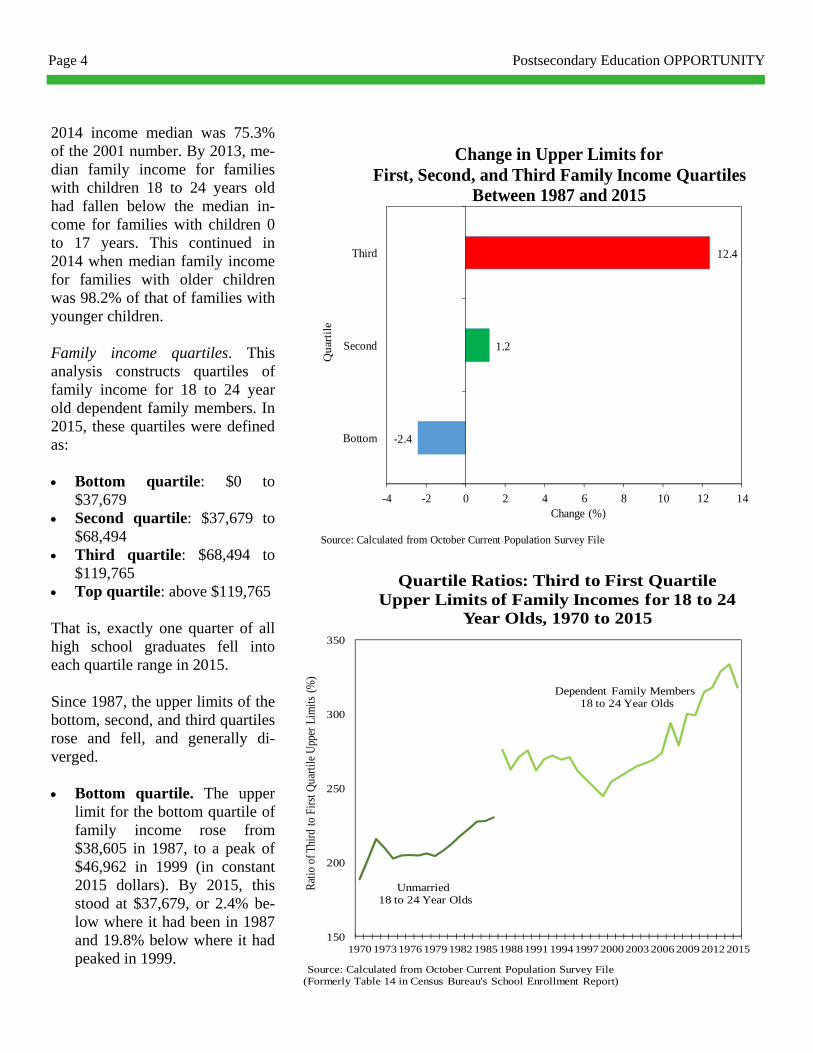
$119,765 Top quartile: above $119,765 That is, exactly one quarter of all high school graduates fell into each quartile range in 2015. Since 1987, the upper limits of the bottom, second, and third quartiles rose and fell, and generally di-verged. Bottom quartile. The upper
limit for the bottom quartile of family income rose from $38,605 in 1987, to a peak of $46,962 in 1999 (in constant 2015 dollars). By 2015, this stood at $37,679, or 2.4% be-low where it had been in 1987 and 19.8% below where it had peaked in 1999.
Source: Calculated from October Current Population Survey File (Formerly Table 14 in Census Bureau's School Enrollment Report)
Quartile Ratios: Third to First Quartile Upper Limits of Family Incomes for 18 to 24
Year Olds, 1970 to 2015
Unmarried 18 to 24 Year Olds
Dependent Family Members 18 to 24 Year Olds
-2.4
1.2
12.4
-4 -2 0 2 4 6 8 10 12 14
Bottom
Second
Third
Change (%)
Qua
rtil
e
Change in Upper Limits forFirst, Second, and Third Family Income Quartiles
Between 1987 and 2015
Source: Calculated from October Current Population Survey File
Page 5 Postsecondary Education OPPORTUNITY
Second quartile. The upper limit for the second quartile of family income (which is also the median for the population), rose from $67,691 in 1987, to a peak of $87,124 in 2012 (constant dollars). It then dropped to $68,494 in 2015. This was 1.2% above where it had been in 1987, but 21.4% below the peak reached in 2001.
Third quartile. The upper limit for the third quartile of family income rose from $106,552 in 1987, to a peak of $132,705 in 2007, then dropped back to $119,765 by 2015. The 2015 level was 12.4% above the 1987 level, and 9.8% below the peak in 2007.
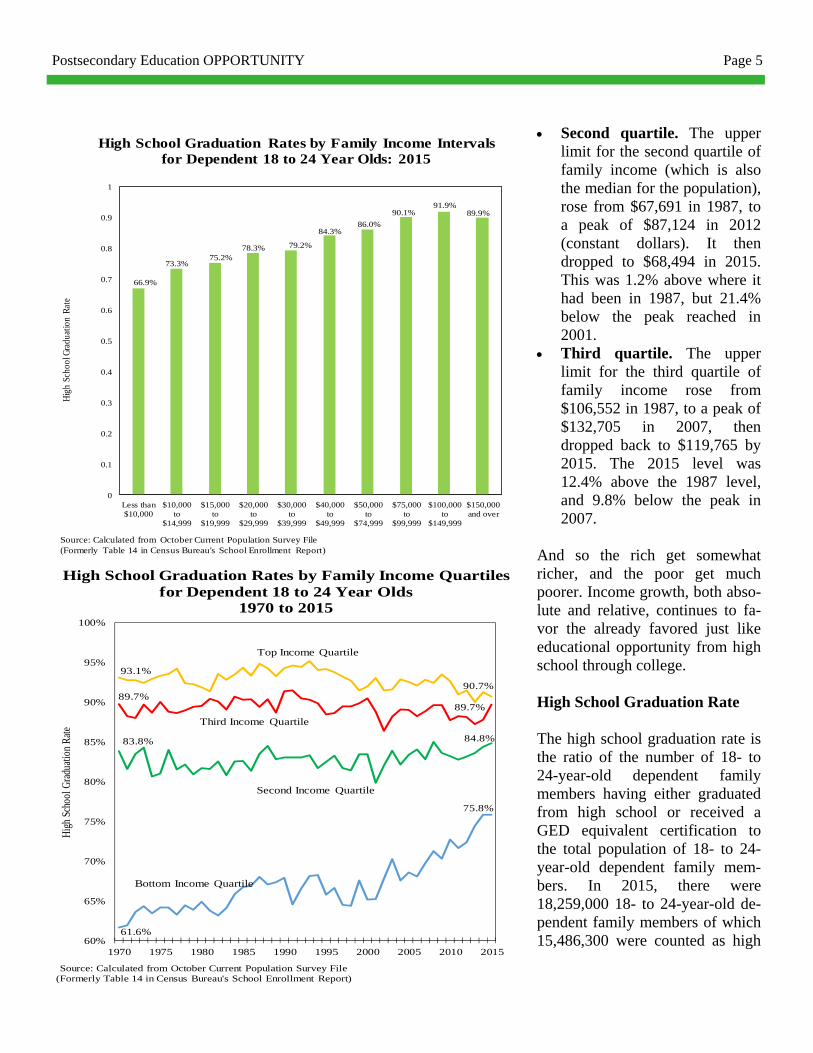
And so the rich get somewhat richer, and the poor get much poorer. Income growth, both abso-lute and relative, continues to fa-vor the already favored just like educational opportunity from high school through college. High School Graduation Rate The high school graduation rate is the ratio of the number of 18- to 24-year-old dependent family members having either graduated from high school or received a GED equivalent certification to the total population of 18- to 24-year-old dependent family mem-bers. In 2015, there were 18,259,000 18- to 24-year-old de-pendent family members of which 15,486,300 were counted as high
61.6%
75.8%
83.8% 84.8%
89.7%89.7%
93.1%
90.7%
60%
65%
70%
75%
80%
85%
90%
95%
100%
1970 1975 1980 1985 1990 1995 2000 2005 2010 2015
Hig
h Sc
hool
Gra
duat
ion
Rate
Source: Calculated from October Current Population Survey File (Formerly Table 14 in Census Bureau's School Enrollment Report)
Top Income Quartile
Bottom Income Quartile
Second Income Quartile
Third Income Quartile
High School Graduation Rates by Family Income Quartilesfor Dependent 18 to 24 Year Olds
1970 to 2015
66.9%
73.3%75.2%
78.3% 79.2%
84.3%86.0%
90.1%91.9%
89.9%
0
0.1
0.2
0.3
0.4
0.5
0.6
0.7
0.8
0.9
1
Less than$10,000
$10,000to
$14,999
$15,000to
$19,999
$20,000to
$29,999
$30,000to
$39,999
$40,000to
$49,999
$50,000to
$74,999
$75,000to
$99,999
$100,000to
$149,999
$150,000and over
Hig
h Sc
hool
Gra
duat
ion
Rate
Source: Calculated from October Current Population Survey File(Formerly Table 14 in Census Bureau's School Enrollment Report)
High School Graduation Rates by Family Income Intervalsfor Dependent 18 to 24 Year Olds: 2015
Page 6 Postsecondary Education OPPORTUNITY
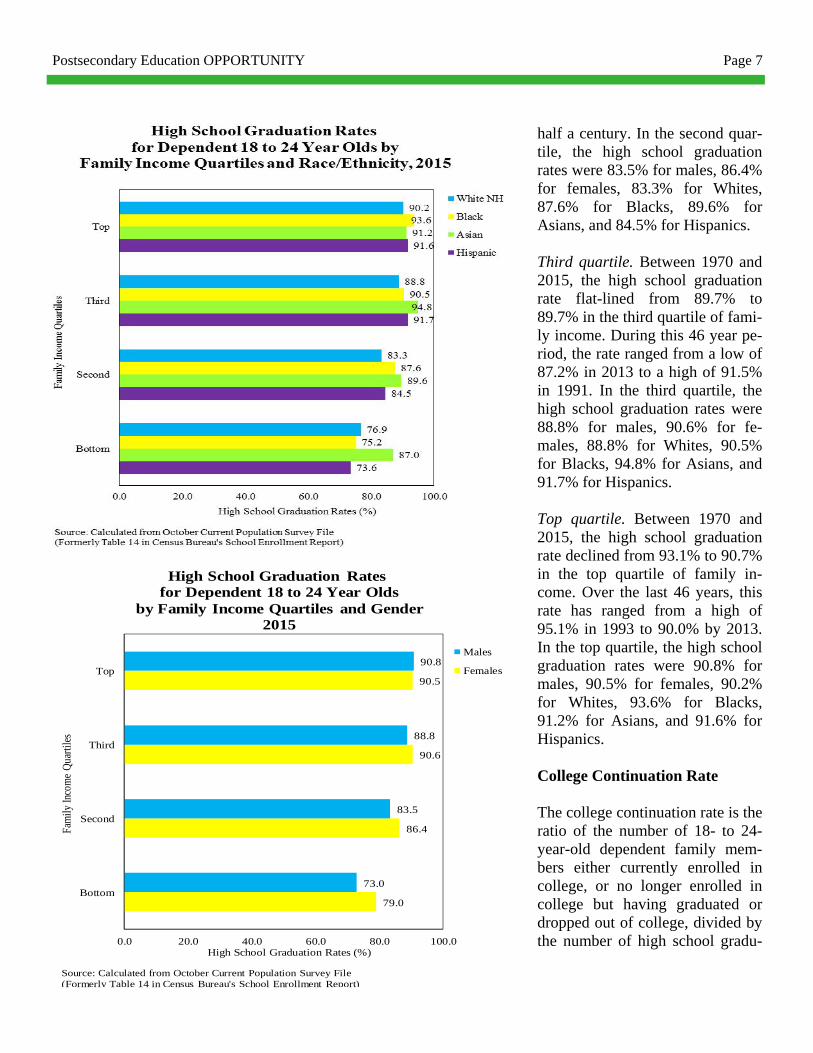
school graduates in the October Current Population Survey. In 2015, the overall high school graduation rate was 84.8% for de-pendent 18- to 24-year-old family members. (data for overall rates not shown in charts) This rate was up from 84.4% in 2014, and 83.4% in 2013. In fact the 2015 high school graduation rate was the highest on record since these data were first published in 1970. This rate has risen from its low of 79.6% in 1974. By race/ethnicity, the high school graduation rates in 2015 were 85.7% for White non-Hispanics, 83.9% for Blacks, 90.7% for Asians, and 82.6% for Hispanics. The high school graduation rates were 83.5% for males and 86.3% for females. When these data are disaggregated by family income, the disparities become clearer. In 2015, the share of 18- to 24-year-old dependent family members that had graduat-ed from high school were: 75.8% in the bottom quartile
of family income, below $37,679
84.8% in the second quartile of family income, between $37,679 and $68,494
89.7% in the third quartile of family income, between 68,495 and $119,765
90.7% in the top quartile of family income, above $119,765
14.2
1.0
-0.1
-2.4
-6 -4 -2 0 2 4 6 8 10 12 14 16
Bottom
Second
Third
Top
Change (%)
Change in High School Graduation Rate by Income Quartile1970 to 2015
Source: Calculated from October Current Population Survey File (Formerly Table 14 in Census Bureau's School Enrollment Report)
Bottom quartile. Between 1970 and 2015, nearly all of the growth in the high school graduation rate occurred in the bottom quartile of family income. This rate in-creased from the record low of 61.6% in 1970, to 64.8% by 1980, to 67.9% by 1990, 65.1% in 2000, 72.7% in 2010, and the record high of 75.8% in 2015. In the bottom quartile, the high school graduation rates were 73.0% for males, 79.0% for fe-
males, 76.9% for Whites, 75.2% for Blacks, 87.0% for Asians, and 73.6% for Hispanics. Second quartile. Between 1970 and 2015, the high school gradua-tion rate for 18- to 24-year-old de-pendent family members increased from 83.8% to 84.8%. During this 46 year period, this rate ranged from a low of 79.8% in 1981 to a high of 85.0% in 2008. Generally, this rate has flat-lined for nearly
Page 7 Postsecondary Education OPPORTUNITY
79.0
86.4
90.6
90.5
73.0
83.5
88.8
90.8
0.0 20.0 40.0 60.0 80.0 100.0
Bottom
Second
Third
Top
High School Graduation Rates (%)
Fam
ily In
com
e Q
uarti
les
Males
Females
High School Graduation Rates for Dependent 18 to 24 Year Olds
by Family Income Quartiles and Gender2015
Source: Calculated from October Current Population Survey File (Formerly Table 14 in Census Bureau's School Enrollment Report)
half a century. In the second quar-tile, the high school graduation rates were 83.5% for males, 86.4% for females, 83.3% for Whites, 87.6% for Blacks, 89.6% for Asians, and 84.5% for Hispanics. Third quartile. Between 1970 and 2015, the high school graduation rate flat-lined from 89.7% to 89.7% in the third quartile of fami-ly income. During this 46 year pe-riod, the rate ranged from a low of 87.2% in 2013 to a high of 91.5% in 1991. In the third quartile, the high school graduation rates were 88.8% for males, 90.6% for fe-males, 88.8% for Whites, 90.5% for Blacks, 94.8% for Asians, and 91.7% for Hispanics. Top quartile. Between 1970 and 2015, the high school graduation rate declined from 93.1% to 90.7% in the top quartile of family in-come. Over the last 46 years, this rate has ranged from a high of 95.1% in 1993 to 90.0% by 2013. In the top quartile, the high school graduation rates were 90.8% for males, 90.5% for females, 90.2% for Whites, 93.6% for Blacks, 91.2% for Asians, and 91.6% for Hispanics. College Continuation Rate The college continuation rate is the ratio of the number of 18- to 24-year-old dependent family mem-bers either currently enrolled in college, or no longer enrolled in college but having graduated or dropped out of college, divided by the number of high school gradu-
Page 8 Postsecondary Education OPPORTUNITY
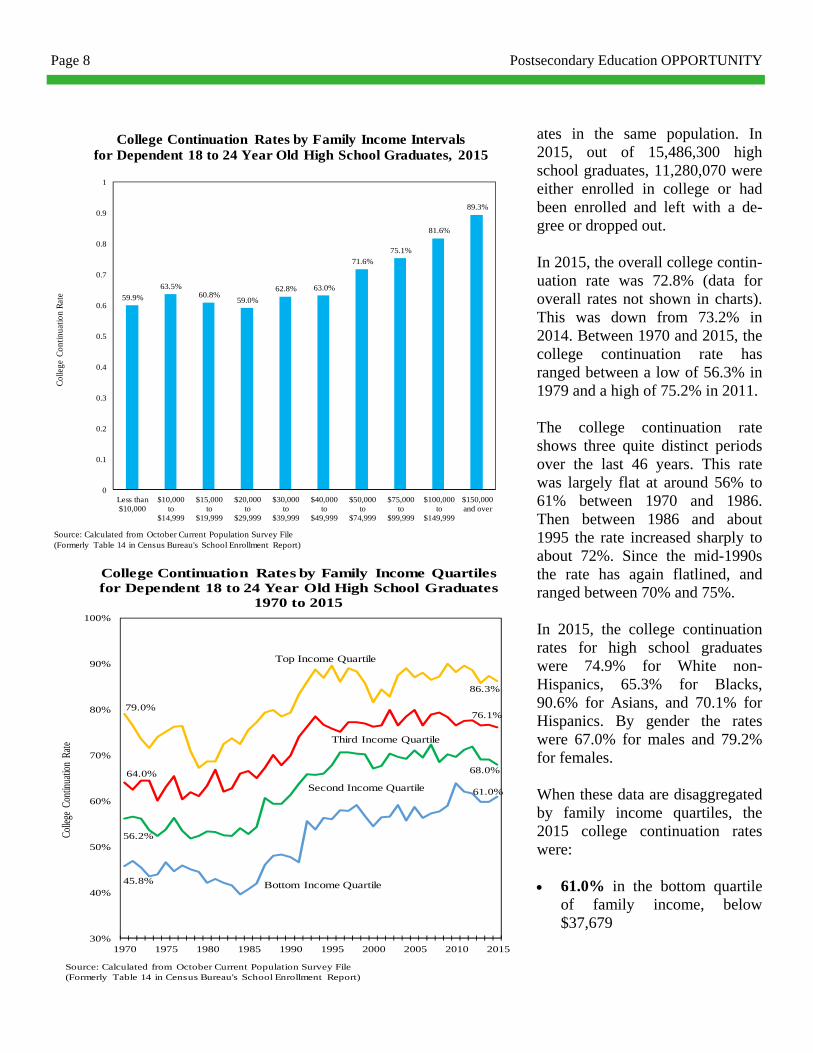
ates in the same population. In 2015, out of 15,486,300 high school graduates, 11,280,070 were either enrolled in college or had been enrolled and left with a de-gree or dropped out. In 2015, the overall college contin-uation rate was 72.8% (data for overall rates not shown in charts). This was down from 73.2% in 2014. Between 1970 and 2015, the college continuation rate has ranged between a low of 56.3% in 1979 and a high of 75.2% in 2011. The college continuation rate shows three quite distinct periods over the last 46 years. This rate was largely flat at around 56% to 61% between 1970 and 1986. Then between 1986 and about 1995 the rate increased sharply to about 72%. Since the mid-1990s the rate has again flatlined, and ranged between 70% and 75%. In 2015, the college continuation rates for high school graduates were 74.9% for White non-Hispanics, 65.3% for Blacks, 90.6% for Asians, and 70.1% for Hispanics. By gender the rates were 67.0% for males and 79.2% for females. When these data are disaggregated by family income quartiles, the 2015 college continuation rates were: 61.0% in the bottom quartile
of family income, below $37,679
59.9%
63.5%60.8%
59.0%
62.8% 63.0%
71.6%
75.1%
81.6%
89.3%
0
0.1
0.2
0.3
0.4
0.5
0.6
0.7
0.8
0.9
1
Less than$10,000
$10,000to
$14,999
$15,000to
$19,999
$20,000to
$29,999
$30,000to
$39,999
$40,000to
$49,999
$50,000to
$74,999
$75,000to
$99,999
$100,000to
$149,999
$150,000and over
Col
lege
Con
tinua
tion
Rat
e
Source: Calculated from October Current Population Survey File(Formerly Table 14 in Census Bureau's School Enrollment Report)
College Continuation Rates by Family Income Intervalsfor Dependent 18 to 24 Year Old High School Graduates, 2015
45.8%
61.0%
56.2%
68.0%64.0%
76.1%79.0%
86.3%
30%
40%
50%
60%
70%
80%
90%
100%
1970 1975 1980 1985 1990 1995 2000 2005 2010 2015
Colle
ge C
ontin
uatio
n Ra
te
Top Income Quartile
Bottom Income Quartile
Second Income Quartile
Third Income Quartile
College Continuation Rates by Family Income Quartilesfor Dependent 18 to 24 Year Old High School Graduates
1970 to 2015
Source: Calculated from October Current Population Survey File (Formerly Table 14 in Census Bureau's School Enrollment Report)
Page 9 Postsecondary Education OPPORTUNITY
68.0% in the second quartile of family income, between $37,679 and $68,494
76.1% in the third quartile of family income, between 68,494 and $119,765
86.3% in the top quartile of family income, above $119,765
Bottom quartile. Between 1970 and 2015, the college continuation rate for 18- to 24-year-old depend-ent family members who had grad-uated from high school from the bottom quartile of family income increased from 45.8% to 61.0%, or by 15.1 percentage points. This rate declined between 1970 and 1984 to 39.5%, then rose sharply to a peak of 63.9% in 2010, and has since dropped back to 61.0% by 2015. In the bottom quartile, the college continuation rates were 55.8% for males, 66.3% for fe-males, 58.6% for Whites, 53.2% for Blacks, 85.1% for Asians, and 67.1% for Hispanics. Second quartile. Between 1970 and 2015, the college continuation rate for those from the second quartile increased from 56.2% to 68.0%, or by 11.8 percentage points. The pattern was the same as that for the bottom quartile: slight decline between 1970 and 1985, followed by a sharp increase through about 1996, with a flat line following through 2015. In the second quartile, the college contin-uation rates were 61.8% for males, 75.2% for females, 66.7% for Whites, 66.1% for Blacks, 90.6% for Asians, and 68.0% for Hispan-ics.
15.1
11.8
12.1
7.3
-4 -2 0 2 4 6 8 10 12 14 16
Bottom
Second
Third
Top
Change (%)
Change in College Continuation Rate by Income Quartile1970 to 2015
Source: Calculated from October Current Population Survey File (Formerly Table 14 in Census Bureau's School Enrollment Report)
67.1
68.0
70.8
82.0
85.1
90.6
89.1
96.8
53.2
66.1
74.9
80.8
58.6
66.7
77.0
87.0
0.0 20.0 40.0 60.0 80.0 100.0
Bottom
Second
Third
Top
College Continuation Rates (%)
Fam
ily I
ncom
e Qua
rtiles
White NH
Black
Asian
Hispanic
College Continuation Rates for Dependent 18 to 24 Year Old High School Graduates
by Family Income Quartiles and Race/Ethnicity: 2015
Source: Calculated from October Current Population Survey File (Formerly Table 14 in Census Bureau's School Enrollment Report)
Page 10 Postsecondary Education OPPORTUNITY
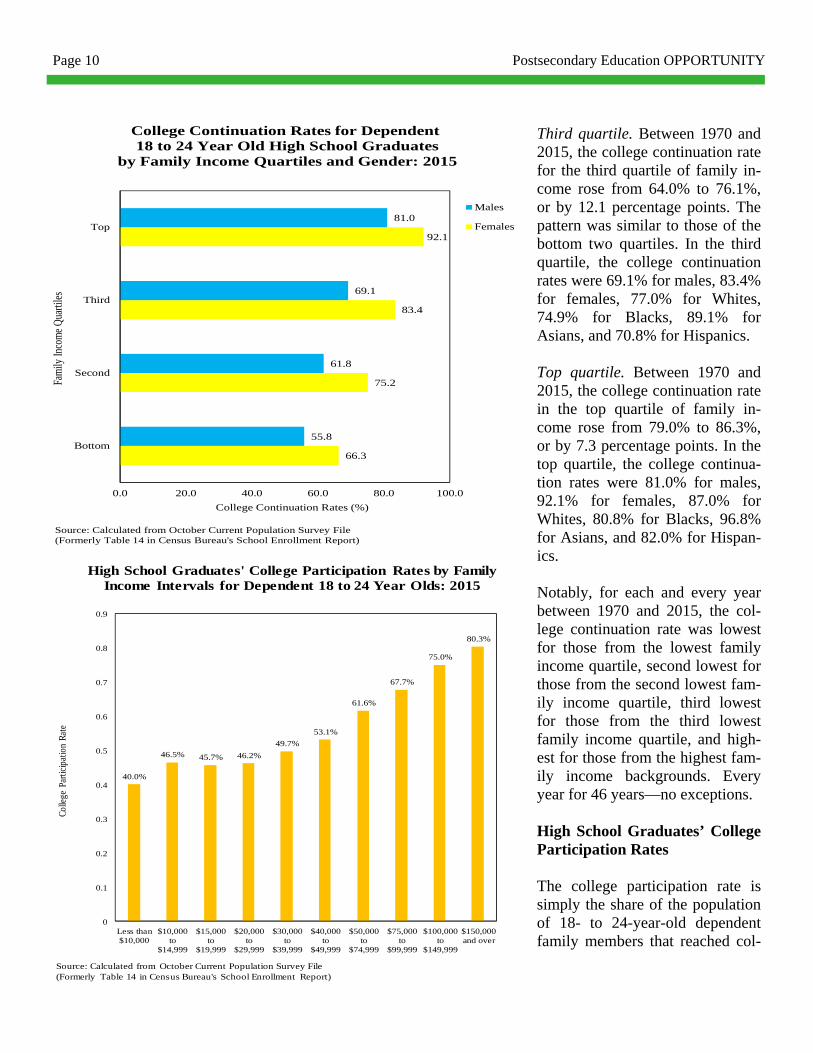
Third quartile. Between 1970 and 2015, the college continuation rate for the third quartile of family in-come rose from 64.0% to 76.1%, or by 12.1 percentage points. The pattern was similar to those of the bottom two quartiles. In the third quartile, the college continuation rates were 69.1% for males, 83.4% for females, 77.0% for Whites, 74.9% for Blacks, 89.1% for Asians, and 70.8% for Hispanics. Top quartile. Between 1970 and 2015, the college continuation rate in the top quartile of family in-come rose from 79.0% to 86.3%, or by 7.3 percentage points. In the top quartile, the college continua-tion rates were 81.0% for males, 92.1% for females, 87.0% for Whites, 80.8% for Blacks, 96.8% for Asians, and 82.0% for Hispan-ics. Notably, for each and every year between 1970 and 2015, the col-lege continuation rate was lowest for those from the lowest family income quartile, second lowest for those from the second lowest fam-ily income quartile, third lowest for those from the third lowest family income quartile, and high-est for those from the highest fam-ily income backgrounds. Every year for 46 years—no exceptions. High School Graduates’ College Participation Rates The college participation rate is simply the share of the population of 18- to 24-year-old dependent family members that reached col-
40.0%
46.5% 45.7% 46.2%
49.7%
53.1%
61.6%
67.7%
75.0%
80.3%
0
0.1
0.2
0.3
0.4
0.5
0.6
0.7
0.8
0.9
Less than$10,000
$10,000to
$14,999
$15,000to
$19,999
$20,000to
$29,999
$30,000to
$39,999
$40,000to
$49,999
$50,000to
$74,999
$75,000to
$99,999
$100,000to
$149,999
$150,000and over
Colle
ge P
artic
ipat
ion
Rate
Source: Calculated from October Current Population Survey File(Formerly Table 14 in Census Bureau's School Enrollment Report)
High School Graduates' College Participation Rates by FamilyIncome Intervals for Dependent 18 to 24 Year Olds: 2015
66.3
75.2
83.4
92.1
55.8
61.8
69.1
81.0
0.0 20.0 40.0 60.0 80.0 100.0
Bottom
Second
Third
Top
College Continuation Rates (%)
Fam
ily In
com
e Qua
rtile
s
Males
Females
College Continuation Rates for Dependent 18 to 24 Year Old High School Graduates
by Family Income Quartiles and Gender: 2015
Source: Calculated from October Current Population Survey File (Formerly Table 14 in Census Bureau's School Enrollment Report)
Page 11 Postsecondary Education OPPORTUNITY
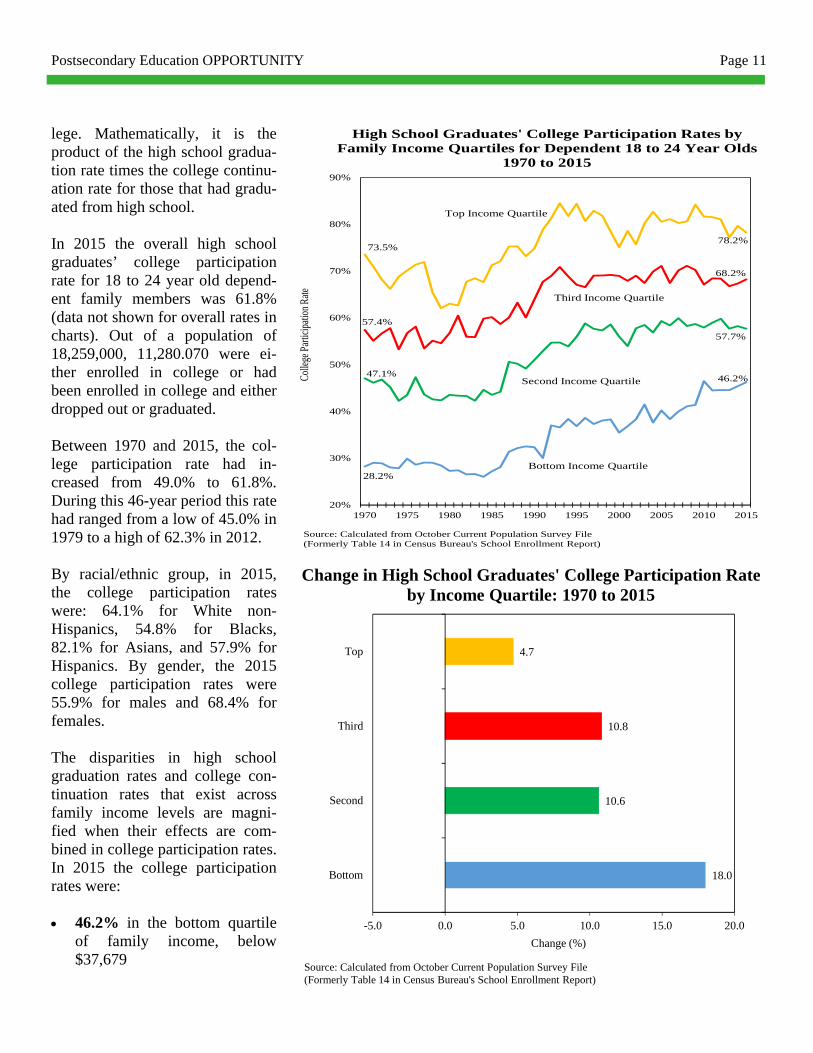
lege. Mathematically, it is the product of the high school gradua-tion rate times the college continu-ation rate for those that had gradu-ated from high school. In 2015 the overall high school graduates’ college participation rate for 18 to 24 year old depend-ent family members was 61.8% (data not shown for overall rates in charts). Out of a population of 18,259,000, 11,280.070 were ei-ther enrolled in college or had been enrolled in college and either dropped out or graduated. Between 1970 and 2015, the col-lege participation rate had in-creased from 49.0% to 61.8%. During this 46-year period this rate had ranged from a low of 45.0% in 1979 to a high of 62.3% in 2012. By racial/ethnic group, in 2015, the college participation rates were: 64.1% for White non-Hispanics, 54.8% for Blacks, 82.1% for Asians, and 57.9% for Hispanics. By gender, the 2015 college participation rates were 55.9% for males and 68.4% for females. The disparities in high school graduation rates and college con-tinuation rates that exist across family income levels are magni-fied when their effects are com-bined in college participation rates. In 2015 the college participation rates were: 46.2% in the bottom quartile
of family income, below $37,679
28.2%
46.2%47.1%
57.7%
57.4%
68.2%
73.5%78.2%
20%
30%
40%
50%
60%
70%
80%
90%
1970 1975 1980 1985 1990 1995 2000 2005 2010 2015
Colle
ge P
artic
ipati
on R
ate
Top Income Quartile
Bottom Income Quartile
Second Income Quartile
Third Income Quartile
High School Graduates' College Participation Rates byFamily Income Quartiles for Dependent 18 to 24 Year Olds
1970 to 2015
Source: Calculated from October Current Population Survey File (Formerly Table 14 in Census Bureau's School Enrollment Report)
18.0
10.6
10.8
4.7
-5.0 0.0 5.0 10.0 15.0 20.0
Bottom
Second
Third
Top
Change (%)
Change in High School Graduates' College Participation Rateby Income Quartile: 1970 to 2015
Source: Calculated from October Current Population Survey File (Formerly Table 14 in Census Bureau's School Enrollment Report)
Page 12 Postsecondary Education OPPORTUNITY
57.7% in the second quartile of family income, between $37,679 and $68,494
68.2% in the third quartile of family income, between 68,494 and $119,765
78.2% in the top quartile of family income, above $119,765
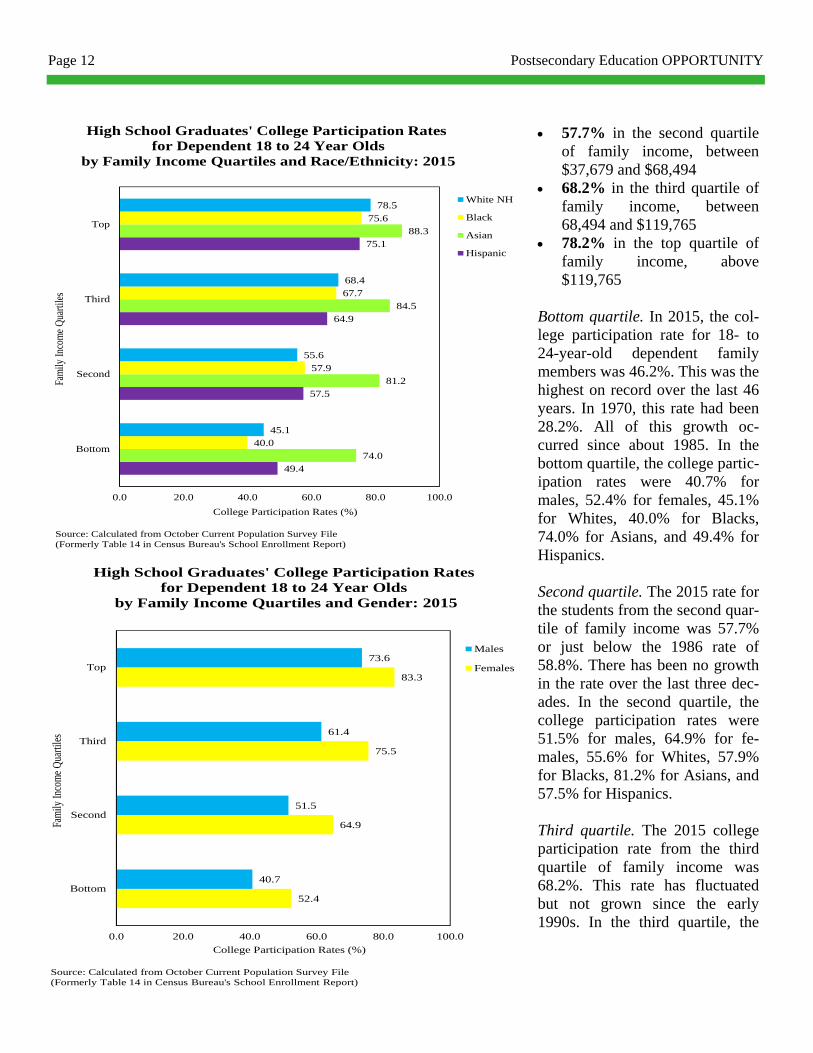
Bottom quartile. In 2015, the col-lege participation rate for 18- to 24-year-old dependent family members was 46.2%. This was the highest on record over the last 46 years. In 1970, this rate had been 28.2%. All of this growth oc-curred since about 1985. In the bottom quartile, the college partic-ipation rates were 40.7% for males, 52.4% for females, 45.1% for Whites, 40.0% for Blacks, 74.0% for Asians, and 49.4% for Hispanics. Second quartile. The 2015 rate for the students from the second quar-tile of family income was 57.7% or just below the 1986 rate of 58.8%. There has been no growth in the rate over the last three dec-ades. In the second quartile, the college participation rates were 51.5% for males, 64.9% for fe-males, 55.6% for Whites, 57.9% for Blacks, 81.2% for Asians, and 57.5% for Hispanics. Third quartile. The 2015 college participation rate from the third quartile of family income was 68.2%. This rate has fluctuated but not grown since the early 1990s. In the third quartile, the
49.4
57.5
64.9
75.1
74.0
81.2
84.5
88.3
40.0
57.9
67.7
75.6
45.1
55.6
68.4
78.5
0.0 20.0 40.0 60.0 80.0 100.0
Bottom
Second
Third
Top
College Participation Rates (%)
Fam
ily In
com
e Q
uarti
les
White NH
Black
Asian
Hispanic
High School Graduates' College Participation Rates for Dependent 18 to 24 Year Olds
by Family Income Quartiles and Race/Ethnicity: 2015
Source: Calculated from October Current Population Survey File (Formerly Table 14 in Census Bureau's School Enrollment Report)
52.4
64.9
75.5
83.3
40.7
51.5
61.4
73.6
0.0 20.0 40.0 60.0 80.0 100.0
Bottom
Second
Third
Top
College Participation Rates (%)
Fam
ily In
com
e Qua
rtile
s
Males
Females
High School Graduates' College Participation Rates for Dependent 18 to 24 Year Olds
by Family Income Quartiles and Gender: 2015
Source: Calculated from October Current Population Survey File (Formerly Table 14 in Census Bureau's School Enrollment Report)
Page 13 Postsecondary Education OPPORTUNITY
college participation rates were 61.4% for males, 75.5% for fe-males, 68.4% for Whites, 67.7% for Blacks, 84.5% for Asians, and 64.9% for Hispanics. Top quartile. The 2015 college participation rate for 18- to 24-year-old dependent family mem-bers was 78.2%, and this rate too has shown no growth since the ear-ly 1990s. In the top quartile, the college participation rates were 73.6% for males, 83.3% for fe-males, 78.5% for Whites, 75.6% for Blacks, 88.3% for Asians, and 75.1 for Hispanics. Enrollment by Level In 2015, 69.9% of 18- to 24-year-old dependent family members in college were enrolled in 4-year institutions, and the rest in 2-year institutions or less. Between 1987 and 2005, this share was rising, from 70.7% in 1987 to a peak of 74.6% in 2005. Thereafter, it dropped quickly to 66.6% in 2010 and 2012, following the Great Re-cession in 2008-09. Since 2012, the rate has partly recovered to 69.9% by 2015. When these data are disaggregated by family income quartiles, an im-portant pattern emerges. Students from the lowest income families are least likely to be enrolled in 4-year institutions, and students from the highest income families are the most likely. In 2015, these shares were: 61.8% in the bottom quartile
Share of Dependent 18 to 24 Year Old Enrollmentin 4-Year Institutions
Source: Calculated from October Current Population Survey File (Formerly Table 14 in Census Bureau's School Enrollment Report)
61.865.3
70.5
78.3
38.234.7
29.5
21.7
0
20
40
60
80
100
Bottom Second Third Top
Shar
e of
Tot
al (%
)
Family Income Quartile
4-Year
2-Year
Distribution of Dependent 18 to 24 Year Old Enrollmentby Institutional Level and Family Income: 2015
Source: Calculated from October Current Population Survey File (Formerly Table 14 in Census Bureau's School Enrollment Report)
Page 14 Postsecondary Education OPPORTUNITY
-7.0
-4.9
-3.6 -3.8
7.0
4.9
3.6 3.8
-10.0
-5.0
0.0
5.0
10.0
Bottom Second Third Top
Shar
e of
Tot
al (%
)
Family Income Quartile
4-Year
2-Year
Change in Share of Dependent 18 to 24 Year Old Enrollmentby Institutional Level and Family Income
2005 to 2015
Source: Calculated from October Current Population Survey File (Formerly Table 14 in Census Bureau's School Enrollment Report)
65.3% in the second quartile
70.5% in the third quar-tile
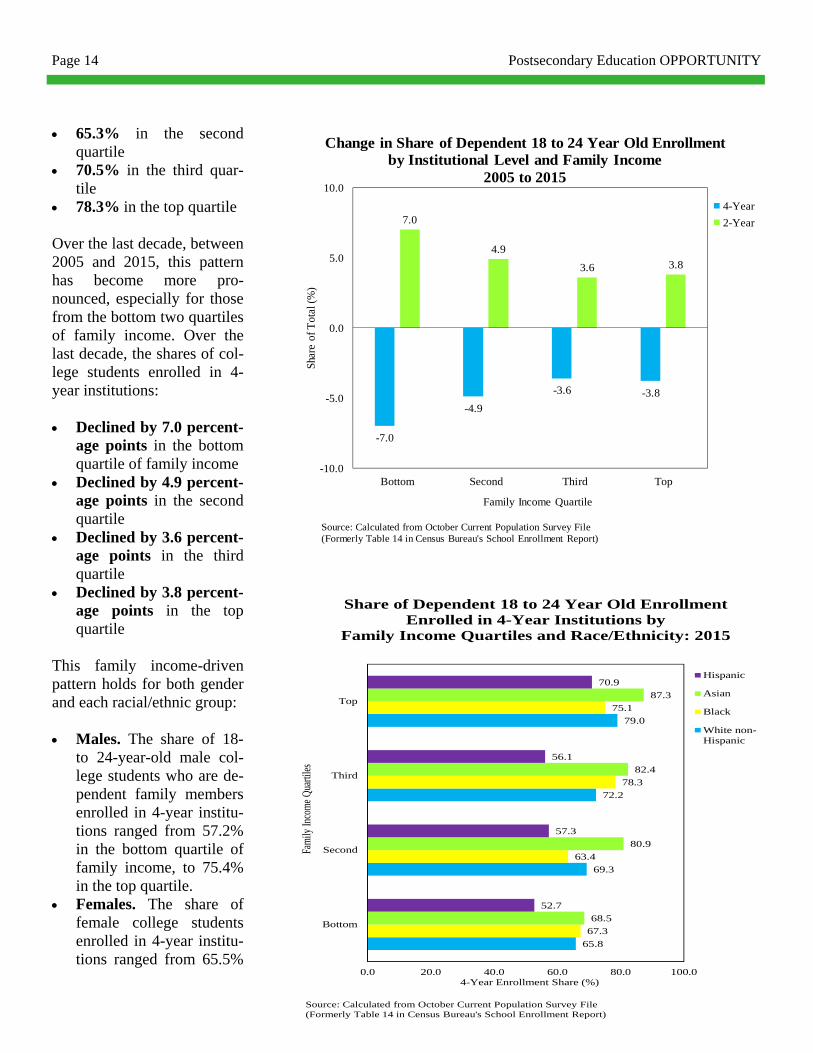
78.3% in the top quartile Over the last decade, between 2005 and 2015, this pattern has become more pro-nounced, especially for those from the bottom two quartiles of family income. Over the last decade, the shares of col-lege students enrolled in 4-year institutions: Declined by 7.0 percent-
age points in the bottom quartile of family income
Declined by 4.9 percent-age points in the second quartile
Declined by 3.6 percent-age points in the third quartile
Declined by 3.8 percent-age points in the top quartile
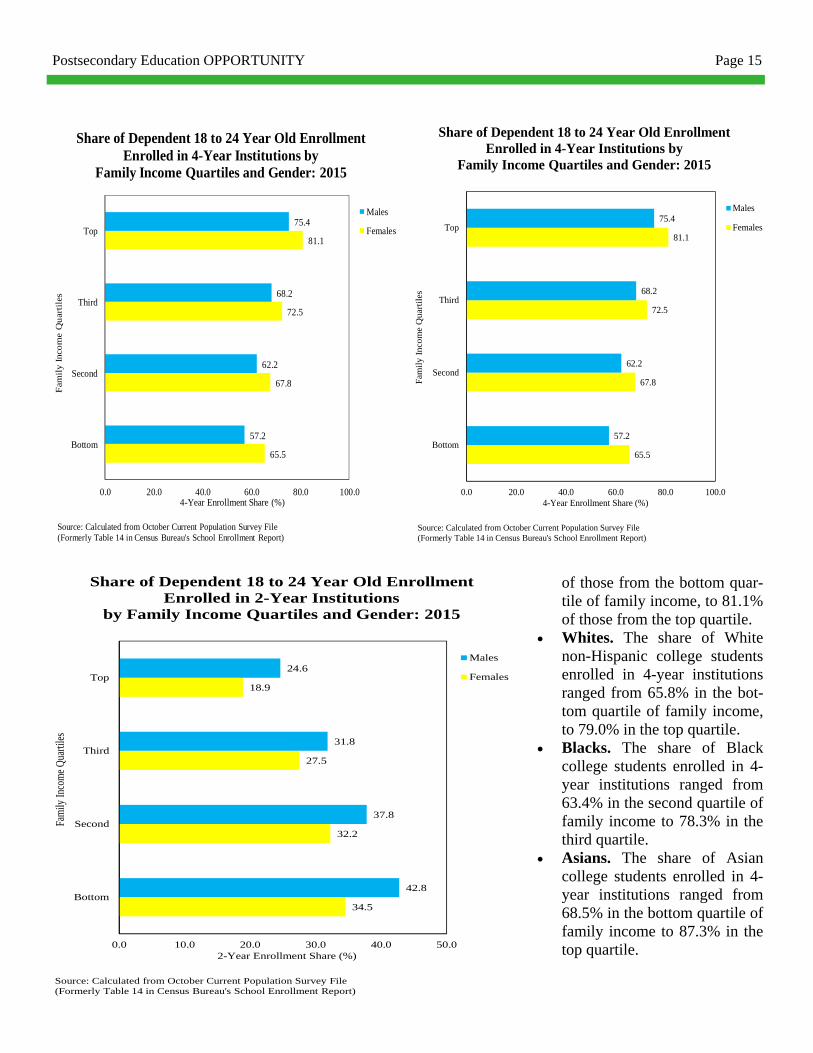
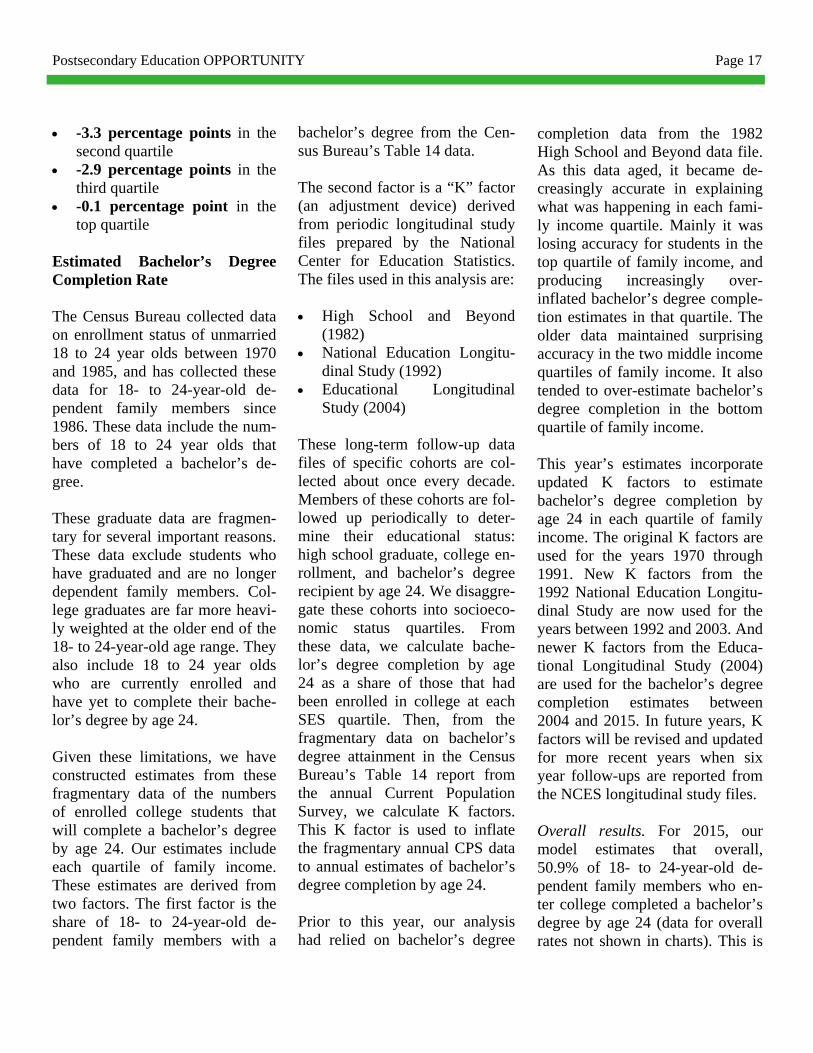
This family income-driven pattern holds for both gender and each racial/ethnic group: Males. The share of 18-
to 24-year-old male col-lege students who are de-pendent family members enrolled in 4-year institu-tions ranged from 57.2% in the bottom quartile of family income, to 75.4% in the top quartile.
Females. The share of female college students enrolled in 4-year institu-tions ranged from 65.5%
65.8
69.3
72.2
79.0
67.3
63.4
78.3
75.1
68.5
80.9
82.4
87.3
52.7
57.3
56.1
70.9
0.0 20.0 40.0 60.0 80.0 100.0
Bottom
Second
Third
Top
4-Year Enrollment Share (%)
Fam
ily In
com
e Qua
rtiles
Hispanic
Asian
Black
White non-Hispanic
Share of Dependent 18 to 24 Year Old EnrollmentEnrolled in 4-Year Institutions by
Family Income Quartiles and Race/Ethnicity: 2015
Source: Calculated from October Current Population Survey File (Formerly Table 14 in Census Bureau's School Enrollment Report)
Page 15 Postsecondary Education OPPORTUNITY
65.5
67.8
72.5
81.1
57.2
62.2
68.2
75.4
0.0 20.0 40.0 60.0 80.0 100.0
Bottom
Second
Third
Top
4-Year Enrollment Share (%)
Fam
ily
Inco
me
Qu
arti
les
Males
Females
Share of Dependent 18 to 24 Year Old EnrollmentEnrolled in 4-Year Institutions by
Family Income Quartiles and Gender: 2015
Source: Calculated from October Current Population Survey File (Formerly Table 14 in Census Bureau's School Enrollment Report)
of those from the bottom quar-tile of family income, to 81.1% of those from the top quartile.
Whites. The share of White non-Hispanic college students enrolled in 4-year institutions ranged from 65.8% in the bot-tom quartile of family income, to 79.0% in the top quartile.
Blacks. The share of Black college students enrolled in 4-year institutions ranged from 63.4% in the second quartile of family income to 78.3% in the third quartile.
Asians. The share of Asian college students enrolled in 4-year institutions ranged from 68.5% in the bottom quartile of family income to 87.3% in the top quartile.
65.5
67.8
72.5
81.1
57.2
62.2
68.2
75.4
0.0 20.0 40.0 60.0 80.0 100.0
Bottom
Second
Third
Top
4-Year Enrollment Share (%)
Fam
ily
Inco
me
Qua
rtil
es
Males
Females
Share of Dependent 18 to 24 Year Old EnrollmentEnrolled in 4-Year Institutions by
Family Income Quartiles and Gender: 2015
Source: Calculated from October Current Population Survey File (Formerly Table 14 in Census Bureau's School Enrollment Report)
34.5
32.2
27.5
18.9
42.8
37.8
31.8
24.6
0.0 10.0 20.0 30.0 40.0 50.0
Bottom
Second
Third
Top
2-Year Enrollment Share (%)
Fam
ily In
com
e Qua
rtile
s
Males
Females
Share of Dependent 18 to 24 Year Old EnrollmentEnrolled in 2-Year Institutions
by Family Income Quartiles and Gender: 2015
Source: Calculated from October Current Population Survey File (Formerly Table 14 in Census Bureau's School Enrollment Report)
Page 16 Postsecondary Education OPPORTUNITY
83.8 82.587.3 89.3
16.2 17.512.7 10.7
0
20
40
60
80
100
Bottom Second Third Top
Shar
e of
Tot
al (%
)
Family Income Quartile
Full-Time
Part-Time
Distribution of Dependent 18 to 24 Year Old Enrollmentby Enrollment Status and Family Income: 2015
Source: Calculated from October Current Population Survey File (Formerly Table 14 in Census Bureau's School Enrollment Report)
Hispanics. The share of His-panic college students enrolled in 4-year colleges ranged from 52.7% in the bottom quartile to 70.9% in the top quartile of family income.
Enrollment by Status Students may be enrolled in col-lege full time or part time, usually determined by whether they are taking 12 credits or more to be full time. In 2015, 86.1% of 18- to 24-year-old dependent family mem-bers met the full-time criteria. Since these data were first report-ed in 1998, the full-time share has fluctuated within a narrow band of 85.9% in 2000 to 89.3% in 2004. However, students from lower family income backgrounds are somewhat less likely to be en-rolled full time than are students from higher family income back-grounds. In 2015, the shares of college students enrolled full time were: 83.8% for students from the
bottom quartile 82.5% for students from the
second quartile 87.3% for students from the
third quartile 89.3% for students from the
top quartile Between 2005 and 2015, these shares changed. These changes were: -3.0 percentage points in the
bottom quartile of family in-come
-3.0-3.3
-2.9
-0.1
3.03.3
2.9
0.1
-4.0
-2.0
0.0
2.0
4.0
Bottom Second Third Top
Shar
e of
Tot
al (%
)
Family Income Quartile
Full-Time
Part-Time
Change in Distribution of Dependent 18 to 24 Year Old Enrollment by Institutional Status and Family Income
2005 to 2015
Source: Calculated from October Current Population Survey File (Formerly Table 14 in Census Bureau's School Enrollment Report)
Page 17 Postsecondary Education OPPORTUNITY
-3.3 percentage points in the second quartile
-2.9 percentage points in the third quartile
-0.1 percentage point in the top quartile
Estimated Bachelor’s Degree Completion Rate The Census Bureau collected data on enrollment status of unmarried 18 to 24 year olds between 1970 and 1985, and has collected these data for 18- to 24-year-old de-pendent family members since 1986. These data include the num-bers of 18 to 24 year olds that have completed a bachelor’s de-gree. These graduate data are fragmen-tary for several important reasons. These data exclude students who have graduated and are no longer dependent family members. Col-lege graduates are far more heavi-ly weighted at the older end of the 18- to 24-year-old age range. They also include 18 to 24 year olds who are currently enrolled and have yet to complete their bache-lor’s degree by age 24. Given these limitations, we have constructed estimates from these fragmentary data of the numbers of enrolled college students that will complete a bachelor’s degree by age 24. Our estimates include each quartile of family income. These estimates are derived from two factors. The first factor is the share of 18- to 24-year-old de-pendent family members with a
bachelor’s degree from the Cen-sus Bureau’s Table 14 data. The second factor is a “K” factor (an adjustment device) derived from periodic longitudinal study files prepared by the National Center for Education Statistics. The files used in this analysis are: High School and Beyond
(1982) National Education Longitu-
dinal Study (1992) Educational Longitudinal
Study (2004) These long-term follow-up data files of specific cohorts are col-lected about once every decade. Members of these cohorts are fol-lowed up periodically to deter-mine their educational status: high school graduate, college en-rollment, and bachelor’s degree recipient by age 24. We disaggre-gate these cohorts into socioeco-nomic status quartiles. From these data, we calculate bache-lor’s degree completion by age 24 as a share of those that had been enrolled in college at each SES quartile. Then, from the fragmentary data on bachelor’s degree attainment in the Census Bureau’s Table 14 report from the annual Current Population Survey, we calculate K factors. This K factor is used to inflate the fragmentary annual CPS data to annual estimates of bachelor’s degree completion by age 24. Prior to this year, our analysis had relied on bachelor’s degree
completion data from the 1982 High School and Beyond data file. As this data aged, it became de-creasingly accurate in explaining what was happening in each fami-ly income quartile. Mainly it was losing accuracy for students in the top quartile of family income, and producing increasingly over-inflated bachelor’s degree comple-tion estimates in that quartile. The older data maintained surprising accuracy in the two middle income quartiles of family income. It also tended to over-estimate bachelor’s degree completion in the bottom quartile of family income. This year’s estimates incorporate updated K factors to estimate bachelor’s degree completion by age 24 in each quartile of family income. The original K factors are used for the years 1970 through 1991. New K factors from the 1992 National Education Longitu-dinal Study are now used for the years between 1992 and 2003. And newer K factors from the Educa-tional Longitudinal Study (2004) are used for the bachelor’s degree completion estimates between 2004 and 2015. In future years, K factors will be revised and updated for more recent years when six year follow-ups are reported from the NCES longitudinal study files. Overall results. For 2015, our model estimates that overall, 50.9% of 18- to 24-year-old de-pendent family members who en-ter college completed a bachelor’s degree by age 24 (data for overall rates not shown in charts). This is
Page 18 Postsecondary Education OPPORTUNITY
21.9%
26.3%23.1%
35.3%
26.0%
51.7%54.6%
74.0%
0%
10%
20%
30%
40%
50%
60%
70%
80%
1970 1975 1980 1985 1990 1995 2000 2005 2010 2015
Four
-Yea
r Col
lege
Com
plet
ion
Rate
(mov
ing
3-ye
ar a
vera
ge)
Top Income Quartile
Bottom Income Quartile
Second Income Quartile
Third Income Quartile
Estimated Bachelor's Degree Completion Rates by Age 24by Family Income Quartiles for Dependent College Students
Who Began College, 1970 to 2015
Source: Calculated from October Current Population Survey File (Formerly Table 14 in Census Bureau's School Enrollment Report)
the highest share in the 46 year record of this time series. The 2015 rate is up from 49.3% in 2014 and 47.8% in 2013. Over the last 46 years since 1970, the estimated bachelor’s degree completion rate by age 24 has ranged from 33.8% in 1970, up to 46.1% in 1985, then dropped back to 36.9% in 2001, then to its peak of 50.9% by 2015. Of course these are rates for the total population. Very different stories emerge at each quartile of family income. In 2015, the esti-mated bachelor’s degree comple-tions rates by age 24 were: 26.3% in the bottom quartile
of family income 35.3% in the second family
income quartile 51.7% in the third quartile 74.0% in the top quartile Bottom quartile. Below $37,679 of family income, the estimated bachelor’s degree completion rate by age 24 in 2015 was 26.3% for those who had entered college. This was up from 24.1% in 2014, and 19.7% in 2013. The 2015 rate was the highest over the last 46 years of data. Over this period, the rate has ranged from a low of 13.7% (2001) to the high of 26.3% (2015). Second quartile. Between $37,679 and $68,494 of family income, the estimated bachelor’s degree com-pletion rate by age 24 in 2015 was 35.3% for those who had begun
4.4
12.2
25.8
19.4
-10 0 10 20 30
Bottom
Second
Third
Top
Change (%)
Change in Estimated Completion Rate by Income Quartile1970 to 2015
Source: Calculated from October Current Population Survey File (Formerly Table 14 in Census Bureau's School Enrollment Report)
collegiate studies. This rate was up from 33.3% in 2014 and 33.2% in 2013, and was the highest on rec-ord over the last 46 years. Over this period the rate ranged from a low of 20.9% in 1975 to the high of 35.3% in 2015. Third quartile. The third quartile of family income ranged between $68,494 and $119,765 in 2015. The estimated bachelor’s degree completion rate was 51.7% for stu-dents from these families who had started college. Over the last 46 years, this rate had ranged from 26.0% in 1970 to a peak of 53.4% in 2009. Top quartile. The top quartile of family income begins at $119,765 and goes (way) up from there. The estimated bachelor’s degree com-pletion rate for dependent family members in 2015 was 74.0%, which was up from 72.0% in 2014 and 69.2% in 2013. Between 1970 and 2015, this rate ranged between 46.0% (2001) and 79.0% (1985). Estimated Bachelor’s Degree Attainment Rate The bachelor’s degree attainment rate is simply the share of a popu-lation with a bachelor’s degree (or more). Mathematically, it is the product of: High school graduation rate X College continuation rate X Estimated bachelor’s degree completion rate = Estimated bachelor’s degree at-tainment rate
In 2015, the estimated bachelor’s degree attainment rate by age 24 for the overall population of de-pendent family members was 31.5%. This was up from 30.5% in 2014 and 29.0% in 2013 (Data for overall rates not shown in charts). The Census Bureau annually publishes data on the share of 25 to 29 year olds with a bachelor’s degree or more from higher edu-cation. In 2015, the Census Bu-reau reported that 35.6% of 25 to 29 year olds had completed four
years or more of college. Because these data capture as college grad-uates those who complete their degrees between 25 and 29 years of age, our aggregated estimate appears to be in line with these Census Bureau estimates. Because each of the components of bachelor’s degree attainment contain rates that differ sharply across family income quartiles, these differences multiply and produce even sharper differences
Page 19 Postsecondary Education OPPORTUNITY
6.2%
12.1%10.9%
20.4%14.9%
35.3%
40.2%
57.9%
0%
10%
20%
30%
40%
50%
60%
70%
1970 1975 1980 1985 1990 1995 2000 2005 2010 2015
Bac
helo
r's D
egre
e A
ttain
men
t Rat
e(m
ovin
g 3-
year
ave
rage
)
Source: Calculated from October Current Population Survey File (Formerly Table 14 in Census Bureau's School Enrollment Report)
Estimated Baccalaureate Degree Attainment by Age 24 by Family Income Quartile
1970 to 2015
Top Income Quartile
Bottom Income Quartile
Second Income Quartile
Third Income Quartile
in estimated bachelor’s degree at-tainment rates by age 24 across these same quartiles. In 2015, these rates are: Bottom quartile: 12.1% for stu-dents from the bottom quartile of family income, below $37,679. This rate is the result of:
75.8% (high school graduation rate) x 61.0% (college continu-ation rate) x 26.3% (estimated bachelor’s degree completion rate) = 12.1% (estimated bach-elor’s degree attainment rate).
This rate is the highest on rec-ord in data since 1970. It is up from 11.0% in 2014, 8.8% in 2013, and 7.5% in 2012.
The sharp increase since 2012 is the direct result of a small increase in high school gradu-ation rates (72.4% to 75.8%), a small increase in college con-tinuation rates (44.6% to 46.2%), and a large increases in estimated bachelor’s degree completion rates (16.8% to 26.3%).
Second quartile: 20.4% for stu-dents from the second quartile of family income, between $37,679 and $68,494. This rate is the result of:
84.8% (high school graduation rate) x 68.0% (college continu-ation rate) x 35.3% (estimated bachelor’s degree completion rate) = 20.4% (estimated bach-elor’s degree attainment rate).
This rate is the highest on rec-ord in data since 1970. It is up from 19.4% in 2014, 19.2% in 2013, and 18.7% in 2012.
The increase since 2012 is the direct result of a small in-crease in high school gradua-tion rates (83.2% to 84.8%), a small decrease in college continuation rates (71.9% to 68.0%), and a modest in-creases in estimated bache-lor’s degree completion rates (31.3% to 35.3%).
Third quartile: 35.3% for stu-dents from the third quartile of family income, between $68,494 and $119,765.
This rate is the result of: 89.7% (high school graduation rate) x 76.1% (college continu-ation rate) x 51.7% (estimated bachelor’s degree completion rate) = 35.3% (estimated bach-elor’s degree attainment rate).
This rate is the fifth highest on record in data since 1970. It is up from 35.0% in 2014, 35.6% in 2013, and 34.2% in 2012.
The small increase since 2012 is the direct result of a small increase in high school gradua-
6.0
9.5
20.4
17.7
0.0 5.0 10.0 15.0 20.0 25.0
Bottom
Second
Third
Top
Change (%)
Change in Estimated Bachelor's Degree Attainment Rate by Age 24 by Family Income Quartile: 1970 to 2015
All = 14.9%
Source: Calculated from October Current Population Survey File (Formerly Table 14 in Census Bureau's School Enrollment Report)
Page 20 Postsecondary Education OPPORTUNITY
Page 21 Postsecondary Education OPPORTUNITY
tion rates (88.1% to 89.7%), a small decrease in college con-tinuation rates (68.4% to 68.2%), and a small increase in estimated bachelor’s degree completion rates (50.0% to 51.7%).
Fourth quartile: 57.9% for stu-dents from the top quartile of fam-ily income, above $119,765. This rate is the result of: 90.7%
(high school graduation rate) x 86.3% (college continuation rate) x 74.0% (estimated bach-elor’s degree completion rate) = 57.9% (estimated bachelor’s degree attainment rate).
This rate is the second highest on record in data since 1970. It is up from 57.3% in 2014, 53.4% in 2013, and 49.1% in 2012.
The large increase since 2012 is the direct result of a small decrease in high school gradu-ation rates (91.5% to 90.7%), a small decrease in college con-tinuation rates (81.1% to 78.3%), and a sharp increase in estimated bachelor’s degree completion rates (60.6% to 74.0%).
Note the sharp increase in the bachelor’s degree attainment rate for students from the top quartile of family income. While these stu-dents have made no progress in either high school graduation or college continuation between 2012 and 2015, there appears to be a sharp increase in bachelor’s degree completion rates for these students
who started college. This in-crease could be at least partially attributable to children remaining in the parents’ homes longer after graduation. The Census Bureau’s data on the share of 18 to 24 year olds living at home with their parents has been rising over the last decade for both males and females. This may reflect some difficulties encountered by recent college graduates seeking to enter the labor market following gradu-ation. The Census Bureau data is not reported by family income levels, however, so it may be af-fecting transitions from other family income levels as well. Conclusion Given the proposition that higher education is vital to human wel-fare, this analysis examines data on the relationship between fami-ly income and higher educational opportunity. This analysis finds that students from the highest family incomes have the most higher education opportunity, and students from the lowest family incomes have the lowest higher education op-portunity. At the point of high school
graduation, students from the highest family incomes have the highest high school grad-uation rates. Students from the lowest family incomes have the lowest high school graduation rates.
At the point of college enroll-ment, high school graduates from the highest family in-comes have the highest college continuation rates. High school graduates from the low-est family incomes have the lowest college continuation rates.
Among enrolled college stu-dents, those from the highest family incomes are most likely to be enrolled in 4-year colleg-es or universities. Those from the lowest family income backgrounds are least likely to be enrolled in 4-year institu-tions.
Among enrolled college stu-dents, those from the highest family incomes are most likely to be enrolled full time. Those from the bottom half of the family income distribution are least likely to be enrolled full time.
Among enrolled college stu-dents, those from the highest family incomes are most likely to complete a bachelor’s de-gree by age 24. Those from the lowest family incomes are least likely to complete a bachelor’s degree by age 24.
By age 24, those from the highest family incomes are most likely to have attained a bachelor’s degree. Those from the lowest family incomes are least likely to have attained a bachelor’s degree.
These findings hold for both boys and girls. They hold for Whites, Blacks, Asians, and Hispanics.
Page 22 Postsecondary Education OPPORTUNITY
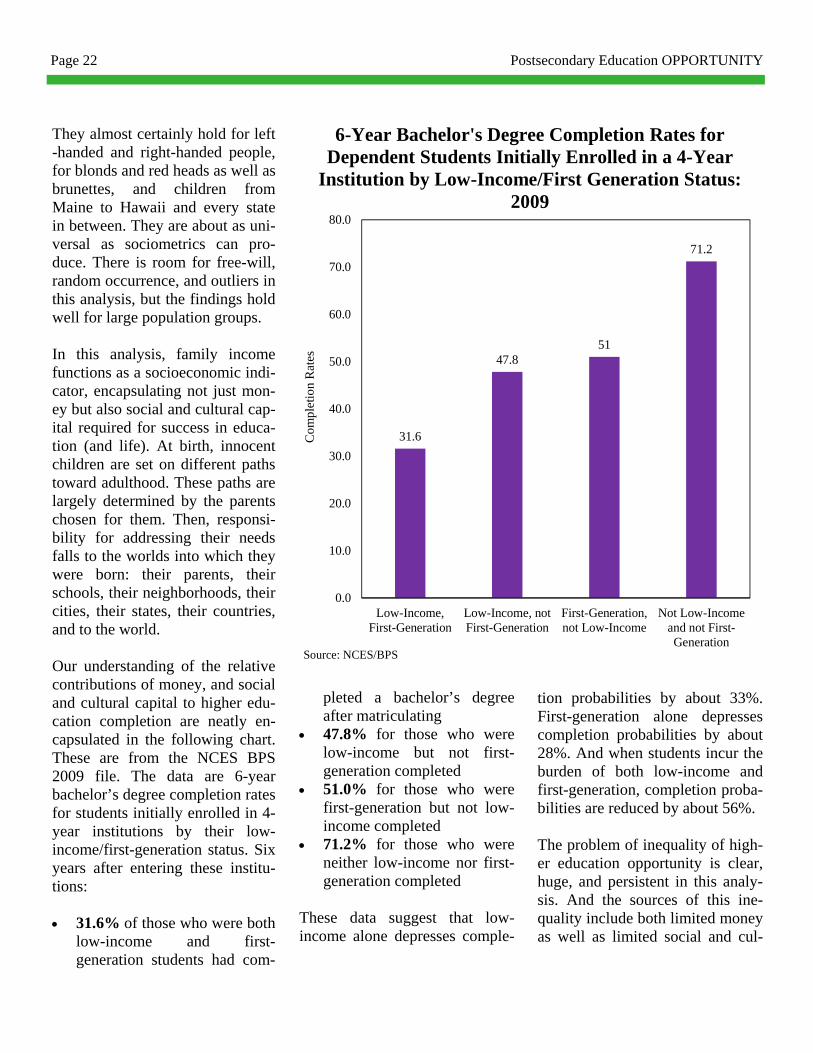
They almost certainly hold for left-handed and right-handed people, for blonds and red heads as well as brunettes, and children from Maine to Hawaii and every state in between. They are about as uni-versal as sociometrics can pro-duce. There is room for free-will, random occurrence, and outliers in this analysis, but the findings hold well for large population groups. In this analysis, family income functions as a socioeconomic indi-cator, encapsulating not just mon-ey but also social and cultural cap-ital required for success in educa-tion (and life). At birth, innocent children are set on different paths toward adulthood. These paths are largely determined by the parents chosen for them. Then, responsi-bility for addressing their needs falls to the worlds into which they were born: their parents, their schools, their neighborhoods, their cities, their states, their countries, and to the world. Our understanding of the relative contributions of money, and social and cultural capital to higher edu-cation completion are neatly en-capsulated in the following chart. These are from the NCES BPS 2009 file. The data are 6-year bachelor’s degree completion rates for students initially enrolled in 4-year institutions by their low-income/first-generation status. Six years after entering these institu-tions: 31.6% of those who were both
low-income and first-generation students had com-
pleted a bachelor’s degree after matriculating
47.8% for those who were low-income but not first-generation completed
51.0% for those who were first-generation but not low-income completed
71.2% for those who were neither low-income nor first-generation completed
These data suggest that low-income alone depresses comple-
tion probabilities by about 33%. First-generation alone depresses completion probabilities by about 28%. And when students incur the burden of both low-income and first-generation, completion proba-bilities are reduced by about 56%. The problem of inequality of high-er education opportunity is clear, huge, and persistent in this analy-sis. And the sources of this ine-quality include both limited money as well as limited social and cul-
31.6
47.851
71.2
0.0
10.0
20.0
30.0
40.0
50.0
60.0
70.0
80.0
Low-Income,First-Generation
Low-Income, notFirst-Generation
First-Generation,not Low-Income
Not Low-Incomeand not First-Generation
Com
plet
ion
Rat
es
Source: NCES/BPS
6-Year Bachelor's Degree Completion Rates for Dependent Students Initially Enrolled in a 4-Year
Institution by Low-Income/First Generation Status: 2009
Page 23 Postsecondary Education OPPORTUNITY
tural capital. We know how to ad-dress both needs, but cannot mus-ter the will and resources to do so. The financial barriers to higher
education—unmet financial need, student work/loan bur-den, and net price to family—have been readily defined and measured. They are large and growing as states shift costs of higher education from taxpay-ers to students at the same time that family incomes are declin-ing. These barriers have also been almost totally ignored by state and federal governments.
The social and cultural capital needs of students from low-income families have been ad-
dressed by the federal govern-ment through TRIO programs and funding for many decades. But TRIO programs reach no more than five percent of the low-income/first-generation popula-tions. What we are left with is huge and growing inequality of higher edu-cation opportunity. We know what the problem is, and we know how to address it. But we have chosen sometimes to ignore it, sometimes to address it inade-quately, and often times to make it worse. Apparently we have mainly chosen to accept its con-sequences.
SUBSCRIPTION INFORMATION
Postsecondary Education OPPORTUNITY is published periodically throughout the year. Subscriptions are $250 for the Print Edition, $200 for Electronic Subscriptions. All subscriptions include full website access to community.coenet.org.
TO SUBSCRIBE: Go to our Subscriptions page at: community.coenet.org or e-mail [email protected] for more information.