Page 1
www.elsevier.com/locate/isprsjprs
ISPRS Journal of Photogrammetry & Remote Sensing 58 (2003) 113–123
Potential and limits of InSAR data for building reconstruction
in built-up areas
U. Stilla*, U. Soergel, U. Thoennessen
FGAN-FOM Research Institute for Optronics and Pattern Recognition, D-76275 Ettlingen, Germany
Received 4 July 2002; accepted 31 January 2003
Abstract
The automatic reconstruction of buildings for the generation of city models is of great interest for different tasks. Three-
dimensional information can be directly obtained from both, laser (LIDAR) and radar (InSAR) measurements. The features of
both sensors are compared. The data acquisition by SAR is described, with emphasis on the special properties of the
interferometric SAR principle. A segmentation approach for building reconstruction is proposed. The results show that building
reconstruction is possible from InSAR, but the achievable level of detail cannot compete with LIDAR. The main source of
limitation is the inherent side-looking scene illumination of SAR, giving rise to disturbing phenomena interfering with often
large parts of the scene. Geometric constraints for the location and size of such problem areas are derived. To identify areas of
unreliable data in SAR images of a built-up area, corresponding elevation data are analysed. The impact of the phenomena
layover, shadow and dominant scattering at building locations is considered. For this task, a hybrid elevation reference is
required. The buildings and the surrounding ground are represented as CAD planes. Natural objects like trees and bushes
remain in the raster representation.
D 2003 Elsevier Science B.V. All rights reserved.
Keywords: interferometric SAR; LIDAR; built-up areas; building reconstruction
1. Introduction
Three-dimensional city models are of great interest
for visualisation, simulation and monitoring purposes
in different fields. A typical application is the visual-
isation of the influence of a planned building to the
surrounding townscape for city and regional planning.
Additionally, there is a growing demand for such
models in civil and military mission planning. City
0924-2716/03/$ - see front matter D 2003 Elsevier Science B.V. All right
doi:10.1016/S0924-2716(03)00021-2
* Corresponding author. Tel.: +49-7243-992-328; fax: +49-
7243-992-299.
E-mail address: [email protected] (U. Stilla).
models are used as basis for simulation, for example,
in the fields of environmental engineering for micro-
climate investigations or telecommunications for
transmitter placement. Furthermore, 3D information
can be used for monitoring, for example, damage
assessment after an earthquake.
All the mentioned tasks require knowledge about
the 3D structure of buildings. Besides the classical
photogrammetric approaches to determine object
heights indirectly, range sensors like LIDAR and
interferometric SAR (InSAR) have played an impor-
tant role since recent years. Table 1 gives an overview
of some features of both systems.
s reserved.
Page 2
Table 1
Features of state-of-the-art LIDAR and InSAR systems
LIDAR InSAR
Signal reflected infrared pulse two radar cross
sections
Measurement time-of-flight phase difference
Wavelength Am cm
Illumination nadir or side-looking side-looking
Range attenuation in atmosphere
limits range
range and weather
independent
Elevation
accuracy
dm m
Pixel resolution dm–m dm–m
U. Stilla et al. / ISPRS Journal of Photogrammetry & Remote Sensing 58 (2003) 113–123114
For topographic mapping, data acquisition in nadir
view is advantageous, especially in dense urban scenes
with elevated objects. The LIDAR principle allows
airborne applications in oblique (e.g. obstacle warning
systems) and in nadir view as well. In contrast to
LIDAR, the SAR principle requires a side-looking
illumination. LIDAR is based on the time-of-flight
measurement of reflected infrared laser pulses, while
InSAR exploits the phase difference of two measure-
ments of the radar cross-section. Current laser systems
achieve higher elevation accuracy compared to radar
systems which are more sensitive to noise, because the
measurement is based on a phase difference of two
signals. Typically, the obtained accuracy is in the order
of decimeters for LIDAR and a few meters for InSAR.
LIDAR and InSAR are both active systems, which
illuminate the scene with electromagnetic waves and
measure the backscattered signal component. Due to
Fig. 1. SAR image of test area Karlsruhe
the different wavelengths (e.g. LIDAR: 1.5 Am, SAR: 3
cm), special surface properties are sensed, because the
reflectance depends mainly on the surface roughness
compared to the wavelength. Furthermore, different
behaviours concerning atmospheric attenuation and
weather conditions are observed. While radar shows
almost no sensitivity to weather influence, laser is
attenuated from rain or fog and the signal might be
reflected away from the sensor if the surface is covered
with frost or ice. Another advantage of SAR is the
opportunity of recording large areas in a short time and
from a large distance. Fig. 1 shows a SAR image from a
section of the test area Karlsruhe (1 pixel = 1 m� 1 m).
Due to the mentioned features, both sensors are of
interest for the generation of 3D descriptions (Gamba
and Houshmand, 2000). For some applications, for
example, disaster management, LIDAR data (Kaku-
moto et al., 1997) as well as InSAR data (Takeuchi et
al., 2000) were evaluated. A fusion of LIDAR and
InSAR data of vegetated areas was proposed by
Slatton et al. (2000).
This paper is organized as follows. First, the SAR
and InSAR principles are recapitulated with emphasis
on the illumination phenomena. Then, an approach
for a building segmentation in InSAR data is pro-
posed. A building reconstruction in dense built-up
areas is often hindered by mutual interference of the
signal from the buildings by layover, shadow and
strong scattering effects. Geometric constraints for the
location and size of such problem areas are derived
for a given sensor altitude and viewing angle. If
(City center, Castle and Campus).
Page 3
U. Stilla et al. / ISPRS Journal of Photogrammetry & Remote Sensing 58 (2003) 113–123 115
reference elevation data is available, it is useful to
study the influence of, for example, different aspect
angles of the SAR acquisition on the location and size
of such areas. With respect to the building recon-
struction task, it is important to determine the portion
of undisturbed measurable building roof areas. To
consider the influence of man-made objects as well as
natural objects, a hybrid ground truth (raster and
vector data) is chosen.
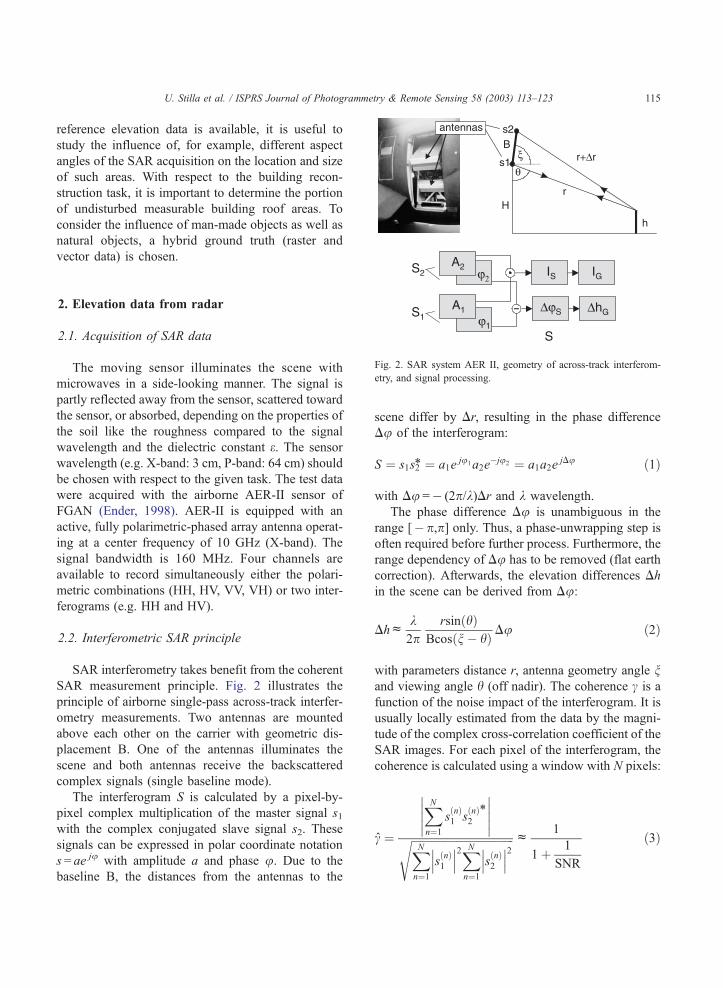
Fig. 2. SAR system AER II, geometry of across-track interferom-
etry, and signal processing.
2. Elevation data from radar
2.1. Acquisition of SAR data
The moving sensor illuminates the scene with
microwaves in a side-looking manner. The signal is
partly reflected away from the sensor, scattered toward
the sensor, or absorbed, depending on the properties of
the soil like the roughness compared to the signal
wavelength and the dielectric constant e. The sensor
wavelength (e.g. X-band: 3 cm, P-band: 64 cm) should
be chosen with respect to the given task. The test data
were acquired with the airborne AER-II sensor of
FGAN (Ender, 1998). AER-II is equipped with an
active, fully polarimetric-phased array antenna operat-
ing at a center frequency of 10 GHz (X-band). The
signal bandwidth is 160 MHz. Four channels are
available to record simultaneously either the polari-
metric combinations (HH, HV, VV, VH) or two inter-
ferograms (e.g. HH and HV).
2.2. Interferometric SAR principle
SAR interferometry takes benefit from the coherent
SAR measurement principle. Fig. 2 illustrates the
principle of airborne single-pass across-track interfer-
ometry measurements. Two antennas are mounted
above each other on the carrier with geometric dis-
placement B. One of the antennas illuminates the
scene and both antennas receive the backscattered
complex signals (single baseline mode).
The interferogram S is calculated by a pixel-by-
pixel complex multiplication of the master signal s1with the complex conjugated slave signal s2. These
signals can be expressed in polar coordinate notation
s = ae ju with amplitude a and phase u. Due to the
baseline B, the distances from the antennas to the
scene differ by Dr, resulting in the phase difference
Du of the interferogram:
S ¼ s1s2* ¼ a1eju1a2e
�ju2 ¼ a1a2ejDu ð1Þ
with Du =� (2p/k)Dr and k wavelength.
The phase difference Du is unambiguous in the
range [� p,p] only. Thus, a phase-unwrapping step is
often required before further process. Furthermore, the
range dependency of Du has to be removed (flat earth
correction). Afterwards, the elevation differences Dh
in the scene can be derived from Du:
Dhck2p
rsinðhÞBcosðn � hÞ Du ð2Þ
with parameters distance r, antenna geometry angle nand viewing angle h (off nadir). The coherence c is a
function of the noise impact of the interferogram. It is
usually locally estimated from the data by the magni-
tude of the complex cross-correlation coefficient of the
SAR images. For each pixel of the interferogram, the
coherence is calculated using a window with N pixels:
c ¼
XNn¼1
sðnÞ1 s
ðnÞ*2
����������ffiffiffiffiffiffiffiffiffiffiffiffiffiffiffiffiffiffiffiffiffiffiffiffiffiffiffiffiffiffiffiffiffiffiffiffiffiXN
n¼1
sðnÞ1
��� ���2XNn¼1
sðnÞ2
��� ���2s c
1
1þ 1
SNR
ð3Þ
Page 4
U. Stilla et al. / ISPRS Journal of Photogrammetry & Remote Sensing 58 (2003) 113–123116
Hence, the local quality of an InSAR DEM can be
directly assessed from the data by the related coher-
ence value. Furthermore, the coherence is exploited
for change detection tasks: changes in the period
between repeated SAR measurements lead to decor-
relation of the signals.
2.3. Geometric interpretation
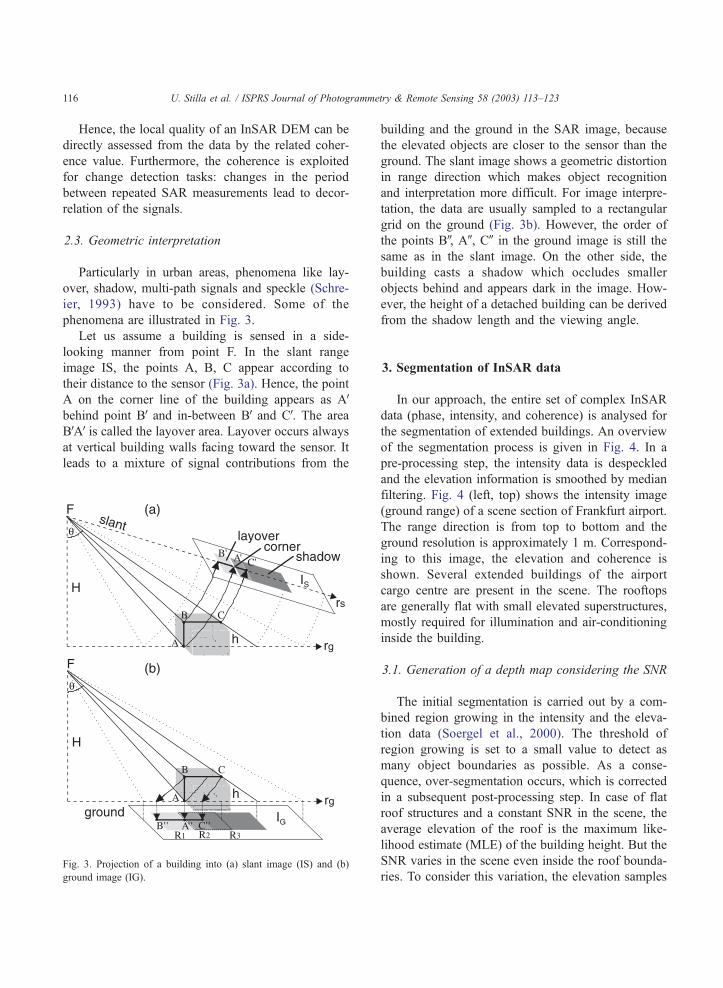
Particularly in urban areas, phenomena like lay-
over, shadow, multi-path signals and speckle (Schre-
ier, 1993) have to be considered. Some of the
phenomena are illustrated in Fig. 3.
Let us assume a building is sensed in a side-
looking manner from point F. In the slant range
image IS, the points A, B, C appear according to
their distance to the sensor (Fig. 3a). Hence, the point
A on the corner line of the building appears as AVbehind point BVand in-between BVand CV. The area
BVAVis called the layover area. Layover occurs always
at vertical building walls facing toward the sensor. It
leads to a mixture of signal contributions from the
Fig. 3. Projection of a building into (a) slant image (IS) and (b)
ground image (IG).
building and the ground in the SAR image, because
the elevated objects are closer to the sensor than the
ground. The slant image shows a geometric distortion
in range direction which makes object recognition
and interpretation more difficult. For image interpre-
tation, the data are usually sampled to a rectangular
grid on the ground (Fig. 3b). However, the order of
the points BW, AU, CU in the ground image is still the
same as in the slant image. On the other side, the
building casts a shadow which occludes smaller
objects behind and appears dark in the image. How-
ever, the height of a detached building can be derived
from the shadow length and the viewing angle.
3. Segmentation of InSAR data
In our approach, the entire set of complex InSAR
data (phase, intensity, and coherence) is analysed for
the segmentation of extended buildings. An overview
of the segmentation process is given in Fig. 4. In a
pre-processing step, the intensity data is despeckled
and the elevation information is smoothed by median
filtering. Fig. 4 (left, top) shows the intensity image
(ground range) of a scene section of Frankfurt airport.
The range direction is from top to bottom and the
ground resolution is approximately 1 m. Correspond-
ing to this image, the elevation and coherence is
shown. Several extended buildings of the airport
cargo centre are present in the scene. The rooftops
are generally flat with small elevated superstructures,
mostly required for illumination and air-conditioning
inside the building.
3.1. Generation of a depth map considering the SNR
The initial segmentation is carried out by a com-
bined region growing in the intensity and the eleva-
tion data (Soergel et al., 2000). The threshold of
region growing is set to a small value to detect as
many object boundaries as possible. As a conse-
quence, over-segmentation occurs, which is corrected
in a subsequent post-processing step. In case of flat
roof structures and a constant SNR in the scene, the
average elevation of the roof is the maximum like-
lihood estimate (MLE) of the building height. But the
SNR varies in the scene even inside the roof bounda-
ries. To consider this variation, the elevation samples
Page 5
Fig. 4. Processing chain for segmentation of buildings from InSAR data.
U. Stilla et al. / ISPRS Journal of Photogrammetry & Remote Sensing 58 (2003) 113–123 117
are weighted with the coherence for the averaging
step. This results in a preliminary depth map of pris-
matic objects. Segments with low average intensity
and coherence are regarded as unreliable. These seg-
ments are assumed to coincide with shadow areas or
roads and are considered later to check the consis-
tency of the results.
3.2. Detection of buildings
Elevated segments which match a building model
according to size and shape are considered as
building candidates. Shadow cast from a rectangular
flat building part leads to either long or L-shaped
segments, depending on the aspect. Their width is a
function of viewing angle and object height. Hence,
for each building candidate, an expectation area for
a shadow stripe is predictable. Unfortunately,
shadow cannot always be distinguished from objects
which appear similar in the data, like roads. There-
fore, as a minimum requirement, an area of the set
of unreliable segments is expected to be found at the
predicted shadow location. If so, the candidate seg-
ment is labeled to be a building. In case shadow
does not interfere with roads, a more subtle analysis
is carried out. Shadow stripes are extracted in the
intensity data with a simple structural image analysis
algorithm.
3.3. Post-processing
Shadow areas are used to overcome under-segmen-
tation. Segments containing a possible shadow area
are further investigated (Soergel et al., 2000). The
under-segmentation is corrected in two different ways.
If the histogram of the original height values shows a
bimodal curve, the segment is split into two closed
segments, if possible. In a second approach, a region-
Page 6
U. Stilla et al. / ISPRS Journal of Photogrammetry & Remote Sensing 58 (2003) 113–123118
growing step in the median filtered heights is carried
out. In contrast to the initial segmentation, the border
toward the shadow region is used as seed (Hoepfner,
1999) and the threshold is smaller. Over-segmentation
is corrected by merging adjacent segments with sim-
ilar heights. After post-processing, the depth map is
recalculated.
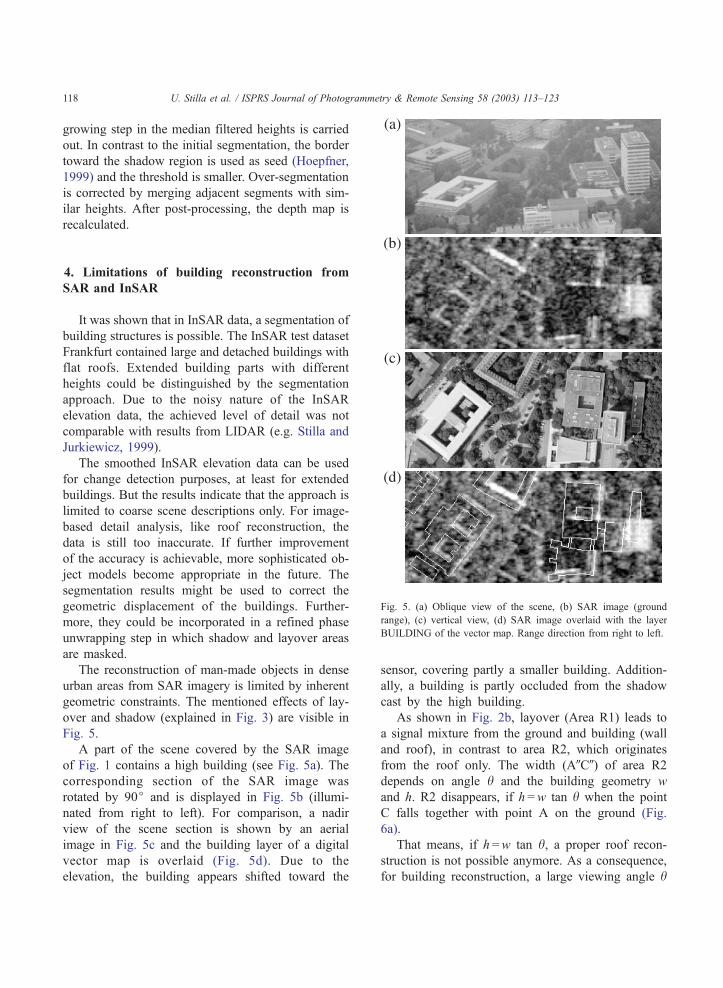
Fig. 5. (a) Oblique view of the scene, (b) SAR image (ground
range), (c) vertical view, (d) SAR image overlaid with the layer
BUILDING of the vector map. Range direction from right to left.
4. Limitations of building reconstruction from
SAR and InSAR
It was shown that in InSAR data, a segmentation of
building structures is possible. The InSAR test dataset
Frankfurt contained large and detached buildings with
flat roofs. Extended building parts with different
heights could be distinguished by the segmentation
approach. Due to the noisy nature of the InSAR
elevation data, the achieved level of detail was not
comparable with results from LIDAR (e.g. Stilla and
Jurkiewicz, 1999).
The smoothed InSAR elevation data can be used
for change detection purposes, at least for extended
buildings. But the results indicate that the approach is
limited to coarse scene descriptions only. For image-
based detail analysis, like roof reconstruction, the
data is still too inaccurate. If further improvement
of the accuracy is achievable, more sophisticated ob-
ject models become appropriate in the future. The
segmentation results might be used to correct the
geometric displacement of the buildings. Further-
more, they could be incorporated in a refined phase
unwrapping step in which shadow and layover areas
are masked.
The reconstruction of man-made objects in dense
urban areas from SAR imagery is limited by inherent
geometric constraints. The mentioned effects of lay-
over and shadow (explained in Fig. 3) are visible in
Fig. 5.
A part of the scene covered by the SAR image
of Fig. 1 contains a high building (see Fig. 5a). The
corresponding section of the SAR image was
rotated by 90j and is displayed in Fig. 5b (illumi-
nated from right to left). For comparison, a nadir
view of the scene section is shown by an aerial
image in Fig. 5c and the building layer of a digital
vector map is overlaid (Fig. 5d). Due to the
elevation, the building appears shifted toward the
sensor, covering partly a smaller building. Addition-
ally, a building is partly occluded from the shadow
cast by the high building.
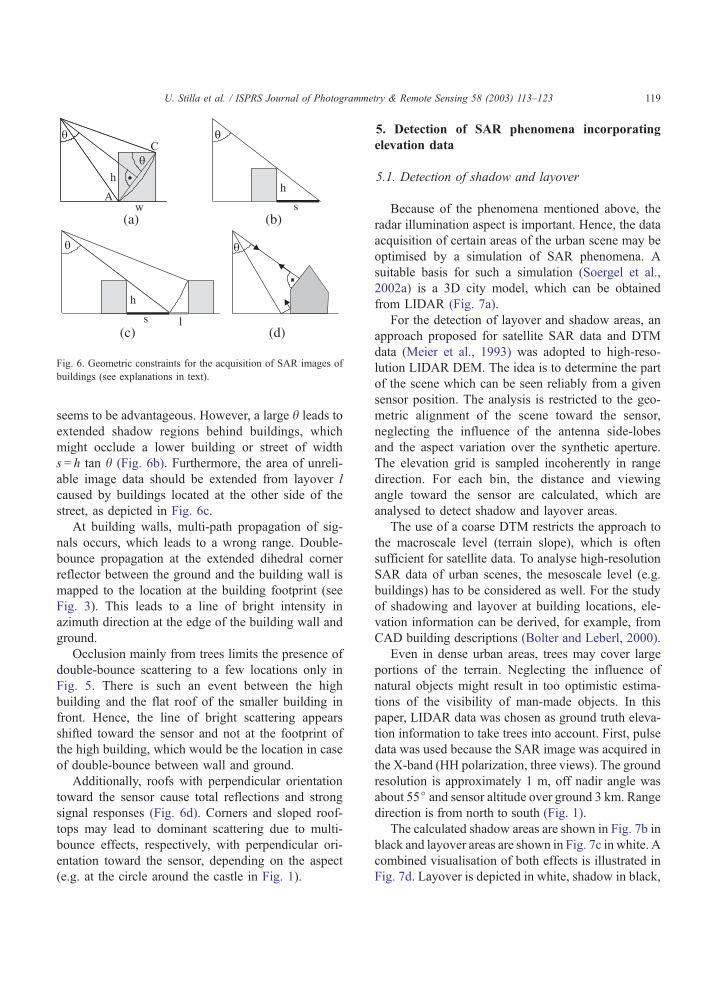
As shown in Fig. 2b, layover (Area R1) leads to
a signal mixture from the ground and building (wall
and roof), in contrast to area R2, which originates
from the roof only. The width (AUCU) of area R2
depends on angle h and the building geometry w
and h. R2 disappears, if h =w tan h when the point
C falls together with point A on the ground (Fig.
6a).
That means, if h =w tan h, a proper roof recon-
struction is not possible anymore. As a consequence,
for building reconstruction, a large viewing angle h
Page 7
Fig. 6. Geometric constraints for the acquisition of SAR images of
buildings (see explanations in text).
U. Stilla et al. / ISPRS Journal of Photogrammetry & Remote Sensing 58 (2003) 113–123 119
seems to be advantageous. However, a large h leads to
extended shadow regions behind buildings, which
might occlude a lower building or street of width
s = h tan h (Fig. 6b). Furthermore, the area of unreli-
able image data should be extended from layover l
caused by buildings located at the other side of the
street, as depicted in Fig. 6c.
At building walls, multi-path propagation of sig-
nals occurs, which leads to a wrong range. Double-
bounce propagation at the extended dihedral corner
reflector between the ground and the building wall is
mapped to the location at the building footprint (see
Fig. 3). This leads to a line of bright intensity in
azimuth direction at the edge of the building wall and
ground.
Occlusion mainly from trees limits the presence of
double-bounce scattering to a few locations only in
Fig. 5. There is such an event between the high
building and the flat roof of the smaller building in
front. Hence, the line of bright scattering appears
shifted toward the sensor and not at the footprint of
the high building, which would be the location in case
of double-bounce between wall and ground.
Additionally, roofs with perpendicular orientation
toward the sensor cause total reflections and strong
signal responses (Fig. 6d). Corners and sloped roof-
tops may lead to dominant scattering due to multi-
bounce effects, respectively, with perpendicular ori-
entation toward the sensor, depending on the aspect
(e.g. at the circle around the castle in Fig. 1).
5. Detection of SAR phenomena incorporating
elevation data
5.1. Detection of shadow and layover
Because of the phenomena mentioned above, the
radar illumination aspect is important. Hence, the data
acquisition of certain areas of the urban scene may be
optimised by a simulation of SAR phenomena. A
suitable basis for such a simulation (Soergel et al.,
2002a) is a 3D city model, which can be obtained
from LIDAR (Fig. 7a).
For the detection of layover and shadow areas, an
approach proposed for satellite SAR data and DTM
data (Meier et al., 1993) was adopted to high-reso-
lution LIDAR DEM. The idea is to determine the part
of the scene which can be seen reliably from a given
sensor position. The analysis is restricted to the geo-
metric alignment of the scene toward the sensor,
neglecting the influence of the antenna side-lobes
and the aspect variation over the synthetic aperture.
The elevation grid is sampled incoherently in range
direction. For each bin, the distance and viewing
angle toward the sensor are calculated, which are
analysed to detect shadow and layover areas.
The use of a coarse DTM restricts the approach to
the macroscale level (terrain slope), which is often
sufficient for satellite data. To analyse high-resolution
SAR data of urban scenes, the mesoscale level (e.g.
buildings) has to be considered as well. For the study
of shadowing and layover at building locations, ele-
vation information can be derived, for example, from
CAD building descriptions (Bolter and Leberl, 2000).
Even in dense urban areas, trees may cover large
portions of the terrain. Neglecting the influence of
natural objects might result in too optimistic estima-
tions of the visibility of man-made objects. In this
paper, LIDAR data was chosen as ground truth eleva-
tion information to take trees into account. First, pulse
data was used because the SAR image was acquired in
the X-band (HH polarization, three views). The ground
resolution is approximately 1 m, off nadir angle was
about 55j and sensor altitude over ground 3 km. Range
direction is from north to south (Fig. 1).
The calculated shadow areas are shown in Fig. 7b in
black and layover areas are shown in Fig. 7c in white. A
combined visualisation of both effects is illustrated in
Fig. 7d. Layover is depicted in white, shadow in black,
Page 8
Fig. 7. (a) Laser elevation data, (b) shadow simulation, (c) layover simulation, (d) SAR phenomena image with shadow and layover, (e) SAR
image. Range direction from top to bottom.
U. Stilla et al. / ISPRS Journal of Photogrammetry & Remote Sensing 58 (2003) 113–123120
and areas with a mixture of layover and shadow appear
dark grey. The region of the scene which is expected to
lead to undisturbed signal is represented in bright grey.
In Fig. 7e, the corresponding section of the SAR image
which was acquired from the simulated position is
depicted for comparison.
The results of the shadow/layover detection are
given in Table 2. According to the viewing angle, one
might expect a larger portion of shadow compared to
layover. This would be the case if all objects in the
scene were detached and the phenomena caused by
themwould not interfere with each other. But in the test
scene, the ground distance in range direction between
the objects is often small. This results in many mixed
pixels where shadow and layover are both present.
Especially for building analysis from InSAR data,
the influence of layover on the elevation measurement
has to be considered (Bolter and Leberl, 2000). Due to
Table 2
Results of shadow/layover detection in percent
Complete
scene
Roads Building
roofs
Shadow 28 38.5 16
Layover 25 18.5 33.5
Mixed 19 23.5 7.5
Reliable 28 19.5 43
the signal mixture, the elevation data tend to be too
small at layover locations (neglecting the noise influ-
ence). Only 43% of the roof area is not interfered by
layover or shadow.
To estimate the improvement by a second measure-
ment, a SAR image with perpendicular illumination
from the west was simulated. In the second case, the
sensing direction coincides with the maximum of the
main road orientations. In approximately 45% of the
area, an unreliable measurement in one view can be
compensated by the data of the other view. However,
still about a third of the area remains unreliable.
Such simulations can be carried out for different
aspect directions to determine the best aspect or set of
aspects maximising the surface visibility of a special
object class. In the same way, a variation of the
viewing angle can be considered. For the test scene
Karlsruhe, 648 simulations with 72 aspects and 9
viewing angles (steps in 5j) were carried out (Soergel
et al., 2002b). By combining the four optimal SAR
acquisitions, approx. 85% of the roof areas could be
sensed at least by one view.
5.2. Detection of locations of strong backscatter
For the detection of possible locations of dou-
ble-bounce and total reflection phenomena, a com-
Page 9
Fig. 8. Subset of the combined raster and vector ground truth.
Fig. 9. (a) Aerial image, (b) building footprints (grey) and locations of possible strong scattering (black), (c) real SAR image, (d) simulated SAR
image with building footprints.
U. Stilla et al. / ISPRS Journal of Photogrammetry & Remote Sensing 58 (2003) 113–123 121
Page 10
U. Stilla et al. / ISPRS Journal of Photogrammetry & Remote Sensing 58 (2003) 113–123122
bined raster and vector ground truth is analysed. A
detail of this hybrid ground truth is depicted in Fig.
8. To derive the vector data from the LIDAR
DEM, a building expectation area was determined
from the building footprints. In this area, planes
were fitted to the elevation data (Stilla and Jurkie-
wicz, 1999).
Vertical planes oriented toward the sensor which
are not occluded by shadow are candidates for double-
bounce scattering (Meyer and Roy, 2000). Total
reflection occurs if the normal vector of a plane points
to the sensor. The detected candidates for corner
structures shown in Fig. 9b agree well with super-
structures on the rooftops in the aerial image (Fig. 9a)
and bright stripes in the real SAR data (Fig. 9c). The
shift of elevated objects toward the sensor is illus-
trated in the SAR simulation shown in Fig. 9d.
Particularly interesting is the rippled roof structure
on the left, causing strong signal response. This
example illustrates that strong scatterers cannot be
detected from the building footprints alone. Hence,
detailed building models should be incorporated for
analysis of SAR data in urban areas.
6. Conclusion and outlook
It was shown that from InSAR data a segmentation
of building structures is possible. The InSAR test
dataset Frankfurt contained large and detached build-
ings with flat roofs. Extended building parts with
different heights could be distinguished by the seg-
mentation approach. Due to the noisy nature of the
InSAR elevation data, the achieved level of detail was
not comparable to the results from LIDAR. Further-
more, in dense built-up areas, mutual interference of
the signals from buildings may hinder building recon-
struction. In spite of these limitations, InSAR can
offer the opportunity to sense urban areas even in case
of bad weather conditions, if LIDAR is not operable.
A detection of areas with unreliable SAR data by
incorporating a priori acquired elevation data is useful
for analysing SAR images. 3D city models containing
man-made objects in vector representation (CAD)
which were combined with elevation data of natural
objects (e.g. vegetation) in raster representation
(DEM) were shown to be a well-suited scene refer-
ence for this task.
The optimal viewing angle (off-nadir) depends on
the specific scene section and cannot be given in
general. But, both the best aspect and viewing angle
can be determined by simulations.
A combined analysis of SAR data from different
aspects can enlarge the portion of reliable data. The
evidence of the final results can be improved by
mutual confirmation of segmentation results in each
image. Techniques for the fusion of knowledge from
the different InSAR surveys have to be further studied
and are the subject of future work.
Acknowledgements
We thank Dr. Ender (FGAN-FHRResearch Institute
for High Frequency Physics and Radar Techniques) for
providing us the InSAR data (AER II).
References
Bolter, R., Leberl, F., 2000. Phenomenology-based and interferom-
etry-guided building reconstruction from multiple SAR images.
Proc. EUSAR, 687–690.
Ender, J.H.G., 1998. Experimental results achieved with the air-
borne multi-channel SAR system AER-II. Proc. EUSAR,
315–318.
Gamba, P., Houshmand, B., 2000. Digital surface models and build-
ing extraction: a comparison of IF-SAR and LIDAR data. IEEE
Trans. Geosci. Remote Sens. 38 (4), 1959–1968.
Hoepfner, K.B., 1999. Recovery of Building Structure from IFSAR-
Derived Elevation Maps. Technical Report 99-16. Computer
Science Department, University of Massachusetts, Amherst.
Kakumoto, S., Hatayama, M., Kameda, H., Taniguchi, T., 1997.
Development of disaster management spatial information sys-
tem. Proc. GIS’97 Conf. GIS World, Inc., Fort Collins, USA,
pp. 595–598.
Meier, E., Frei, U., Nuesch, D., 1993. Precise terrain corrected
geocoded images. In: Schreier, G. (Ed.), SAR Geocoding: Data
and Systems. Wichmann, Karlsruhe, pp. 173–185.
Meyer, R.H., Roy, R.J., 2000. Algorithms for interpreting SAR
imagery of complex building scenes. In: Zelnio, E. (Ed.),
Algorithms for Synthetic Aperture Radar Imagery VII. SPIE
Proc., vol. 4053. SPIE-The International Society for Optical
Engineering, pp. 642–651.
Schreier, G., 1993. Geometrical properties of SAR images. In: Schre-
ier, G. (Ed.), SAR Geocoding: Data and Systems. Wichmann,
Karlsruhe, pp. 103–134.
Slatton, K.C., Crawford, M.M., Evans, B.L., 2000. Combining in-
terferometric radar and laser altimeter data to improve estimates
of topography. Proc. IGARSS (on CD ROM).
Page 11
U. Stilla et al. / ISPRS Journal of Photogrammetry & Remote Sensing 58 (2003) 113–123 123
Soergel, U., Thoennessen, U., Gross, H., Stilla, U., 2000. Segmenta-
tion of interferometric SAR data for building detection. Int. Arch.
Photogramm. Remote Sens., vol. 33, Part B1, pp. 328–335.
Soergel, U., Schulz, K., Thoennessen, U., Stilla, U., 2002a. Utiliza-
tion of 2D and 3D information for SAR image analysis in dense
urban areas. Proc. 4th European Conference on Synthetic Aper-
ture Radar (EUSAR 2002). VDE, Berlin, pp. 429–434.
Soergel, U., Thoennessen, U., Stilla, U., 2002b. Utilization of
LIDAR DEM for SAR image analysis in dense urban areas.
In: Kalliany, R., Leberl, F. (Eds.), Photogrammetric Computer
Vision. Int. Arch. Photogramm. Remote Sens., vol. 34, Part
3B, pp. 255–258.
Stilla, U., Jurkiewicz, K., 1999. Reconstruction of building models
from maps and laser altimeter data. In: Agouris, P., Stefanidis,
A. (Eds.), Integrated Spatial Databases: Digital Images and GIS.
Springer, Berlin, pp. 34–46.
Takeuchi, S., Suga, Y., Yonezawa, C., Chen, C.H., 2000. Detection
of urban disaster using InSAR—a case study for the 1999 great
Taiwan earthquake. Proc. IGARSS (on CD ROM).