Potential Benefits of an RPS in Vermont. Mark Bolinger Lawrence Berkeley National Laboratory [email protected] (603.795.4937) VT RPS Collaborative Meeting Montpelier, VT October 1, 2003. Potential Benefits of an RPS. Mitigates Fuel Price Risk - PowerPoint PPT Presentation
Environmental Energy Technologies Division • Energy Analysis Department Potential Benefits of an RPS in Vermont Mark Bolinger Lawrence Berkeley National Laboratory [email protected] (603.795.4937) VT RPS Collaborative Meeting Montpelier, VT October 1, 2003
Transcript
Environmental Energy Technologies Division • Energy Analysis Department
Potential Benefits ofan RPS in Vermont
Mark BolingerLawrence Berkeley National Laboratory
Environmental Compliance Risk• Promotes Local Economic Development
Environmental Energy Technologies Division • Energy Analysis Department
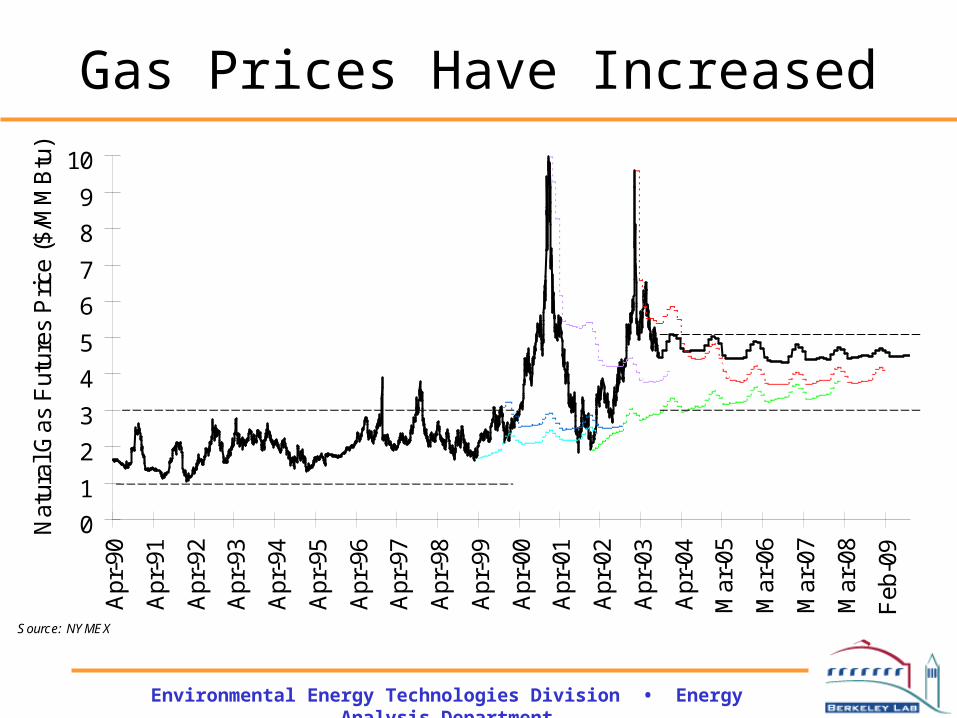
Gas Prices Have Increased
0
1
2
3
4
5
6
7
8
9
10
Apr
-90
Apr
-91
Apr
-92
Apr
-93
Apr
-94
Apr
-95
Apr
-96
Apr
-97
Apr
-98
Apr
-99
Apr
-00
Apr
-01
Apr
-02
Apr
-03
Apr
-04
Mar
-05
Mar
-06
Mar
-07
Mar
-08
Feb
-09
Nat
ural
Gas
Fut
ures
Pric
e ($
/MM
Btu
)
Source: NYMEX
Environmental Energy Technologies Division • Energy Analysis Department
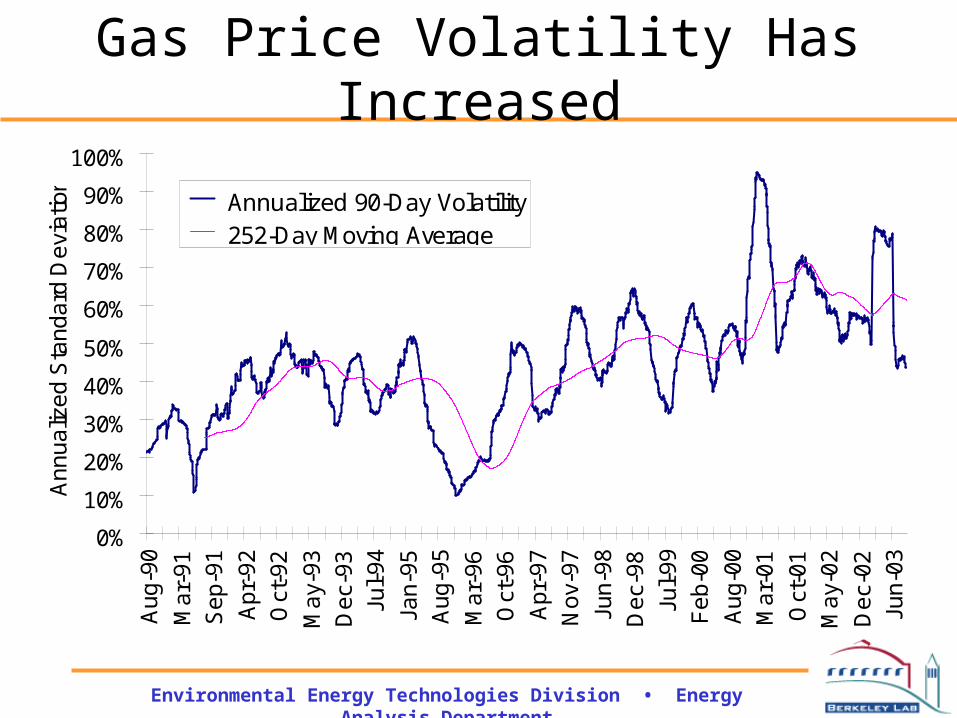
Gas Price Volatility Has Increased
0%
10%
20%
30%
40%
50%
60%
70%
80%
90%
100%A
ug
-90
Ma
r-9
1S
ep
-91
Ap
r-9
2O
ct-9
2
Ma
y-9
3D
ec-
93
Jul-
94
Jan
-95
Au
g-9
5
Ma
r-9
6O
ct-9
6
Ap
r-9
7N
ov-
97
Jun
-98
De
c-9
8
Jul-
99
Fe
b-0
0
Au
g-0
0M
ar-
01
Oct
-01
Ma
y-0
2
De
c-0
2Ju
n-0
3
An
nu
aliz
ed
Sta
nd
ard
De
via
tion
Annualized 90-Day Volatility 252-Day Moving Average
Environmental Energy Technologies Division • Energy Analysis Department
Gas Contributes to Electricity Price Volatility
• The cost of natural gas accounts for more than half the levelized cost of new gas-fired generation, and more than 90% of operating costs
• Gas-fired “peakers” often set the market clearing price in New England
• VT currently not all that exposed to wholesale market…still true in 10 years?
Environmental Energy Technologies Division • Energy Analysis Department
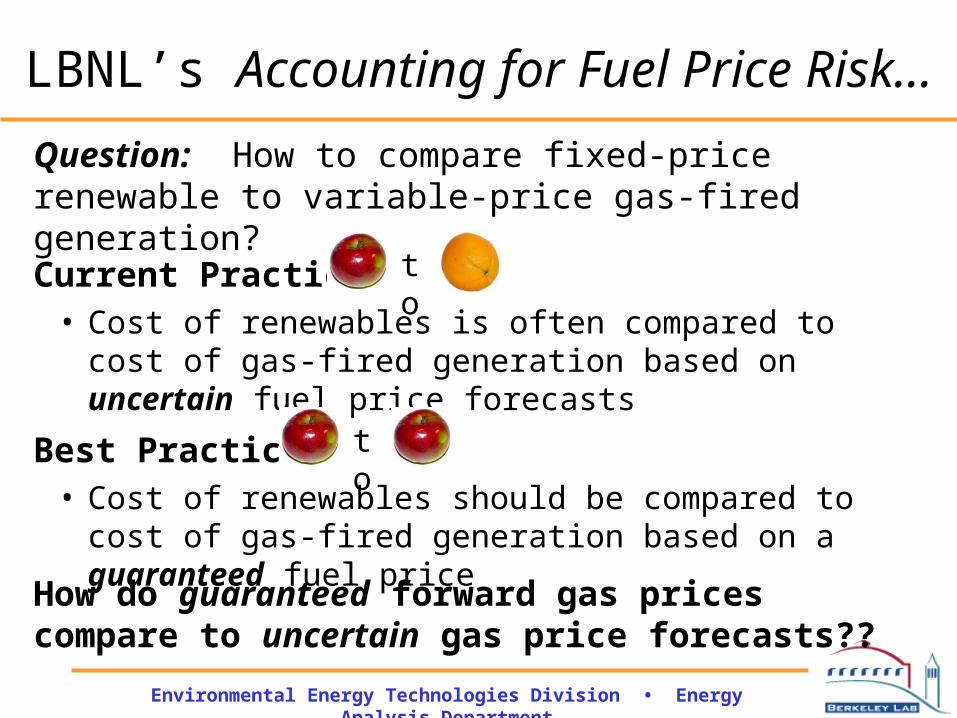
LBNL’s Accounting for Fuel Price Risk…
Best Practice:• Cost of renewables should be compared to cost of gas-
fired generation based on a guaranteed fuel price
Current Practice:• Cost of renewables is often compared to cost of gas-fired
generation based on uncertain fuel price forecasts
Question: How to compare fixed-price renewable to variable-price gas-fired generation?
How do guaranteed forward gas prices compare to uncertain gas price forecasts??
to
to
Environmental Energy Technologies Division • Energy Analysis Department
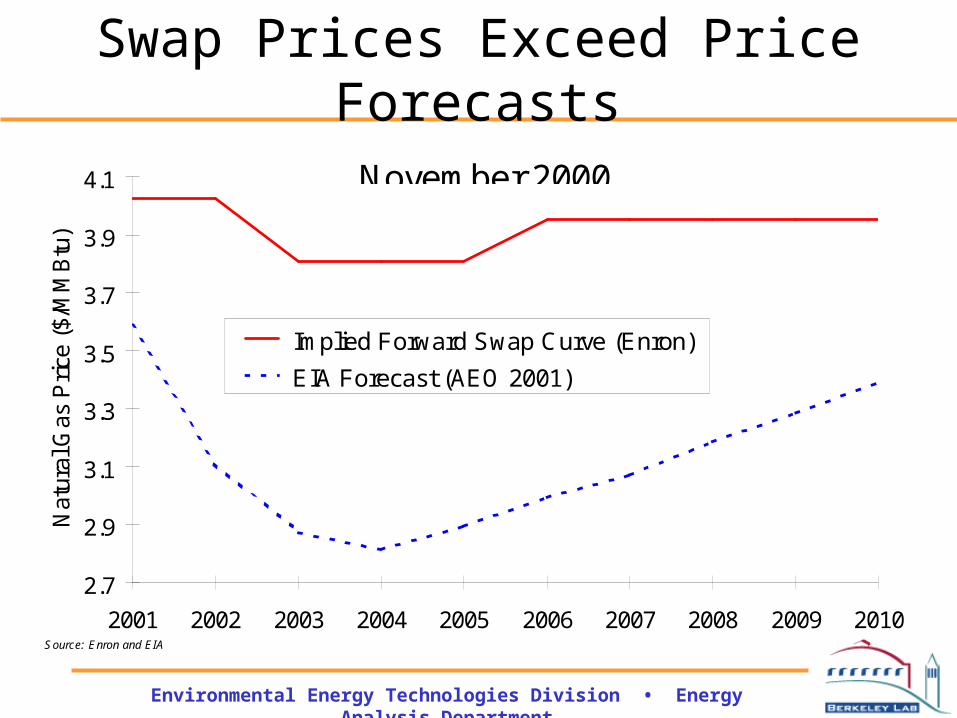
Swap Prices Exceed Price Forecasts
2.7
2.9
3.1
3.3
3.5
3.7
3.9
4.1
2001 2002 2003 2004 2005 2006 2007 2008 2009 2010
Nat
ural
Gas
Pri
ce (
$/M
MB
tu)
Implied Forward Swap Curve (Enron)
EIA Forecast (AEO 2001)
November 2000
Source: Enron and EIA
Environmental Energy Technologies Division • Energy Analysis Department
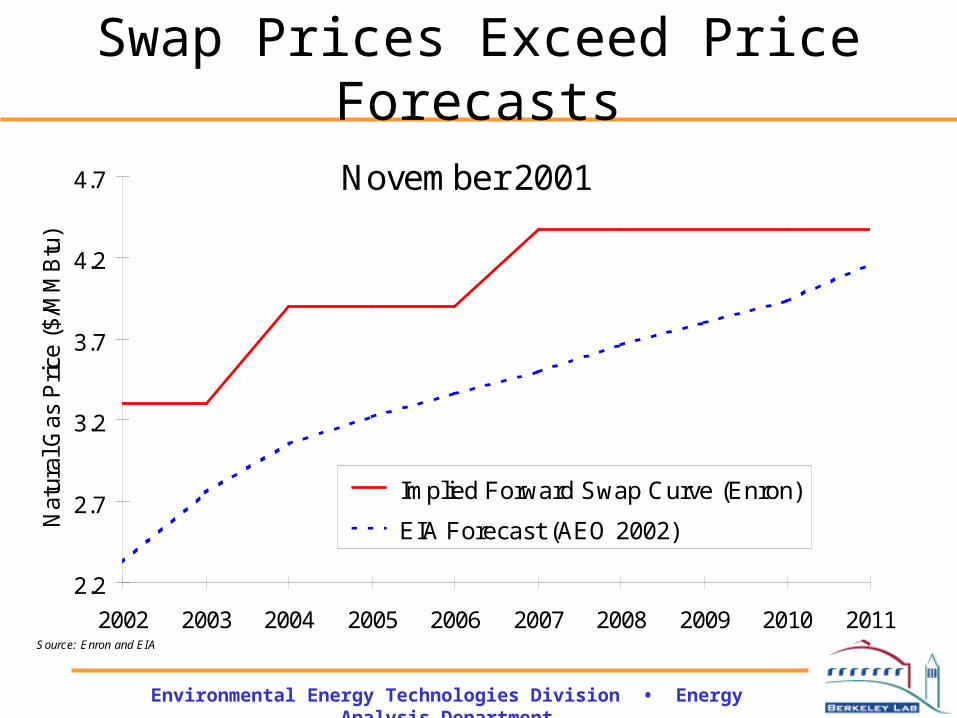
Swap Prices Exceed Price Forecasts
2.2
2.7
3.2
3.7
4.2
4.7
2002 2003 2004 2005 2006 2007 2008 2009 2010 2011
Nat
ural
Gas
Pri
ce (
$/M
MB
tu)
Implied Forward Swap Curve (Enron)
EIA Forecast (AEO 2002)
November 2001
Source: Enron and EIA
Environmental Energy Technologies Division • Energy Analysis Department
Futures Prices Exceed Price Forecasts
3.0
3.2
3.4
3.6
3.8
4.0
2003 2004 2005 2006 2007 2008
Nat
ural
Gas
Pri
ce (
$/M
MB
tu)
NYMEX Futures Price (Annual Average)
EIA Forecast (AEO 2003)
Source: NYMEX and EIA
November 2002
Environmental Energy Technologies Division • Energy Analysis Department
Physical Prices Exceed Price Forecasts
3.0
3.2
3.4
3.6
3.8
4.0
4.2
4.4
4.6
2004 2005 2006 2007 2008 2009 2010
Nat
ural
Gas
Pri
ce (
$/M
MB
tu)
Williams/DWR Physical Supply Contract
EIA Forecast (AEO 2003)
Source: Williams and EIA
November 2002
Environmental Energy Technologies Division • Energy Analysis Department
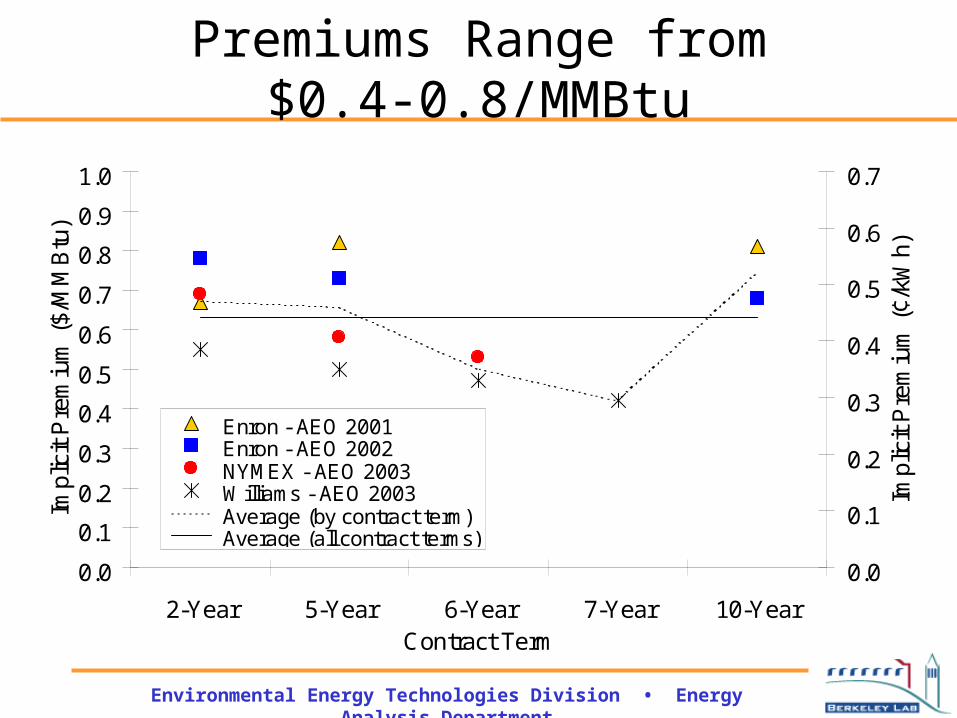
Premiums Range from $0.4-0.8/MMBtu
0.0
0.1
0.2
0.3
0.4
0.5
0.6
0.7
0.8
0.9
1.0
2-Year 5-Year 6-Year 7-Year 10-YearContract Term
Impl
icit
Pre
miu
m (
$/M
MB
tu)
0.0
0.1
0.2
0.3
0.4
0.5
0.6
0.7
Impl
icit
Pre
miu
m (
¢/kW
h)
Enron - AEO 2001 Enron - AEO 2002 NYMEX - AEO 2003 Williams - AEO 2003 Average (by contract term) Average (all contract terms)
Environmental Energy Technologies Division • Energy Analysis Department
Implications
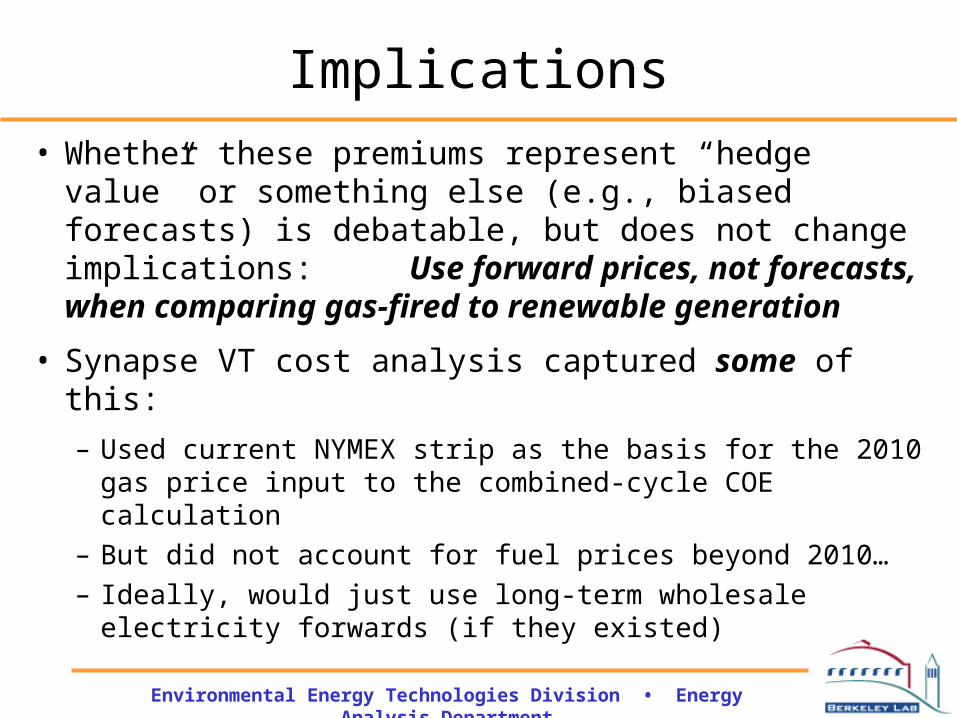
• Whether these premiums represent “hedge value” or something else (e.g., biased forecasts) is debatable, but does not change implications: Use forward prices, not forecasts, when comparing gas-fired to renewable generation
• Synapse VT cost analysis captured some of this:
– Used current NYMEX strip as the basis for the 2010 gas price input to the combined-cycle COE calculation
– But did not account for fuel prices beyond 2010…– Ideally, would just use long-term wholesale electricity
forwards (if they existed)
Environmental Energy Technologies Division • Energy Analysis Department
Potential Benefits of an RPS
• Mitigates Fuel Price Risk• Reduces Natural Gas Prices
Environmental Compliance Risk• Promotes Local Economic Development
Environmental Energy Technologies Division • Energy Analysis Department
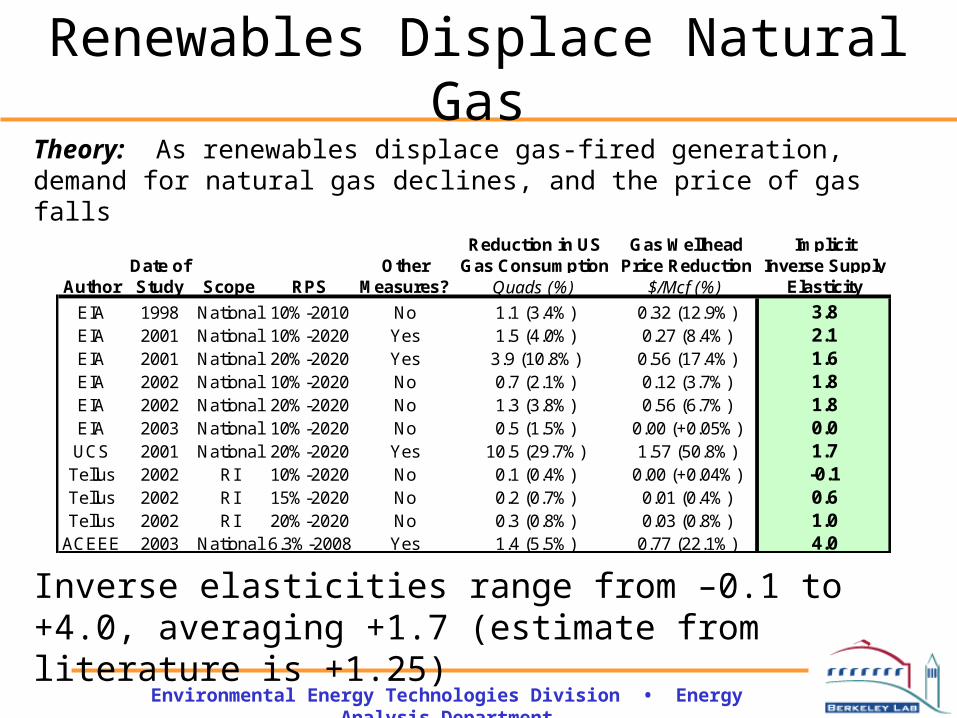
Renewables Displace Natural Gas
Theory: As renewables displace gas-fired generation, demand for natural gas declines, and the price of gas falls
Inverse elasticities range from –0.1 to +4.0, averaging +1.7 (estimate from literature is +1.25)
Reduction in US Gas Wellhead ImplicitDate of Other Gas Consumption Price Reduction Inverse Supply
Author Study Scope RPS Measures? Quads (%) $/Mcf (%) Elasticity
EIA 1998 National 10%-2010 No 1.1 (3.4%) 0.32 (12.9%) 3.8EIA 2001 National 10%-2020 Yes 1.5 (4.0%) 0.27 (8.4%) 2.1EIA 2001 National 20%-2020 Yes 3.9 (10.8%) 0.56 (17.4%) 1.6EIA 2002 National 10%-2020 No 0.7 (2.1%) 0.12 (3.7%) 1.8EIA 2002 National 20%-2020 No 1.3 (3.8%) 0.56 (6.7%) 1.8EIA 2003 National 10%-2020 No 0.5 (1.5%) 0.00 (+0.05%) 0.0UCS 2001 National 20%-2020 Yes 10.5 (29.7%) 1.57 (50.8%) 1.7
Tellus 2002 RI 10%-2020 No 0.1 (0.4%) 0.00 (+0.04%) -0.1Tellus 2002 RI 15%-2020 No 0.2 (0.7%) 0.01 (0.4%) 0.6Tellus 2002 RI 20%-2020 No 0.3 (0.8%) 0.03 (0.8%) 1.0
ACEEE 2003 National 6.3%-2008 Yes 1.4 (5.5%) 0.77 (22.1%) 4.0
Environmental Energy Technologies Division • Energy Analysis Department
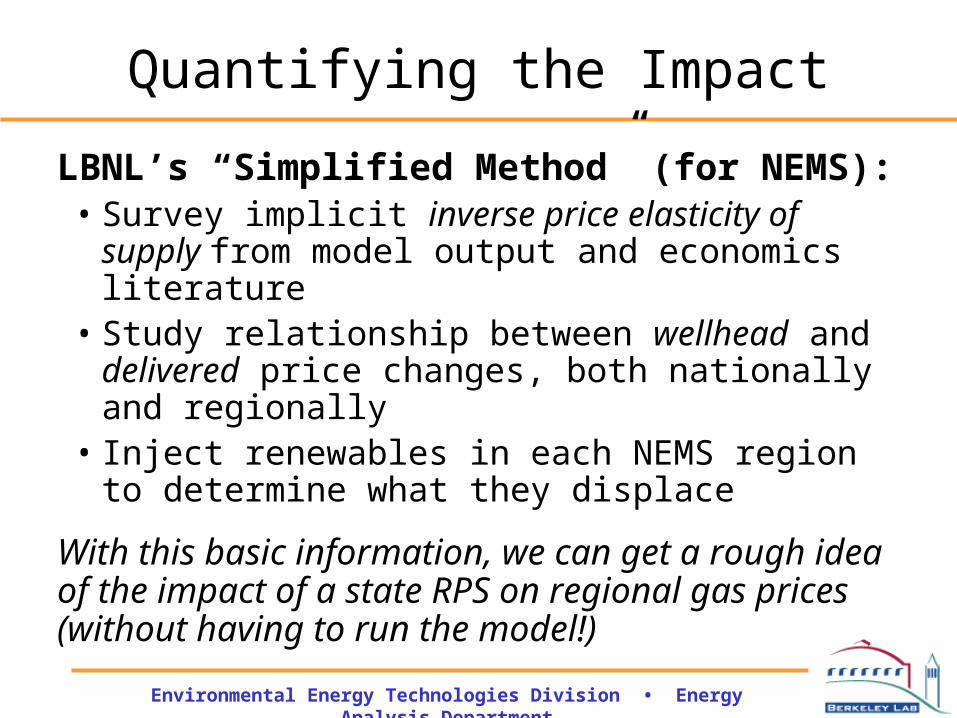
from model output and economics literature• Study relationship between wellhead and
delivered price changes, both nationally and regionally
• Inject renewables in each NEMS region to determine what they displace
With this basic information, we can get a rough idea of the impact of a state RPS on regional gas prices (without having to run the model!)
Environmental Energy Technologies Division • Energy Analysis Department
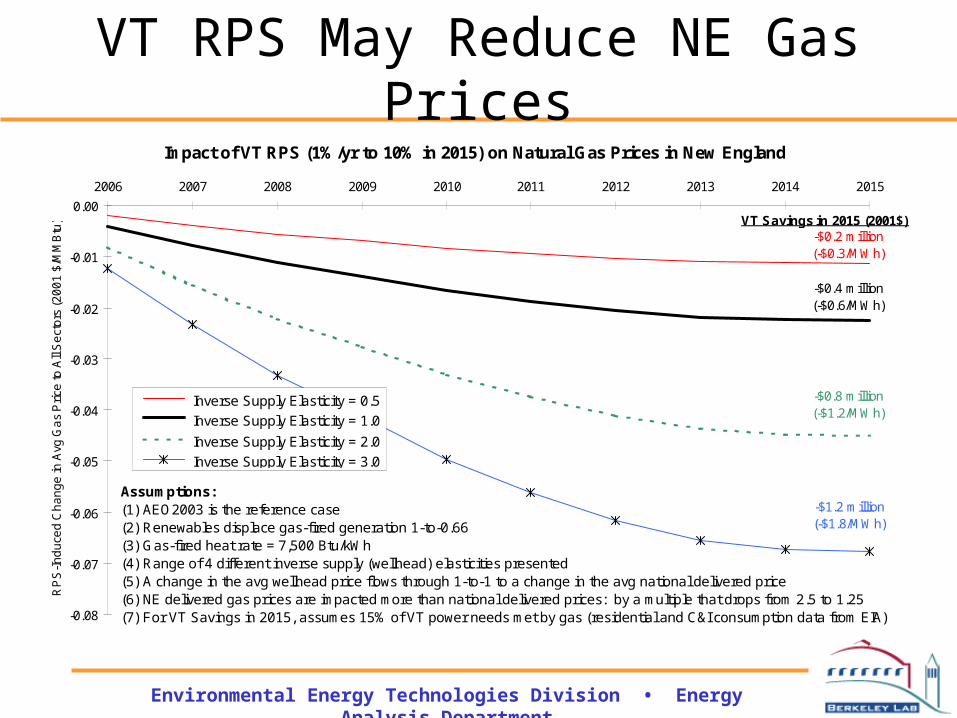
VT RPS May Reduce NE Gas PricesImpact of VT RPS (1%/yr to 10% in 2015) on Natural Gas Prices in New England
-0.08
-0.07
-0.06
-0.05
-0.04
-0.03
-0.02
-0.01
0.00
2006 2007 2008 2009 2010 2011 2012 2013 2014 2015
RP
S-I
nd
uce
d C
ha
ng
e in
Avg
Ga
s P
rice
to A
ll S
ect
ors
(2
00
1 $
/MM
Btu
)
Inverse Supply Elasticity = 0.5
Inverse Supply Elasticity = 1.0
Inverse Supply Elasticity = 2.0
Inverse Supply Elasticity = 3.0
Assumptions:(1) AEO2003 is the reference case(2) Renewables displace gas-fired generation 1-to-0.66(3) Gas-fired heat rate = 7,500 Btu/kWh(4) Range of 4 different inverse supply (wellhead) elasticities presented(5) A change in the avg wellhead price flows through 1-to-1 to a change in the avg national delivered price(6) NE delivered gas prices are impacted more than national delivered prices: by a multiple that drops from 2.5 to 1.25(7) For VT Savings in 2015, assumes 15% of VT power needs met by gas (residential and C&I consumption data from EIA)
-$0.2 million(-$0.3/MWh)
-$0.4 million(-$0.6/MWh)
-$0.8 million(-$1.2/MWh)
-$1.2 million(-$1.8/MWh)
VT Savings in 2015 (2001$):
Environmental Energy Technologies Division • Energy Analysis Department
Potential Benefits of an RPS
• Mitigates Fuel Price Risk• Reduces Natural Gas Prices
Environmental Compliance Risk• Promotes Local Economic Development
Environmental Energy Technologies Division • Energy Analysis Department
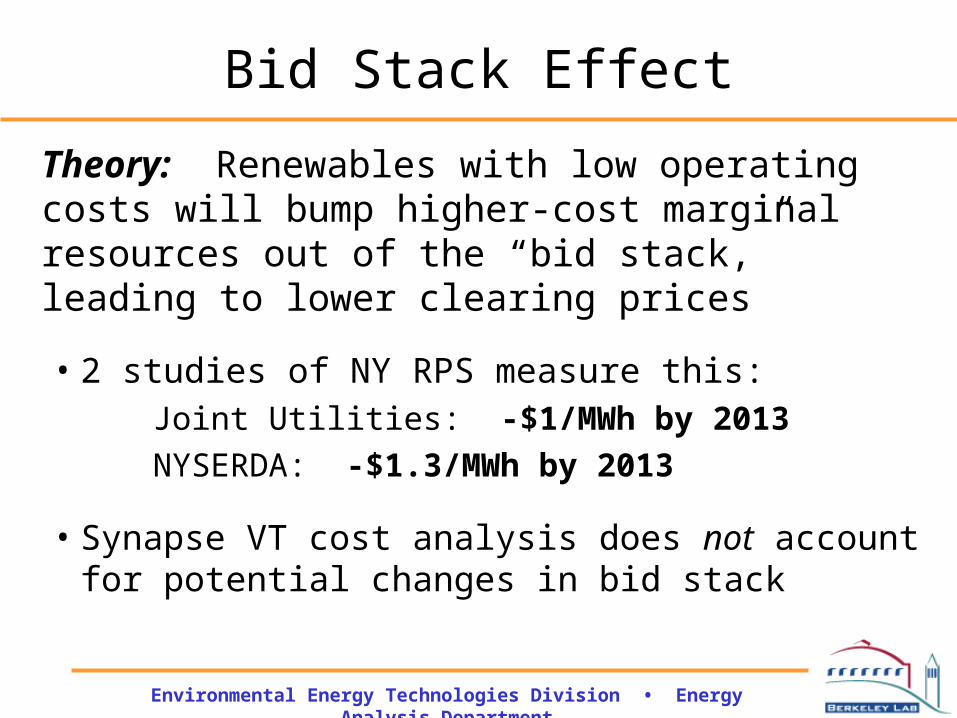
Bid Stack Effect
Theory: Renewables with low operating costs will bump higher-cost marginal resources out of the “bid stack,” leading to lower clearing prices
• 2 studies of NY RPS measure this: Joint Utilities: -$1/MWh by 2013
NYSERDA: -$1.3/MWh by 2013
• Synapse VT cost analysis does not account for potential changes in bid stack
Environmental Energy Technologies Division • Energy Analysis Department
Environmental (Air Quality)
“Cap and trade” programs for SO2 and NOX cloud the picture:• Emissions displaced by renewables may simply be “added”
elsewhere (to get back to the cap)
• While total emissions may therefore remain at the cap, the cost of compliance should be lower
Also reduces risk of future envtl regs (e.g., carbon tax)!
State: MA RI NY NYStudy: La Capra/SEA Tellus ICF/Joint Utilities NYSERDARPS: +4% by 2009 +13.4% by 2020 +8% by 2013 +7.5% by 2013
CO2 (million tons/year) -2.6 -0.6 -1.5 to -1.8 -5.9
SO2 (thousand tons/year) -7.9 not measured +0.5 -14.0
NOX (thousand tons/year) -1.2 not measured +0.4 to -2.3 -8.0Mercury (tons/year) not measured not measured 0 not measured
Environmental Energy Technologies Division • Energy Analysis Department
Economic Development
• Synapse NY study (for RETEC) provides a good survey of the literature; REV has its own VT-specific analysis
• Note: Most economic development studies to date pertain to wind development, but Synapse VT RPS analysis shows biomass and hydro may dominate…applicability?
Environmental Energy Technologies Division • Energy Analysis Department
References
• La Capra, Sustainable Energy Advantage (SEA). 2000. Massachusetts Renewable Portfolio Standard Cost Analysis Report.
• ICF Consulting (for Joint Utilities). 2003. Report of Initial Analysis of Proposed New York RPS.
• NYSDPS, NYSERDA, SEA, La Capra. 2003. New York Renewable Portfolio Standard Cost Study Report.
• Synapse (for RETEC). 2003. Cleaner Air, Fuel Diversity, and High-Quality Jobs: Reviewing Selected Potential Benefits of an RPS in New York State.
• ACEEE (with EEA). 2003. Impacts of Energy Efficiency and Renewable Energy on Natural Gas Markets.
• LBNL. 2003. Accounting for Fuel Price Risk: Using Forward Natural Gas Prices Instead of Gas Price Forecasts to Compare Renewable to Natural Gas-Fired Generation
• Tellus. 2002. Modeling Analysis: Renewable Portfolio Standards for the Rhode Island GHG Action Plan.