Potential Drinking Water Effects of Bromide Discharges from Coal-Fired Electric Power Plants Jeanne M VanBriesen, Ph.D., P.E. 1.0 Introduction Production of wastewater containing bromide is associated with fossil fuel extraction and utilization (i.e., oil and gas production and coal-fired steam electric power plants). When discharged to receiving water, these wastewaters can increase bromide concentrations in surface waters that are used as potable drinking water supplies. The presence of bromide in source waters significantly increases the formation of carcinogenic disinfection by-products (DBPs) in finished drinking water, increasing the population’s exposure to these by-products. Bromide concentrations in surface waters in the United States have typically been quite low, with average values inland ranging from 0.014-0.2 mg/L. Furthermore, bromide has a relatively high human toxicity threshold, and ecotoxicity is observed only at high concentrations. Thus, the discharge of bromide has been left largely unregulated in the United States. While naturally occurring bromide poses low risk to humans, anthropogenic brominated organic compounds are well known to exhibit significant ecotoxicity and to be associated with negative endocrine, reproductive, and carcinogenic outcomes in humans upon consumption or inhalation. Many brominated organics are used in industrial and consumer products in ways designed to limit human exposure (e.g., brominated flame retardants are applied to foam inside furniture). However, incidental production of brominated organics can occur in treating drinking water, and these compounds persist in the finished water that is consumed. Brominated disinfection by- products form when source waters containing bromide are disinfected with chemical oxidants (e.g., chlorine, ozone). During the disinfection, bromide is oxidized to form bromine, which then reacts with naturally occurring organic matter present in the source water. Because brominated DBPs have higher health risks than chlorinated DBPs that form in drinking water, the presence of bromide in source waters increases the risk associated with exposure (through consumption, inhalation and contact) to chlorinated drinking water. Thus, while bromide discharges to surface waters are unlikely to have direct health or ecological impacts, they have significant potential to affect downstream water users through drinking water treatment processes that convert bromide to brominated organics of concern. In addition to current bromide discharges associated with coal-fired steam electric power plants, altered treatment processes designed to control sulfur dioxide and airborne mercury emissions may change the concentrations of bromide in permitted discharges. Higher bromide loads to surface water systems have the potential to affect downstream drinking water plants, causing higher bromide concentrations, as well as more bromination, of disinfection by-products that pose a risk to consumers of treated drinking water. Understanding the potential role of bromide discharges on downstream drinking water sources requires a fundamental understanding of the sources of bromide, the fate of bromide in coal-fired power plant wastewaters, the effect of bromide on drinking water treatment, and the potential chemical changes in these natural and engineered systems. 1
Transcript
Potential Drinking Water Effects of Bromide Discharges from Coal-Fired Electric Power Plants
Jeanne M VanBriesen, Ph.D., P.E.
1.0 Introduction Production of wastewater containing bromide is associated with fossil fuel extraction and utilization (i.e., oil and gas production and coal-fired steam electric power plants). When discharged to receiving water, these wastewaters can increase bromide concentrations in surface waters that are used as potable drinking water supplies. The presence of bromide in source waters significantly increases the formation of carcinogenic disinfection by-products (DBPs) in finished drinking water, increasing the population’s exposure to these by-products. Bromide concentrations in surface waters in the United States have typically been quite low, with average values inland ranging from 0.014-0.2 mg/L. Furthermore, bromide has a relatively high human toxicity threshold, and ecotoxicity is observed only at high concentrations. Thus, the discharge of bromide has been left largely unregulated in the United States. While naturally occurring bromide poses low risk to humans, anthropogenic brominated organic compounds are well known to exhibit significant ecotoxicity and to be associated with negative endocrine, reproductive, and carcinogenic outcomes in humans upon consumption or inhalation.
Many brominated organics are used in industrial and consumer products in ways designed to limit human exposure (e.g., brominated flame retardants are applied to foam inside furniture). However, incidental production of brominated organics can occur in treating drinking water, and these compounds persist in the finished water that is consumed. Brominated disinfection by-products form when source waters containing bromide are disinfected with chemical oxidants (e.g., chlorine, ozone). During the disinfection, bromide is oxidized to form bromine, which then reacts with naturally occurring organic matter present in the source water. Because brominated DBPs have higher health risks than chlorinated DBPs that form in drinking water, the presence of bromide in source waters increases the risk associated with exposure (through consumption, inhalation and contact) to chlorinated drinking water. Thus, while bromide discharges to surface waters are unlikely to have direct health or ecological impacts, they have significant potential to affect downstream water users through drinking water treatment processes that convert bromide to brominated organics of concern.
In addition to current bromide discharges associated with coal-fired steam electric power plants, altered treatment processes designed to control sulfur dioxide and airborne mercury emissions may change the concentrations of bromide in permitted discharges. Higher bromide loads to surface water systems have the potential to affect downstream drinking water plants, causing higher bromide concentrations, as well as more bromination, of disinfection by-products that pose a risk to consumers of treated drinking water.
Understanding the potential role of bromide discharges on downstream drinking water sources requires a fundamental understanding of the sources of bromide, the fate of bromide in coal-fired power plant wastewaters, the effect of bromide on drinking water treatment, and the potential chemical changes in these natural and engineered systems.
1
2.0 Background 2.1 Bromine Chemistry Bromine is element number 35 on the periodic table, in the family with other halogens (e.g., chlorine, fluorine). Bromine is a liquid at standard temperature (0oC), and readily volatilizes at room temperature to a red vapor with an unpleasant odor. The vapor and liquid are irritants and oxidants. Bromine is soluble in water, and hydrolizes (reacts with water) to form hypobromous acid (HOBr), with disinfection properties similar to hypochlorous acid (HOCl, or bleach). HOBr is more stable in higher temperature waters, accounting for its preferential use as a disinfectant in hot water applications (e.g., hot tubs, cooling towers). The ionic form, bromide, Br-, is generally found in a variety of salts (e.g., CaBr2, NaBr) and is highly soluble in water. Bromide salts are more soluble than chloride salts, thus evaporation-induced precipitation produces solids that are enriched in chloride and residual brines that are enriched in bromide. These differences between bromine and chlorine account for differences in the relative concentration of these ions in minerals (e.g., mined salt, coal) and in production brines (from saline aquifers or oil and gas development). Bromine is easily incorporated into organic compounds, and most bromine is bound to organic carbon in natural systems (Leri and Myneni 2012). Like chlorine, bromine is extensively used in chemical and industrial applications. It is produced for these uses by extraction from seawater or naturally-occurring brines (Hirayama 2008; Vainikka and Hupa 2012), using either the blowing out or steaming out methods, as originally developed by Dow Chemical Company (Stewart 1934; ACS 1997). 2.2 Naturally Occurring Bromide Natural levels of bromide are low in the environment, except in sources associated with fossil fuels. Bromide is a trace element in the earth’s crust, with typical concentrations less than 6 mg/kg (Bowen 1966; Bowen 1979), except in shales, which can have bromide concentrations up to 24 mg/kg. Bromide is a trace element in seawater, with a concentration of 66-68 mg/L, which is about 300 times lower than the typical concentration of chloride. Coastal groundwater and soils, due to the intrusion of seawater, have higher bromide concentrations (up to 2.3 mg/L in groundwater and as high as 850 mg/kg in soil) than inland locations. Davis et al. (Davis, Fabryka-Martin and Wolfsberg 2004) surveyed groundwaters in the U.S. and reported concentrations that varied from 0.0032 to 0.058 mg/L (median value 0.016 mg/L) in potable groundwater. Bromide is rarely observed at significant concentrations in fresh surface water systems (e.g., inland rivers and lakes in the U.S.); Bowen reports concentrations of 0.014-0.2 mg/L (Bowen 1966; Bowen 1979)1. Concentrations of bromide in rain, in the form of bromide ions, are typically below 0.01 mg/L (Flury and Papritz 1993), with slightly higher values in coastal areas due to seaborne aerosols. U.S. drinking water sources were characterized during the 1996 EPA Information Collection Rule (ICR) with bromide values reported as 0.095±0.132 mg/L (USEPA 2000). Significant regional variation was observed, with the highest values in Texas and Florida and lower values inland. Ground waters were associated with higher bromide concentrations, while surface waters were associated with lower values.
1 EPA 821-R-13-003 April 2013 indicates a range of naturally occurring bromide from “trace to 0.5mg/L in freshwater to 65 mg/L in seawater.” The low value is significantly above naturally occurring ranges for freshwaters and the high value is significantly lower than values reported in many naturally-occurring brines.
2
Bromide is naturally present in fossil fuels, most notably in coal. Coals vary in the concentration of bromide present (USGS 2006), and coal-associated wastewaters are also highly variable. Acidic mine drainage from former coal extraction activities is quite low in bromide, reported as 0.108±0.137 mg/L in Pennsylvania (Cravotta 2008). Currently operating mines (data also for PA) indicate a range of bromide levels in mine pools (25±24 mg/L)(Schwartz 2010a; Schwartz 2010b). Coal bed methane operations also generate a wastewater where chemistry is determined by the coal characteristics. In the western United States, coal bed methane wastewaters are reported at 0.41±1.50 mg/L bromide (Rice, Ellis and Bullock 2000; Rice 2003; Dahm, Guerra, Xu and Drewes 2011). Coal-fired power plant effluent bromide concentrations are also variable [e.g.(USEPA 2009; Frank 2011)]. Additional details related to effluent bromide concentrations for power plant-associated wastewaters are provided in section 3.3 below.
Bromide is also present in organic-rich shale, and as a result, it is present in produced water associated with extraction of oil and gas from shale formations. The presence of bromide in oil and gas brines has been exploited in the past for commercial development (Collins 1970; Kogel, Trivedi, Barker and Krukowski 2006). Initial production of commercial bromide (and iodide) in the U.S. was pioneered by the Dow Chemical Company using oil field brines (Stewart 1934; ACS 1997). Concentrations of bromide in oil and gas produced waters shows significant variation. In Pennsylvania, for example, quite high levels are reported: conventional gas produced waters contain bromide at 1287±425 mg/L (Dresel and Rose 2010), while Marcellus shale produced water contains 1179±558 mg/L (Hayes 2009). Oil produced waters contain bromide as well; reported as 537.2±249.8 mg/L for Pennsylvania sites (Dresel and Rose 2010).
Figure 1 presents concentrations of bromide found in natural sources, including background waters, produced waters from oil and gas development, and wastewaters associated with coal mining and utilization. Note that the scale is log based, with natural waters several orders of magnitude lower in bromide than oil and gas associated wastewaters. The range of coal mine discharges (active and abandoned) of bromide is very similar to the range seen in natural waters. Coal-fired power plants contain higher levels of bromide than background waters, but lower levels than those in oil and gas produced waters.
3
Figure 1. Bromide concentrations (mg/L on log scale) in natural waters, oil and gas produced waters, and coal-related wastewaters. All oil and gas produced waters and coal-related wastewater data from Southwestern Pennsylvania (EPRI 2007; Cravotta 2008; Hayes 2009; Dresel and Rose 2010; Schwartz 2010a; Schwartz 2010b; Frank 2011; USEPA 2012) Natural water data from US sources (Harriss and Williams 1969; Hem 1985; Fuge 1988; USEPA 2000; Davis, Fabryka-Martin et al. 2004; Root, Jones, Schwartz and Gibbons 2004; Stanley 2009; Stanley, Churchill, Mobley and Coffman 2010). Figure is from (Wilson, Wang and VanBriesen 2013).
2.3 Anthropogenic Sources of Bromide Historical anthropogenic sources of bromide include potassium mining, emissions from an anti-knock additive in leaded gasoline (1,2, dibromoethane, also called ethylene dibromide (EDB)), and pesticides used in agriculture (e.g., methyl bromide, 1,2, dibromo-3-chloro propane) (Norberg-Bohm, Yanowitz and Prince 1988; Flury and Papritz 1993). EDB was implicated in bromide loading from urban runoff, but its use was phased out with the removal of lead in gasoline (Sollars, Peter and Perry 1982). The pesticide, methyl bromide, is an ozone-depleting chemical, and its use was phased out under the Montreal Protocol (Taylor 1994). Trace bromide amounts in fertilizers and some deicing agents can contribute bromide to the environment as well. Road salt is generally low in bromide (Corsi, Graczyk, Geis, Booth and Richards 2010); and its bromide:chloride ratio is significantly below that in seawater. Bromide is currently used in flame retardants (de Wit 2002), drilling fluids as stabilizers for deep wells (USGS 2011), pesticides (Wegman, Hamaker and Deheer 1983), dyes, and pharmaceuticals. Bromide can also
4
be used as a non-reactive tracer in environmental studies [see for example: (Constantz, Cox and Su 2003; Watzlaf, Schroeder, Kleinmann, Kaires and Nairn 2004)].
2.4 Environmental and Human Health Concerns Associated with Bromide in the Environment Bromide has been used medicinally for more than 100 years, and its low human toxicity is well established (see review by (Vanleeuwen and Sangster 1987)). Chronic toxicity effects on the endocrine and reproductive systems in animals have been observed at high doses, while acute toxicity is very rare in humans. Several Acceptable Daily Intake (ADI) values have been suggested, including 0.1 mg/kg (Vanleeuwen, Dentonkelaar and Vanlogten 1983) and 1.0 mg/kg (WHO 2009). The World Health Organization recommends less than 6 mg/L for adults and 2 mg/L for children in drinking water; values unlikely to be encountered in treated freshwaters used for drinking in developed countries. Bromide is found naturally in human food and animal feedstocks; it can also be found at higher levels in foods treated with the pesticide, methyl bromide (Winteringham, Harrison, Bridges and Bridges 1955). Ecotoxicity of bromide is also low with impaired growth of evaluated organisms found only at high bromide concentrations (>2 g Br/L for microorganisms and >2.5-7.8 g/L for fish) (Flury and Papritz 1993). A critical acceptable maximum concentration for water based on the ecotoxicology effects of 1.0 g Br/L has been proposed (Canton, Wester and Mathijssen-Spiekman 1983). The ecotoxicity of brominated organic compounds and their potential impacts on human health are much more significant. For example, brominated flame retardants have been widely studied for ecotoxicity (de Wit 2002; Wollenberger, Dinan and Breitholtz 2005; Debenest, Gagne, Petit, Andre, Kohli and Blaise 2010) and human health impacts (Helleday, Tuominen, Bergman and Jenssen 1999; Darnerud, Eriksen, Johannesson, Larsen and Viluksela 2001; Birnbaum and Staskal 2004). Chlorination of wastewater creates chlorinated and brominated organic compounds that are of concern when released into the environment (Chen, Nam, Westerhoff, Krasner and Amy 2009; Krasner, Westerhoff, Chen, Rittmann, Nam and Amy 2009). Human exposure to brominated organics can occur through treated drinking water when source waters contain elevated bromide (Krasner, McGuire, Jacangelo, Patania, Reagan and Aieta 1989; Symons, Krasner, Simms and Sclimenti 1993). When water containing bromide is disinfected, the bromide is oxidized to form bromine, which then reacts with organic matter to form brominated organics, commonly called disinfection by-products (DBPs) (Singer 1994; Singer 2004). Negative human health outcomes, including cancer and reproductive and endocrine system problems are well documented for chlorinated and brominated compounds, including the halogenated organics that form in drinking water treatment (Reif, Hatch, Bracken, Holmes, Schwetz and Singer 1996; Darnerud, Eriksen et al. 2001; Kogevinas and Villanueva 2011). More information on the role of bromide in disinfection by-product formation in drinking water is presented in section 4 below. 2.5 Role of fossil fuel activities in recent changes in bromide concentrations in surface waters It is very difficult to evaluate changes in bromide concentrations in the surface waters of the United States. Bromide is rarely monitored in routine water quality testing. One source of historical data is the 1996 EPA Information Collection Rule, which required large drinking water utilities in the United States to measure source water characteristics and finished water disinfection by-products over a period of a year. Data from this source are shown in Figure 1 at
5
the far left. As noted above, these data suggest source water levels of 0.095±0.132 mg/L for 1995-1996 in the U.S. (USEPA 2000); however, the data are not normally distributed, as evidenced by the significant outliers in the distribution shown. Several researchers have investigated the distribution of bromide in source waters, and have found that ground waters tend to have higher bromide levels than surface waters. Francis et al. (Francis, Vanbriesen and Small 2010) identified two groups of waters within the ICR data: low organic carbon/higher bromide ground waters, and high organic carbon/low bromide surface waters. Thus, we expect inland surface waters to be in the lower range of the ICR data, with values below 0.1 mg/L generally. Recently, some inland surface water treatment plants have reported increased difficulty meeting regulatory limits on disinfection by-products (see detailed discussion of these products below), and have implicated increasing bromide concentrations in source waters as the cause (Handke 2009; Fiske, Oppenheimer, Moore and Everett 2011; States, Cyprych, Stoner, Wydra, Kuchta, Monnell and Casson 2013; Wilson, Wang et al. 2013). Bromide data from these studies could be compared with data from the 1996 ICR to evaluate the relative increase of bromide concentrations (and, separately, bromide loads) within these specific basins. States et al. (2013) sampled background locations, upstream of any anthropogenic inputs (from below detection to 52µg/L), and compared these results with values at the drinking water intake (25-299 µg/L from 2010-2011). They also sampled upstream and downstream of all putative bromide sources, including coal-fired power plants, industrial sites, and brine treatment plants. The bulk of the bromide load to the Allegheny River came from the discharge of oil and gas wastewater at brine treatment plants after utilizing treatment processes that do not remove bromide. However, they also observed increases (up to ninefold) in concentrations of bromide downstream of two coal-fired power plants, “suggesting periodic releases of bromide from these facilities.” States et al. (2013) suggest these bromide releases may be from seasonal use of brominated antifouling compounds in the cooling towers; however, they did not have any information on the use of FGD scrubbers at these facilities. Wilson et al. (2013) did not identify specific sources associated with increased bromide concentrations; however, several power plants on the Monongahela did add FGD scrubbers for sulfur dioxide control within the past decade. Ongoing studies by the West Virginia Water Research Institute in the Allegheny, Monongahela and Ohio rivers includes bromide with a suite of water quality parameters (detection limit 0.13 mg/L). Data are available online; however, no specific links to sources have been assessed (Ziemkiewicz 2013). Thus, while it is difficult to attribute increasing bromide concentrations to specific activities, these studies do highlight the sensitivity of surface waters used as drinking water sources to even small increases in bromide loads, especially during low flow conditions when dilution is at a minimum. The impact of these small bromide increases on drinking water treatment will be discussed in sections 4 and 5 below.
6
3.0 Bromide and Coal-Fired Power Plants Halogens (Cl, Br, I) are trace elements in coal, as mentioned above. Halogen-based disinfectants can also be found in various cleaning agents and anti-foulants used at power plants. Further, bromide addition, or the use of brominated sorbents, is a well-known application for mercury control in plants with flue-gas desulfurization units. The fate of these halogens in coal-fired power plants depends significantly on process controls, most notably pollution control systems designed to remove sulfur dioxide from flue gas emissions. 3.1 Bromide in Coal As noted above, bromide is present in coal at trace levels (<0.001 %). Bromide is likely associated with the organic fraction of the coal; however, association with clay minerals and iron oxides has also been reported (Swaine 1990). Coals vary in the concentration of bromide present (USGS 2006), with bituminous coals exceeding subbituminous and lignite. Halogen content is generally controlled by a source’s surrounding geochemistry, and thus, deeper mined coals generally contain more halogen salts (Bragg, Finkelman and Tewalt 1991). Details of bromide concentrations for U.S. coals are available in the U.S. Geological Survey Coal Quality (COALQUAL) Database (see http://energy.er.usgs.gov/products/databases/CoalQual/ ). For example, West Virginia coals generally contain 20-40 ppm bromide (µ=23.88, σ=11.47) with low bromide in Pittsburgh and Redstone coal and highest bromide in Sewell Coal (>50 ppm). The USGS also maintains a World Coal Quality Inventory (see http://energy.usgs.gov/Coal.aspx). While many analyses have been generated from these databases and trace metals are routinely measured in coal samples, halogen data are less available [see for example:(Tewalt, Willett and Finkelman 2005; Hatch, Bullock and Finkelman 2006)]. Studies specifically focused on mercury removal (see below) have included careful analysis of bromide and chloride concentrations in coal, as this ratio (Br/Cl) affects mercury removal efficiency. An analysis by Kolker et al. (Kolker, Quick, Senior and Belkin 2012) indicates that most coal-bromide concentrations are below 50ppm, while chloride concentrations are typically below 2000 ppm; an average Br/Cl ratio of 0.02 is reported. 3.2 Coal Combustion and Halogens Chloride (Cl-) and bromide (Br-) ions present in the coal or added prior to combustion are reduced to chlorine (Cl2(g)) and bromine (Br2(g)) through reaction with oxygen at high temperatures during the combustion process. This converts the very soluble ions to gases, thus affecting their fate in the system. Chlorine that is formed in this process can be reduced back to chloride through a reaction with SO2, a reaction that is largely controlled by the concentration of SO2. Bromine is less susceptible to this reaction in the furnace; however, some bromine can be consumed in a similar reaction with SO2 that can take place at low temperature in wet flue gas desulfurization (FGD) systems. Bromine and chlorine are strong oxidants that react with other reduced elements present in the coal, most notably mercury (Hg0). Bromine and chlorine can oxidize mercury to Hg2+, while being reduced themselves back to ionic form (Cl- and Br-). Again, this reaction alters the fate of the Cl and Br. The ionic forms are highly soluble, while the gas phase forms otherwise exit in the flue gases. Thus, the chemistry of oxidation and reduction reactions that take place in the
furnace and in various pollution control units will control the mode of release of chloride and bromide originally present in the coal.
3.3. Fate of Bromide from Coal in Power Plant Residuals Coal combustion produces multiple residual streams, including: bottom ash, fly ash, gypsum, and flue gases. In general, after combustion, 99% of the halogens originally in ionic form in the coal are found as gaseous forms (chlorine, bromine) in flue gas (Klein, Andren, Carter, Emery, Feldman, Fulkerson, Lyon, Ogle, Talmi, VanHook and Bolton 1975; Germani and Zoller 1988). Bottom ash and associated wastewaters from its wet handling do not contain significant halogen residuals. However, the installation of pollution control units for flue gas alters the chemistry of halogens and their ultimate fate in the system. Flue gas desulfurization (FGD) systems are designed to convert gaseous SO2 to the soluble acid, H2SO4. Although the chemistry is more complex, and affected by the presence of metals (including Hg), the process has a similar effect on halogens, converting gaseous Cl2 and Br2 to their soluble ionic forms (Cl- and Br-). The result of this shift from gas to soluble phase is the capture of chlorine and bromine as chloride and bromide in the FGD wastewater rather than the release of the gases in the stack. A number of researchers have reported that wet and dry flue gas desulfurization (FGD) systems remove halogens in coal from the stack gas, and wet systems transfer them to FGD wastewaters [e.g.(Clare and Sloss 1992; Sloss 1992; Srivastava, Hutson, Martin, Princiotta and Staudt 2006)]. Thus, the addition of wet FGD will increase discharges of bromide in soluble form (Br-) from power plants to the environment, unless FGD wastewater treatment incorporates bromide removal.
Wastewater characterization at coal-fired steam electric utilities has been undertaken by a variety of industry and regulatory groups. The Electric Power Research Institute (EPRI) released a characterization of residuals in 1987 that included FGD sludge. Chloride and fluoride were measured, but bromide was not (EPRI 1987). EPRI released guidance for wastewater characterization in 2007 that identified 10 sampling locations, including FGD blowdown water, but sampling for bromide was not included (EPRI 2007). Although the preliminary results for FGD wastewater characterization (EPRI 2006) did not include bromide, the recommendations made for future research suggested that bromide should be included. Characterization for metals and other anions is reported by a number of sources, but bromide data are scarce.
Wilson et al. (Wilson, Wang et al. 2013), citing data (EPRI 2007; Frank 2011) for Pennsylvania, report values in effluent streams (type not identified) as 89 ± 37mg/L, as shown in Figure 1 above. At a national level, EPRI conducted a number of studies for different locations associated with evaluation of co-management of low volume wastes with high volume coal combustion by-products. The data for this are provided in Table 1 below, with bromide concentrations ranging from below detection limits (<0.1 mg/L) to 118 mg/L, with higher values always associated with FGD wastewaters. EPA (USEPA 2009) evaluated waste streams from power plants and reported concentration ranges of 43-96 mg/L for flue-gas desulfurization units, and 180-260 mg/L for chemical precipitation systems.
The data in Table 1 suggest that FGD wastewaters contain higher bromide levels than most other wastewaters reported from these sites. Further, FGD wastewaters are reported to have higher bromide to chloride ratios than other power plant wastewaters and higher ratios than naturally occurring groundwaters (EPRI 2007). The results indicate “the FGD system adds both chloride
8
and bromide to the water, and the proportion of bromide to chloride added in the FGD system is greater than that added to the bottom ash and low-volume waste streams.”(EPRI 2007)
Specific plant studies have looked at the fate of trace elements in coal-fired power plants with different air quality control devices (Meij 1989; Meij 1991; Meij 1994). Results confirm that bromine is present in the vapor phase in the flue gas exiting the furnace (not in the bottom ash), prior to air quality control systems. For example, Zevenhoven and Kilpinen (Zevenhoven and Kilpinin 2002) report 95% removal of bromide in FGD, with most of the halogen products in the FGD wastewater.
While not a focus of the analysis in the current regulatory rule-making, bromide concentrations measured in the FGD wastewater screening study (EPRI 2006) were used in load calculations (Finseth 2009). Bromide was reported as 67,300µg/L (67.3 mg/L) in FGD wastewater, and this was used to calculate a small model plant load value of 51,700 lbs/year and a large model plant load value of 177,000 lbs/year. No settling pond data were evaluated. An evaluation of a different plant using chemical precipitation treatment reported a concentration of 225 mg/L bromide, leading to loads of 173,000 lbs/year for the small model plant and 592,000 lbs/year for the large model plant. While these data are quite limited, a reasonable conclusion from them is that power plant treatment systems do not remove bromide, but rather will discharge it in wastewater effluent, which may pose a problem for downstream drinking water plants (see Section 4 below). Table 1. Bromide Concentrations in Wastewater Effluent from Coal-Fired Power Plants in the U.S. (Most data from EPRI’s multi-year study of co-management of low volume wastes with high volume coal combustion by-products2).
Facility Type Wastewater Type Bromide Concentration (mg/L)
Boiler blow down <0.2 Ash pond waters <4, <2, <4 Impoundment water 0.19, 0.14, 0.17, 0.14
2 This study was not focused specifically on all liquid wastewater streams from power plants, and thus, most sites did not analyze cooling waters or cooling tower blowdown. Many sites did not have FGD systems or treat and manage FGD waste streams.
9
Bottom Ash Settling Tank 0.75, <1.0 Power Plant Midwestern US
FGD Decantate 78, 69, 74 (EPRI 2000)
Power Plant South Central US (lignite)
Chemical waste treatment basin
<1.0, <0.1 (EPRI 2007)
Solid Waste Disposal Area Runoff Pond and moisturizing water
Power Plant SW PA Blowdown Effluent Average: 2.67 Maximum: 3.57
Permit Data Review
Desilting Basin Average: 2.763 Maximum: 3.040
Power Plant SW PA Blowdown Effluent <2.5 Power Plant SW PA Blowdown Effluent Average: 1.223
Maximum: 1.720 Power Plant SW PA (bromide addition trial)
FGD Supernatent Baseline 109,113,113,114,96.4,125 (Frank 2011) FGD Supernatent Test Side 243,395,519,575,450,461 Outfalls 135,114,105,107,121,228,133,
114,105,107,123,219 Power Plant FGD Purge Bromide 28.1±14.73 (68 data points
collected March 3, 2009 to July 30, 2009) raw data as follows: 16 17, 16,8.5,8.1,9.5,10,8.6,7.5, 8.8,15,18,18,14,16,19,14,13, 17,20,21,23,21,20,23,26,32, 40,59,67,52,40,26,23,26,24,
3.4 Bromide and Mercury Control The fate of mercury in coal-fired power plants is beyond the scope of this report. The reviewer is referred to several excellent sources for review of this issue [e.g. (Meij, Vredenbregt and teWinkel 2002; Wilcox, Rupp, Ying, Lim, Negreira, Kirchofer, Feng and Lee 2012)]. This section will deal only with the role of halogens, and specifically bromide, in mercury removal processes. High bromide coals have been known to improve mercury control at power plants that have flue gas desulfurization units for many years [see excellent overview by (Kolker, Quick et al. 2012)]. Average removal efficiencies of subbituminous and lignite coal are always lower than that of bituminous, likely due to halogen content. Elemental Hg is a nonreactive, insoluble gas that is generally released in the flue gas after coal combustion. Halogens, when present in their gaseous elemental forms, are highly reactive with Hg0, oxidizing it to form the ionic Hg2+, creating mercury-halogen salts (HgBr2, HgCl2), which are soluble, and therefore more easily captured in removal technologies. Chloride, which is abundant in coal, is an adequate oxidant when converted at high temperatures to chorine; however, as noted above, additional reactions with sulfate can deplete chlorine levels. Bromine is a much better oxidant than chlorine, and it does not react with sulfate readily in the furnace, and thus, it is more available for oxidation of mercury. However, bromide is present at much lower levels in most coals; the bromide to chloride ratio of 0.02 means bromide is present at 2% of the chloride levels, on average. The issue is further complicated by the rate of the reactions, which are temperature dependent, with low halogen concentrations requiring higher temperatures for similar removals (Wilcox, Rupp et al. 2012). As noted by Kolker et al. (Kolker, Quick et al. 2012), “the actual proportion of Hg that conventional Air Pollution Control Devices (APCDs) capture depends on the type of coal that is burned, the type and set of APCDs, the halogen content of the coal, and the flue gas temperature.”
The addition of chloride has been demonstrated to improve mercury removal (Zhuang, Thompson, Zygarlicke and Pavlish 2007); however, bromide reacts faster and is effective at lower concentrations (Liu, Yan, Liu, Qu, Wang, Chang and Miller 2007; Cao, Zhengyang, Zhu, Wang, Huang, Chiu, Parker, Chu and Pan 2008). High concentrations of salts increase corrosion in the FGD system, and thus, bromide is preferred since it can be added at lower concentrations. Finally, HgBr2 is more stable and less likely to convert back to Hg0. Thus, concentrations of halogens and sulfate are important for control of re-emission of mercury during FGD (Omine, Romero, Kikkawa, Wu and Eswaran 2012).
Bromine addition can take place at several points in the power plant: in the furnace (as bromine or bromide/chlorine) and in the flue gas prior to the FGD. Several patents exist for different bromine-addition technologies [For example: US 6,808,692 B2, Oct 26, 2004; US 6,878,358 B2, April 12, 2005]. Power plant pilot testing of bromide additions have been very successful for enhanced mercury removal [see for example: (Vosteen, Kanefke and Koser 2006; Benson,
11
Holmes et al. 2007; Berry, Dombrowski, Richardson, Chang, Borders and Vosteen 2007; Dombrowski, McDowell, Berry, Sibley, Chang and Vosteen 2008; GAO 2009)]. Research in this area has been similarly promising [see for example: [(Niksa and Fujiwara 2005; Eswaran and Stenger 2008). An alternative to direct bromide addition is the use of activated carbons (untreated, chlorinated or brominated) that oxidize and then sorb Hg onto the particle surface where downstream particle removal technologies capture these materials [See For example: US 6,953,494 B2, Oct 11, 2005]. Brominated activated carbons work better for this application (Chang, Dombrowski and Senior 2008; Krishnakumar, Naik, Niksa and Fujiwara 2013). However, use of activated carbon-based materials, which are captured in the fly ash rather than released in wastewaters, can reduce the resale value of the resultant fly ash (GAO 2009). The use of direct bromide addition, thus, is more likely based on its cost, its minimal effect on operations, and its non-negative impact on residuals sales (Fielding 2012).
When EPA promulgated the Clean Air Mercury Rule (CAMR) in 2006, which would have required mercury reductions of 70% by 2018, the agency stated that it expected significantly expanded use of bromide in coal plants (USEPA 2005; Mcilvaine 2013). The Mercury and Air Toxics Standard, which replaced CAMR, and requires mercury reductions of up to 90% by 2017, is also likely to promote bromide use in coal plants(USEPA 2012). Fielding (Fielding 2012) summarized the potential bromide demand associated with meeting targets for mercury control in coal-fired power plants by considering the volume of coal used, the average bromide in that coal, and the average bromide concentration needed for mercury removal; he reports 5,700-69,000 short tons of bromide would be needed annually. As Fielding notes, supply of this amount of bromide would not be a problem, as U.S. bromide capacity (via extraction from brines in the Smackover formation in Arkansas) is abundant. However, discharge of this additional bromide to surface waters could lead to significant challenge for downstream drinking water plants.
As detailed above (see Table 1), available data suggest FGD wastewaters contain significant bromide, while other wastewaters from coal-fired power plants are low in bromide. Based on existing knowledge of bromide fate in power plants with FGD systems, it seems very likely that any bromide added for mercury control will also be captured predominately in the FGD wastewater. For plants that do not operate FGD systems, added bromide is likely to end up where naturally-occurring bromide would (predominately in flue gas as bromine). Few full- scale tests of bromide additions have evaluated the fate of the added bromide. For example, Berry et al. (Berry, Dombrowski et al. 2007) report on a full-scale calcium bromide injection test at a power plant in Alabama, demonstrating significant mercury control. Only the source coal was measured for bromide; there was no evaluation of the concentration of bromide in any wastewater produced at the plant. Similarly, EPRI reports on a number of halogen addition tests, showing variable mercury removal, but does not discuss bromide fate (Vosteen, Chang, Rini, Berry and Dombrowski 2008). The U.S. DOE also conducted a series of studies, again focusing on mercury removal, where some analyses for bromide were conducted (Benson, Holmes et al. 2007). Lignite and PRB coal (both containing <10 µg/g bromide), were amended with various compounds, including bromide at different concentrations. Bromide was measured in fly ash (highest concentration reported at 6.98 µg/g) and the FGD liquor (highest concentration of 145 mg/L) and FGD solids (non-detectable). FGD liquor bromide concentrations increased with increasing bromide addition. However, the mass balance on bromide was missing 90% of the added bromide, calling into question the analytical methods in this study. A similar full-scale
12
addition test case included measurement of bromide before the FGD, providing insight into the fate of bromide in the absence of a FGD system (Dombrowski et al., 2008). The flue gas bromine concentration increased with increasing calcium bromide injection rate, as expected; without FGD, bromide is released as bromine in flue gas. However, the sum of bromine in the flue gas and the fly ash were below the theoretical levels predicted by mass balance. Thus, additional analysis to evaluate the fate of the injected bromide in the absence of FGD units is warranted. In 2011, a well-controlled performance trial of calcium bromide addition to coal at a plant with a wet FGD scrubber system was conducted in southwestern Pennsylvania (Frank 2011). To improve evaluation of the mass balance on bromide, sodium bromide addition in the cooling towers was discontinued ten days prior to the bromide addition evaluation. Bromide was measured in the FGD supernatant tanks prior to wastewater treatment. Baseline bromide in the effluent (prior to the trial) was 114 mg/L, while the maximum detected during the trial was 575mg/L. Outfall concentration maximums were 228 mg/L and 219 mg/L, below the maximum values reported for these outfalls in prior permit renewals. Bromide was detected at slightly increased levels in the fly ash, with an average concentration of 7.1 mg/kg. While this was a small trial at only a single plant, the data suggest approximately a four-fold increase in bromide concentration in FGD wastewater during calcium bromide addition for mercury control (from 112±9 mg/L to 441±115mg/L)(Frank 2011).
3.5 Bromide use as a biocide in power plant cooling towers Cooling towers create a concentrated wastewater (called blowdown) that typically reflects the original chemicals in the makeup water plus chemicals added for corrosion control or biological fouling control. While not the focus of the current analysis, the use of bromide in power plant cooling systems is discussed here to explain other, related sources of bromide in wastewater effluent. Bromine is used as a biocide, either alone or in conjuction with chlorine. Bromine (as HOBr) is generally more reactive than chlorine, and thus has stronger biocidal activity. Further, bromine appears to increase the rate of oxidation, leading to lower concentrations of oxidants in the effluent at discharge (Pinkey, Friday and Hochberg 1992). This is beneficial because discharging reactive disinfectant is detrimental to ecological health. Bromine can also be used at various stages in cooling water disinfection. For example, EPRI (EPRI 2007) report pre-treatment of lake water with sodium bromide and chlorine bleach to control iron and manganese and to manage biological growth prior to use for cooling water. The formation of disinfection by-products in cooling water has also been evaluated (EPRI 2004). Table 1 includes some data from cooling tower blowdown water, showing generally low bromide concentrations, on the order of a few milligrams/L.
4.0 Source Water Bromide and Drinking Water Disinfection By-Products As noted above, bromide released into the environment can raise the concentration of bromide in surface waters. While bromide itself is not a risk to humans or ecosystems at the concentrations likely to be observed in the downstream environment of power plant discharges, elevated bromide source waters can alter the chemistry in drinking water produced from these sources. This section provides an overview of the formation of disinfection by-products and the role of bromide in the risk associated with these drinking water contaminants. 4.1. Drinking Water Treatment Disinfection and Disinfection By-Product Formation
13
Drinking water treatment involves a series of steps to remove contaminants of concern from the source water to make it safe for human consumption. Coagulation, settling and filtration are designed to chemically alter some dissolved contaminants (reducing their solubility and forming precipitates) and then to remove naturally-occurring or chemically-produced particulates of concern. Particles that are too small to be removed through the physical processes of settling and filtration and that do not react in the chemical process of coagulation are subjected to further chemical treatment to render them harmless. This is generally done through chemical oxidation (using a disinfectant) that inactivates living organisms (e.g., bacteria and viruses) that make it through the prior treatment steps. Disinfection of drinking water is widely recognized as one of the major engineering accomplishments of the 20th century, reducing the rates of waterborne illness everywhere it is practiced. Disinfection techniques include ozonation, ultraviolet radiation (UV), and chlorine-based chemical processes. Chlorine is used extensively, as it not only provides a primary disinfectant to inactivate organisms in the water, but it also persists in water over the multiple days that water will travel in pipes to consumers, providing additional protection in case of microbial regrowth or re-entry into the pipe (called secondary disinfection). Ozone and UV methods do not provide this residual protection and thus are used as primary disinfectants only. In the U.S., the provision of a chemical residual disinfectant all the way to the consumer’s drinking water tap is required by law. In addition to their use as a disinfectant, oxidants are also used to control nuisance metals in drinking water (e.g., Fe, Mn). Thus, oxidation steps can occur several times during drinking water treatment. Pre-oxidation, which occurs before coagulation, settling, and filtration, is often used for metals control, as the reaction of the oxidant with the metal makes it less soluble and, thus, metals are removed in the physical settling and filtration processes. Disinfection-based oxidation usually occurs at the end of the treatment process, as microbes attached to particles that have not yet been removed can be resistant to destruction by oxidants. A typical treatment process for drinking water, showing locations where chlorine-based oxidants may be used is shown in Figure 2. The amount and type of disinfectant and/or oxidant added in each stage is specific to the water being treated and the drinking water treatment plant capabilities.
Figure 2. Schematic of Drinking Water Treatment Process with Oxidant/Disinfectant Addition Points Noted. While drinking water disinfection is a triumph of engineering to protect human health, it does have an unintended consequence. During disinfection, chlorine (typically applied as hypochlorous acid, HOCl) reacts with organics present in the source water (natural organic matter or NOM) to form chlorinated disinfection by-products (DBPs). If bromide is present, the
Coagulation and Settling
Addition of chemical coagulants, pH
adjustment, oxidant may be added
Filtration
Oxidant may be added during
cleaning of filter
Primary Disinfection
Distribution and Storage
Significant oxidant is used as a disinfectant
Additional oxidant is added for residual
maintenance. Additional oxidant may be added at
booster stations to maintain residual levels.
From
Sou
rce
wat
er
To C
onsu
mer
s
14
free chlorine rapidly oxidizes the bromide to hypobromous acid, which then, along with the residual hypochlorous acid, reacts with the organic matter to form brominated and mixed chlorinated-brominated DBPs. The generalized reaction below illustrates the formation of disinfection by-products using chlorine as a disinfectant.
Hundreds of different halogenated organic compounds form during drinking water treatment (Richardson 2003; Richardson, Thruston, Rav-Acha, Groisman, Popilevsky, Juraev, Glezer, McKague, Plewa and Wagner 2003; Singer 2004; Richardson and Ternes 2005), and a very limited subset have been well studied (Krasner, Weinberg, Richardson, Pastor, Chinn, Sclimenti, DOnstad and Thruston 2006). For waters treated with chlorine, haloacetic acids (HAAs) and trihalomethanes (THMs) predominate. There are a total of nine HAA species (HAA9) containing chlorine and/or bromine and there are a total of four THM species (THM4) containing chlorine and/or bromine (see Figure 3). The regulation of only five of the HAA species (MCAA, DCAA, TCAA, MBAA, and DBAA) was based on available occurrence data and limitations in analytical method standards for the other four HAA species (DCAA, DBCAA, DCBAA, TBAA) (Singer 2004). Maximum Contaminant Level Goals (MCLGs) are listed in Table 2, along with the Maximum Contaminant Level (MCL) allowable in finished water, which is based on the sum of TTHM and HAA5, respectively. The regulation of these compounds as groups was based on the predominance of chlorinated forms over brominated forms in most source waters; only when bromide is high in source waters do brominated forms appear and present risk. While THM4 and HAA5 are currently the most studied DBPs, additional DBPs and groups of DBPs have been evaluated in drinking water. For example, the use of chloramine instead of chlorine produces different DBPs (many of them containing nitrogen; all unregulated at present). The use of ozone produces fewer DBPs, with the exception of bromate, which forms when bromide is present in source water (Von Gunten 2003; Fan 2009); bromate is regulated.
-HOCl + NOM + (Br ) DBPs→
15
Figure 3. Structures for HAAs and THMs. Shaded DBPs contain bromide and can only be formed when source waters contain bromide 4.2 Drinking Water Disinfection By-Products and Human Health Risk While disinfection has clearly made drinking water much safer by removing microbial risks, disinfection by-products are not without their own concerns (for a recent overview, see (EWG 2013)). In 1976, the National Cancer Institute identified chloroform as being carcinogenic to rodents (1976). Since it was known to be present in chlorinated drinking water, extensive research followed. Subsequent work challenged the contention that chloroform was carcinogenic in humans through consumption of drinking water, and well-controlled epidemiological studies have proven difficult due to the presence of mixtures of DBPs in drinking water (NIH 2011) and the multiple pathways of exposure (ingestion, inhalation, dermal). Toxicity and carcinogenicity of individual DBPs remains difficult to quantify. However, mixtures of DBPs present in drinking water have been well-studied. Numerous epidemiological studies have established an association between the use of chlorinated drinking water and increased risk of bladder cancer and rectal cancer (see for example: (Cantor, Hoover, Hartge, Mason, Silverman, Altman, Austin, Child, Key, Marrett, Myers, Narayana, Levin, Sullivan, Swanson, Thomas and West 1987; King and Marrett 1996; Cantor, Lynch, Hildesheim, Dosemeci, Lubin, Alavanja and Craun 1998; Boorman, Dellarco, Dunnick, Chapin, Hunter, Hauchman, Gardner, Cox and Sills 1999; NIH 2011)). Other effects from exposure and use of chlorinated water that contains DBPs can include adverse reproductive outcomes (e.g., low birth weight, anemia, developmental anomalies, growth retardation, and urinary tract anomalies) (Boorman, Dellarco et al. 1999; Nieuwenhuijsen, Toledano, Eaton, Fawell and Elliott 2000; Graves, Matanoski and Tardiff 2001; Kumar, Forand, Babcock and Hwang 2013). Additional epidemiological work has focused on the inhalation and dermal exposures to DBPs in drinking water and in chlorinated recreational water (i.e., swimming
16
pools)(Liviac, Wagner, Mitch, Altonji and Plewa 2010; Basu, Gupta, Singh and Mukhopadhyay 2011; Richardson and Postigo 2012). As EPA notes in most documents associated with DBP regulation, more than 200 million people in the United States use water that has been treated with a chemical disinfectant for consumption and bathing. Even small health risks present a serious concern, due to this very large exposed population. To reduce the risk to populations using disinfected water, the Stage 1 Disinfectants/Disinfection Byproducts (D/DBP) Rule was established in the U.S. in 1998 to regulate total Trihalomethanes (THMs) at a maximum contaminant level (MCL) of 80 μg/L and a group of five Haloacetic acids (HAAs) at an MCL of 60 μg/L (USEPA 1998). At that time, there was extensive discussion about the regulation of individual DBPs, the additional four HAAs, and other potential DBPs (e.g., NDMA). EPA continues to evaluate DBPs for health concerns, and several nitrosomines are on the Contaminant Candidate List (USEPA 2009). In 2006, the EPA published the Stage 2 D/DBP Rule, which alters the monitoring locations and reporting requirements for THM and HAA to increase public health protection. Basically, the change ensures that all locations in a drinking water distribution system will meet the MCLs, whereas previously, utilities could average high and low locations and still be considered in compliance. Large systems (those serving greater than 100,000 people) were required to be in compliance with Stage 2 of the D/DBP Rule in January 2013. Smaller systems have compliance dates over the next year, with final compliance at all public systems by July 2014. There are two main issues related to the use of lumped surrogate terms (TTHM and HAA5) for the protection of consumers from risks associated with disinfection by-products. First, TTHM and HAA5 represent a small fraction of the total number of DBP chemicals that might form. While they may represent the most common chemicals, it is not clear that their control will also control other unregulated DBPs. Francis et al. used the ICR data to evaluate the suitability of TTHM and HAA5 as surrogates for other halogenated organics measured during the ICR study (Francis et al. 2010). They found that the relationship between the regulated surrogates (TTHM and HAA5) and other classes of halogenated organics present in drinking water is fairly strong when source water bromide concentrations are low, suggesting that the control of THM and HAA5 will also provide protection from risks associated with unregulated DBPs. However, when source water bromide is high (>0.4 mg/L), TTHM and HAA5 concentrations are not well correlated with other classes of DBPs, suggesting waters containing acceptable levels of TTHM and HAA5 could contain unacceptably high levels of unregulated DBPs that pose human health risk (Francis, Vanbriesen et al. 2010). The second concern with the use of TTHM and HAA5 has to do with their regulation based on total concentration. The regulatory limit is on total concentration of these groups of chemicals, again because this grouping is believe to be a good surrogate for risk (USEPA 1992). However, the risk associated with DBPs is well-known to be species-dependent, with iodated and brominated DBPs associated with negative outcomes at lower concentrations than their chlorinated analogs (Richardson, Thruston et al. 2003; Echigo, Itoh, Natsui, Araki and Ando 2004; Plewa, Wagner, Richardson, Thruston, Woo and McKague 2004; Berry, Dombrowski et al. 2007; Richardson, Fasano, Ellington, Crumley, Buettner, Evans, Blount, Silva, Waite, Luther, McKague, Miltner, Wagner and Plewa 2008). Thus, because brominated DBPs have higher health risks than chlorinated DBPs, the presence of bromide in source waters increases the risk
17
associated with use of chlorinated drinking water (Rook 1974; Richardson, Thruston et al. 2003; Berry, Dombrowski et al. 2007). When bromide is present, it is possible to have a finished drinking water that contains acceptable levels of TTHM and HAA5, but which presents a greater risk to consumers than water with acceptable levels created solely by chlorinated DBPs. The assessment of risk is complex and beyond the scope of the present work. Table 2 provides details on the four regulated THM, the five regulated HAA and the four unregulated HAA, as well as other regulated DBPs (chlorite from use of chorine dioxide and bromate from use of ozone in waters that contain bromide). Toxicity data for the main THM and HAA forms has been developed, but for many unregulated disinfection by-products, little is known regarding toxicity. Using computational toxicity tools, estimates of the toxicity of unstudied chemicals detected in finished drinking water samples that have been disinfected have been developed (Woo, Lai, McLain, Manibusan and Dellarco 2002; USEPA 2008). While specifics for each chemical remain largely unknown, in general, as noted above, brominated (and iodated) DBPs present higher risks than do chlorinated DBPs. Thus, shifting speciation from predominately chlorinated to predominately brominated forms of DBPs increases risks associated with exposure to chlorinated drinking waters.
Table 2. Summary of Target Concentrations (MCLGs and MCLs) for Common Disinfection By-products in Water
Monochloroacetic acid (MCAA) 70 µg/L Sum of HAA5 on a mass basis must be less than 60 µg/L (0.060 mg/L) for an annual running
average
Dichloracetic acid (DCAA) 0 Trichloroacetic acid (TCAA) 20 µg/L Monobromoacetic acid (MBAA) Not set Dibromoacetic acid (DBAA) Not set Bromochloracetic acid (BCAA) Not set
No MCL set for these compounds
Bromodichloroacetic acid (BDCAA)
Not set
Dibromochloroacetic acid (DBCAA)
Not set
Tribromoacetic acid (TBAA) No set Bromate 0 10µg/L (0.010 mg/L) Chlorite 0.80 mg/L 1 mg/L
4.3 Disinfection By-Product Speciation and Bromine Incorporation As noted above, while toxicity and carcinogenicity of individual DBPs remains difficult to quantify, mixtures of DBPs have been well studied, and brominated DBPs are consistently found
18
to be more toxic than chlorinated DBPs. Thus, there have been a number of studies focused on identifying the effect of source water bromide on finished water DBP levels and associated risk. A nationwide study by Krasner et al. found that in source waters containing 3 mg/L(3000 μg/L) bromide, the THM distribution shifted to the brominated species (Krasner, McGuire et al. 1989). Similarly, Heller-Grossman found that 85% of the HAAs were brominated in a lake with “high” bromide concentrations (1.9 mg/L; 1900 μg/L). Chlorination of water with elevated bromide concentrations has been observed to cause a shift from chlorinated to the mixed chloro-bromo and brominated haloacetic acids (Cowman and Singer 1996). Extensive laboratory and field studies have explored the relationship between bromide concentrations in the source water and finished DBP concentrations in drinking water (Luong, Peters and Perry 1982; Hellergrossman, Manka, Limonirelis and Rebhun 1993; Pourmoghaddas, Stevens, Kinman, Dressman, Moore and Ireland 1993; Cowman and Singer 1996; Chang, Lin and Chiang 2001; Duong, Berg, Hoang, Pham, Gallard, Giger and von Gunten 2003; Liang and Singer 2003; Ates, Kitis and Yetis 2007; Cravotta 2008). Bromide field data available in the ICR database have also been evaluated (Obolensky, Singer and Shukairy 2007; Obolensky and Singer 2008; Francis, Vanbriesen et al. 2010). Much of the research conducted in the laboratory or field has identified relationships with high bromide concentrations ( ≥ 0.4 mg/L (400 μg/L), as classified in a nationwide EPA report on the occurrence of DBPs (Weinberg, Krasner, Richardson and Thruston 2002)). For example, in a laboratory study, a high bromide concentration of 412 μg/L resulted in the formation of 80% brominated HAAs (Cowman and Singer 1996). For water with low to moderate bromide concentrations (20 μg/L to 140 μg/L (Weinberg, Krasner et al. 2002)), the speciation of brominated HAAs and THMs is less clear. Duong et al. studied the formation of THMs after chlorination of groundwater samples containing low to moderate concentrations of bromide (50 – 140 μg/L) and found that greater than 80% of THMs formed were brominated (Duong, Berg et al. 2003). In the same study, source water with 20 – 30 μg/L bromide that was chlorinated resulted in 40% brominated THM formation (Duong, Berg et al. 2003). However, another laboratory study found that source water with a moderate bromide concentration of 100 μg/L resulted in only 10% formation of brominated HAAs (Cowman and Singer 1996). Research by Ates et al. found that waters with lower bromide concentrations (60–110 μg/L) did not see a formation shift of DBPs, and that non-brominated DBPs were being formed at greater concentrations at lower bromide concentrations (Ates, Kitis et al. 2007). In work using the ICR database, Obolensky et al. found that bromide was a significant predictor for all DBP species (Obolensky and Singer 2008), but also concluded that at lower bromide concentrations DBPs other than THMs and HAAs, such as the unregulated adsorbable organic halogens, were being formed, again calling into question the concept of using TTHM and HAA5 as surrogates for drinking water DBP risk. While disinfection by-products have been widely studied and much is known about their formation and control, we know the least about systems where bromide is high and organic carbon is high. As noted above, the 1996 EPA information collection rule (ICR) database (USEPA 2000) and subsequent surveys (Weinberg, Krasner et al. 2002) identified two general classes of waters in the US: those with elevated bromide and low organic carbon (typically groundwaters in coastal states) and those with elevated organic carbon and low bromide (typically inland surface waters)(Francis, Vanbriesen et al. 2010). The significantly problematic case of elevated bromide and high organic carbon was not observed in surveys of US drinking
19
water in the 1990s and 2000 (Obolensky, Singer et al. 2007; Francis, Vanbriesen et al. 2010). High bromide in conjunction with high organic carbon is widely recognized to be a worst-case scenario for drinking water plants as typical DOC removal technologies cannot reduce DOC to levels that prevent significant DBP formation in the presence of even moderate bromide levels (Babcock and Singer 1979; Liang and Singer 2003; Archer and Singer 2006). Thus, inland surface waters, which typically have elevated organic carbon (due to natural processes), are most susceptible to problems when bromide concentrations increase. Despite the well-known challenges associated with source water bromide, it is rarely considered within a regulatory framework, likely because most bromide is naturally-occurring and confined to systems with known problems. For example, bromide is a well-known concern in water systems dependent on water from deltas, where tidal excursions cause the mixing of seawater and river water. For this reason, the CALFED Drinking Water Quality Program in California has set a target of 50 µg/L (0.05 mg/L) to protect the public from the health effects of brominated disinfection by-products (Holm, Harader and Fernandez 2007). Source waters in areas of California with significant seawater intrusion (either through groundwater or in tidal areas) often exceed this level. For example, bromide levels in water used by CALFED had running annual averages of 42-424 µg/L (0.04-0.4mg/L) from 1990-2006 (Holm, Harader et al. 2007). Since these are natural sources and bromide removal is very difficult, control is managed via dilution with other water sources (median bromide concentrations unaffected by the ocean are 14µg/L (0.014 mg/L) in surface waters in this area, with concentrations below detection frequently). The effect of these elevated bromide concentrations on water produced from these sources has been extensively documented (Holm, Harader et al. 2007; Westerhoff 2008). 4.4 Drinking Water Treatment System DBP Control Options The cost of reducing DBPs in drinking water has been evaluated by EPA as part of the multi-stage Disinfectants/Disinfectant By-Product (D/DBP) Rulemaking (see for example: (USEPA 1992; USEPA 2005)). There are several common methods to improve DBP control within the drinking water plant. First, drinking water systems can apply enhanced coagulation, settling and filtration systems to improve removal of organic carbon (which reacts to form DBPs)(Edzwald and Tobiason 1999; Volk, Bell, Ibrahim, Verges, Amy and LeChevallier 2000). This DBP-precursor control has been very successful at many drinking water plants, leading to systems that are optimized for organic carbon removal. Because this technical solution has been applied at many plants already in response to State 1 of the D/DBP rule, it is unlikely to have utility in addressing increased bromide concentrations. A second option that is often selected is to change from free-chlorine-based disinfection to a non-chlorine based disinfectant or to combined chlorine (UV, ozone, chloramine). These other disinfectants also produce disinfection by-products (chlorite from chlorine dioxide, bromate from ozone, and unregulated nitrosamines from chloramine). The role of bromide in formation of DBPs from alternative disinfectants has also been studied (e.g., (Richardson, Thruston, Caughran, Chen, Collette and Floyd 1999)), although, as noted above, less is known about the risks associated with unregulated DBPs. Disinfection switching carries increased costs, as well as a need for additional training of operators. For example, the switch to chloramine requires the addition of phosphate to control lead releases that can be caused by the transition (e.g., see the case study of the transition in Washington D.C. (Edwards and Dudi 2004; Edwards,
20
Triantafyllidou and Best 2009)). EPA’s most recent costs analyses suggest that the switch to chloramine is the most cost-effective method (USEPA 2005). None of the national cost analyses specifically deal with the issue of increasing bromide, altering the level or speciation of DBPs, or interacting with process controls implemented to reduce TTHM and HAA5. Due to the extensive challenge of bromide for the CALFED system, Chen et al assessed the cost of increasing bromide concentrations associated with projected increases in seawater intrusion and decreases in delta water export (Chen, Haunschild and Lund 2008). Their estimates are based on the 1.5 million acre-foot of water presently used from the Delta (providing water to 23 million Californians), and an increased cost of $20-60 per acre foot associated with the current bromide levels, leading to $30-90 million per year. They estimated an increase to $200-1000 million per year as source water quality declines and water use increases. Further, they consider the residual public health risk associated with unregulated DBPs that may not be removed through treatment. “Bromide is particularly difficult and expensive to remove and its associated brominated DBPs are among the most harmful.”(Chen, Haunschild et al. 2008) More recently, the California Urban Water Agencies (CUWA) completed an analysis of the operational and maintenance costs associated with bromide at various levels in the source water under current and potential future regulatory scenarios for DBPs (CUWA 2011). Absent an improvement in source water quality, they anticipate spending $3-8 billion in capital improvements to meet future plausible3 drinking water standards (including those associated with DBPs) with the lower quality (higher bromide) water; added annual O&M costs are estimated at $115-325 million. DBP control in the distribution system after the water leaves the treatment plant can also be implemented. DBPs continue to form from the treatment plant to the consumer’s tap due to the residual disinfectant and organic carbon. Several in-distribution system operations are often deployed to reduce DBP levels in the distribution system. First, reduced chlorine loading at the plant with subsequent additions through ‘boosters’ in the distribution system can reduce the contact time for chlorine with the organic carbon in the distribution system, reducing the DBPs in the consumed water (Carrico and Singer 2009; Kang and Lansey 2010; Behzadian, Alimohammadnejad, Ardeshir and Jalilsani 2012). DBP speciation changes within the distribution system have been evaluated (Elshorbagy 2000; Behzadian, Alimohammadnejad et al. 2012) and recent laboratory experiments (Clark 1998; Boccelli, Tryby, Uber and Summers 2003) and studies in real distribution systems (Chen and Weisel 1998; Elshorbagy 2000; Rodriguez, Serodes, Levallois and Proulx 2007; Behzadian, Alimohammadnejad et al. 2012) have considered the role of additional chlorine dosing in DBP formation. If staged disinfection is not effective, DBP can be removed from the distribution system at storage points. The most common removal technique is to mix and aerate water in tanks, which causes the THM to volatilize, reducing concentrations in the water sent to consumer taps (Sherant 2008; McDonnell and Boccelli 2012). Very little research has been done to evaluate the relative removal of different species of THM following aeration. Total THM decreases under aeration conditions–however,
3 The report selects “plausible” and “outer boundary” conditions for future regulatory conditions. For example, the authors state that it is plausible that monitoring for THM regulation will change to a single sample not to exceed from the current averaging. It is an outer boundary condition to assume that individual THM and HAA species will be regulated. See report for full details of the conditions represented by the cost values cited here.
21
simple partitioning calculations suggest that chloroform will volatilize to a greater extent than bromoform, leading to an increase in the percent bromination while overall THM is decreasing. Again, in waters that contain bromide this may lead to a drinking water that meets regulatory compliance levels, but represents an increased risk due to its high levels of brominated DBPs. Finally, while not typically deployed at drinking water plants, there has been significant research on bromide removal technologies for source waters. In general, removal of bromide is very challenging since it is a highly soluble, small, monovalent ionic species. Removal of this type of contaminant is usually achieved through removal of all dissolved species during desalination. Both membrane and thermal demineralization processes are suitable for bromide removal, but since bromide comprises just a small fraction of the dissolved solids in a waste stream or source water, most of the energy invested in desalination is spent removing non-target salts (i.e., NaCl). Further, fully demineralized water is unsafe for consumption, so additional expense may be incurred for chemical addition for potability if TDS must be taken very low to remove adequate amounts of bromide. While bromide ion removal generally requires desalination techniques (membrane or thermal), this is not the only known method. Anion exchange (Hsu and Singer 2010), electrochemical removal (Kimbrough and Suffet 2002; Kimbrough and Suffet 2006; Bo 2008; Kimbrough, Boulos, Surawanvijit, Zacheis and Cohen 2013), enhanced coagulation (Ge, Shu and Dai 2007; Ge and Zhu 2008), and sorption with reactive carbons (e.g., silver doped aerogels (Sanchez-Polo, Rivera-Utrilla, Salhi and von Gunten 2006; Sanchez-Polo, Rivera-Utrilla and Von Gunten 2007)) are all methods that have been evaluated and have varying removal efficiencies. These methods selectively target bromide, usually for removal from source waters undergoing disinfection to reduce brominated DBP formation. Few of these technologies have reached field scale deployment. However, Kimbrough et al. (2013) recently published results from pilot-testing an electrolysis method for use on California State Water Project water (as discussed above, this water has naturally-occurring bromide on the order of 42-424 µg/L (0.04-0.4mg/L) (Holm, Harader et al. 2007), and costs estimated for its control are in the hundreds of millions per year (Chen, Haunschild et al. 2008)). Kimbrough et al. (2013) estimate that the capital cost of an electrolysis plant would exceed a similar reverse osmosis plant. Power consumption would be in the range of similar reverse osmosis plants, but disposal costs would be less because no residuals are produced. 5.0 Current and Potential Future Power Plant Bromide Discharge Impacts on Drinking Water Assessing the impact of proposed treatment methods for power plant discharges on downstream drinking water plants would require considerably more information than is currently available or was used for environmental assessment of the proposed effluent limitations guidelines and standards for the steam electric power generating point source category (USEPA 2013). For example, similar to the analysis presented in the modeling studies, receiving water analysis would have to be used to identify current bromide levels in surface waters. There are not extensive historical data for surface waters, however, drinking water plants experiencing DBP problems do frequently analyze source water bromide, and their results could be used for this
22
part of the model. Proximity analysis along the flow path of the surface water would need to be used to identify downstream drinking water plants that might be affected by current or altered bromide concentrations (this was done for drinking water plants in the current analysis with respect to metals, but it is not clear that plants beyond the mixing zone for metals discharges were evaluated (USEPA 2013)). Bromide does not settle out or complex as metals do, so increased bromide concentrations have impacts hundreds of miles downstream from discharge. Bromide declines only through dilution with surface runoff or rainfall. [See for example, analysis of the bromide concentrations in the Ohio River at Cincinnati associated with increased discharges of bromide into the Allegheny and Monongahela Rivers in 2008 and 2010 (Ziolkowski 2010).] Downstream drinking water plants would have to be characterized to determine (1) the current contribution of power plant discharges to drinking water risk, (2) the future effect of increased discharges associated with FGD or mercury removal technologies on drinking water risk, and (3) the potential effects of the implementation of ELG options under consideration on drinking water risk. The downstream plants would need to be evaluated for type of disinfectant used, treatment train DOC removal efficiency, current source water bromide levels, and current DBP concentrations and speciation. Very little work has been done regarding the effect of increased bromide loads through anthropogenic discharges on drinking water plants. Much of the prior work on the effects of bromide on drinking water systems (summarized above) is associated with naturally-occurring bromide (e.g., CALFED’s analysis; (Holm, Harader et al. 2007)). In the past few years, within the Monongahela and Allegheny basins in southwestern Pennsylvania, significantly increased bromide concentrations have been observed in source waters (States, Cyprych et al. 2013; Wilson, Wang et al. 2013; Ziemkiewicz 2013). This has largely been attributed to practices associated with disposal of oil and gas produced water from Marcellus shale development (Ferrar, Michanowicz, Christen, Mulcahy, Malone and Sharma 2013), however, several power plants in the region have recently installed FGD systems, and thus may be contributing to the bromide loads. States and colleagues at the Pittsburgh Water and Sewer Authority and the University of Pittsburgh completed a multi-year study in the Allegheny River and its upstream tributaries that evaluated source water (at the plant in Pittsburgh) and finished water (after disinfection), as well as water from locations above and below various discharges that were suspected to contain bromide (States, Cyprych et al. 2013). Source water bromide concentration was linearly correlated with finished water bromination; at 50 µg/L bromide in the source water, 62% of the THM consisted of bromoform, dibromochloromethane and bromodichloromethane, while at 150 µg/L bromide in the source water, 83% of the THM was comprised of these brominated species. Oil and gas brine treatment plants added significant bromide to the watershed, as expected. Some coal fired-power plants intermittently added bromide loads, while others seemed to have very low bromide discharges. It was not clear from the States et al. (2013) study which power plants had FGD scrubbers installed. It was clear that increasing bromide loads (through discharges from various sources) affected the finished drinking water at the treatment plant. Higher TTHM and increased bromination (up to 88%) was observed in response to increased bromide concentrations. Conventional drinking water processes were ineffective at removing bromide, as expected, with bromide only removed during oxidation to form brominated DBPs. TDS was not a reliable indicator or surrogate of bromide concentrations, and thus, TDS standards for the river
23
or for point source discharges are not likely to adequately control bromide discharges. They identified anthropogenic loads of bromide in the basin of 1622 lbs/day (735.7 kg/day). VanBriesen and colleagues at Carnegie Mellon University, with collaborators at seven drinking water plants in the region, completed a three year field study in the Monongahela River that evaluated source water (from drinking water plant intakes) and finished water (after disinfection) to ascertain the effect of increasing bromide loads on DBP formation and speciation. Wilson and VanBriesen (2013) calculated the increased bromide load associated with surface water discharge practices in the oil and gas industry in 2008-2011 in the state of Pennsylvania. They report a six fold increase in bromide load (from 1150 kg/day to 8000 kg/day) between 2006 and 2008, with a subsequent decline to 1750kg/day in 2011, after Marcellus-associated produced water stopped being treated at surface discharging plants not subject to TDS effluent limits (Krancer 2011). VanBriesen and colleagues report significant increases in TTHM and percent bromination at the surface water treatment plants during this time period (VanBriesen and Wilson 2012; Wilson and VanBriesen 2013), as would be expected based on the extensive literature supporting the relationship between higher source water bromide and higher bromination of DBPs in the finished water. While no direct analysis has been done on the effect of coal-fired power plant bromide discharges on downstream potable water supply disinfection by-product formation, there is no reason to suspect that bromide released from FGD scrubber wastewater discharged to surface waters will react in any way differently than other sources of bromide. Increased bromide loads translate into increased bromide concentrations, subject to dilution effects controlled by river flows, rainfall, and the input of other waste streams with varying bromide concentration. A complete assessment of all inputs of bromide to a drinking water source area could easily be made with adequate monitoring data. The relative contribution of coal-fired power plant discharges to the overall bromide load could then be ascertained. Regardless of the source of bromide, however, it is clear that relatively small amounts of bromide in source waters have the potential to create significant quantities of brominated disinfection by-products. Drinking water treatment plants will require modification and will incur additional costs if bromide concentrations in source waters rise to unacceptable levels. Because of the structure of DBP regulation (as lumped TTHM and HAA5) and the relative risk associated with brominated versus chlorinated DBPs, drinking water plants that meet MCLs for TTHM and HAA5, while treating high bromide source waters, may distribute water that presents increased risk to consumers. Quantification of this increased risk will be difficult, but should be undertaken if bromide levels are permitted to rise in source waters due to increased discharges from power plants. 6.0 Summary and Conclusions Current coal-fired power plant activities produce a variety of wastewaters, including those that contain elevated total dissolved solids (TDS or salts). These salts often contain high levels of chloride and moderate levels of bromide. Current levels of bromide in coal-fired power plant wastewater are highly variable. Bromide levels in coal vary, producing variable amounts of bromide during combustion. In a conventional coal-fired power plant, bromide is generally converted to bromine and exits in the flue gas. However, pollution control units, especially wet flue-gas desulfurization (FGD) treatment designed to reduce sulfur dioxide emissions, converts bromine back to bromide, which is then collected in the FGD wastewater and discharged to
24
surface waters. Thus, plants operating wet FGD systems currently, or those that will install them in the future, discharge higher amounts of bromide to surface waters. Also, a successful technology associated with mercury control is based on bromide addition, which further increases bromide concentrations in FGD wastewater. It is not clear, based on regulatory uncertainty and industry options, how many power plants in the US will install wet FGD systems and/or wet FGD with bromide addition for optimal control of sulfur dioxide and mercury emissions to air. It is reasonable to expect that bromide loads from coal-fired power plants will increase in the coming years unless FGD wastewater is treated to remove bromide. Discharge of bromide to surface waters, even from wastewaters at low concentration, can increase concentrations of bromide in waters that are used as sources for drinking water treatment plants. Bromide concentrations that affect potable drinking water systems are generally very low. While more information and study is needed to understand fully the role of bromide in DBP formation and risk, source water levels above 0.05-0.1 mg/L are associated with significant bromination and often lead to concentrations of TTHM and HAA5 that exceed regulatory compliance levels. Drinking water plants cannot easily remove bromide, and when bromide reacts with disinfectants, it can form brominated disinfection by-products. Exposure to these DBPs (through consumption of treated water and through dermal and inhalation exposure during bathing) is associated with increased cancer risk (especially bladder and rectal) and with increased negative reproductive outcomes (i.e., low birth weight, developmental anomalies). Control of DBPs through process changes is often expensive, requiring plant upgrades and increased annual operation and maintenance costs. DBP control targets regulated TTHM and HAA5, but other DBPs formed during disinfection of bromide-containing water may present higher risks and may persist even in waters that have been modified to meet compliance requirements. Thus, while it is possible to manage bromide-associated risks within the drinking water system, the technologies involved are complex and expensive and may not significantly reduce the risk associated with source water bromide. Managing bromide in source waters is preferred as it avoids the expensive and possibly ineffective treatment options used within drinking water systems, providing protection for the hundreds of millions of people who use disinfected water in the U.S. every day. Bromide was inadequately considered in the review of technologies for the proposed Effluent Limitations Guidelines and Standards for the Steam Electric Power Generating Point Source Category. Extensive receiving water analyses did not include current bromide levels in these waters. Analysis of current bromide levels in power plant discharges was insufficient to adequately characterize the breadth of current risk or the potential for increased risk with expanded pollution control for sulfur dioxide and mercury. Proximity analysis to downstream drinking water plants was considered for potential effect of metals, but not for bromide. Downstream drinking water plants were also inadequately characterized to determine the current contribution of power plant discharges to drinking water risk, the future potential effect of increased discharges, and the effects of the implementation of the proposed ELG options on drinking water risk. While Option 5 would be expected to remove bromide (as it removes chloride), other options, which do not appreciably remove chloride are unlikely to remove bromide. Significant additional analysis is needed to understand the human health and economic impacts of steam electric power plant discharges of bromide now, in the future, and under different possible treatment options proposed in the new standards.
25
26
7.0 References ACS (1997). First commercial production of bromine in the United States. Midland, MI,
Archer, A. D. and P. C. Singer (2006). "Effect of SUVA and enhanced coagulation on removal of TOX precursors." Journal American Water Works Association 98(8): 97-107. http://www.awwa.org/publications/journal-awwa/abstract.aspx?articleid=15504
Ates, N., M. Kitis, et al. (2007). "Formation of chlorination by-products. in waters with low SUVA-correlations with SUVA and differential UV spectroscopy." Water Research 41(18): 4139-4148. http://www.sciencedirect.com/science/article/pii/S0043135407003478
Babcock, D. B. and P. C. Singer (1979). "Chlorination and coagulation of humic and fulvic acids." Journal American Water Works Association 71(3): 149-152. http://www.jstor.org/stable/41269704
Basu, M., S. K. Gupta, et al. (2011). "Multi-route risk assessment from trihalomethanes in drinking water supplies." Environ Monit Assess 178: 121-134. http://link.springer.com/article/10.1007%2Fs10661-010-1677-z
Behzadian, K., M. Alimohammadnejad, et al. (2012). "A novel approach for water quality management in water distribution systems by multi-objective booster chlorination." International Journal of Civil Engineering 10(1): 51-60. http://ijce.iust.ac.ir/browse.php?a_code=A-10-682-1&slc_lang=en&sid=1&sw=Optimization+model
Benson, S. A., M. Holmes, et al. (2007). Large scale mercury control technology testing for lignite-fired utilites - oxidation systems for wet FGD. Morgantown, WV, U.S. Department of Energy National Energy Technology Laboratory.http://www.netl.doe.gov/technologies/coalpower/ewr/mercury/control-tech/pubs/41991/41991%20Final%20Report.pdf
Berry, M., K. Dombrowski, et al. (2007). Mercury control evaluation of calcium bromide injection into a PRB-fired furnace with an SCR. Air Quality VI Conference. Arlington/Washington DC.http://www.vosteen-consulting.de/downloads/2007_09_%20Plant_Miller_Halogen_Injection_presented_at_AQ_VI_Conference.pdf
Birnbaum, L. S. and D. F. Staskal (2004). "Brominated flame retardants: Cause for concern?" Environmental Health Perspectives 112(1): 9-17. http://www.ncbi.nlm.nih.gov/pmc/articles/PMC1241790/pdf/ehp0112-000009.pdf
Bo, L. (2008). Electrolytic Cell and Process for Removal of Bromide ions and Disinfection of Source Waters using Silver Cathode and/or Dimensionally stable anode (DSA): a process for the reduction of disinfectant/disinfection byproducts in drinking water. U. S. P. Office. United States.http://www.google.com/patents/US20070187337
Boccelli, D. L., M. E. Tryby, et al. (2003). "A reactive species model for chlorine decay and THM formation under rechlorination conditions." Water Research 37(11): 2654-2666. http://dx.doi.org/10.1016/S0043-1354(03)00067-8
Boorman, G. A., V. Dellarco, et al. (1999). "Drinking water disinfection byproducts: Review and approach to toxicity evaluation." Environmental Health Perspectives 107: 207-217. http://www.ncbi.nlm.nih.gov/pmc/articles/PMC1566350/pdf/envhper00518-0209.pdf
Bowen, H. J. M. (1966). Trace elements in biochemistry. New York, Academic Press. Bowen, H. J. M. (1979). Environmental Chemistry of the elements. London, Academic Press.
Bragg, L., R. Finkelman, et al. (1991). Distribution of chlorine in United States Coal. Chlorine in Coal. J. Stringer and D. Banerjee. Amsterdam, Elsevier: 3-10.
Canton, J. H., P. W. Wester, et al. (1983). "Study of toxicity of sodium bromide to different freshwater organisms." Food Chem. Toxicol 21: 369-378. http://www.sciencedirect.com/science/article/pii/027869158390090X
Cantor, K. P., R. Hoover, et al. (1987). "Bladder-cancer, drinking-water source, and tap-water consumption - a case-control study." Journal of the National Cancer Institute 79(6): 1269-1279. http://www.ncbi.nlm.nih.gov/pubmed/3480378
Cantor, K. P., C. F. Lynch, et al. (1998). "Drinking water source and chlorination byproducts I. Risk of bladder cancer." Epidemiology 9(1): 21-28. http://www.jstor.org/stable/3702609
Cao, Y., G. Zhengyang, et al. (2008). "Impacts of halogen additions on mercurty oxidation, in a slipstream selective catalyst reduction (SCR), reactor when burning sub-bituminous coal." Environmental Science and Technology 42(1): 256-261. http://pubs.acs.org/doi/abs/10.1021/es071281e
Carrico, B. and P. C. Singer (2009). "Impact of Booster Chlorination on Chlorine Decay and THM Production: Simulated Analysis." Journal of Environmental Engineering-Asce 135(10): 928-935. http://dx.doi.org/10.1061/(ASCE)0733-9372(2009)135:10(928)
Chang, E. E., Y. P. Lin, et al. (2001). "Effects of bromide on the formation of THMs and HAAs." Chemosphere 43(8): 1029-1034. http://dx.doi.org/10.1016/S0045-6535(00)00210-1
Chang, R., K. Dombrowski, et al. (2008). Near and Long Term Options for Controlling Mercury Emissions from Power Plants. Power Plant Air Pollutant Control MEGA Symposium, Baltimore, MD.
Chen, B., S.-N. Nam, et al. (2009). "Fate of effluent organic matter and DBP precursors in an effluent-dominated river: a case study of wastewater impact on downstream water quality." Water Research 43: 1755-1765. http://dx.doi.org/10.1016/j.watres.2009.01.020
Chen, W.-H., K. Haunschild, et al. (2008). Delta Drinking Water Quality and Treatment Costs. Technical Appendix H. Public Policy Institute of California. San Franciso, CA.http://www.ppic.org/content/pubs/other/708EHR_appendixH.pdf
Chen, W. J. and C. P. Weisel (1998). "Halogenated DBP concentrations in a distribution system." Journal American Water Works Association 90(4): 151-163. http://www.environmental-expert.com/articles/halogenated-dbp-concentrations-in-a-distribution-system-69733
Clare, L. and L. Sloss (1992). Trace Element emissions from coal combustion and gasification. London, UK, IEA Coal Research. IEA CR/49: 111.http://www.iea-coal.org.uk/report/80571/Emissions-and-effects/80878/Trace-elements---emissions-from-coal-combustion-and-gasification
Clark, R. M. (1998). "Chlorine demand and TTHM formation kinetics: A second-order model." Journal of Environmental Engineering-Asce 124(5): 485-485. http://ascelibrary.org/doi/abs/10.1061/%28ASCE%290733-9372%281998%29124%3A1%2816%29?journalCode=joeedu
Collins, A. G. (1970). "Finding Profits in Oil-Well Waste Waters." Chemical Engineering 77(20): 165-&. Constantz, J., M. H. Cox, et al. (2003). "Comparison of Heat and Bromide as Ground Water Tracers Near
Streams." Groundwater 41(5): 647-656. http://info.ngwa.org/gwol/pdf/032578038.pdf Corsi, S. R., D. J. Graczyk, et al. (2010). "A fresh look at road salt: aquatic toxicity and water quality
impacts on local, regional and national scales." Environmental Science and Technology 44(19): 7376-7382. http://pubs.acs.org/doi/abs/10.1021/es101333u
Cowman, G. A. and P. C. Singer (1996). "Effect of bromide ion on haloacetic acid speciation resulting from chlorination and chloramination of aquatic humic substances." Environmental Science & Technology 30(1): 16-24. http://pubs.acs.org/doi/abs/10.1021/es9406905
Cravotta, C. A. (2008). "Dissolved metals and associated constituents in abandoned coal-mine discharges, Pennsylvania, USA. Part 1: Constituent quantities and correlations." Applied
CUWA (2011). Drinking Water Treatment Evaluation Project Report. Phoenix, AZ, Prepared by Malcolm Pirnie, Inc. for California Urban Water Agencies.http://www.swrcb.ca.gov/rwqcb5/water_issues/drinking_water_policy/dwp_trtmnt_eval_rpt.pdf
Dahm, K. G., K. L. Guerra, et al. (2011). "Composite geochemical database for coalbed methane produced water quality in the rocky Mountain Region." Environmental Science and Technology 45(18): 7655-7663. http://pubs.acs.org/doi/abs/10.1021/es201021n
Darnerud, P. O., G. S. Eriksen, et al. (2001). "Polybrominated diphenyl ethers: Occurrence, dietary exposure, and toxicology." Environmental Health Perspectives 109: 49-68. http://www.ncbi.nlm.nih.gov/pmc/articles/PMC1240542/
Davis, S. N., J. T. Fabryka-Martin, et al. (2004). "Variations of bromide in potable ground water in the United States." Ground Water 42(6): 902-909. http://onlinelibrary.wiley.com/doi/10.1111/j.1745-6584.2004.t01-8-.x/abstract
de Wit, C. A. (2002). "An overview of brominated flame retardants in the environment." Chemosphere 46(5): 583-624. http://www.sciencedirect.com/science/article/pii/S0045653501002259
Debenest, T., F. Gagne, et al. (2010). "Ecotoxicity of a brominated flame retardant (tetrabromobisphenol A) and its derivatives to aquatic organisms." Comparative Biochemistry and Physiology C-Toxicology & Pharmacology 152(4): 407-412. http://www.sciencedirect.com/science/article/pii/S1532045610001201
Dombrowski, K., S. McDowell, et al. (2008). The balance-of-plant impacts of calcium bromide injection as a mercury oxidation technology in power plants. A&WMA Mega Symposium. Baltimore, MD
Dresel, P. E. and A. W. Rose (2010). Chemistry and origin of oil and gas well brines in western Pennsylvania. Open-File Report OFOG 10-02.0. Harrisburg, Pennsylvania Geological Survey: 1-48.http://www.marcellus.psu.edu/resources/PDFs/brines.pdf
Duong, H. A., M. Berg, et al. (2003). "Trihalomethane formation by chlorination of ammonium- and bromide-containing groundwater in water supplies of Hanoi, Vietnam." Water Research 37(13): 3242-3252. http://www.sciencedirect.com/science/article/pii/S0043135403001386
Echigo, S., S. Itoh, et al. (2004). "Contribution of brominated organic disinfection by-products to the mutagenicity of drinking water." Water Science and Technology 50(5): 321-328. http://europepmc.org/abstract/MED/15497864/reload=0;jsessionid=DEFf6i48p1d6wvYguxX2.6
Edwards, M. and A. Dudi (2004). "Role of chlorine and chloramines in corrosion of lead-bearing plumbing materials." Journal of American Water Works Association 96: 69-81. http://www.jstor.org/stable/41311235
Edwards, M., S. Triantafyllidou, et al. (2009). "Elevated Blood Lead in Young Children Due to Lead-Contaminated Drinking Water: Washington DC 2001-2004." Environmental Science and Technology 43: 1618-1623. http://pubs.acs.org/doi/abs/10.1021/es802789w
Edzwald, J. K. and J. E. Tobiason (1999). "Enhanced Coagulation: US requirements and a broader view." Water Science and Technology 40(9): 63-70. http://www.sciencedirect.com/science/article/pii/S0273122399006411
Elshorbagy, W. A. (2000). "Kinetics of THM species in finished drinking water." J.Water Res. Planning Manage.-ASCE 126(1): 21-28. http://ascelibrary.org/doi/abs/10.1061/%28ASCE%290733-9496%282000%29126%3A1%2821%29?journalCode=jwrmd5
EPRI (1987). Chemical Characterization of Fossil Fuel Combustion Wastes. Richland, WA, Electric Power Research Institute.http://www.epri.com/abstracts/Pages/ProductAbstract.aspx?ProductId=EA-5321
EPRI (1998). Field evaluation of the comanagement of utility low-volume wastes with high-volume coal combustion by-products: P4 Site. A. Quinn. Palo Alto, CA, Electric Power Research Institute
EPRI (2000). Field evaluation of the comanagement of utility low-volume wastes with high-volume coal combustion by-products: HA Site. Palo Alto, CA, Electric Power Research Institute.http://www.epri.com/abstracts/Pages/ProductAbstract.aspx?ProductId=000000000001000720
EPRI (2002). Field evaluation of the comanagement of utility low-volume wastes with high-volume coal combustion by-products: FC Site. Palo Alto, CA, Electric Power Research Institute
EPRI (2003). Field evaluation of the comanagement of utility low-volume wastes with high-volume coal combustion by-products: MO Site. Palo Alto, CA, Electric Power Research Institute
EPRI (2004). Field evaluation of the comanagement of utility low-volume wastes with high-volume coal combustion by-products: OK Site. Palo Alto, CA, Electric Power Research Institute
EPRI (2004). The formation and fate of trihalomethanes in power plant cooling water systems. K. Zammit. Palo Alto, CA
EPRI (2005). Field evaluation of the comanagement of utility low-volume wastes with high-volume coal combustion by-products: CY Site. Palo Alto, CA, Electric Power Research Institute
EPRI (2006). Flue Gas Desulfurization (FGD) Wastewater Characterization: Screening Study. P. Chu, Electric Power Research Institute
EPRI (2007). Field Evaluation of the Comanagement of Utility Low-Volume Wastes with High-Volume Coal Combustion By-Products: LS Site. Palo Alto, CA, Electric Power Research Institute
EPRI (2007). Field evaluation of the comanagement of utility low-volume wastes with high-volume coal combustion by-products: PA site. Palo Alto, CA
EPRI (2007). Sampling and Analytical Plan Guidance for Water Characterization of Coal-Fired Steam Electric Utility Facilities. P. Chu. Palo Alto, CA, Electric Power Research Institute
ERG (2007). FINAL Engineering Site Visit Report for Georgia Power's Plant Yates Newnan, GA, United States Environmental Protection Agency
Eswaran, S. and H. Stenger (2008). "Effect of halogens on mercury conversion in SCR catalysts." Fuel Processing Technology 89(11): 1153-1159. http://www.sciencedirect.com/science/article/pii/S0378382008001124
EWG (2013). Water Treatment Contaminants: Forgotten Toxics in American Water. Washington, DC, Environmental Working Group.http://www.ewg.org/research/water-treatment-contaminants
Fan, A. (2009). Public Health Goal for Bromate in Drinking Water. Sacramento, CA, Pesticide and Environmental Toxicology Branch; Office of Environmental Health Hazard Assessment; California Environmental Protection Agency.http://oehha.ca.gov/water/phg/pdf/BromatePHG010110.pdf
Ferrar, K. J., D. R. Michanowicz, et al. (2013). "Assessment of Effluents Contaminants from Three Facilities Discharging Marcellus Shale Wastewater to Surface Waters in Pennsylvania." Environmental Science and Technology 47(7): 3472-3481. http://pubs.acs.org/doi/abs/10.1021/es301411q
Fielding, W. R. (2012). Calcium bromide technology for mercury emissions reductions. G. L. S. a. C. business
Finseth, T. (2009). Technology Option Loads Calcuation Analysis for Steam Electric Detailed Study. ERG, Public Record for the Effluent Guidelines Program Plan 2009/2010
Fiske, P. S., J. Oppenheimer, et al. (2011). "In tank aeration predicts and reduces THMs." Opflow: 22-24. http://www.paxwater.com/Portals/79614/docs/Reprint_In-Tank_Aeration_Opflow_November_2011.pdf
Flury, M. and A. Papritz (1993). "Bromide in the natural environment: occurrence and toxicity." Journal of Environmental Quality 22(4): 747-758. http://akasha.wsu.edu/~flury/theses_articles/bromide.pdf
Francis, R. A., J. M. Vanbriesen, et al. (2010). "Bayesian Statistical Modeling of Disinfection Byproduct (DBP) Bromine Incorporation in the ICR Database." Environmental Science and Technology 44(4): 1232-1239. http://pubs.acs.org/doi/abs/10.1021/es9028606
Frank, S. M. (2011). Calcium Bromide Chemical Additive Sample Results 2011 Calcium Bromide Performance Trail February 7 to 12, 2011 NPDES Permit No PA0005011 Conemaugh Generating Station. Canonsburg, PA, Letter Report submitted to PA DEP Southwest Region, Pittsburgh PA. March 10, 2011
Fuge, R. (1988). "Sources of halogens in the environment, influences on human and animal health." Environmental Geochemistry and Health 10(2): 51-61. http://lrg.elte.hu/oktatas/Elemek%20korforgasa%20PhD/Na-K-Rb-Cs-F-Cl-Br-I/Fuge%201988.pdf
GAO (2009). Mercury control technologies at cola fired power plants have achieved substantial emissions reductions. Report to the Chairman, Subcommittee on Clean Air and Nuclear Safety, Committee on Environment and Public Works, US Senate. U. S. G. A. Office. Washington, DC
Ge, F., H. Shu, et al. (2007). "Removal of bromide by aluminum chloride coagulant in the presence of humic acid." Journal of Hazardous Materials 147(1-2): 457-462. http://www.sciencedirect.com/science/article/pii/S0304389407000829
Ge, F. and L. Zhu (2008). "Effects of coexisting anions on removal of bromide in drinking water by coagulation." Journal of Hazardous Materials 151: 676-681. http://www.sciencedirect.com/science/article/pii/S0304389407009004
Germani, M. S. and W. H. Zoller (1988). "Vapor-Phase Concentrations of Arsenic, Selenium, Bromine, Iodine, and Mercury in the Stack of a Coal-Fired Power Plant." Environmental Science and Technology 22(9): 1079-1085. http://pubs.acs.org/doi/abs/10.1021/es00174a013
Graves, C. G., G. M. Matanoski, et al. (2001). "Weight of evidence for an association between adverse reproductive and developmental effects and exposure to disinfection by-products: A critical review." Regulatory Toxicology and Pharmacology 34(2): 103-124. http://www.sciencedirect.com/science/article/pii/S0273230001914941
Handke, P. (2009). Trihalomethane speciation and the relationship to elevated total dissolved solid concentrations affecting drinking water quality at systems utilizing the Monongahela River as a primary source during the 3rd and 4th quarters of 2008. Harrisburg, PA, Pennsylvania Department of Environmental Protection Bureau of Water Standards and Facility Regulation.http://files.dep.state.pa.us/water/Wastewater%20Management/WastewaterPortalFiles/MarcellusShaleWastewaterPartnership/dbp_mon_report__dbp_correlation.pdf
Harriss, R. C. and H. H. Williams (1969). "Specific-ion electrode measurements on Br, Cl, and F in atmospheric precipitation." J. Appl. Meteor. 8(2): 299-301. http://journals.ametsoc.org/doi/abs/10.1175/1520-0450%281969%29008%3C0299%3ASIEMOB%3E2.0.CO%3B2
Hatch, J. R., J. H. J. Bullock, et al. (2006). Chemical Analyses of coal, coal-associated rocks, and coal combustion products collected for the national coal quality inventory. Denver, Co, United States Geological Survey; United States Department of the Interior.http://pubs.usgs.gov/of/2006/1162/
Hayes, T. (2009). Sampling and analysis of water streams associated with the development of Marcellus Shale gas, Prepared for Marcellus Shale Coalition.http://energyindepth.org/wp-content/uploads/marcellus/2012/11/MSCommission-Report.pdf
Helleday, T., K. L. Tuominen, et al. (1999). "Brominated flame retardants induce intragenic recombination in mammalian cells." Mutation Research-Genetic Toxicology and Environmental Mutagenesis 439(2): 137-147. http://www.sciencedirect.com/science/article/pii/S1383571898001867
Hellergrossman, L., J. Manka, et al. (1993). "Formation and distribution of haloacetic acids, THM, and TOX in chlorination of bromide-rich lake water." Water Research 27(8): 1323-1331. http://www.sciencedirect.com/science/article/pii/0043135493902198
Hem, J. D. (1985). "Study and interpretation of the chemical characteristics of natural water." U.S. Geological Survey Water-Supply Paper 2254. http://pubs.usgs.gov/wsp/wsp2254/
Hirayama, Y. (2008). "Global bromine Industry and its Outlook." ICL-IP Retrieved July 10, 2013, from http://www.bromine.chem.yamaguchi-u.ac.jp/library/L02_Global%20Bromine%20Industry.pdf.
Holm, L., S. Harader, et al. (2007). CALFED Water Quality Program Stage 1 Final Assessment. CALFED, CALFED Bay Delta Program.http://www.calwater.ca.gov/content/Documents/Draft_Final.pdf
Hsu, S. and P. C. Singer (2010). "Removal of bromide and natural organic matter by anion exchange." Water Research 44: 2133-2140. http://www.sciencedirect.com/science/article/pii/S0043135409008392
Kang, D. and K. Lansey (2010). "Real-Time Optimal Valve Operation and Booster Disinfection for Water Quality in Water Distribution Systems." Journal of Water Resources Planning and Management-Asce 136(4): 463-473. http://ascelibrary.org/action/showAbstract?page=463&volume=136&issue=4&journalCode=jwrmd5
Kimbrough, D. E., L. Boulos, et al. (2013). "Pilot-testing of electrolysis for bromide removal from drinking water." Journal - American Water Works Association (JAWWA) 105(6): E299-E309. http://www.awwa.org/publications/journal-awwa/abstract/articleid/37200152.aspx
Kimbrough, D. E. and I. H. Suffet (2002). "Electrochemical removal of bromide and reduction of THM formation potential in drinking water." Water Research 36: 4902-4906. http://www.sciencedirect.com/science/article/pii/S0043135402002105
Kimbrough, D. E. and I. H. Suffet (2006). "Electrochemical process for the removal of bromide from California state project water." IWA Journal of Water Supply: Research and Technology - AQUA 55(3): 161-167. http://www.iwaponline.com/jws/055/jws0550161.htm
King, W. D. and L. D. Marrett (1996). "Case-control study of bladder cancer and chlorination by-products in treated water (Ontario, Canada)." Cancer Causes & Control 7(6): 596-604. http://www.jstor.org/discover/10.2307/3553053?uid=3739256&uid=2129&uid=2&uid=70&uid=4&sid=21102633479693
Klein, D. H., A. W. Andren, et al. (1975). "Pathways of Thirty-seven trace elements through coal-fired power plant." Environmental Science and Technology 9(10): 973-979. http://pubs.acs.org/doi/abs/10.1021/es60108a007
Kogel, J. E., N. C. Trivedi, et al., Eds. (2006). Industrial Minerals and Rocks - Commodities, Markets, and Uses, Society for Mining, Metallurgy, and Exploration (SME).
Kogevinas, M. and C. M. Villanueva (2011). "Carcinogenicity of Disinfection Byproducts in Humans: Epidemiological Studies." Encyclopedia of Environmental Health 2011: 505-515.
Kolker, A., J. Quick, et al. (2012). Mercury and Halogens in Coal - their role in determining mercury admissions from coal combustion. Fact Sheet. Reston, VA, United States Geological Society.http://pubs.usgs.gov/fs/2012/3122/
Krancer, M. L. (2011). Letter from DEP to EPA Re: April 19, 2011 request to gas drilling operators to cease by May 19 delivering wastewater (flowback water and production fluids) from shale gas extraction to 15 facilities that currently accept it under special provisions of Pennsylvania's 25 Pa. Code Chapter 95 regulations. Harrisburgh PA, Pennsylvania Department of Environmental Protection.http://www.epa.gov/region03/marcellus_shale/pdf/letter-padep-to-epa7-26-11.pdf
Krasner, S. W., M. J. McGuire, et al. (1989). "The occurrence of disinfection by-products in united-states drinking-water." Journal American Water Works Association 81(8): 41-53. http://www.awwa.org/publications/journal-awwa/abstract.aspx?articleid=12274
Krasner, S. W., H. S. Weinberg, et al. (2006). "Occurrence of a New Generation of Disinfection Byproducts." Environmental Science and Technology 40(23): 7175--7185. http://pubs.acs.org/doi/abs/10.1021/es060353j
Krasner, S. W., P. K. Westerhoff, et al. (2009). "Impact of wastewater treatment processes on organic carbon, organic nitrogen, and DBP precursors in effluent organic matter." Environmental Science and Technology 43(8): 2911-2918. http://pubs.acs.org/doi/abs/10.1021/es802443t
Krishnakumar, B., C. V. Naik, et al. (2013). Predicting Mercury Retention in Utility Gas Cleaning Systems with SCR/ESP/FGD Combinations or Activated Carbon Injection. Cleaner Combustion and Sustainable World. H. Qi and B. Zhao, Springer-Verlag Berlin Heidelberg and Tsinghua University Press: 267-276.
Kumar, S., S. Forand, et al. (2013). "Total Trihalomethanes in Public Drinking Water Supply and Birth Outcomes: A Cross-Sectional Study." Matern Child Health J. http://link.springer.com/article/10.1007%2Fs10995-013-1328-4
Leri, A. C. and S. C. B. Myneni (2012). "Natural organobromine in terrestrial ecosystems." Geochimica Et Cosmochimica Acta 77: 1-10. http://www.sciencedirect.com/science/article/pii/S0016703711006557
Liang, L. and P. C. Singer (2003). "Factors influencing the formation and relative distribution of haloacetic acids and trihalomethanes in drinking water." Environmental Science & Technology 37(13): 2920-2928. http://pubs.acs.org/doi/abs/10.1021/es026230q
Liu, S.-H., N.-Q. Yan, et al. (2007). "Using bromine gas to enahance mercury removal from flue gas of coal-fired power plants." Environmental Science and Technology 41: 1405-1412. http://pubs.acs.org/doi/abs/10.1021/es061705p
Liviac, D., E. D. Wagner, et al. (2010). "Genotoxicity of Water Concentrates from Recreational Pools after Various Disinfection Methods." Environmental Science and Technology 44: 3527-3532. http://pubs.acs.org/doi/abs/10.1021/es903593w
Luong, T. V., C. J. Peters, et al. (1982). "Influence of bromide and ammonia upon the formation of trihalomethanes under water-treatment conditions." Environmental Science & Technology 16(8): 473-479. http://pubs.acs.org/doi/abs/10.1021/es00102a009?journalCode=esthag
McDonnell, B. E. and D. L. Boccelli (2012). Controlling disinfection by-products within a distribution system through bubble aeration. WDSA 2012: 14th Water Distribution Systems Analysis Conference. Adelaid, South Australia
Mcilvaine, B. (2013). Big Market for Chemicals to Capture Mercury. www.mcilvainecompany.com. M. Company. Northfield, IL, McIlvaine Company
Meij, R. (1989). Tracking trace elements at a coal-fired power plant equipped with a wet-flue gas desulphurization facility. Kema Scientific & Technical Reports. 7: 267-335
Meij, R. (1991). "The Fate of Mercury in Coal-Fired Power-Plants and the Influence of Wet Flue-Gas Desulphurization." Water Air and Soil Pollution 56: 21-33. http://link.springer.com/article/10.1007%2FBF00342258
Meij, R. (1994). "Trace-Element Behavior in Coal-Fired Power-Plants." Fuel Processing Technology 39(1-3): 199-217. http://www.sciencedirect.com/science/article/pii/0378382094901805
Meij, R., L. H. J. Vredenbregt, et al. (2002). "The Fate and Behavior of Mercury in Coal-Fired Power Plants." Journal of the Air & Waste Management Association 52(8): 912-917. http://www.tandfonline.com/doi/pdf/10.1080/10473289.2002.10470833
NCI (1976). Report on the carcinogenesis bioassay of chloroform. Bethesda, MD, National Cancer Institute. NTIS-PB-264-018.http://ntp.niehs.nih.gov/ntp/htdocs/lt_rpts/trchloroform.pdf
Nieuwenhuijsen, M. J., M. B. Toledano, et al. (2000). "Chlorination disinfection byproducts in water and their association with adverse reproductive outcomes: a review." Occupational and
Environmental Medicine 57(2): 73-85. http://www.ncbi.nlm.nih.gov/pmc/articles/PMC1739910/pdf/v057p00073.pdf
NIH (2011). Chloroform. Report on Carcinogens, 12th Edition Niksa, S. and N. Fujiwara (2005). "Predicting extents of mercury oxidation in coal derived flue gases."
Journal of the Air & Waste Management Association 55(7): 930-939. http://www.ncbi.nlm.nih.gov/pubmed/16111132
Norberg-Bohm, V., J. Yanowitz, et al. (1988). Working Paper: Materials balance for bromine, chlorine, sulfur, and nitrogen in Europe. International Institute for Applied Systems Analysis. Laxenburg, Austria. WP-88-073.http://www.iiasa.ac.at/publication/more_WP-88-073.php
Obolensky, A. and P. C. Singer (2008). "Development and interpretation of disinfection byproduct formation models using the Information Collection Rule database." Environmental Science & Technology 42(15): 5654-5660. http://pubs.acs.org/doi/abs/10.1021/es702974f
Obolensky, A., P. C. Singer, et al. (2007). "Information collection rule data evaluation and analysis to support impacts on disinfection by-product formation." Journal of Environmental Engineering-Asce 133(1): 53-63. http://ascelibrary.org/action/showAbstract?page=53&volume=133&issue=1&journalCode=joeedu
Omine, N., C. E. Romero, et al. (2012). "Study of elemental mercury re-emission in a simulated wet scrubber." Fuel 91(1): 93-101. http://www.sciencedirect.com/science/article/pii/S001623611100336X
Pinkey, A. E., M. A. Friday, et al. (1992). PPRP: Nationwide survey of power plant aquatic toxicity issues. Maryland Power Plant Resarch Program. Columbia, MD, Maryland Department of Natural Resources.http://esm.versar.com/pprp/bibliography/feb02bib/pprp104.pdf
Plewa, M. J., E. D. Wagner, et al. (2004). "Chemical and biological characterization of newly discovered iodoacid drinking water disinfection byproducts." Environmental Science & Technology 38(18): 4713-4722. http://pubs.acs.org/doi/abs/10.1021/es049971v
Pourmoghaddas, H., A. A. Stevens, et al. (1993). "Effect of bromide ion on formation of HAA5 during chlorination." Journal American Water Works Association 85(1): 82-87. http://www.awwa.org/publications/journal-awwa/abstract.aspx?articleid=12967
Reif, J. S., M. C. Hatch, et al. (1996). "Reproductive and developmental effects of disinfection by-products in drinking water." Environmental Health Perspectives 104(10): 1056-1061. http://www.ncbi.nlm.nih.gov/pmc/articles/PMC1469476/
Rice, C. A. (2003). "Production waters associaed with the Ferron coalbed methane fields, central Utah: chemical and isotope composition and volumes." International Journal of Coal Geology 56(1-2): 141-169. http://www.sciencedirect.com/science/article/pii/S0166516203000867
Rice, C. A., M. S. Ellis, et al. (2000). "Water co-produced with coalbed methane in the Powder River Basin, Wyoming: Preliminary Compositional Data." U.S. Geological Survey Open File Report: 00-372. http://pubs.usgs.gov/of/2000/ofr-00-372/
Richardson, S. D. (2003). "Disinfection by-products and other emerging contaminants in drinking water." TrAC Trends in Analytical Chemistry 22(10): 666-684. http://dx.doi.org/10.1016/S0165-9936(03)01003-3
Richardson, S. D., F. Fasano, et al. (2008). "Occurrence and mammalian cell toxicity of iodinated disinfection byproducts in drinking water." Environmental Science & Technology 42(22): 8330-8338. http://pubs.acs.org/doi/abs/10.1021/es801169k
Richardson, S. D. and C. Postigo (2012). Drinking Water Disinfection By-products. Emerging Organic Contaminants and Human Health. D. Barcelo and A. G. Kostianoy. Barcelona, Spain, Springer. The Handbook of Environmental Chemistry. 20.
Richardson, S. D. and T. A. Ternes (2005). "Water analysis: Emerging contaminants and current issues." Analytical Chemistry 77(12): 3807-3838. http://pubs.acs.org/doi/abs/10.1021/ac200915r?journalCode=ancham
Richardson, S. D., A. D. Thruston, Jr., et al. (1999). "Identification of new drinking water disinfection byproducts formed in the presence of bromide." Environmental Science and Technology 33(19): 3378-3383. http://pubs.acs.org/doi/abs/10.1021/bk-2000-0761.ch026
Richardson, S. D., A. D. Thruston, et al. (2003). "Tribromopyrrole, brominated acids, and other disinfection byproducts produced by disinfection of drinking water rich in bromide." Environmental Science & Technology 37(17): 3782-3793. http://pubs.acs.org/doi/abs/10.1021/es030339w
Rodriguez, M., J. Serodes, et al. (2007). "Chlorinated disinfection by-products in drinking water according to source, treatment, season, and distribution location." Journal of Environmental Engineering and Science 6: 355-365. http://www.ingentaconnect.com/content/nrc/jees/2007/00000006/00000004/art00002?crawler=true
Rook, J. J. (1974). "Formation of haloforms during chlorination of natural waters." Water Treatment Examination 23: 234-243. http://www.jstor.org/stable/41268395
Root, E., W. Jones, et al. (2004). Rainwater chemistry across the United States, Carleton College. Sanchez-Polo, M., J. Rivera-Utrilla, et al. (2006). "Removal of bromide and iodide anions from drinking
water by silver-activated carbon aerogels." Journal of Colloid and Interface Science 300(1): 437-441. http://www.sciencedirect.com/science/article/pii/S0021979706002281
Sanchez-Polo, M., J. Rivera-Utrilla, et al. (2007). "Bromide and iodide removal from waters under dynamic conditions by Ag-doped aerogels." Journal of Colloid and Interface Science 306(1): 183-186. http://www.sciencedirect.com/science/article/pii/S0021979706009283
Schwartz, R. (2010a). MineSamples(CB). [Unpublished Data] Schwartz, R. (2010b). DEP_CDMO_Mine_Pool_Sampling_Run_Jan2010. [Unpublished Data]. Sherant, S. R. (2008). Trihalomethane control by aeration. Master of Science, The Pennsylvania State
University. Singer, P. C. (1994). "Control of disinfection by-products in drinking water." Journal of Environmental
Singer, P. C. (2004). "Disinfection by-products in US drinking waters: past, present and future." Water Science and Technology: Water Supply 4(1): 151-157. http://www.iwaponline.com/ws/00401/ws004010151.htm
Sloss, L. L. (1992). Halogen Emissions from Coal Combustion. London, UK, IEA Coal Research. IEA CR/45: 62.http://www.iea-coal.org.uk/report/80571/Emissions-and-effects/80877/Halogen-emissions-from-coal-combustion
Sollars, C., C. Peter, et al. (1982). Bromide in urban runoff -- water quality considerations. Exeter Symposium, Exeter, UK, IAHS
Srivastava, R. K., N. Hutson, et al. (2006). "Control of Mercury Emissions from Coal-Fired Electric Utility Boilers." Environmental Science and Technology: 1385-. http://pubs.acs.org/doi/pdf/10.1021/es062639u
Stanley, B. I. (2009). Bromide, chloride, and sulfate concentrations, and specific conductance, Lake Texoma, Texas and Oklahoma, 2007 - 2008, U.S. Geological Survey.http://pubs.usgs.gov/sir/2010/5120/pdf/sir2010-5120.pdf
Stanley, B. I., C. Churchill, et al. (2010). Bromide, chloride, and sulfate concentrations and loads at U.S. Geological Survey streamflow-gaging stations 07331600 Red River at Denison Dam, 07335500
Red River at Arthur City, and 07336820 Red River near DeKalb, Texas, 2007 - 09, U.S. Geological Survey http://pubs.usgs.gov/sir/2010/5120/
States, S., G. Cyprych, et al. (2013). "Marcellus shale drilling and brominated THMs in Pittsburgh, PA, drinking water." Journal of the American Water Works Association 105(8). http://www.awwa.org/publications/journal-awwa/abstract/articleid/38156568.aspx
Stewart, L. C. (1934). "Commercial Extraction of Bromine from Sea Water." Ind. Eng. Chem 26(4): 361-369. http://pubs.acs.org/doi/abs/10.1021/ie50292a002
Swaine, D. J. (1990). Trace Elements in Coal. London, Butterworths. Symons, J. M., S. W. Krasner, et al. (1993). "Measurement of THM and precursor concentrations
revisited - the effect of bromide ion." Journal American Water Works Association 85(1): 51-62. http://www.awwa.org/publications/journal-awwa/abstract.aspx?articleid=12964
Taylor, R. W. D. (1994). "Methyl bromide -- is there any future for this noteworthy fumigant?" Journal of Stored Products Research 30(4): 253-260. http://www.sciencedirect.com/science/article/pii/S0022474X94903174
Tewalt, S., J. C. Willett, et al. (2005). "The World Coal Quality Inventory: A status Report." International Journal of Coal Geology 63(1-2): 190-194. http://www.sciencedirect.com/science/article/pii/S0166516205000595
USEPA (1992). Framework for Decision Making: An EPA Perspective, U.S. Environmental Protection Agency Office of Water.http://yosemite.epa.gov/water/owrccatalog.nsf/e673c95b11602f2385256ae1007279fe/8b3a9767146920d385256b0600723a78!OpenDocument
USEPA (1992). Technologies and Costs for Control of Disinfection By-Products. Washington,DC, United States Environmental Protection Agency Office of Water
USEPA (1998). National Primary Drinking Water Regulations: Disinfectants and Disinfection Byproducts: Final Rule, Fed. Reg. 63:69389.http://www.epa.gov/OGWDW/mdbp/dbpfr.html>
USEPA (2000). ICR Auxiliary 1 Database Version 5.0 Query Tool Version 2.0, U.S. Environmental Protection Agency
USEPA. (2005, March 15, 2005). "Fact Sheet -- EPA's Clean Air Mercury Rule." Retrieved August 10, 2013.
USEPA (2005). Technologies and Costs Document for the Final Long Term 2 Enhanced Surfacd Water Treatment Rule and Final State 2 Disinfectants and Disinfection Byproducts Rule. Washington DC, United State Environmental Protection Agency Office of Water
USEPA (2008). "DBPCAN: EPA Water Disinfection By-Products with Carcinogenicity Estimates." http://www.epa.gov/ncct/dsstox/sdf_dbpcan.html.
USEPA (2009). Allen Plant FGD Purge Analytical Data. Washington,DC. DCN SE01809 USEPA (2009). Final Contaminant Candidate List 3 Chemicals: Screening to a PCCL. U. S. E. P. A. O. o.
Water. Washington DC USEPA (2009). Steam Electric Power Generating Point Source Category: Final Detailed Study Report.
Washington DC, U.S. Environmental Protection Agency USEPA. (2012). "EPA Fact Sheet: Mercury and Air Toxics Standards: Benefits and Costs of Cleaning Up
Toxic Air Pollution From Power Plants." from http://www.epa.gov/mats/pdfs/20111221MATSimpactsfs.pdf.
USEPA. (2012). "Key documents about Mid-Atlantic oil and gas extraction: Correspondence between PADEP and wastewater treatment facilities." Retrieved March 15, 2012, 2012, from http://www.epa.gov/region03/marcellus_shale/.
USEPA (2013). Environmental Assessment for the Proposed Effluent Limitations Guidelines and Standards for the Steam Electric Power Generating Point Source Category. Washington DC, United States Environmental Protection Agency Office of Water
Vainikka, P. and M. Hupa (2012). "Review of bromine in solid fuels. Part 1: natural occurrence." Fuel 95: 1-14. http://www.sciencedirect.com/science/article/pii/S0016236111007824
VanBriesen, J. M. and J. M. Wilson (2012). Energy Related Activities and Water Quality in Southwestern Pennsylvania. West Virginia Water Conference, Morgantown, WV.
Vanleeuwen, F. X. R., E. M. Dentonkelaar, et al. (1983). "Toxicity of Sodium-Bromide in Rats - Effects on Endocrine System and Reproduction." Food and Chemical Toxicology 21(4): 383-389. http://www.sciencedirect.com/science/article/pii/0278691583900923
Vanleeuwen, F. X. R. and B. Sangster (1987). "The Toxicology of Bromide Ion." Crc Critical Reviews in Toxicology 18(3): 189-213. http://informahealthcare.com/doi/abs/10.3109/10408448709089861
Volk, C., K. Bell, et al. (2000). "Impact of enhanced and optimized coagulation on removal of organic matter and its biodegradable fraction in drinking water." Water Research 34(12): 3247-3257. http://www.sciencedirect.com/science/article/pii/S0043135400000336
Von Gunten, U. (2003). "Ozonation of drinking water: Part II. Disinfection and by-product formation in presence of bromide, iodide or chlorine." Water Research 37(7): 1469-1487. http://www.sciencedirect.com/science/article/pii/S004313540200458X
Vosteen, B. W., R. Chang, et al. (2008). Mercury Abatement in Power Generation - Regulatory and Technical Status in the USA. VGB Workshop, Flue Gas Cleaning 2008, Vilnius, Lithuania.
Vosteen, B. W., R. Kanefke, et al. (2006). "Bromine-enhanced Mercurty Abatement from Combustion Flue Gases - Recent Industrial Applications and Laboratory Research." VGB PowerTech: International Journal for Electricity and Heat Generation 86(3): 70-75.
Watzlaf, G., K. Schroeder, et al. (2004). The passive treatment of coal mine drainages.http://www.netl.doe.gov/technologies/coalpower/ewr/water/pdfs/Passive%20Treatment.pdf
Wegman, R. C. C., P. Hamaker, et al. (1983). "Bromide-ion balance of a polder district with large scale use of methyl-bromide for soil fumigation." Food and Chemical Toxicology 21(4): 361-367. http://www.sciencedirect.com/science/article/pii/0278691583900893
Weinberg, H. S., S. W. Krasner, et al. (2002). The Occurrence of Disinfection By-Products (DBPs) of Health Concern in Drinking Water: Results of a Nationwide DBP Occurrence Study (EPA/600/R-02/068) Athens, GA. EPA/600/R-02/068 1-460
Westerhoff, P. (2008). Final Report, Summary of review panel comments for CALFED water quality program, Stage 1 final assessment. C.W.Q. program.http://www.science.calwater.ca.gov/pdf/reviews/WQ_review_panel_report_073008.pdf
WHO (2009). Bromide in drinking water: Background document for development of WHO Guidelines for Drinking-water Quality. Geneva, Switzerland, World Health Organization.http://www.who.int/water_sanitation_health/dwq/chemicals/Fourth_Edition_Bromide_Final_January_2010.pdf
Wilcox, J., E. Rupp, et al. (2012). "Mercury adsorption and oxidation in coal combustion and gasification processes." International Journal of Coal Geology 90-91: 4-20. http://www.sciencedirect.com/science/article/pii/S016651621100259X
Wilson, J. M. and J. M. VanBriesen (2013). Effects of oil and gas produced water management on surface drinking water sources in Pennsylvania. AEESP Conference, Colorado School of Mines, Goldon, CO.
Wilson, J. M., Y. Wang, et al. (2013). "Sources of high total dissolved solids to drinking water supply in Southwestern Pennsylvania." ASCE Journal of Environmental Engineering accepted and to appear(Special Issue on Shale Gas Environmental Impacts). http://ascelibrary.org/doi/abs/10.1061/%28ASCE%29EE.1943-7870.0000733
Winteringham, F. P. W., A. Harrison, et al. (1955). "The fate of labelled insecticide residual in food products. II -- the nature of methyl bromide residues in fumigated wheat." Journal of the Science of Food and Agriculture 6(5): 251-261.
Wollenberger, L., L. Dinan, et al. (2005). "Brominated flame retardants: Activities in a crustacean development test and in an ecdysteroid screening assay." Environmental Toxicology and Chemistry 24(2): 400-407. http://www.ncbi.nlm.nih.gov/pubmed/15720001
Woo, Y., D. Lai, et al. (2002). "Use of mechanism-based structure activity relationships analysis in carcinogenic potential ranking for drinking water disinfection byproducts." Environmental Health Perspectives 110(1): 75-87. http://www.ncbi.nlm.nih.gov/pmc/articles/PMC1241149/
Zevenhoven, R. and P. Kilpinin (2002). Control of pollutants in flue gases and fuel gases. As, Norway, The Nordic Energy Research Programme: Solid Fuel Committee.http://users.abo.fi/rzevenho/gasbook.html
Zhuang, Y., J. S. Thompson, et al. (2007). "Impact of calcium chloride addition on mercury transformations and control in coal flue gas." Fuel 86(15): 2351-2359. http://www.sciencedirect.com/science/article/pii/S0016236107000816
Ziemkiewicz, P. (2013). "Three Rivers Quest. Baseline River Water Quality Data Collection." Retrieved August 11, 2013, from http://3riversquest.org/.
Ziolkowski, L. (2010). Drinking Water Plant bromide monitoring in the Ohio River 2004-2010. personal communication to Jeanne VanBriesen; Email transmission of Excel File with Raw Data. Pittsburgh PA
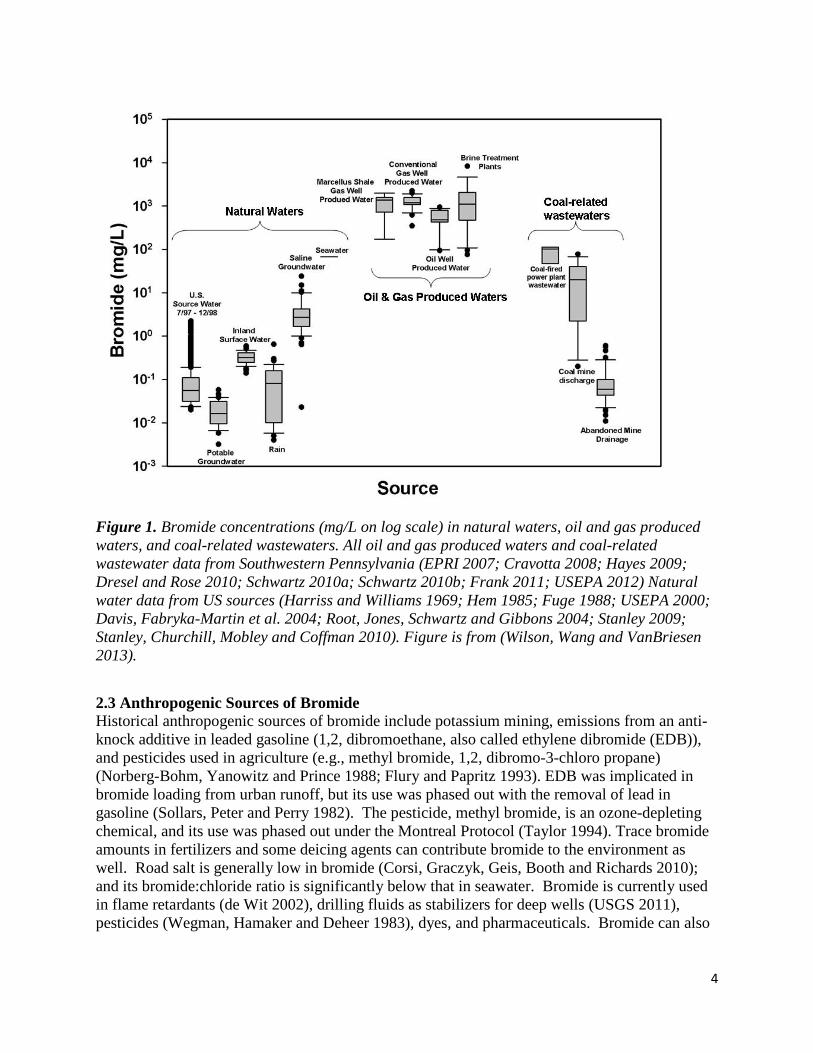

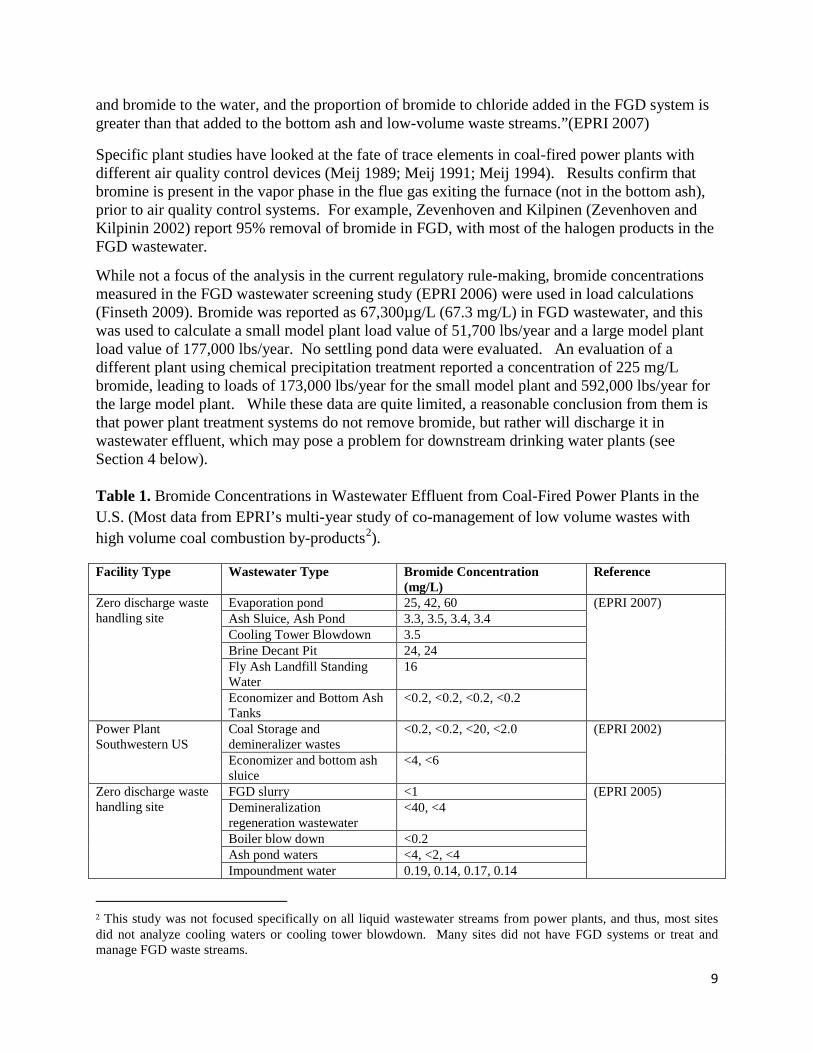
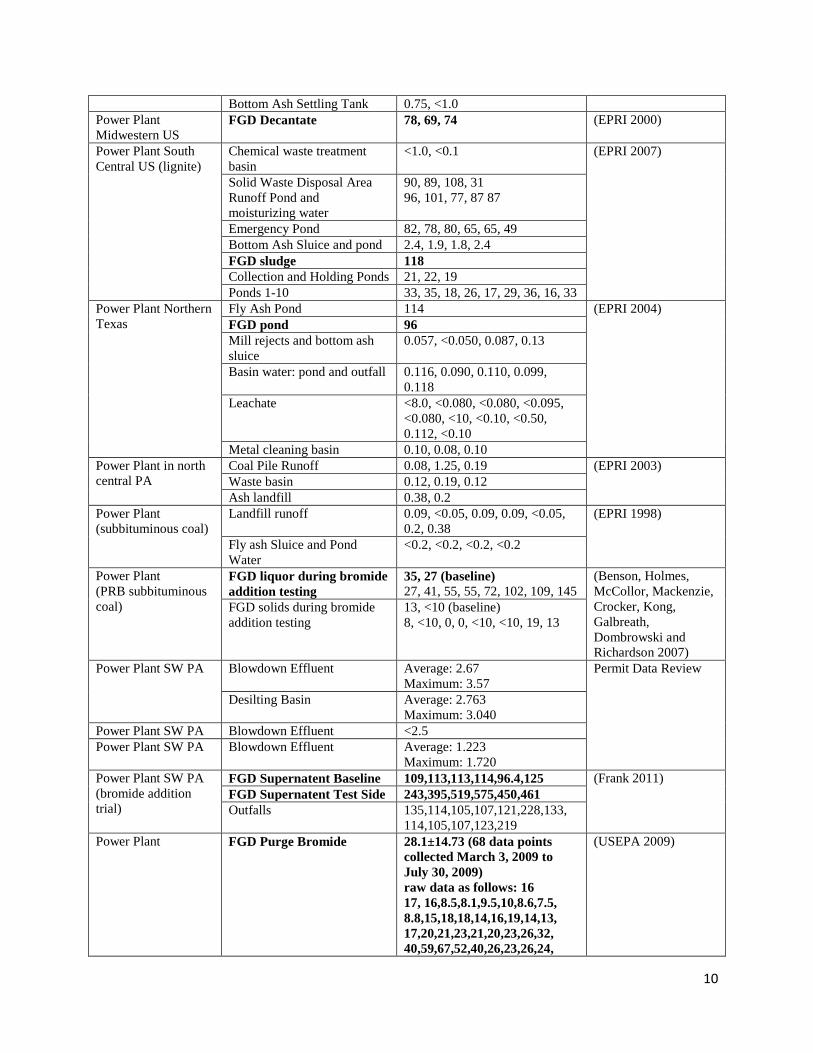
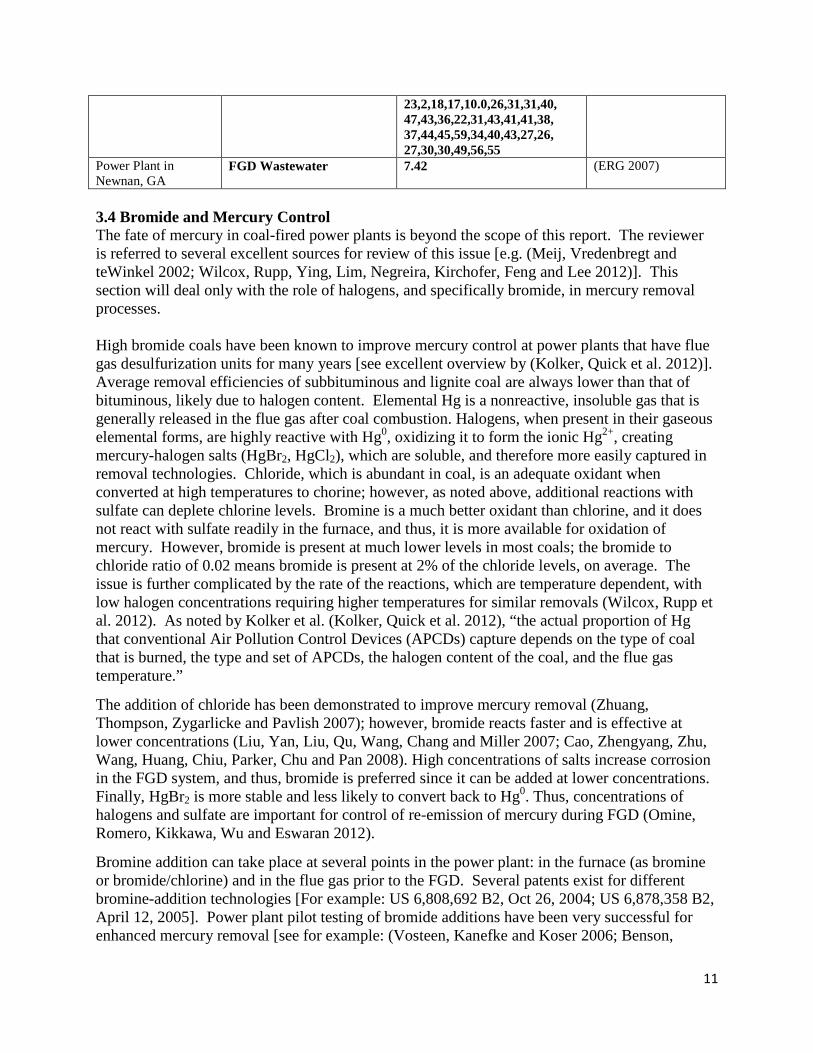
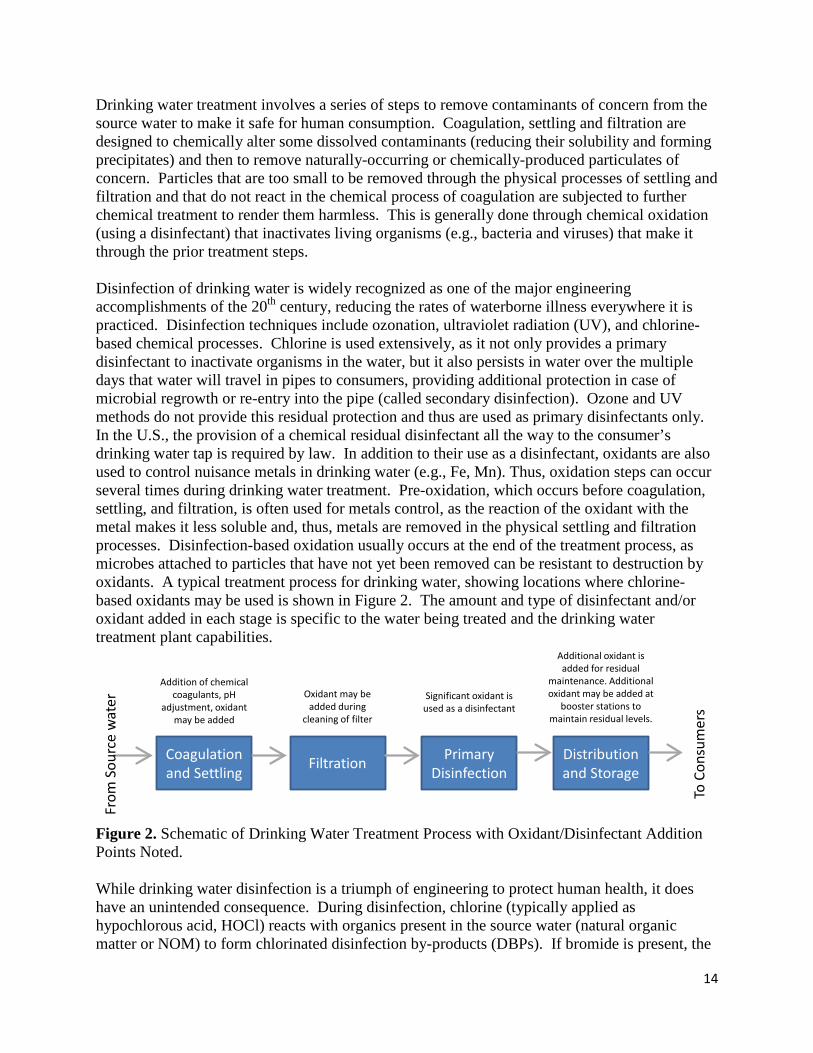
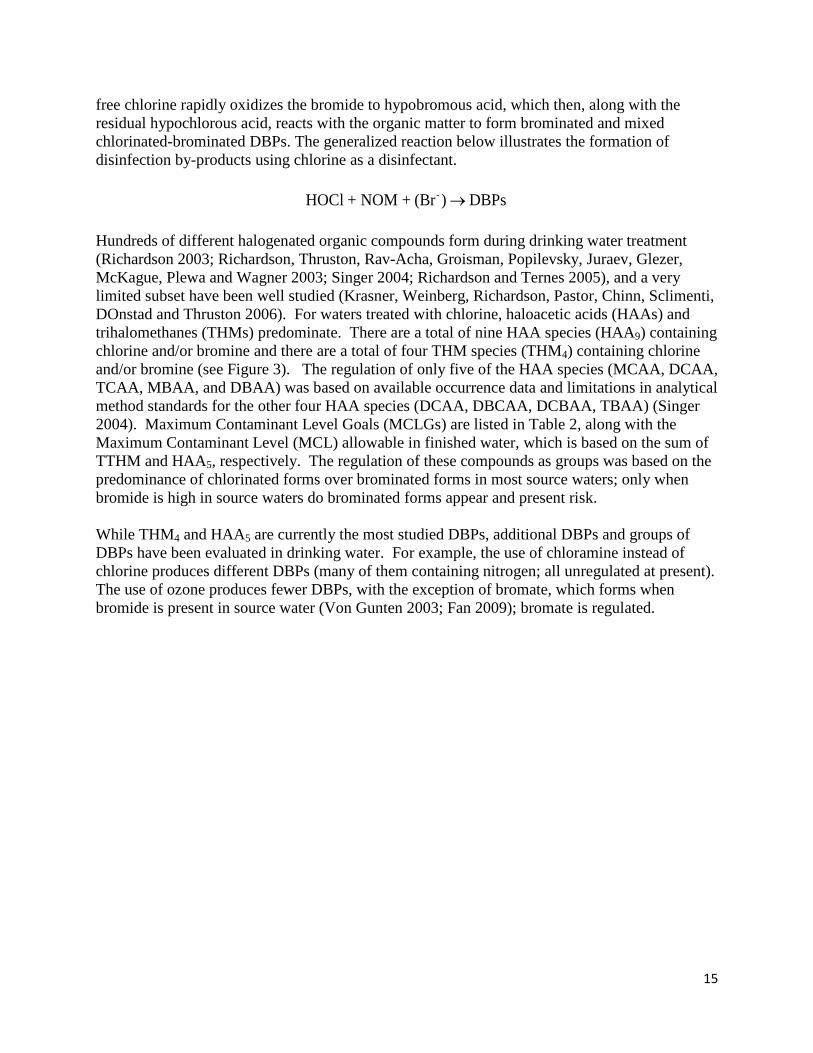
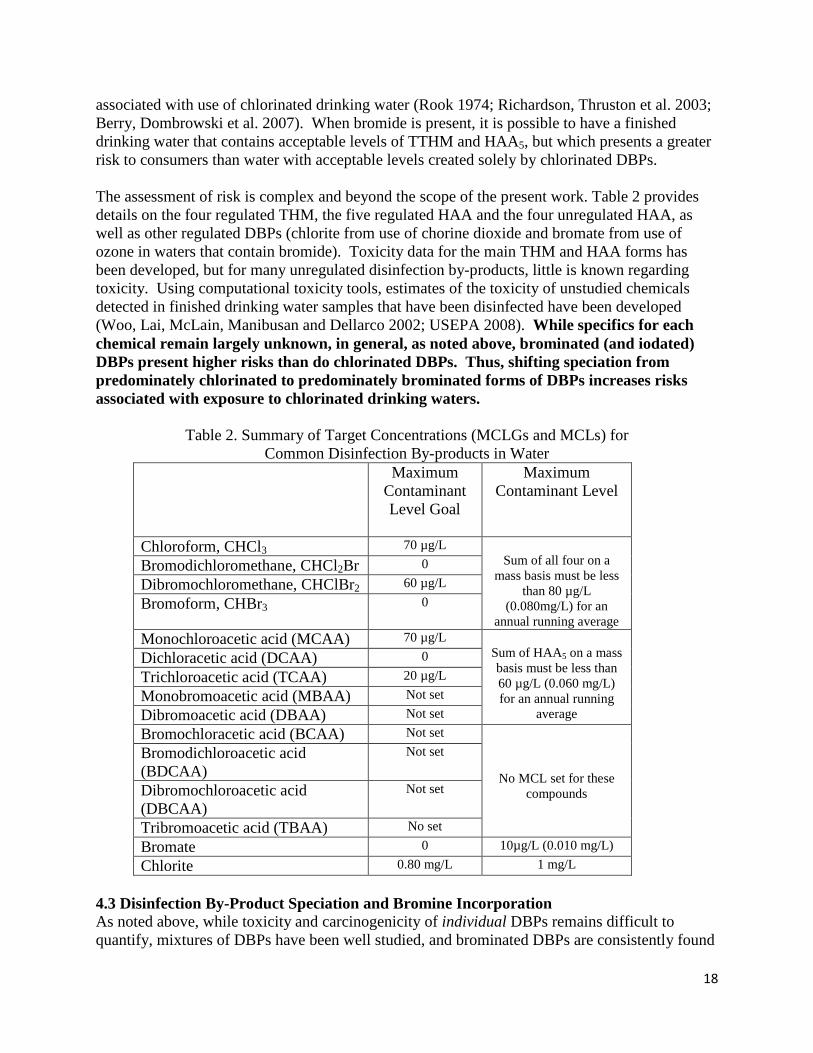
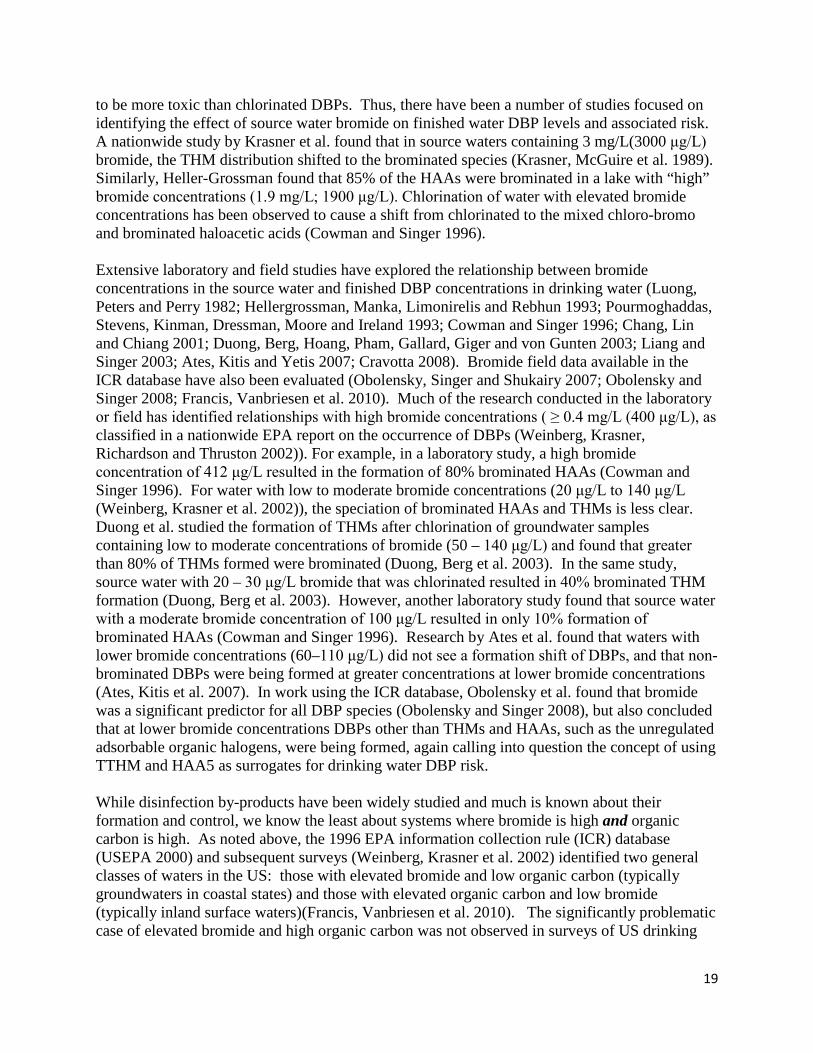
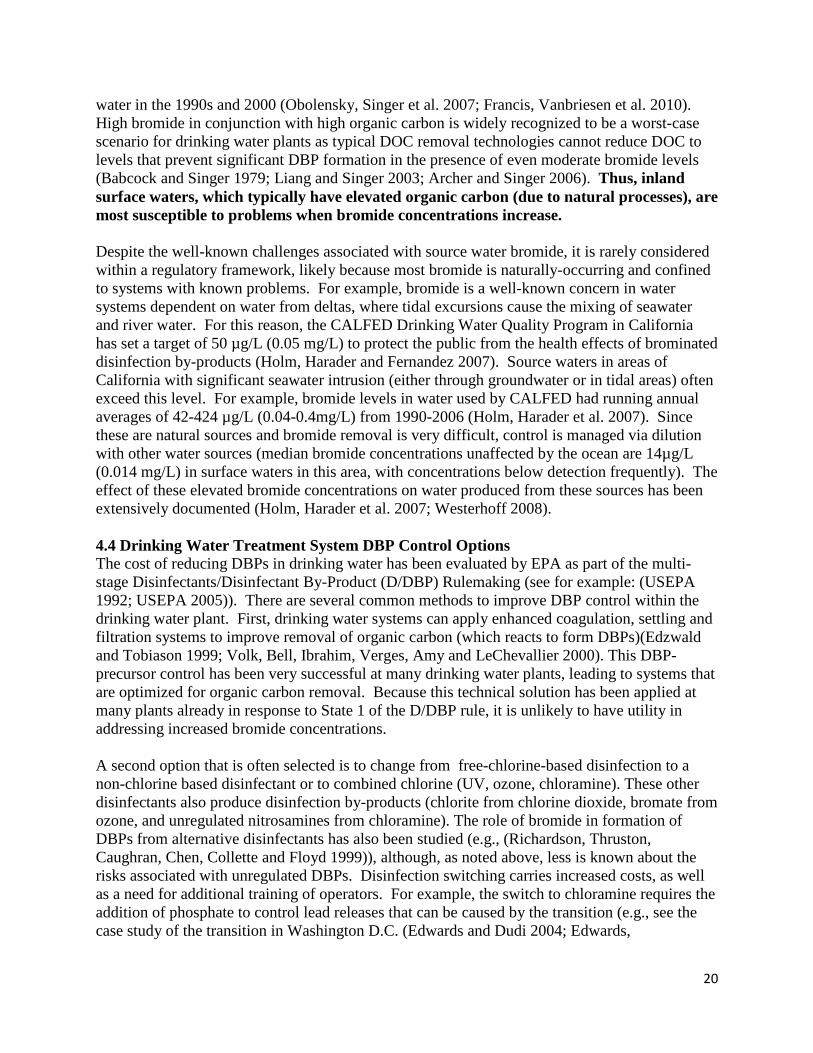
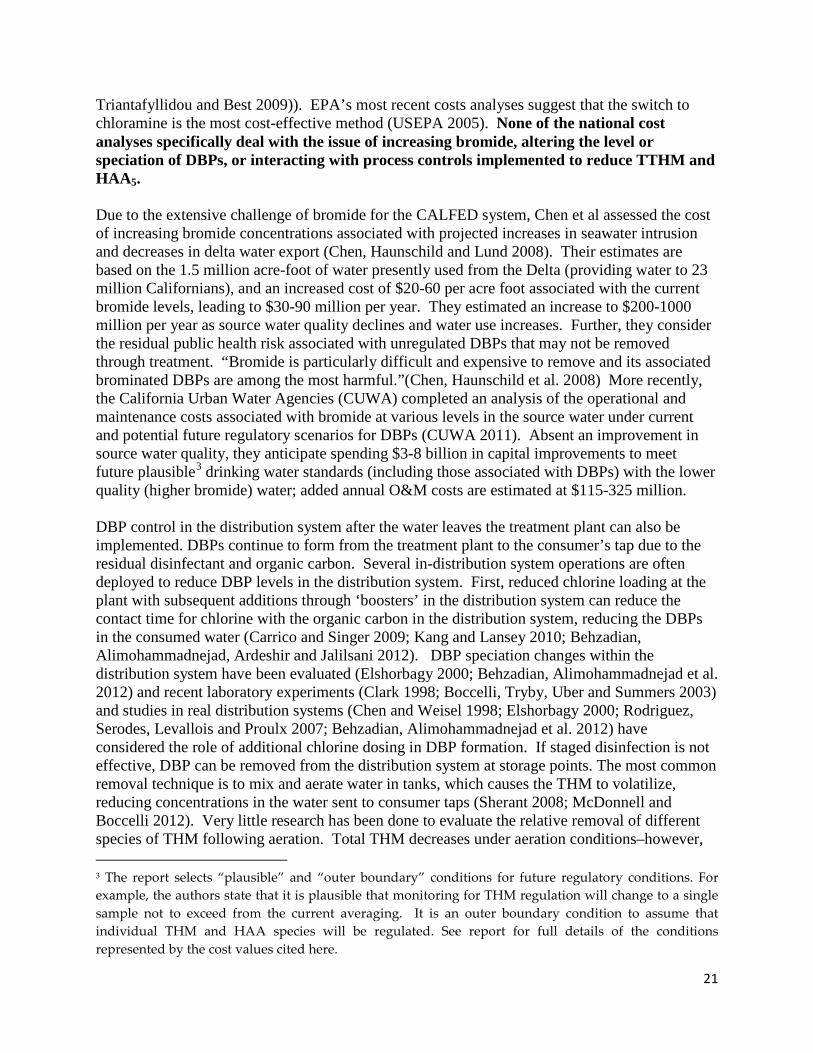


![AROMATIC BROMIDE COMPOUNDS the second - wako … · AROMATIC BROMIDE COMPOUNDS the second. 1 Aromatic Bromide [4595-60-2] 2-Bromopyrimidine 321-93491 5g 6,000 ... Br NBr N H O Br](https://static.documents.pub/doc/80x56/5be7cf8609d3f23a558cc514/aromatic-bromide-compounds-the-second-wako-aromatic-bromide-compounds-the.jpg)


