Page 1
Potential Soil Cleanup Objectives for Nitrogen-Containing Fertilizers at Agrichemical FacilitiesWilliam R. Roy and Ivan G. Krapac
OFS 2009-2 Institute of Natural Resource SustainabilityILLINOIS STATE GEOLOGICAL SURVEY
Page 2
© 2009 University of Illinois Board of Trustees. All rights reserved. For permissions information, contact the Illinois State Geological Survey.
Page 3
OFS 2009-2
Institute of Natural Resource SustainabilityWilliam W. Shilts, Executive DirectorILLINOIS STATE GEOLOGICAL SURVEYE. Donald McKay III, Interim Director615 East Peabody DriveChampaign, Illinois 61820-6964217-333-4747www.isgs.illinois.edu
Potential Soil Cleanup Objectives for Nitrogen-Containing Fertilizers at Agrichemical FacilitiesWilliam R. Roy and Ivan G. Krapac
Page 5
1
Abstract
Accidental and incidental chemical releases of nitrogen-containing fertilizers occur at retail
agrichemical facilities. Because contaminated soil may threaten groundwater quality, the facility may
require some type of site remediation. The purpose of this study was to develop soil cleanup
objectives (SCO) that are protective of groundwater quality in Illinois for unintentional releases of
nitrogen-containing fertilizers Illinois. The concepts of the Soil Screening Levels of the U.S.
Environmental Protection Agency were used to derive SCOs for nitrogen as nitrate and as
ammonium. The Soil Screening Levels are based on the solute transport mechanisms of sorption,
volatilization, and groundwater dilution, and the contaminant-specific groundwater cleanup objective
used to derive the SCO. Because nitrate is relatively unreactive, only groundwater dilution could be
taken into account in the derivation of a SCO. It may be preferable to use agronomic application
rates to derive default nitrate SCOs. A default soil cleanup objective for N as ammonium was based
on soil water dilution, and the amount of ammonium sorbed that is in equilibrium with the amount
in soil water. The extent of sorption was measured using an uncontaminated, surface-soil sample (0
to 15 cm) of 10 different soil types that occur in Illinois and three gravel-fill samples from three
different agrichemical facilities. There has been a concern, however, about the possibility that
ammonium in soil and groundwater will rapidly convert to nitrate and nitrite. A field study was
conducted following the release of anhydrous ammonia at an agrichemical facility. Soil-fill samples
were collected for 488 days after the initial release. Extracts of the fill samples were used as a
measure of water-soluble nitrate and ammonium. The results suggested that the rate of nitrification
was limited, and may have been the result of alkaline conditions in the spill area. An analysis of
groundwater data from three other agrichemical facilities suggested that ammonium in groundwater,
following a major release, was relatively persistent. These studies did not support the assumption
that nitrification in a spill scenario is rapid. In order to provide an environmentally conservative
default SCO that takes into account the potential for long-term nitrification, one third of the US
EPA’s Lifetime Health Advisory Level for ammonium in drinking water (30 mg/L) was used to
derive default SCOs for Class I and II groundwater. This approach can also be used to generate site-
specific SCOs for nitrogen as nitrate and as ammonium for site cleanups.
Page 6
2
Introduction
An agrichemical facility is a commercial agricultural chemical sales and customer application
business. These facilities store, sell, mix, load, and apply fertilizers to fields for farmers. Bulk liquid
and dry fertilizers are typically mixed, repackaged, or transferred from one container to another.
Accidental and incidental chemical releases such as spills, tank leaks, hose breaks, and transport
accidents, can result in significant contamination of surface soils. The gravel fill and soil at an
agrichemical facility may contain nitrogen as nitrate (NO3), ammonia (NH3), and/or ammonium
(NH4). Because contaminated soil may threaten groundwater quality, the facility may require some
type of site assessment and remediation. During a site assessment, typically soil cores are collected
in various locations where chemical spills may have occurred such as areas where fertilizers are
loaded and or mixed. Discrete samples are then collected from each core and analyzed to estimate
the lateral and vertical distribution of the contaminants. However, before site remediation can
proceed, some type of remediation or soil cleanup objective (SCO) must be determined. A common
remediation approach used in Illinois for nitrogen-containing fertilizers is to remove a sufficient
volume of contaminated material such that groundwater quality will not be significantly impacted
by the leaching of nitrogen compounds from the remaining material. Therefore, when a volume of
material contains the contaminant in concentrations greater than the SCO, the material is excavated.
The selection of the SCO is critical to the assessment process because the value applied will
determine how much material will be removed, which in turn can be a major factor contributing to
the costs of site cleanup. In Illinois, once the volume of contaminated material is estimated, it is
excavated then either land applied off-site or placed in a landfill. A guidance document for
conducting site assessments at agrichemical facilities is available (Roy and Krapac, 2006).
The establishment of soil cleanup objectives for nitrogen-containing fertilizers is in a state of flux,
and there are few objectives that have been published (Table 1). For example, the Minnesota
Department of Agriculture, uses a soil cleanup goal for nitrate as nitrogen of 150 to 200 mg N/kg
(MDA, 2003). The soil cleanup goal for total Kjeldahl nitrogen is 5,000 mg/kg for the upper 61 cm,
and 1,000 mg/kg for depths greater than 61 cm. Total Kjeldahl nitrogen is a measure of the
concentration of reduced forms of nitrogen, principally, ammonium and amino forms of organic
Page 7
3
nitrogen. The Illinois Environmental Protection Agency currently uses a SCO of 200 mg/kg of
nitrogen for Class I groundwater, and a combination of 200 mg/kg nitrate plus 600 mg/kg
ammonium for Class II groundwater (T. C. Hornshaw, personal communication, 2004). The Illinois
Department of Agriculture established an administrative rule [8 IAC. Part 259] that outlines the
requirements and options for conducting site assessments at retail agrichemical facilities in Illinois.
The rule provides information about soil cleanup objectives for the remediation of pesticide-
contaminated soil at agrichemical facilities. Commercial fertilizers were recently added to the scope
of the rule [415 ILCS 60/19.3]. Prior to this study, however, contained no criteria for the derivation
of soil cleanup objectives for nitrogen-containing fertilizers. The purpose of this study was to derive
Soil Cleanup Objectives (SCO) for nitrogen as nitrate and as ammonium that are protective of
groundwater quality in Illinois.
Approach
The Illinois Department of Agriculture established an administrative rule [8 AC. Part 259] that
provides default SCOs for pesticides and a method for developing site-specific SCOs. These SCOs
were derived from the application of Soil Screening Levels (SSLs) developed by the U.S.
Environmental Protection Agency (U.S. EPA, 1996a,b). The resulting soil-cleanup levels are based
on the movement and chemical fate of a given contaminant in soil-water systems, viz.,
SCO = Cw[(Kocfoc) + (2w + (2aH))Db-1] [1]
where,SCO = soil cleanup objective (mg/kg)
Cw = target groundwater concentration (mg/L)
Koc = organic carbon partition coefficient (L/kg)
foc = organic carbon content of soil (kg/kg)
2w = water-filled soil porosity (Lwater/Lsoil)
2a = air-filled soil porosity (Lair/Lsoil)
H = Henry’s Law constant as KH (Henry’s Law constant as atm-m3/mol)
x [R (gas constant) x T (temperature as degrees Kelvin)]
Db = dry soil bulk density (kg/L),
Page 8
4
and Cw = {GW obj x [1 + (KidW/rLW)]} [2] where, GW obj = groundwater cleanup objective (mg/L)
K = aquifer hydraulic conductivity (m/yr)
i = hydraulic gradient (m/m)
d = mixing zone thickness (m)
r = groundwater recharge rate (m/yr)
L = length of contaminated soil parallel to groundwater flow (m)
W = width of contaminated soil perpendicular to groundwater flow (m)
To derive SCOs for nitrogen fertilizers, Eq. [1] was recast in a different form. Neither nitrate nor
ammonium volatilize from water significantly, and hence H was set to 0.0. Eq. [1] was derived for
hydrophobic solutes whereas nitrate and ammonium are ions. However, because Kocfoc = Kd, a
sorption constant, and Cw x Kd = the amount sorbed per mass of sorbent (x/m), then it follows that
SCO = x/m + (Cw2w)/Db [3]
In this study, the default values (see rule Roy and Krapac, 2006) for water-filled porosity (0.2 L/L)
and for dry bulk density (1.6 kg/L) were used. The amount sorbed was evaluated at C = Cw. Hence,
SCOs were calculated from
SCO (mg/kg) = x/m (mg/kg) + 0.125 (L/kg) Cw (mg/L) [4]
Potential for Nitrification of Ammonium
The application of these SCOs, however, is complicated by the potential for ammonium to be
converted into either nitrate or nitrite. Bacteria called Nitrobacter can convert ammonium into
nitrate:
NH4+ + Nitrobacter + 3H2O º 10H+ + NO3
- [5]
Ammonium can be converted to nitrite via Nitrosomonas bacteria, although the reaction is slow.
NH4+ + Nitrosomonas + 2H2O º 8H+ + NO2
- [6]
Page 9
5
Once ammonium is sorbed via ion exchange by colloidal materials, it is no longer available to leach
into groundwater. However, if the bound ammonium is desorbed back into solution, it may be
subject to conversion to nitrate. Buss et al. (2003) generalized that if the movement of ammonium
is not limited by cation exchange such as would be expected in sand and gravel aquifers, that
nitrification can be the major process controlling the fate of ammonium in groundwater. The soil
chemistry of nitrogen in agricultural fields has been studied extensively, but the potential for aerobic
and anaerobic nitrification of ammonium in a chemical spill scenario has not been studied as well.
Laboratory studies were conducted in this investigation to determine the ammonium sorption
characteristics of selected soils commonly found in Illinois.
Field Study
On November 13, 2003, there was an accidental release of about 8,000 gallons of anhydrous
ammonia at an agrichemical facility in east-central Illinois. The identity of the site is confidential.
A worker was unloading a semi-truck when a transfer hose ruptured from a bulk tank. A large plume
of ammonia gas formed, and residents in the area were evacuated. The local volunteer fire
department sprayed water in the spill area before the residents were allowed to return. The solubility
of ammonia in water is about 34% at 25°C. Because of the water applied to the spill area, some of
the ammonia was likely converted to ammonium hydroxide which can dissociate resulting in a
relatively alkaline area:
NH3 + H2O º NH4OH º NH4+ + OH- [3]
The dissociation constant for ammonium hydroxide is 1.77 x 10⁻⁵ at 25°C. At a pH of 9.25, about
50% of the chemical is as dissolved ammonia (NH3), and 50% occurs as the ammonium cation
(NH4+).
The areal distribution of ammonia was easily defined by the odor of the chemical at the surface. The
odor threshold for ammonia is about 18 :g/L in air. Because the spill was documented and the area
impacted was relatively small, it appeared that the facility could be used as a study site to provide
Page 10
6
information on the biogeochemical fate of nitrogen in the context of establishing soil cleanup
objectives.
The goal of the field study was to provide information on the extent and rate of nitrogen conversions
in a chemical spill scenario. It was not within the scope of the effort to delineate the 3-dimensional
distribution of ammonium in the spill area for the purpose of site remediation. The results of this
study may, however, provide much of the information needed to form a remedial plan to remove the
contaminated fill and soil.
Methods and Materials
Laboratory Study
The sorption of ammonium was measured using an uncontaminated, surface soil (0 to 15 cm) sample
collected from 10 different soil types that occur in Illinois and three uncontaminated gravel-fill
samples from three different agrichemical facilities (Table 2). Of the ten soil types, six cover areas
greater than 40,000 ha in Illinois. Five are Mollisols (prairie soils), two are Alfisols (forest soils),
and two are Entisols (lacking a well-developed B horizon). These ten soils represent about 22.4%
of the acreage in Illinois. The three fill samples were described in Roy et al. (1999). The sorption of
ammonium by soil and fill samples was measured using the batch equilibrium procedures given in
Roy et al. (1992). In brief, the soil samples were air dried and sieved to pass a 2-mm sieve. A series
of soil:solution ratios ranging from 1:4 to 1:500 (mass/volume) were made in 125-mL polyethylene
bottles, and mixed with 13 solutions containing NH4-N concentrations ranging from 0 to 400 mg
NH4-N/L. Care was taken to minimize head space within the bottles. The solutions were mixed in
a shaking water bath at 25°C for 24 hours. Kinetic data (not shown) indicated that 24 hours was
sufficient to attain equilibrium. The liquid phase was then separated using a temperature-controlled
centrifuge. Water-soluble ammonium was determined using an ion selective electrode (APHA,
1992). The amount of ammonium sorbed was calculated by difference between the initial solute
concentration and the final solute concentration after mixing. In this study, the sorption isotherms
were used to calculate the amount of ammonium sorbed that is in equilibrium with the amount of
ammonium in solution, Cw.
Page 11
7
Soil texture was determined using the pipette method of Indorante et al. (1990) on the < 2-mm
fraction of each soil sample. Cation exchange capacity (CEC) was determined using the method of
Sumner and Miller (1996) in which the CEC is measured at the reaction pH of the soil using an
unbuffered NH4Cl solution. Surface area was measured by nitrogen sorption using a Monosorb
single-point surface analyzer (Quantachrome Instruments, Boynton Beach, Florida). Organic carbon
was determined using a CE 440 CHN Elemental Analyzer (Exeter Analytical, Inc, North
Chelmsford, Massachusetts). This was a diverse group of sorbents (Table 2). Reaction pH, for
example, ranged from 4.8 to 8.5. The cation exchange capacity ranged from 0.04 meq/100 g (Fill 28-
4) to 21.8 meq/100 g (Drummer silty clay loam).
Field Study
In the field study, gravel fill-soil cores were collected at the facility during eight sampling efforts
corresponding to 19, 98, 137, 208, 251, 347, 396, and 488 days after the anhydrous spill. During each
effort, the soil cores were collected by driving 60-cm long Shelby tubes into the surface using a
fence-post driver. The tubes were sealed immediately after they were pulled out of the ground and
stored in a cold room at 4° C. The tubes were cut open using a plasma torch, and sampled at 5- or
10-cm intervals. Each of the samples removed from the cores was extracted with deionized water
to provide a measure of water-soluble ammonium and nitrate. A 20-g sample from the cores was
mixed with 130 mL of deionized water and mixed for 24 hours using an NBS Rotating Tumbler. The
suspensions were then centrifuged at 5000 rpm for 15 minutes. The liquid phase was characterized
in terms of pH, specific conductance (EC), and ammonium using specific ion electrodes. The
solution concentrations of chloride, nitrate, and sulfate were determined using a Dionex 2110i ion
chromatograph, following U.S. EPA Method 300.0 (Pfaff et al., 1991).
Page 12
8
Results and Discussion
Laboratory Study
Nitrogen as Nitrate Default SCO
Nitrate is a monovalent anion, and as such, is not significantly sorbed by the dominantly negatively
charged soils. Nitrate is generally considered to be mobile in saturated soil-water systems.
Consequently, if we set x/m = 0 in Eq. [4], then
SCO (mg/kg) = 0.125 (L/kg) Cw (mg/L) [5]
The groundwater quality standard for nitrogen as nitrate in Class I groundwater is 10 mg N/L [35
IAC. Part 620]. Using the default groundwater dilution factor of 30 (see Roy and Krapac, 2006), and
the nitrate standard as the groundwater objective (Gwobj) results in a target groundwater
concentration (Cw) equal to 300 mg/L (10 mg/L x 30 dilution factor), and then the default nitrate
SCO = 37.5 mg N/kg via Eq. [5]. For Class II groundwater, Gwobj is 100 mg N/L and Cw equals
3,000 mg N/L. Hence, the default nitrate SCO for Class II groundwater would be 375 mg N/kg.
Nitrogen as Ammonium Default SCO
Ammonium was sorbed by the 10 soil and three gravel fill samples (Fig. 1, for example) in the
relative order Drummer > Flanagan > Tama > Muscatune > Fayette > Catlin, Elsah > Cisne > Fill
38-1 > Pike County 2 > Fill 7-1, Plainfield, Fill 28-4. The sorption isotherm data for seven of the
sorbents were best described by the Freundlich Equation:
x/m = KfC1/n [6]
where x/m is mass of sorbate per mass of sorbent
Kf = the Freundlich constant (L/kg)
C = the equilibrium concentration of ammonium (mg/L)
1/n = the Freundlich exponent
Page 13
9
The sorption of ammonium for the Fayette, Plainfield, Pike County 2 soils and all the gravel fill
samples conformed best to a Langmuir-type equation, viz.,
x/m = KLMC/(1 + KLC) [7]
where x/m is mass of sorbate per mass of sorbent
KL = the Langmuir constant (L/mg)
C = the equilibrium concentration of ammonium (mg N/L)
M = the Langmuir capacity (mg N/kg)
For each soil sample, the isotherm equation that best fit the data (Table 3) was used to calculate the
amount sorbed (x/m) in equilibrium with the target groundwater concentration, (Cw) via Eq. [4].
We adopted the concepts used in developing the US EPA Lifetime Health Advisory Level (LHAL)
for ammonium in drinking water of 30 mg N/L to determine an appropriate ammonium groundwater
cleanup objective (GWobj). Health Advisories are estimates of the concentration of a chemical in
drinking water that is not expected to cause any adverse noncancer effects after a lifetime of
exposure. In order to provide a level of safety, and to provide a target groundwater concentration
(Cw) that would be representative of the concentrations used to generate the sorption constants for
the 13 soil materials, one third (10 mg N/L) of the LHAL was chosen as the GWobj. Using the default
groundwater dilution factor of 30 resulted in a target groundwater concentration (Cw) of 300 mg
N/L. The resulting soil cleanup objectives for Class I groundwater for the 13 soil materials via Eq.
[4] ranged from 94 to 3,001 mg N/kg (Table 4). For Class II groundwater, the Cw (1,500 mgN/L)
was determined by increasing the Gwobj by a factor of 5 (as per the statue) and using the default
groundwater dilution factor. The SCOs for Class II groundwater ranged from 252 to 7,344 mg N/kg
(Table 4). Because these soils are representative of the range of soil properties in Illinois, the SCOs
are also representative of the likely range of site specific SCOs that would likely be determined at
most agrichemical facilities.
Page 14
10
Relationship Between Soil Cleanup Objectives for Ammonium and Soil Properties
In this investigation we tried to predict soil cleanup objectives based on soil properties such as cation
exchange capacity, surface area, organic carbon, clay content, and pH. Potential relationships
between the ammonium soil cleanup objectives and soil properties were characterized by the
application of statistical models: linear [8], quadratic [9], and cubic [10]:
SCO = aS + b [8]
SCO = aS2 + bS + c [9]
SCO = aS3 + bS 2 + cS + d [10]
where S represents the value of a soil property, and a, b, c, and d are empirical constants.
In addition, a multiple regression was performed using all of the soil properties to predict SCO. A
regression coefficient was calculated for each model and the significance of that property to predict
SCO was determined.
The SCO calculated for each of the 13 soils was positively correlated with cation exchange capacity
(CEC), clay content, surface area, and organic carbon (Table 5). For many soils, a direct relationship
exists between CEC and organic matter (measured as organic carbon). Stevenson (1982)
summarized that organic matter alone can account for 25 to 90% of the CEC of surface soil samples.
A correlation between CEC and SCO was expected because the sorption of ammonium by soil is
generally dominated by a cation exchange mechanism that is reflected by the CEC of the material.
As shown in Fig. 2, CEC alone could account for about 91% of the variance in the Class I
groundwater SCO using a cubic model:
SCO = 0.36(CEC)3 - 8.93(CEC) 2 + 143(CEC) + 103 [11]
Page 15
11
The cubic model for all soil properties provided the best estimate of an individual soil property to
predict SCO (Table 5). For example the linear model for CEC yielded a correlation coefficient (r2)
of 0.86 while the cubic model’s coefficient was 0.91 for Class I groundwater. Clay content and CEC
were the best (largest coefficients) soil properties in predicting SCOs. When all of the soil properties
were considered simultaneously, the application of multiple regressions resulted in slightly larger
coefficients (0.94 and 0.96) than those determined using only CEC or clay content at P = 0.01.
Using the models for Class I groundwater in Table 6, SCOs were calculated for the 10 soils using
either clay, CEC, or all soil properties (multiple) (Fig. 3). Generally, using either the clay or CEC
models resulted in the smallest SCOs. For 40% of the soils, the clay model predicted smaller SCOs
than either the CEC or multiple models. Similarly, for 40% of the soils, the CEC model predicted
smaller SCOs than either the clay or multiple models. The average difference in SCOs between all
three models was 259 mg/kg. Catlin exhibited the greatest difference in predicted SCOs with the
CEC model estimating a SCO 517 mg/kg greater than the clay model.
These results suggest that either the CEC or the clay content of a soil, in lieu of making formal
sorption measurements, could be used to predict site-specific soil ammonium cleanup objectives.
These soil properties can be measured using standard protocols, and they are commonly preformed
by accredited soil testing laboratories (as defined in [8 IAC. Part 259]) allowing these data to be
accurately and rapidly collected. The use of multiple soil properties to determine a site-specific
ammonium SCO can slightly increase the reliability (greater regression coefficient) to predict
sorption, but the costs associated with determining each soil property may outweigh the benefits.
Thus, there is the potential to determine a site-specific ammonium SCO based on the local soil CEC
and/or clay content and the cubic equations provided in Table 5 rather than using default SCOs. In
general, if the CEC or clay content of a site soil is greater than 10 cmol/kg or 21.4%, respectively,
and if it is underlain by Class I groundwater, it could be advantageous to the site owner to determine
a site-specific SCO rather than to use the default SCO. If a site is underlain by Class II groundwater,
a CEC and/or clay content greater than 8.7 cmol/kg and 21.8%, respectively would likely yield a site-
specific ammonium SCO that is greater than the default. Using Table A-3 in the appendix and a soil
Page 16
12
survey map, an initial estimate of the site-specific CEC can be made with the subsequent analytical
determination of soil samples for the CEC to better define the range in CEC at the site.
Soil Sample Collection Within the Spill Area
As shown in Fig. 4, soil cores were collected in four general areas; the spill area where the hose
ruptured, and in three areas (nests 1, 2, 3) away from the spill area. The gravel layer at the sample
locations varied in thickness from 5 to 11 cm with a mean of 7.3 ± 1.5 cm. The material below
the gravel layer was a soil-fill mixture. Some of the mixed layers also contained pieces of concrete,
clay tile, metal bolts, slag, and gravel. The texture of selected fill samples ranged from silty clay
loam to loamy sand; the surface samples were typically sandier (Table 6). The organic carbon
content ranged from 0.49 to 3.09% with a mean of 1.59 ± 0.99%. Roy et al. (1994) reported that the
mean organic carbon content of 27 fill samples collected at nine different agrichemical facilities was
0.92%. The surface area of the samples ranged from 2.7 to 16.9 m2/g. Roy et al. (1994) also reported
that the mean surface area of the 27 fill samples was 5.57 m2/g.
As shown in Fig. 5, the distribution of water-soluble ammonium in the spill area was extremely
variable. For example, 19 days after the release, ammonium was detected in concentrations ranging
from 757 to 2,168 mg N/kg. Background cores collected away from the spill (G3 and G15) yielded
<0.3 mg N/kg. Similarly, the concentrations of water-soluble nitrate in the upper 25 cm of the
profiles did not seem to be related to the time of sampling since the initial spill (Fig. 6). The
concentration of nitrate in the extracts, however, appeared to increase with time in samples collected
at depths greater than about 30 cm. For example, the amount of nitrate at 50 cm 19 days after the
spill was about 0.84 mg N/kg. After 488 days, samples collected in the spill area yielded about 517
mg N/kg at the same depth. An alternative approach of presenting the data is given in Fig. 7.
Samples collected at the 32-cm depth yield increasingly greater amounts of nitrate but less
ammonium during the 488-day study. The increase in the amount of water-soluble nitrate could have
been the product of nitrification that converted the ammonium to nitrate. When the ratio of
ammonium to nitrate was plotted as a function of depth for each sampling date, the ratio of the two
Page 17
13
forms of nitrogen increased in the lower (deeper than 30 cm) part of the profile (Fig. 8) since the
initial release. The increase in the NH4/NO3 ratio could have resulted from nitrification.
The interpretation of the field data, however, is complicated because the agrichemical facility was
operational during the project period. The cores collected 19 and 98 days after the initial release were
collected during the winter months of 2003-2004 when activities at the facility were minimal.
However, the cores collected 137 and 208 days since the spill were collected when fertilizers were
being applied to fields. Smaller, incidental spills of anhydrous ammonia could have added new
ammonium to the study area. For example, when the 488-day cores were collected during the spring
of 2005, anhydrous ammonia was being pumped from a semi-truck into the ammonia tank in the
study area. When the hose was disconnected, anhydrous ammonia was released near the original
spill, resulting in two small areas that were contaminated. Note the apparent increase in ammonium
in the surface sample of the 488-day core (Fig. 5). Moreover, not all the nitrate nor ammonium may
have been derived from the initial ammonia release. Dry fertilizers were stored in open stalls next
to the spill area. The nitrogen-containing fertilizers were urea 46-0-0 (CO(NH2)2), and diammonium
phosphate (DAP 18-46-0). The facility also stored potassium chloride (potash) and calcium
phosphate (Triple Superphosphate). The dry fertilizers could have been blown or had swept off the
loading pad on to the gravel area. Therefore, data interpretations must be made cautiously because
the field site was an open system with potential undocumented inputs of nitrogen in addition to the
initial release in November of 2003.
Water-soluble ammonium was detected in the extracts of core samples collected in nests 1, 2, and
3. Ammonium was detected throughout the entire profile in nest 1 (Fig. 9), whereas it appeared to
be largely confined to the upper 25 cm in nests 2 (Fig. 10) and 3 (not shown). There was no obvious
relationship between the ammonium concentrations and the time since the release. The lack of a
relationship may have been the result of field-scale variability or the re-distribution of ammonium
by rainfall and infiltration that had occurred at the site since the spill in November of 2003. If the
average concentration of ammonium in the spill area and all three nests are plotted as a function of
depth (Fig. 11), the spill area was the most contaminated, whereas nests 2 and 3 contained less
Page 18
14
ammonium because the cores were collected outside the area of the original spill.
Nitrate was detected in the extracts of the samples collected in nests 1, 2, and 3. For example, nitrate
concentrations were largest in the upper part of the profile in nest 2 and 3 (Figs. 12 and 13), which
suggested nitrification, but the distribution of nitrate in the extracts did not appear to depend on
when the core sample was collected. If the NH4/NO3 ratio for the 32-depth sample is plotted as a
function of time for each nest (Fig. 14), the results suggested there had been little change in the
proportion of nitrate relative to ammonium.
The relative persistence of ammonium with respect to nitrification may have been related to the pH
of the fill-water system. The optimum pH range for Nitrosomonas to convert ammonium to nitrite
is 7.8 to 8.0, and the optimum pH range for Nitrobacter to transform nitrite to nitrate is 7.3 to 7.5.
Hence, the pH range of about 7.3 to 8 would be most favorable for nitrification. The pH of the
extracts of samples collected in the spill area, however, were greater than this optimal range. For
example, the pH of samples collected at a depth of about 32 cm were generally greater than 8.5 (Fig.
15) whereas the pH of extracts of samples collected from nests 2 and 3 were less than the mean pH
of the spill area and nest 1. The greater pH values in the spill area and nest 1 matched the largest
amounts of ammonium (see Fig. 16), whereas the mean pH of all the cores collected in nests 2 and
3 were comparable with that of the background pH.
It was expected that any nitrate produced by nitrification would be subject to downward leaching by
infiltration. The fill materials were unsaturated during each sampling event. Roy et al. (1995)
reported that the mean hydraulic conductivity of gravel fill at four agrichemical facilities ranged from
1.4 x 10⁻⁴ to 1.7 x 10⁻⁵ cm/sec. In addition to ammonium and nitrate, the extracts contained relatively
large amounts of chloride (Fig. 17). As shown, the mean chloride content in the extracts from the
spill area and nests was greater than that for the off-site field that served as the control. The presence
of relatively large amounts of chloride in the gravel fill and throughout the soil profile suggested that
water infiltrated vertically through the gravel fill. Because chloride is a mobile and relatively
unreactive anion, we anticipated smaller concentrations near the surface resulting from flushing
Page 19
15
during rainfall events. However, as noted earlier, dry fertilizers could have been blown or swept off
the loading pad on to the gravel area. For example, when the 251-day cores were collected, granular
potassium chloride was present at the surface near core 16. Therefore, the persistence of chloride in
the fill probably resulted from incidental releases of potassium chloride throughout the project
period.
Estimated Half-Life of Ammonium in Groundwater
Buss et al. (2003) concluded that there are very few studies on the rate of biological nitrification in
soil materials other than those for agricultural purposes. Based on studies of unsaturated subsoils and
sand and gravel aquifers, they estimated that the half-life of ammonium under aerobic conditions was
between 1 and 6 years. In an attempt to evaluate the relative persistence of ammonium in
groundwater, groundwater monitoring data from three case studies were examined.
Case Study Number 1
In May of 1995, there was a catastrophic release of about 100,000 to 150,000 gallons of storm water
containing 3 to 4% ammonium nitrate from an unlined basin at an agrichemical facility located in
Illinois. It was estimated that about 25,000 to 50,000 pounds of nitrogen was introduced into the soil
and groundwater. In 1996, the facility entered the Illinois EPA’s Site Remediation Program. An
attempt was made to remove as much of the nitrogen-enriched soil as possible. Nine groundwater
monitoring wells were installed on-site, and groundwater samples had been collected four times a
year for nine years.
Well MW-5 was located about 650 feet down gradient of the spill area. Relatively large
concentrations of nitrate and ammonium were detected in the well samples from 1996 to about the
end of 2000, 70 months after the spill (Fig. 18). Nitrite was detected sporadically during the same
period, ranging from 0.18 to 7.20 mg/L. The pH of the water samples again indicated favorable
conditions for nitrification. The ratio of ammonium to nitrate, however, showed no consistent trend.
The ratio varied from 0.03 (69 months after the spill) to 0.82 (36 months after the spill). Therefore
Page 20
16
it appeared that nitrification was a minor mechanism responsible for converting ammonium to
nitrate. It appeared that the gradual decrease in concentration could be characterized as having a half-
life of about 3 years. The relatively slow reduction in ammonium concentrations was likely the result
of the gradual decrease in ammonium available to move from the initial spill, groundwater dilution
of the ammonium, and nitrification as the groundwater recovered from the catastrophic release.
Case Study Number 2
A site assessment detected nitrogen-contaminated soil at an agrichemical facility in Wisconsin. A
total of 1,398 m3 of soil were excavated from three areas from a depth ranging from 0.9 to 4.6 m. A
soil cleanup objective of 150 mg N/kg was applied. Ten monitoring wells were then installed and
shallow groundwater samples were collected from September of 1998 to November of 2002. Well
MW-9 was about 61 m down gradient from the largest area of contamination. The concentration of
ammonium decreased during the four-year period to concentrations that were less than 10 mg N/L
(Table A2). The ratio of NH4/NO3 decreased from 6.7 to 0.09 from February 2000 to November
2002. Unlike Case Study 1, no nitrite or pH data were available, and the decrease in ammonium
concentrations may have been the result of several factors in addition to nitrification such as the
removal of the contaminated source areas. In any event, the reduction in ammonium yielded a half-
life of about 0.7 year.
Case Study Number 3
In 1978, a leak occurred from a liquid fertilizer storage pit at an agrichemical facility in Illinois. The
pit was about 2.7 m deep and the depth to groundwater was between 0.6 and 1.2 m. Water samples
collected from 1994 to 2002 from groundwater monitoring wells contained relatively large amounts
of ammonium and nitrate. For example, well MW-3 was about 46 m from the edge of the source pit.
A groundwater sample collected 16 years after the leak contained 1,150 mg N/L ammonium, and 630
mg/L nitrate. A sample collected 7.8 years later contained 520 mg N/L ammonium and 110 mg N/L
as nitrate. The ratio of NH4/NO3 varied from 1.8 to 4.7, and did not change in a consistent pattern
to suggest nitrification. It appeared that the ammonium in the shallow groundwater was relatively
persistent.
Page 21
17
Conclusions
Default soil cleanup objectives for N as nitrate depends only on the type of groundwater present at
the facility. A default soil cleanup objective for N as nitrate can be based on essentially only
groundwater dilution. Using the water quality standard of 10 mg N/L, the default nitrate SCO is 38
mg N/kg for Class I groundwater, and 375 mgN/kg for Class II groundwater. When compared with
soil cleanup objectives currently applied in other states (Table 1) an SCO of 38 mg N/kg for nitrate
is comparatively conservative. The application of nitrogen fertilizers in Illinois from 2000 to 2003
averaged about 179 kg/ha (160 lbs per acre) (IASS, 2005) which is equivalent to 79.8 mg N/kg. The
use of an agronomic-based SCO for Class I groundwater quality is relatively consistent in magnitude
with other States. Note for example, that South Dakota applies 80 mg/kg as nitrate-N as a SCO
(Table 1).
A default soil cleanup objective for N as ammonium can be based on the amount of ammonium
sorbed in equilibrium with the amount in groundwater in addition to groundwater dilution. There has
been a concern, however, about the possibility that ammonium in soil and groundwater will rapidly
convert to nitrate and nitrite via nitrification which has prompted some water quality regulations to
combine ammonium and nitrate together as total nitrogen. Such conversions occur in typical
agricultural applications, but they may not occur as rapidly in spill scenarios. This study has shown
that, 488 days after a major spill of anhydrous ammonia, the ammonium in aqueous extracts of fill
samples collected in the spill area appeared to be relatively persistent. There was some evidence that
nitrification occurred; the amount of water-soluble nitrate increased in some profiles. However, it
also appeared that the relative persistence of ammonium in the soil may have been related to the
alkaline conditions generated by the hydrolysis of ammonia. Areas adjacent to the spill also yielded
relatively large amounts of nitrate, but there was no obvious relationship between nitrate
concentrations and the time since the initial release of anhydrous ammonia.
Groundwater samples were not collected during this study, but an analysis of groundwater data
collected at three other agrichemical facilities suggested that ammonium in shallow groundwater can
be relatively persistent. In one detailed study in which both nitrate and nitrite was measured in
Page 22
18
groundwater samples collected downgradient from a major release of nitrogen-rich waste water, it
appeared that the rate of ammonium dissipation could be described as having a half-life of about 3
years. These case studies, taken together with our spill study all suggest that ammonium does not
quickly convert to nitrate in a spill scenario. It could be argued that there will always be a potential
for some portion of the ammonium in soil to be transformed into nitrate. As discussed above, the
LHAL of ammonium in drinking water is 30 mg N/L, which could be used as the groundwater
objective. However, in order to be environmentally conservative to reflect the possibility of slow
nitrification, we recommend that the default SCOs be based on one third of the LHAL. Default
SCOs (Table 7) were calculated using the relationship between CEC and SCO. The cubic model and
coefficients given in Table 5, and the midpoint of each range in CEC values given in Appendix A-3
were used to calculate a SCO for each CEC range, and for both Class I and Class II groundwater.
These default objectives are protective of groundwater quality, and environmentally conservative
because they consider the potential for long-term nitrification and the movement of ammonium in
the environment.
When the proposed default SCOs for nitrate are applied to the spill facility, it appeared that more
than 90% of the 251 sample yielded more water-soluble nitrate than the agronomic-based SCO of
80 mg N/kg. As shown in Fig. 19, the use of 80 mg N/kg yielded results that were comparable to
the 38 mg N/kg SCO. If the 375 mg N/kg SCO is applied for Class II groundwater, then more than
half of all the samples exceeded the SCO. Of the samples that exceeded the 80 mg/kg SCO, it
appeared that excessive nitrate was detected in all of the areas studied (Fig. 20). The application of
the 375 mg N/kg SCO revealed that the spill area and nest 2 contained the greatest amounts of
water-soluble nitrate. The distribution of nitrate in excess of each SCO was more uniformly
distributed to a depth of about 56 cm than ammonium. Therefore, the entire area evaluated in this
study would need to be excavated to a least a depth of about 60 cm because of the nitrate
content—not the ammonium content—of the samples.
Site-specific SCO for ammonium can be established by measuring ammonium sorption using the
standard U.S. EPA method (Roy et al., 1992) with uncontaminated soil and fill samples collected
Page 23
19
at a given agrichemical facility. Soil samples could also be collected adjacent to the facility to avoid
contaminated areas. An alternative to measuring ammonum sorption may be to measure CEC as a
method to calculate site-specific SCOs. A summary of approximate CEC values for soils in Illinois
is provided in the Appendix (Table A-3). This summary can be used as a guide in determining a site-
specific SCO. For example, the CEC values of the fill samples (Table 6) collected at the spill site
ranged from 2.0 to 23.8 cmol/kg at depths of 7 to 45 cm. The mean CEC is 10.7 and the median
value is 11.0. If the anhydrous ammonia spill took place over Class I groundwater, the CEC values
indicate that the default SCO is 1,000 mg N/kg (from Table 7). If the ammonium SCO of 1,000 mg
N/kg is applied, then of the 251 soil samples collected during the 488-day study, 100 samples
contained ammonium in excess of this SCO. Of these 100 samples, 63% of them were collected in
the spill area, while 35 samples were collected in nest 1. The distribution of these 135 samples as
a function of depth is shown in Fig. 21. The application of the 1,000 mg N/kg SCO implied that the
spill area and nest 1 should be excavated to a depth of about 60 cm. It appeared that the areas
corresponding to nests 2 and 3 would not require removal. If the CEC values of the soil material
samples collected at our spill study site (given in Table 6) are used to calculate a site-specific
ammonium SCO, and if the site is over Class I groundwater, the cubic model in Table 6 yielded the
mean SCO would be 1,285 mg N/kg which is larger that the default SCO.
In general, if the CEC or clay content of a site soil is greater than 10 cmol/kg or 21.4% respectfully
and is underlain by Class I groundwater, it would likely be beneficial to the site owner to determine
a site-specific SCO rather than to use the default SCO. If a site is underlain by Class II groundwater,
a CEC and clay content greater than 8.7 cmol/kg and 21.8% respectively would likely result in a site-
specific ammonium SCO that is greater than the default. Fig. 22 summarizes the process and options
available for deriving soil cleanup objectives for nitrogen as nitrate or ammonium in soil materials
that are protective of groundwater quality.
Page 24
20
Acknowledgments
Partial support of this project was provided by the Agrichemical Facility Response Action Program
Board of the Illinois Department of Agriculture, Springfield, Illinois. We thank Dennis P. McKenna
and Warren D. Goetsch of the Illinois Department of Agriculture for their support. We also thank
Robert C. Brod of Hyde Environmental, Inc. (Wisconsin), and Chris Everts of MACTEC
Engineering and Consulting (Illinois) for their review comments and advice. We also thank Jeffery
Levengood of the Illinois Natural History Survey, Jean Payne of the Illinois Fertilizer and Chemical
Association, Mark Tusler of BT2 Inc. (Wisconsin), Robert G. Hoeft of the University of Illinois, and
Gwenyth Thompson, Vanessa Myers, Richard Brekenridge and Tomas Hornshaw of the Illinois
Environmental Protection Agency. This publication has been authorized by the Director of the
Illinois State Geological Survey.
References
American Public Health Association. 1992. Standard Methods for the Examination of Water and
Wastewater, APHA, 18th ed., pp. 4-81 to 4-82.
Buss, S. R., A. W. Herbert, P. Morgan, and S. F. Thornton. 2003. Review of Ammonium
Attenuation in Soil and Groundwater. Environment Agency (United Kingdom). Bristol, England,
NGWCLC Report NC/02/49
Illinois Administrative Code. Title 8: Agriculture and Animals. Chapter I: Department of
Agriculture. Part 259. Agrichemical Facility Response Action Program. 29 p.
Illinois Administrative Code. Title 35: Environmental Protection. Chapter I: Pollution Control
Board. Part 620. Groundwater Quality.
Illinois Agricultural Statistics Service. 2005. Springfield, Illinois
(http://www.agstats.state.il.us/index.html) (verified 15 July 2005).
Page 25
21
Indorante, S. J., Follmer, L. R., Hammer, R. D., and Koenig, P. G. 1990, Particle-size analysis by
a modified pipette method. Soil Science Society of America Journal, 54, 560-563.
Minnesota Department of Agriculture. 2003. Soil Cleanup Goals. Guidance Document 19, St. Paul,
MN, MN 55107-2094, 5 p.
Pfaff, J. D., C. A. Brockhoff and J. W. O’Dell. 1991. The determination of inorganic anions in water
by chromatography. Method 300.0, U.S. Environmental Protection Agency
Roy, W. R. and I. G. Krapac. 2006. Guidance for Conducting Site Assessments at Retail
Agrichemical Facilities. Illinois Department of Agriculture, 75 p.
Roy, W. R., S. F. J. Chou, and I. G. Krapac. 1994. Fate and transport of atrazine in fill materials at
agrichemical facilities: Second year summary, in Proceedings of the Fourth Annual Conference of
the Illinois Groundwater Consortium, Makanda, IL, March 23-24, 1994, p. 88-98.
Roy, W. R., S. F. J. Chou, and I. G. Krapac. 1995. Fate and transport of atrazine in fill materials at
agrichemical facilities: A status report, in Proceedings of the Fifth Annual Conference of the Illinois
Groundwater Consortium, Makanda, IL, March 29-30, 1995, p. 117-131.
Roy, W. R., Krapac, I. G., and Chou, S. F. J. 1999. Chemical fate and transport of atrazine in soil
gravel materials at agrichemical distribution facilities. Journal of Soil Contamination, 8, 365-387.
Roy, W. R., Krapac, I. G., Chou, S. F. J., and Griffin, R. A. 1992. Batch-type procedures for
estimating soil adsorption of chemicals. U.S. Environmental Protection Agency, Cincinnati, Ohio,
Technical Resource Document, U.S. EPA/530/-SW-87-006-F, 100 p. (also available on-line at
http://www.epa.gov/epahome/index/sources.htm)
Stevenson, F. J. 1982. Humus Chemistry. Genesis, Composition, Reactions. John Wiley & Sons.
Page 26
22
New York, NY. 443 p.
Sumner, M. E. and Miller, W. P. 1996. Cation exchange capacity and exchange coefficients. In:
Methods of Soil Analysis. Part 3. Chemical Methods, pp. 1201-1229 (Sparks, D. L., Ed.) Soil
Science Society of America Books, Madison. WI.
U.S. Environmental Protection Agency. 1996a. Soil Screening Guidance: User’s Guide. EPA/540/R-
963505, 38 p. plus appendices.
U.S. Environmental Protection Agency. 1996b. Soil Screening Guidance: Technical Background
Document. EPA/540/R-95/128, 168 p. plus appendices.
U.S. Environmental Protection Agency. 2004. 2004 Edition of the Drinking Water Standard and
Health Advisories. Office of Water, Washington, DC, EPA 822-R-04-005.
Page 27
23
Table 1. Summary of soil cleanup objectives for ten States (as of 2005).
State, contact, and rationale Soil Cleanup Objectives
Illinois (T. Hornshaw)Based on the TCLP and theClass I Groundwater standardfor nitrate (10 mg/L)
200 mg total1 N/kg for Class I groundwater(200 mg NO3 + 600 mg NH4) per kg for Class IIgroundwater
California (A. Terrell)Based on “professionaljudgement”
100 mg/kg total N for groundwater depth of 10 feet250 mg/kg total N for groundwater depth of 30 to 50 feet“Can be site-specific”
Florida (R. Register)Based on risk assessment
No values available. “Site specific”Ammonia based on inhalation from soil surface
Minnesota (published)Based on “professionaljudgement”
150 to 200 mg nitrate-N/kg.5,000 mg/kg Total Kjeldahl N for depth of 0 to 2 feet 1,000 mg/kg Total Kjeldahl N for depth greater than 2 feet
Missouri (C. Cady)Based on “professionaljudgement”
“No set numbers” Ammonia based on “direct exposure”
Nebraska (D. Miesback)Based on agronomic rates
100 mg/kg total N. “Can be site specific” Nothing forammonium
North Carolina (D. Hardy) No objectives have been proposed
South Dakota (K. Reitsmas)Based on “average soil tests”
80 mg nitrate-N/kg. Nothing for ammonium
Texas (A. Strahl)Based on risk assessment
19 to 1,900 mg nitrate-N/kg. Depends on the volume ofcontamination and groundwater type. Nothing forammonium
Wisconsin (R. Graham)Based on agronomic rates plus “professional judgement”
100 mg/kg total N. “Can be increased or decreased”Nothing for ammonium
1Nitrate, ammonium, and nitrite are converted to nitrogen, then added together as “total N.”
Page 28
24
Table 2. Properties of the soil and gravel fill samples used in determining ammonium soilcleanup objectives.
Soil Sand
(%)
Silt
(%)
Clay
(%)
Texture pH CEC
(meq/100g)
Surface
area
(m2/g)
Organic
Carbon
(%)
Catlin 11.0 69 21 Silt loam 6.5 14.9 14.8 4.22
Cisne 13.8 70.8 14.8 Silt loam 5.9 8.0 6.1 1.14
Drummer 17.9 49.5 31.6 Silty clay
loam
6.2 22.8 22.1 2.20
Elsah 20.3 66.4 13.3 Silt loam 6.4 7.3 3.25 1.44
Pike
County 1
0.3 77.4 22.3 Silt loam 5.8 6.6 13.0 1.23
Flanagan 5.4 65.2 29.4 Silty clay
loam
6.0 17.5 12.6 2.62
Muscatune 1.0 74.7 24.3 Silt loam 6.3 12.9 4.52 2.53
Plainfield 94.0 4.62 1.44 Sand 4.8 0.9 0.91 0.47
Pike
County 2
0.4 84.6 15.0 Silt loam 6.4 6.4 8.49 1.47
Tama 0.8 72.9 26.2 Silt loam 6.4 13.3 4.49 2.43
Fill 7-1 ND1 ND ND Sandy loam 8.2 0.4 2.2 1.69
Fill 28-4 N D ND ND Sandy loam 8.5 0.04 2.2 0.49
Fill 38-1 ND ND ND Loam 7.7 2.1 6.6 1.06
1Not determined.
Page 29
25
Table 3. Summary of isotherm constants1 used to calculate the default soil cleanup objectives.
Soil or fill Kf (L/kg) 1/n r2 KL (L/mg) M (mg/kg) r2
Catlin 21.3 0.667 0.986 - - -
Cisne 17.7 0.606 0.987 - - -
Drummer 132 0.546 0.994 - - -
Elsah 29.4 0.610 0.993 - - -
Pike County 1 - - - 0.015 1,250 0.996
Flanagan 63.3 0.595 0.993 - - -
Muscatune 72.9 0.523 0.993 - - -
Plainfield - - - 0.018 98.0 0.989
Pike County 2 - - - 0.020 370 0.943
Tama 41.6 0.627 0.991 - - -
Fill 7-1 - - - 0.022 104 0.983
Fill 28-4 - - - 0.016 67.6 0.987
Fill 38-1 0.015 714 0.996
1Kf = the Freundlich constant, 1/n = the Freundlich exponent, r2 = correlation coefficient, KL = the
Langmuir constant, and M = the Langmuir capacity.
Page 30
26
Table 4. Default soil cleanup objectives (SCO) for nitrogen as ammonium based on the soil and fill samples, and the type ofgroundwater.
Soil or fill SCO (mg N/kg)
Class I Class II
Catlin silt loam 994 2,985
Cisne silt loam 599 1,676
Drummer silty clay loam 3,001 7,344
Elsah silt loam 989 2,733
Pike County 1 silt loam 1,060 1,384
Flanagan silty clay loam 1,921 5,099
Muscatune silt loam 1,473 3,528
Plainfield sand 120 282
Pike County 2 silt loam 317 546
Tama silt loam 1,521 4,266
Fill 7-1 128 288
Fill 28-4 94 252
Fill 38-1 624 871
Mean 987 2,404
Standard Deviation 840 2,195
Median 989 1,676
Page 31
27
Table 5. Regression coefficients and coefficients for various models used to predict ammonium SCOs from various soil properties,and a groundwater objective of 10 mg N/L.
Soil Parameter Class I Groundwater Class II Groundwater
Regression Coefficient
Model Coefficients
Regression Coefficient
Model Coefficients
Linear Model Quadratic Model Cubic Model Linear Model Quadratic Model Cubic Model
Cation
Exchange
Capacity
0.86*
a=109, b=40.1
0.89*
a=3.07, b=45.9,
c=210
0.91*
a=0.36, b=-8.93,
c=143, d=103
0.91*
a=293 b=-142
0.93*
a=7.03, b=149,
c=246
0.93*
a=0.52, b=5.30,
c=163, d=231
Clay Content 0.76*
a=81.5, b=-425
0.89*
a=3.36, b=-33.6,
c=289
0.94*
a=0.28, b=-10.3,
c=142, d=-59 .6
0.70*
a=203, b=-1068
0.83*
a=8.76, b=-96.8,
c=794
0.89*
a=0.80, b=-30.9,
c=413, d=-216
Surface Area 0.56* 0.60* 0.67*
pH 0.10 0.39 0.38
Organic Carbon 0.27 0.50* 0.57*
Multiple 0.94*
SCO = 132 x CEC - 145 x pH - 7.21 x SA - 29.0 x OC + 26 .4
x clay + 726
0.96*
SCO = 466 x CEC - 212 x pH - 79.6 x SA - 57.4 x OC - 6.22 x
clay + 1100
*Correlation is significant at the 0.05 level
Page 32
28
Table 6. Characterization of the soil-fill samples collected at the agrichemical facility where the ammonia spill occurred.
Sample Location Depth
(cm)
Sand
(%)
Silt
(%)
Clay
(%)
Texture pH CEC
(cmol/kg)
Surface
Area
(m2/g)
Organic
Carbon
(%)
G4-04-1 Spill Area 9.5 49.5 34.0 16.5 loam 8.89 11.0 9.59 1.16
G4-04-2 Spill Area 21.6 18.3 50.1 31.6 silty clay
loam
8.66 18.1 16.9 1.71
G4-04-6 Spill Area 44.6 9.1 64.2 26.7 silt loam 8.51 23.8 8.3 1.76
G9-04-1 Nest 2 7.0 73.9 18.1 8.0 sandy loam 8.50 4.3 10.0 0.69
G9-04-2 Nest 2 16.6 24.8 45.1 30.1 clay loam 7.37 8.4 11.1 0.19
G9-04-6 Nest 2 36.6 21.9 49.9 28.2 clay loam 6.91 12.4 16.4 1.89
G10-04-1 Nest 3 5.0 79.0 14.7 6.3 loamy sand 9.07 2.4 6.8 0.70
G10-04-2 Nest 3 12.6 31.9 45.0 23.1 loam 7.58 11.6 9.7 2.84
G10-04-6 Nest 3 32.6 15.6 57.9 26.5 silt loam 7.45 15.6 13.7 3.09
G13-04-1 Nest 1 11.0 76.8 17.8 5.4 loamy sand 9.03 2.0 2.7 0.49
G13-04-2 Nest 1 24.6 40.6 39.4 20.1 loam 9.26 7.7 11.4 1.59
G13-04-6 Nest 1 44.6 14.4 58.6 27.0 silty clay
loam
8.89 19.5 9.8 2.94
Page 33
29
Table 7. Proposed default soil cleanup objectives for ammonium as nitrogen for Class I and
Class II groundwater based on the cation exchange capacity (CEC) of the soil or fill.
CEC Class I as
mg N/kg
Class II as
mg N/kg
< 8 500 1000
8 to 15 1,000 3,600
15 to 24 2,200 9,300
> 24 5,000 20,300
Page 34
30
Figure 1. Ammonium sorption isotherms at 25° C for four of the soils in Table 2.
Page 35
31
Figure 2. Relationship (cubic model) between the cation exchange capacity of the soil and fill
samples in Table 2 and the soil cleanup objectives in Table 4.
Page 36
32
Figure 3. Ammonium soil cleanup objectives (SCO) for Class I groundwater predicted by the
cubic model in Table 5 using either the clay content, CEC, or a combination of clay content,
CEC, surface area, organic carbon, and pH (multiple model).
Page 37
33
Figure 4. Schematic map of the spill area and the location of the soil cores. Numbers in each area
indicate corresponding core number.
Page 38
34
Figure 5. Distribution of ammonium in the spill area as a function of depth and time (in days)
since the initial release of ammonia.
Page 39
35
Figure 6. Distribution of nitrate in the spill area as a function of depth and time (in days) sincethe initial release of ammonia.
Page 40
36
Figure 7. Concentration of ammonium and nitrate at a depth of about 32 cm in the spill area asa function of time.
Page 41
37
Figure 8. Ratio of ammonium to nitrate in the spill area as a function of depth and time (in days)since the initial release of ammonia.
Page 42
38
Figure 9. Distribution of ammonium in nest 1 as a function of depth and time (in days) since theinitial release of ammonia.
Page 43
39
Figure 10. Distribution of ammonium in nest 2 as a function of depth and time (in days) sincethe initial release of ammonia.
Page 44
40
Figure 11. Mean concentration of ammonium in each sampling area plotted as a function ofdepth.
Page 45
41
Figure 12. Distribution of nitrate in nest 2 as a function of depth and time (in days) since theinitial release of ammonia.
Page 46
42
Figure 13. Distribution of nitrate in nest 3 as a function of depth and time (in days) since theinitial release of ammonia.
Page 47
43
Figure 14. Ratio of ammonium to nitrate at a depth of about 34 cm in each sampling nest as afunction of time since the initial release of ammonia.
Page 48
44
Figure 15. Distribution of pH at a depth of about 33 cm in the spill area, and nests 2 and 3 as afunction of time.
Page 49
45
Figure 16. Mean pH of all samples collected in each sampling area.
Page 50
46
Figure 17. Mean concentration of chloride in each sampling area plotted as a function of depth.
Page 51
47
Figure 18. Ratio of ammonium to nitrate (upper figure), and concentrations of nitrate andammonium in well MW-5 as a function of time since a catastrophic release of storm watercontaining 3 to 4% ammonium nitrate from an unlined basin.
Page 52
48
Figure 19. Distribution of all fill samples collected in the spill site that yielded nitrate in excessof a SCO of 38, 80, and 375 mg N/kg.
Page 53
49
Figure 20. Distribution of the fill samples sorted by sampling area that yielded nitrate in excessof a SCO of 38, 80, and 375 mg/Nkg.
Page 54
50
Figure 21. Distribution of fill samples as a function of depth that yielded ammonium in excess
of the SCO of 1,000 mg N/kg.
Page 55
51
Figure 22. Flow chart showing the process and options of deriving a soil cleanup objective fornitrogen in soil materials.
Page 56
52
Appendix
Table A-1. Summary of ammonium, nitrate, and nitrate concentrations (as mg N/L), and pH ofgroundwater samples collected from well MW-5. ND = no data (unpublished data from theIllinois Environmental Protection Agency).
Ammonium Nitrate Nitrite pH
22-Nov-96 ND 94 ND ND
10-Dec-96 29.5 ND ND ND
13-Feb-97 34 102 2.1 7.16
15-May-97 17 78 5.7 8.1
13-Aug-97 2.9 70 <0.05 7.9
11-Nov-97 23 74 0.18 7.1
12-Feb-98 23.5 84.4 0.3 7.0
21-May-98 13.4 16.4 <0.10 6.5
25-Aug-98 15 68.7 <0.05 7.4
18-Nov-98 30.1 76.6 <0.05 7.5
18-Feb-99 6.9 13.2 <0.05 6.5
27-May-99 5.93 29.1 <0.05 7.60
31-Aug-99 20.9 66.8 <0.05 7.05
17-Nov-99 29.5 60.5 <0.05 7.09
22-Feb-00 25.8 67.6 <0.05 6.89
23-May-00 20.2 62.6 7.2 6.34
24-Aug-00 8.85 42.1 1.23 8.46
27-Nov-00 14 53 <0.15 6.85
12-Feb-0l 0.34 9.9 <0.15 7.33
27-Apr-0l <0.05 36 <0.15 6.95
17-Aug-01 5.3 38 <0.15 6.85
21-Aug-01 <0.10 40.9 ND ND
6-Nov-01 2.9 42 <0.15 6.91
1-Feb-02 8.1 55 <0.15 6.87
17-May-02 <0.05 8.9 <0.15 7.12
9-Aug-02 2.1 ND ND 6.82
16-Aug-02 NS 46 <0.15 7.24
l-Nov-02 7.6 55 <0.15 6.58
24-Jan-03 16 61 <0.15 7.61
21-Apr-03 15 60 <0.15 6.72
8-Aug-03 10 42 <0.15 6.8
31-Oct-03 7.7 44 <0.15 6.55
6-Feb-04 6.4 42 <0.15 6.29
14-May-04 2.2 31 <0.15 7.07
30-Jul-04 3.6 12 <0.15 7.65
4-Nov-04 3.6 39 <0.15 6.5
28-Jan-05 <0.10 8 <0.15 7.59
Page 57
53
Table A-2. Summary of ammonium and nitrate concentrations collected from well MW-9(unpublished data from BT2 Inc.).
Date Nitrate
(mg N/L)
Ammonium
(mg N/L)
9-2-98 79 105
1-13-99 64 283
9-21-99 55 170
2-24-00 18 120
9-11-00 90 120
5-7-01 47 18
11-28-01 50 10
5-30-02 130 <3
11-8-02 16 1.5
Page 58
54
Table A-3. Soil name and approximate cation exchange capacity (CEC). Provided by Prof. R.G. Hoeft, Department of Crop Sciences, University of Illinois at Urbana-Champaign.
Soil name CEC
(meq/100g)
Ade loamy fine sand <8Adrian muck >100Aholt silty clay >24Alford silt loam 8-15Alford-Baxter complex 8-15Alford-Bold complex 8-15Alford-Hickory complex 8-15Alford-Hurst silty clay loams 8-15Alford-Ursa silt loams 8-15Alford-Wellston silt loams 8-15Alford-Westmore silt loams 8-15Algansee fine sandy loam <8Allison silty clay loam >24Alvin fine sandy loam <8Alvin-Lamont complex <8Ambraw clay loam 15-24Ambraw silty clay loam, sandy substratum 15-24Ambraw-Ceresco-Sarpy complex 8-15Andres silt loam 15-24Appleriver silt loam 8-15Aptakisic silt loam 8-15Aptakisic and Nappanee silt loams 8-15Arenzville silt loam 8-15Argyle silt loam 15-24Armiesburg silty clay loam 15-24Ashdale silt loam 15-24Ashkum silty clay loam >24Assumption silt loam 15-24Atkinson loam 8-15Atlas silt loam 8-15Atlas-Grantfork complex 8-15Atlas-Grantfork variant complex 8-15Atterberry silt loam 8-15Aurelius muck >100Aurelius muck, sandy substratum >100Ava silt loam 8-15
Page 59
55
Ava-Blair complex 8-15Ava-Hickory complex 8-15Aviston silt loam 15-24Ayr sandy loam <8Backbone loamy sand 8-15Banlic silt loam 8-15Barony silt loam 15-24Barrington silt loam 15-24Barrington and Varna silt loams 15-24Bartelso silt loam 15-24Batavia silt loam 8-15Baxter cherty silt loam 8-15Baylis silt loam 8-15Beardstown loam 8-15Beasley silt loam 8-15Beaucoup silty clay loam >24Beavercreek loam <8Bedford silt loam 8-15Beecher silt loam 8-15Belknap silt loam 8-15Berks loam 8-15Bertrand silt loam 8-15Bethalto silt loam 15-24Biddle silt loam 15-24Biggsville silt loam >24Biggsville-Mannon silt loams 15-24Billett sandy loam <8Binghampton sandy loam 8-15Birds silt loam 8-15Birkbeck silt loam 8-15Birkbeck-Miami silt loams 8-15Blackoar silt loam 15-24Blair silt loam 8-15Blair-Atlas silt loams 8-15Blair-Grantfork complex 8-15Blair-Ursa silt loams 8-15Blake silty clay loam 15-24Blake-Beaucoup complex 15-24Bloomfield fine sand <8Blount silt loam 8-15Bluford silt loam 8-15Bluford silt loam, bench 15-24Bluford-Darmstadt complex 8-15
Page 60
56
Blyton silt loam <8Bold silt loam 8-15Bonfield silt loam 8-15Bonnie silt loam 8-15Booker silty clay >24Boone loamy fine sand <8Bowdre silty clay >24Bowes silt loam 8-15Boyer sandy loam <8Brandon and Saffell soils 8-15Breeds silty clay loam 15-24Brenton silt loam 15-24Broadwell silt loam 15-24Brooklyn silt loam 15-24Brookside stony silty clay loam 15-24Brouillett silt loam 15-24Bryce silty clay >24Bryce-Calamine variant complex 15-24Bunkum silty clay loam 15-24Bunkum-Atlas silty clay loams 8-15Bunkum-Coulterville silty clay loams 8-15Burkhardt-Saude complex 8-15Burksville silt loam 8-15Burnside silt loam 8-15Cairo silty clay >24Calamine silt loam 15-24Calco silty clay loam >24Camden silt loam 8-15Camden silt loam, sandy substratum 8-15Canisteo silt loam >24Canisteo silt loam, sandy substratum >24Cape silty clay loam 15-24Caprell silt loam 8-15Carmi sandy loam 8-15Casco silt loam 8-15Casco-Fox complex 8-15Caseyville silt loam 8-15Catlin silt loam 15-24Catlin-Saybrook complex 15-24Ceresco loam 15-24Channahon silt loam 15-24Chaseburg silt loam 15-24Chatsworth silt loam 8-15
Page 61
57
Chauncey silt loam 8-15Chautauqua silty clay loam 15-24Chelsea loamy fine sand <8Chenoa silt loam >24Chute fine sand <8Cisne silt loam 8-15Cisne silt loam, bench 8-15Cisne-Huey complex 8-15Cisne-Piasa complex 8-15Clare silt loam 15-24Clarence silty clay loam >24Clarksdale silt loam 8-15Clarksville cherty silt loam 8-15Clinton silt loam 8-15Clinton-El Dara complex <8Clyde clay loam >24Coatsburg silt loam 15-24Coffeen silt loam 15-24Cohoctah loam 15-24Colo silty clay loam >24Coloma silt loam <8Colp silt loam 8-15Comfrey clay loam >24Coot loam 8-15Copperas silty clay loam 15-24Corwin silt loam 15-24Coulterville silt loam <8Coulterville-Darmstadt complex <8Coulterville-Grantfork silty clay loams <8Coulterville-Hoyleton-Darmstadt complex <8Coulterville-Oconee silt loams <8Cowden silt loam 8-15Cowden-Piasa complex 8-15Coyne fine sandy loam 8-15Craigmile sandy loam <8Crane silt loam 15-24Crawleyville fine sandy loam <8Creal silt loam 8-15Crider silt loam 8-15Dakota silt loam 8-15Dana silt loam 15-24Danabrook silt loam 15-24Darmstadt silt loam 8-15
Page 62
58
Darmstadt-Grantfork complex 8-15Darmstadt-Oconee silt loams 8-15Darroch silt loam 15-24Darwin silty clay >24Del Rey silt loam 8-15Denny silt loam 8-15Denrock silt loam 15-24Derinda silt loam 8-15Dickinson sandy loam 8-15Dickinson sandy loam, loamy substratum 8-15Dickinson-Hamburg complex 8-15Dickinson-Onarga complex 8-15Disco sandy loam 8-15Dockery silt loam 8-15Dodge silt loam 8-15Dodgeville silt loam 15-24Dorchester silt loam 8-15Dorchester silt loam, cobbly substratum 8-15Douglas silt loam 15-24Dowagiac silt loam 8-15Downs silt loam 8-15Downsouth silt loam 15-24Dresden silt loam 15-24Drummer silty clay loam >24Drummer silty clay loam, gravelly
substratum
>24
Drummer silty clay loam, till substratum >24Drury silt loam 8-15Du Page silt loam 15-24Dubuque silt loam 8-15Dubuque and Dunbarton soils 8-15Dubuque and Palsgrove soils 8-15Dubuque-Orthents- Fayette Complex 8-15Dunbarton silt loam 8-15Dunbarton silt loam, cherty variant 8-15Dunbarton-Dubuque complex 8-15Dunham silty clay loam >24Dupo silt loam 8-15Durand silt loam 15-24Ebbert silt loam 15-24Eden silty clay loam >24Edgington silt loam 15-24Edinburg silty clay loam >24
Page 63
59
Edmund silt loam 15-24Edwards muck >100Edwardsville silt loam >24El Dara sandy loam <8Elburn silt loam 15-24Elburn silt loam, gravelly substratum 15-24Elco silt loam 8-15Elco-Atlas silt loams 8-15Elco-Ursa silt loams 8-15Eleroy silt loam 8-15Eleroy and Derinda soils 8-15Eleva sandy loam <8Elizabeth silt loam 15-24Elkhart silt loam 15-24Elliott silt loam 15-24Elpaso silty clay loam >24Elsah cherty silt loam 8-15Elvers silt loam 8-15Emery silt loam 15-24Emma silty clay loam 15-24Evansville silt loam 8-15Faxon clay loam 15-24Faxon-Ripon complex 15-24Fayette silt loam 8-15Fayette silty clay loam, karst <8Fayette silt loam, sandy substratum 15-24Fayette silt loam, till substratum 8-15Fayette-Clarksville complex 8-15Fayette-Hickory complex 8-15Fayette-Westville complex 8-15Fella silty clay loam >24Fieldon silt loam 15-24Fincastle silt loam 8-15Fishhook silt loam 8-15Fishhook-Atlas complex 8-15Flagg silt loam 8-15Flagler sandy loam 8-15Flanagan silt loam 15-24Floraville silt loam 8-15Fosterburg silt loam >24Fox silt loam 8-15Frankfort silt loam 8-15Frankville silt loam 15-24
Page 64
60
Friesland sandy loam 8-15Frondorf loam 8-15Fults silty clay >24Gale silt loam 8-15Geff silt loam 8-15Genesee silt loam 8-15Geryune silt loam 15-24Gilford fine sandy loam 8-15Ginat silt loam 8-15Gorham silty clay loam >24Gosport silt loam 8-15Goss gravelly silt loam 8-15Goss-Alford complex 8-15Granby loamy sand <8Grantfork silty clay loam 8-15Grantsburg silt loam 8-15Graymont silt loam 15-24Grays silt loam 8-15Grays and Markham silt loams 8-15Greenbush silt loam 15-24Grellton sandy loam <8Griswold loam 8-15Grundelein silt loam >24Hamburg silt loam 8-15Harco silt loam 15-24Harpster silty clay loam >24Harrison silt loam 15-24Hartsburg silty clay loam >24Harvard silt loam 8-15Hayfield loam 8-15Haymond silt loam 8-15Haynie silt loam 8-15Hennepin loam <8Hennepin and Miami soils <8Hennepin-Casco complex <8Hennepin-Vanmeter complex 8-15Henshaw silt loam 8-15Herbert silt loam 8-15Herrick silt loam 15-24Herrick-Biddle-Piasa silt loams 15-24Herrick-Piasa complex 15-24Hesch fine sandy loam 8-15Hesch fine sandy loam, gray subsoil 8-15
Page 65
61
variantHesch loamy sand, shallow variant 8-15Hickory loam 8-15Hickory and Hennepin soils 8-15Hickory and Sylvan soils 8-15Hickory-Atlas complex 8-15Hickory-Clinton complex 8-15Hickory-Gosport complex 8-15Hickory-Hennepin complex 8-15Hickory-High Gap silt loams 8-15Hickory-Hosmer silt loams 8-15Hickory-Kell silt loams 8-15Hickory-Negley complex 8-15Hickory-Sylvan complex 8-15Hickory-Sylvan-Fayette silt loams 8-15Hickory-Wellston silt loams 8-15High Gap loam 8-15Hitt silt loam 15-24Holly silt loam 15-24Holton silt loam 8-15Homen silt loam 15-24Homer silt loam 8-15Hononegah loamy coarse sand <8Hoopeston sandy loam 8-15Hooppole loam 15-24Hosmer silt loam 8-15Hosmer-Lax silt loams 8-15Hosmer-Ursa silt loams 8-15Houghton muck >100Houghton peat >100Hoyleton silt loam 8-15Hoyleton silt loam, bench 8-15Hoyleton-Darmstadt complex 8-15Hoyleton-Tamalco complex 8-15Huey silt loam 8-15Huntington silt loam 15-24Huntsville silt loam 15-24Hurst silt loam 8-15Hurst silt loam, sandy substratum 8-15Iona silt loam 8-15Ipava silt loam 15-24Ipava-Sable complex 15-24Ipava-Tama complex 15-24
Page 66
62
Iva silt loam 8-15Jacob clay 15-24Jasper silt loam 15-24Jasper silt loam, sandy substratum 15-24Joliet silty clay loam >24Joslin silt loam 15-24Joy silt loam 15-24Joyce silt loam 15-24Joy silt loam, sandy substratum 15-24Jules silt loam 8-15Juneau silt loam 8-15Kane silt loam 15-24Kaneville silt loam 15-24Kankakee fine sandy loam 8-15Karnak silty clay 15-24Kell silt loam 8-15Keller silt loam 15-24Keller-Coatsburg complex 15-24Keltner silt loam 15-24Kendall silt loam 8-15Kendall silt loam, sandy substratum 8-15Keomah silt loam 8-15Kernan silt loam 8-15Keswick loam >24Kidami silt loam 8-15Kidder silt loam <8Kish loam >24Kishwaukee silt loam 15-24Knight silt loam 15-24La Hogue loam 8-15La Rose silt loam 8-15Lacrescent cobbly silty clay loam 15-24Lahoguess loam 15-24Lakaskia silt loam 15-24Lamoille silt loam 15-24Lamont fine sandy loam <8Lamont, Tell, and Bloomfield soils <8Landes fine sandy loam 8-15Lanier fine sandy loam 8-15Lawler loam 8-15Lawndale silt loam 15-24Lawson silt loam 15-24Lax silt loam 8-15
Page 67
63
Lena muck >100Lenzburg silt loam 15-24Lenzburg silt loam, acid substratum 15-24Lenzlo silty clay loam 15-24Lenzwheel silty clay loam 15-24Lindley loam 8-15Lisbon silt loam 15-24Lismod silt loam 15-24Littleton silt loam 15-24Lomax loam 8-15Loran silt loam 15-24Lorenzo loam 8-15Mannon silt loam 8-15Marbletown silt loam 15-24Marine silt loam 8-15Marissa silt loam 8-15Markham silt loam 8-15Markland silt loam 8-15Marseilles silt loam 8-15Marseilles silt loam, gravelly substratum 8-15Marseilles silt loam, moderately wet 15-24Marseilles-Atlas complex 8-15Marseilles-Hickory complex 8-15Marshan loam 8-15Marshan loam, sandy substratum 15-24Martinsville silt loam 8-15Martinton silt loam 15-24Mascoutah silty clay loam >24Massbach silt loam 8-15Matherton silt loam 8-15Maumee fine sandy loam <8Mayville silt loam 15-24McFain silty clay >24McGary silt loam 8-15McHenry silt loam 8-15Meadowbank silt loam 15-24Medary silty clay loam 8-15Medway silty clay loam >24Menfro silt loam 8-15Metea silt loam <8Miami fine sandy loam <8Miami silt loam 8-15Miami-Casco complex 8-15
Page 68
64
Miami-Hennepin complex 8-15Miami-Russell silt loams 8-15Middletown silt loam 8-15Milford silty clay loam >24Millbrook silt loam 8-15Millington loam 8-15Millsdale silty clay loam >24Millstadt silt loam >24Millstream silt loam 15-24Minneiska loam 15-24Mokena silt loam 15-24Mona silt loam 15-24Monee silt loam 15-24Monterey silty clay loam >24Montgomery silty clay loam >24Montmorenci silt loam 8-15Morley silt loam 8-15Morocco fine sand <8Morristown silt loam 8-15Moundprairie silty clay loam 15-24Mt. Carroll silt loam 8-15Mudhen clay loam >24Mundelein silt loam 15-24Mundelein and Elliott soils 15-24Muren silt loam 8-15Muscatine silt loam 15-24Muscatune silt loam 15-24Muskego muck >100Muskego silty clay loam, overwash >24Muskego and Houghton mucks >100Muskego and Peotone soils, ponded >100Muskingum stony silt loam <8Muskingum and Berks soils <8Myrtle silt loam 8-15Nachusa silt loam 15-24Nameoki silty clay 15-24Nappanee silt loam 8-15Nasset silt loam 15-24Navlys silty clay loam 15-24Negley loam 8-15Neotoma-Wellston complex 8-15Newark silty clay loam 15-24Newberry silt loam 8-15
Page 69
65
NewGlarus-Lamoille complex 8-15NewGlarus-Palsgrove silt loams 8-15Newhaven loam 8-15Niota silt loam 8-15Niota silty clay loam, clayey subsurface
variant
15-24
Nolin silty clay loam 8-15Normal silt loam 15-24Normandy silt loam 15-24Oakville fine sand <8Oakville-Tell complex <8Ockley silt loam 8-15Oconee silt loam 8-15Oconee-Coulterville-Darmstadt silt loams 8-15Oconee-Darmstadt-Coulterville silt loams 8-15Oconee-Tamalco complex 8-15Octagon silt loam 8-15Odell silt loam 15-24Ogle silt loam 15-24Ogle silt loam, silt loam subsoil variant 15-24Okaw silt loam 8-15Okaw silty clay loam 15-24Onarga sandy loam 8-15Onarga fine sandy loam, till substratum 8-15Oneco silt loam 8-15Orio sandy loam <8Orion silt loam 8-15Osceola silt loam 15-24Osco silt loam 15-24Otter silt loam >24Ozaukee silt loam 15-24Palms muck >100Palms silty clay loam, overwash >24Palsgrove silt loam 8-15Palsgrove and Woodbine soils 8-15Pana silt loam 15-24Papineau fine sandy loam 8-15Parke silt loam 8-15Parkville silty clay 8-15Parmod silt loam 15-24Parr fine sandy loam 8-15Parr silt loam 8-15Passport silt loam 8-15
Page 70
66
Passport-Grantfork complex 8-15Patton silty clay loam >24Paxico silt loam 8-15Pecatonica silt loam 8-15Pella silty clay loam >24Peotone silty clay loam >24Peotone mucky silty clay loam, marl
substratum
>100
Petrolia silty clay loam 15-24Piasa silt loam 15-24Pierron silt loam 8-15Pike silt loam 8-15Pillot silt loam 15-24Piopolis silty clay loam 15-24Piscasaw silt loam 15-24Plainfield sand <8Plano silt loam 15-24Plattville silt loam 15-24Plumfield silty clay loam 15-24Port Byron silt loam 15-24Port Byron silt loam, sandy substratum 15-24Prairieville silt loam 15-24Princeton fine sandy loam 8-15Proctor silt loam 15-24Proctor silt loam, sandy substratum 15-24Prophetstown silt loam 15-24Quiver silty clay loam 15-24Racoon silt loam 8-15Raddle silt loam 15-24Raddle-Sparta complex 8-15Radford silt loam 15-24Rantoul silty clay >24Rapatee silty clay loam >24Raub silt loam 15-24Raveenwash silty clay loam 8-15Redbud silt loam 8-15Redbud-Colp silty clay loams 8-15Redbud-Hurst silty clay loams 8-15Reddick silty clay loam >24Reesville silt loam 8-15Rend silt loam 8-15Richview silt loam 8-15Richwood silt loam 15-24
Page 71
67
Ridgeville fine sandy loam 8-15Ridgway silt loam 8-15Ridott silt loam 8-15Riley silty clay loam >24Ringwood silt loam 15-24Ripon silt loam 8-15Ritchey silt loam 8-15Robbs silt loam 8-15Roby fine sandy loam <8Rocher loam 8-15Rockton loam 8-15Rockton and Dodgeville soils 8-15Rodman loam 8-15Rodman gravelly loam <8Rodman-Casco complex 8-15Rodman-Fox complex 8-15Rodman-Warsaw complex 8-15Romeo silt loam 15-24Rooks silt loam >24Ross loam 8-15Rossburg loam >24Rowe silty clay >24Rozetta silt loam 8-15Ruark fine sandy loam <8Rubio silt loam 15-24Ruma silt loam 15-24Ruma-Ursa silty clay loams 8-15Rush silt loam 8-15Rushville silt loam 8-15Rushville-Huey silt loams 8-15Russell silt loam 8-15Rutland silt loam 15-24Sabina silt loam 15-24Sable silty clay loam >24Saffell gravelly sandy loam 8-15Sarpy sand <8Saude loam 15-24Sawmill silty clay loam >24Sawmill-Lawson complex >24Saybrook silt loam 15-24Saylesville silt loam 8-15Schapville silt loam 15-24Schuline silt loam 8-15
Page 72
68
Sciotoville silt loam 8-15Seaton silt loam 8-15Seaton silt loam, sandy substratum 8-15Seaton-Goss complex 8-15Seaton-Hickory complex 8-15Seaton-Oakville complex 8-15Seaton-Timula silt loams 8-15Selma loam 15-24Selmass loam 15-24Selma loam, bedrock substratum 15-24Senachwine silt loam 8-15Sepo silty clay loam 15-24Sexton silt loam 8-15Shadeland silt loam 8-15Shaffton loam 15-24Sharon silt loam 8-15Shiloh silty clay loam >24Shoals silt loam 8-15Shullsburg silt loam 15-24Sidell silt loam 8-15Skelton fine sandy loam 8-15Slacwater silt loam 8-15Sogn silt loam 15-24Somonauk silt loam 8-15Sonsac very cobbly silt loam 8-15Sparta loamy sand <8Sparta loamy sand, loamy substratum <8Springerton loam 15-24Starks silt loam 8-15Stockland loam 8-15Stonelick fine sandy loam <8Stookey silt loam 15-24Stookey and Timula soils 8-15Stookey-Bodine complex 15-24Stoy silt loam 8-15Strawn silt loam 8-15Strawn-Chute complex 8-15Strawn-Hennepin loams 8-15Streator silty clay loam >24Stronghurst silt loam 8-15St. Charles silt loam 8-15St. Charles silt loam, sandy substratum 15-24St. Clair silt loam 8-15
Page 73
69
Sunbury silt loam 15-24Swanwick silt loam 8-15Swygert silty clay loam >24Sylvan silt loam 8-15Sylvan-Bold complex 8-15Symerton loam 15-24Symerton silt loam 15-24Tallula silt loam 15-24Tallulabold silt loams 15-24Tama silt loam 15-24Tamalco silt loam 8-15Tama silt loam, sandy substratum 15-24Tell silt loam 8-15Tell-Lamont complex 8-15Terril loam 15-24Thebes silt loam 8-15Thorp silt loam 15-24Tice silty clay loam >24Timewell silt loam 15-24Timewell and Ipava soils 15-24Timula silt loam 8-15Timula-Hickory complex 8-15Timula-Miami complex 8-15Titus silty clay loam >24Toronto silt loam 15-24Torox silt loam 15-24Traer silt loam 8-15Trempealeau silt loam 15-24Troxel silt loam 15-24Tuscola loam 8-15Twomile silt loam 8-15Udolpho loam 15-24Udolpho loam, sandy substratum 15-24Uniontown silt loam 8-15Ursa silt loam 8-15Ursa-Atlas complex 8-15Ursa-Hickory complex 8-15Vanmeter silty clay loam 15-24Vanpetten loam 15-24Varna silt loam 15-24Velma loam 8-15Velma-Coatsburg silt loams 15-24Velma-Walshville complex 8-15
Page 74
70
Vesser silt loam 15-24Virden silty clay loam >24Virden-Fosterburg silt loams >24Virden-Piasa silt loams >24Virgil silt loam 8-15Wabash silty clay >24Wagner silt loam 8-15Wakeland silt loam 8-15Wakenda silt loam 15-24Wallkill silty clay loam >24Wallkill silt loam 15-24Ware silt loam 15-24Warsaw silt loam 15-24Washtenaw silt loam 15-24Watseka loamy fine sand <8Wauconda silt loam 8-15Wauconda and Beecher silt loams 8-15Wauconda and Frankfort silt loams 8-15Waukee loam 8-15Waukegan silt loam 15-24Waupecan silt loam 15-24Wea silt loam 15-24Weinbach silt loam 8-15Weir silt loam 8-15Wellston silt loam 8-15Wellston-Berks complex 8-15Wenona silt loam 15-24Wenona silt loam, loamy substratum 15-24Wesley fine sandy loam 8-15Westland clay loam 15-24Westmore silt loam 8-15Westmore-Neotoma complex 8-15Westville silt loam 8-15Whalan loam 8-15Whalan and NewGlarus silt loams 8-15Wheeling silt loam 8-15Whitaker silt loam 8-15Whitaker variant loam 8-15Whitson silt loam 8-15Wilbur silt loam 8-15Will silty clay loam >24Windere silt loam 15-24Winfield silt loam 8-15
Page 75
71
Wingate silt loam 8-15Winnebago silt loam 15-24Wirt silt loam 8-15Woodbine silt loam 8-15Worthen silt loam 15-24Wyanet silt loam 8-15Wynoose silt loam 8-15Wynoose silt loam, bench 8-15Wynoose-Huey complex 8-15Xenia silt loam 8-15Zanesville silt loam 8-15Zanesville-Westmore silt loams 8-15Zipp silty clay loam 15-24Zook silty clay >24Zumbro sandy loam 8-15Zurich silt loam 15-24Zurich and Morley silt loams 15-24Zurich and Nappanee silt loams 15-24Zwingle silt loam 8-15


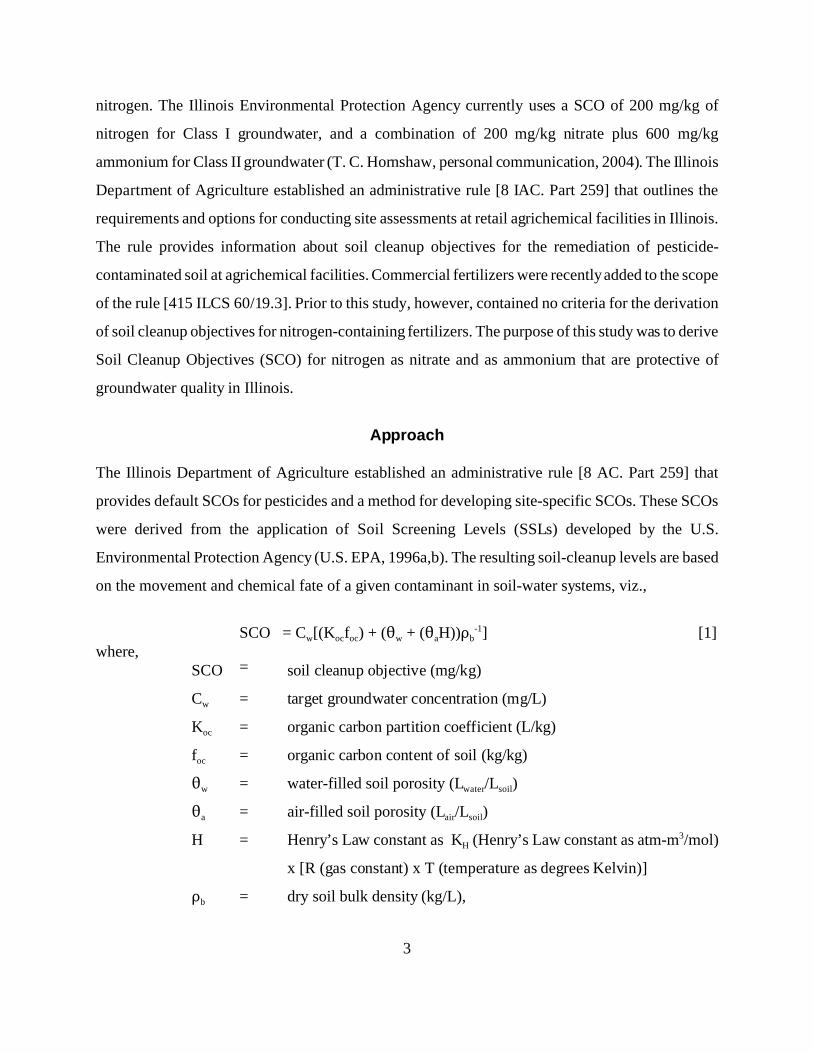


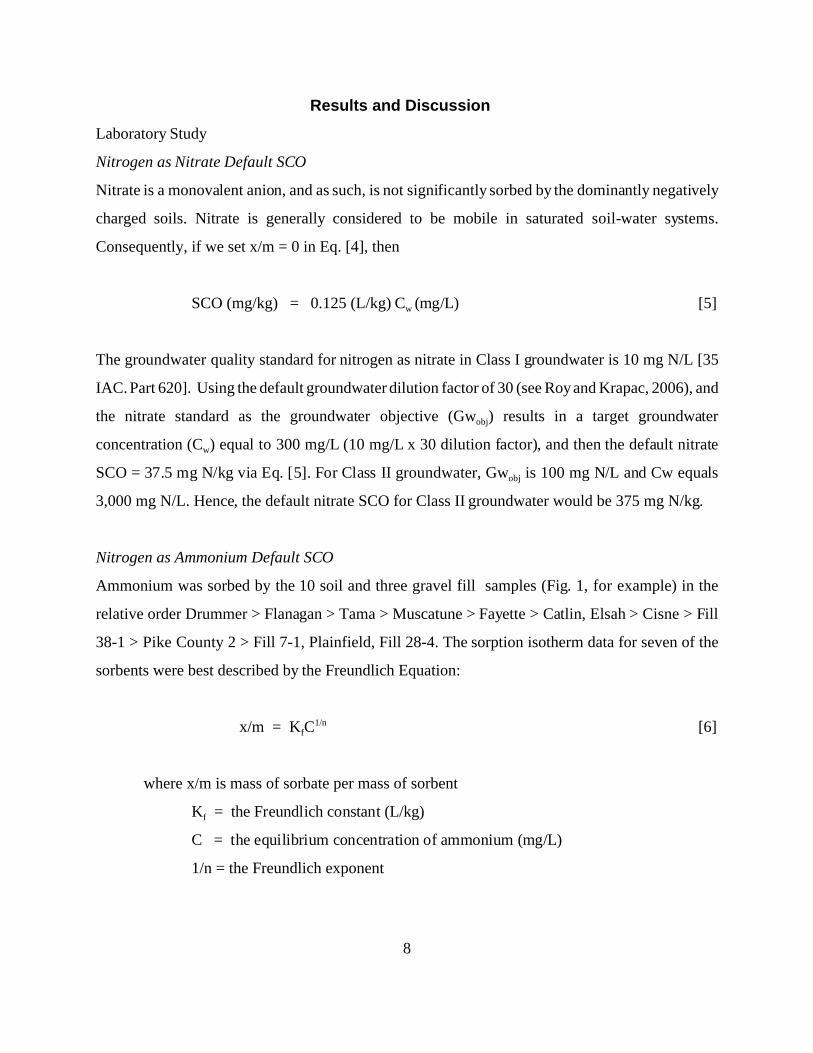
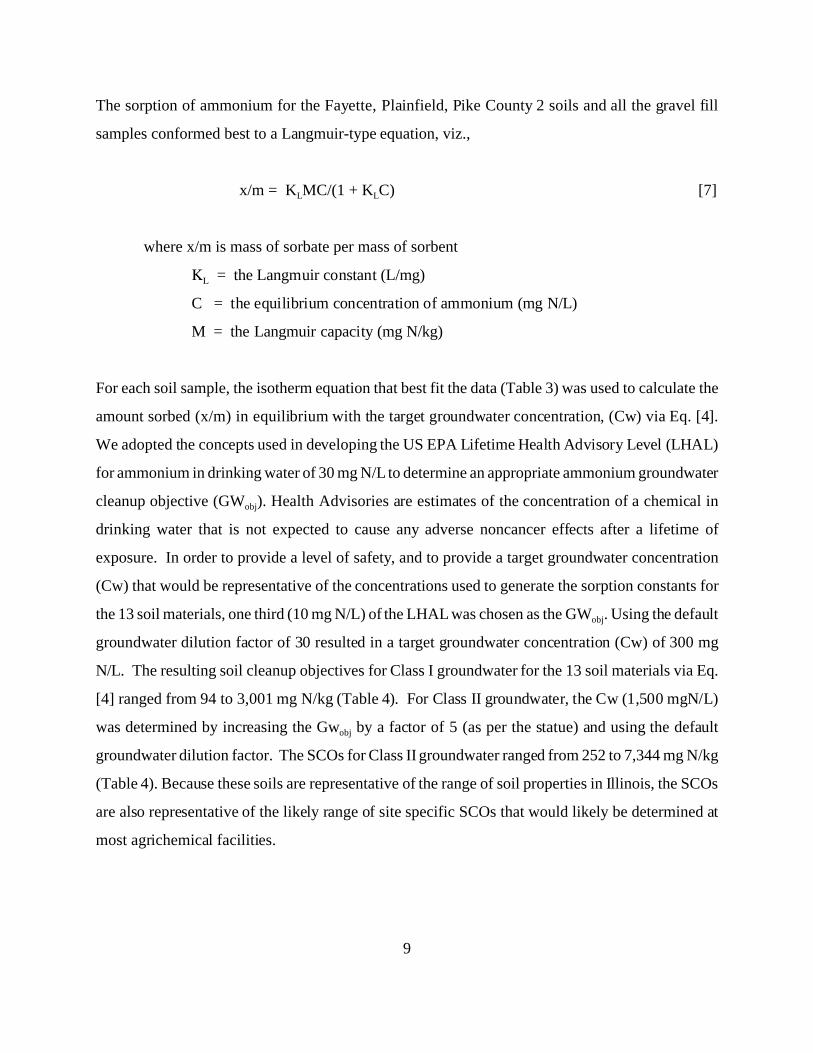


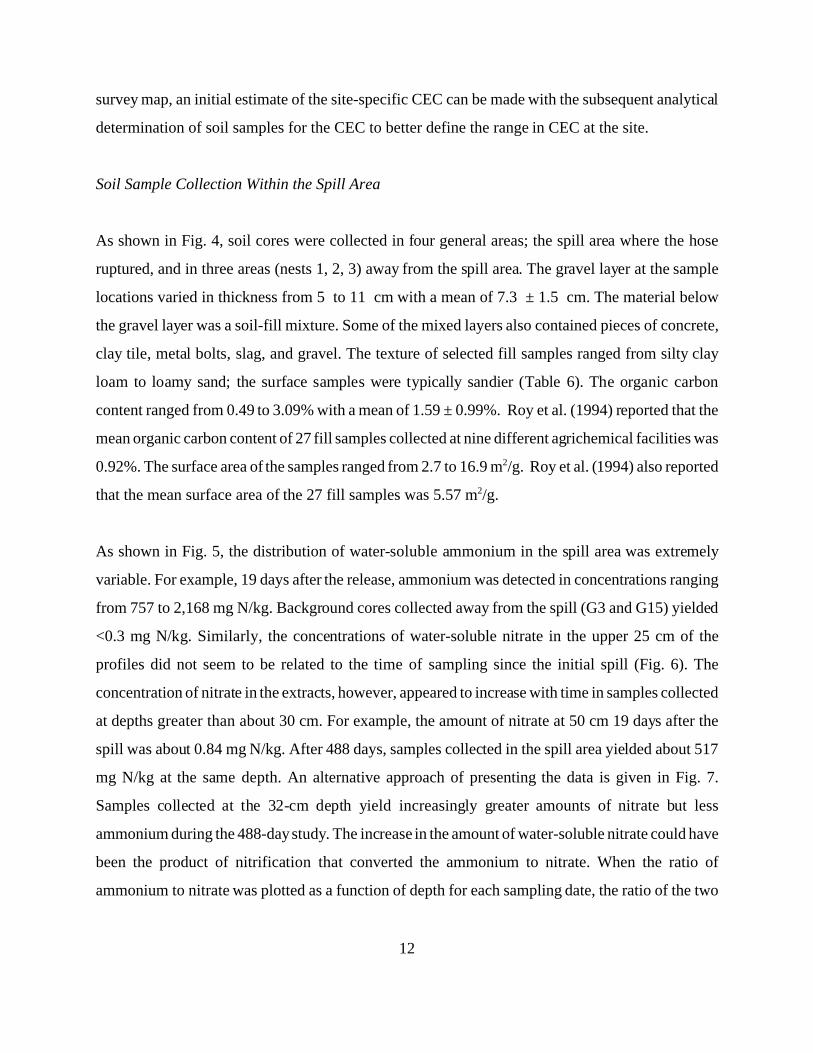


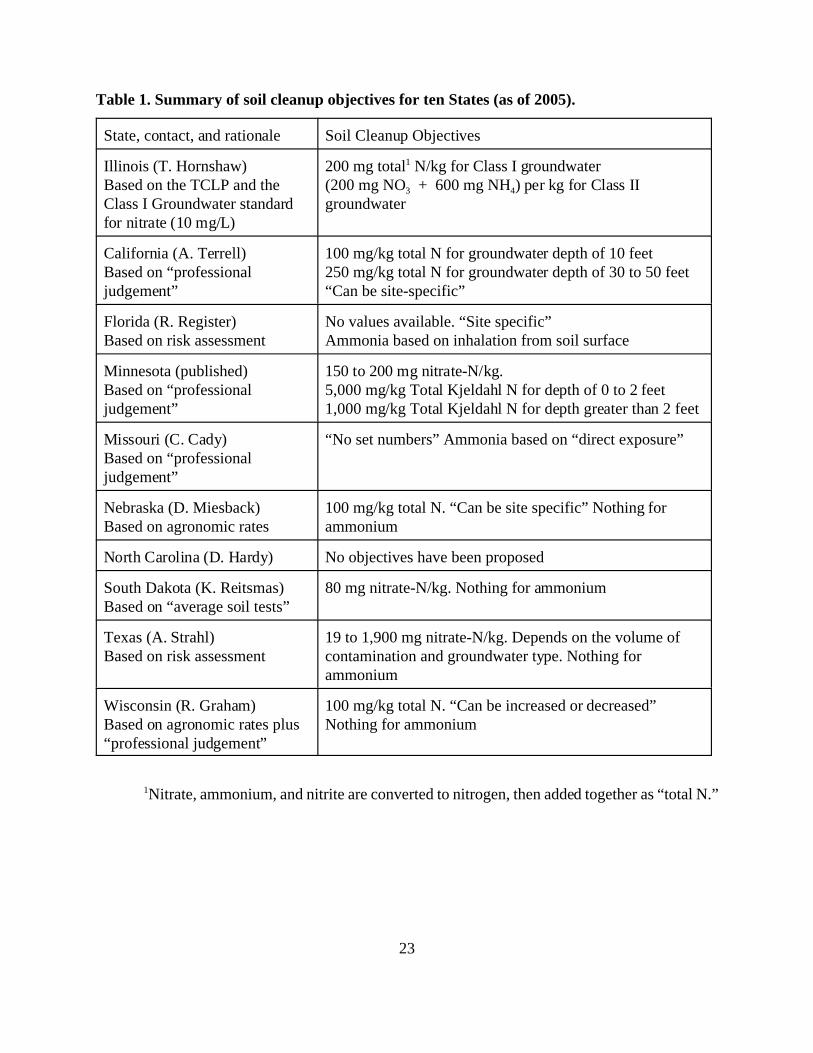
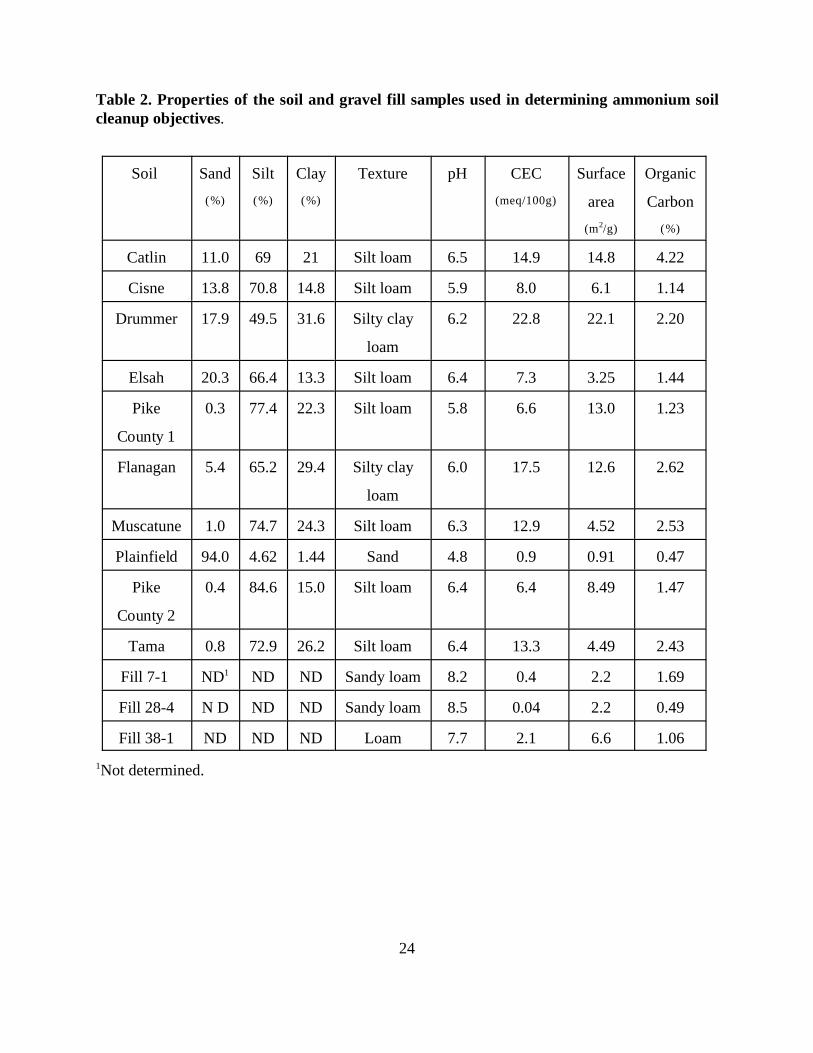

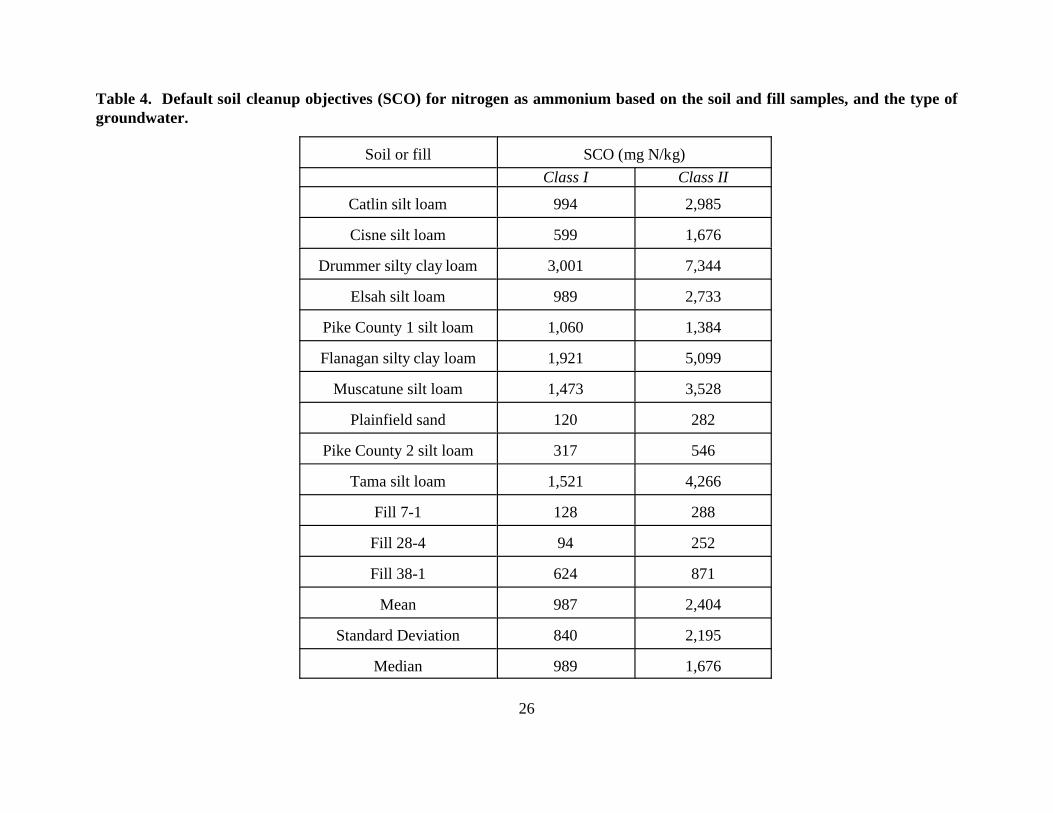


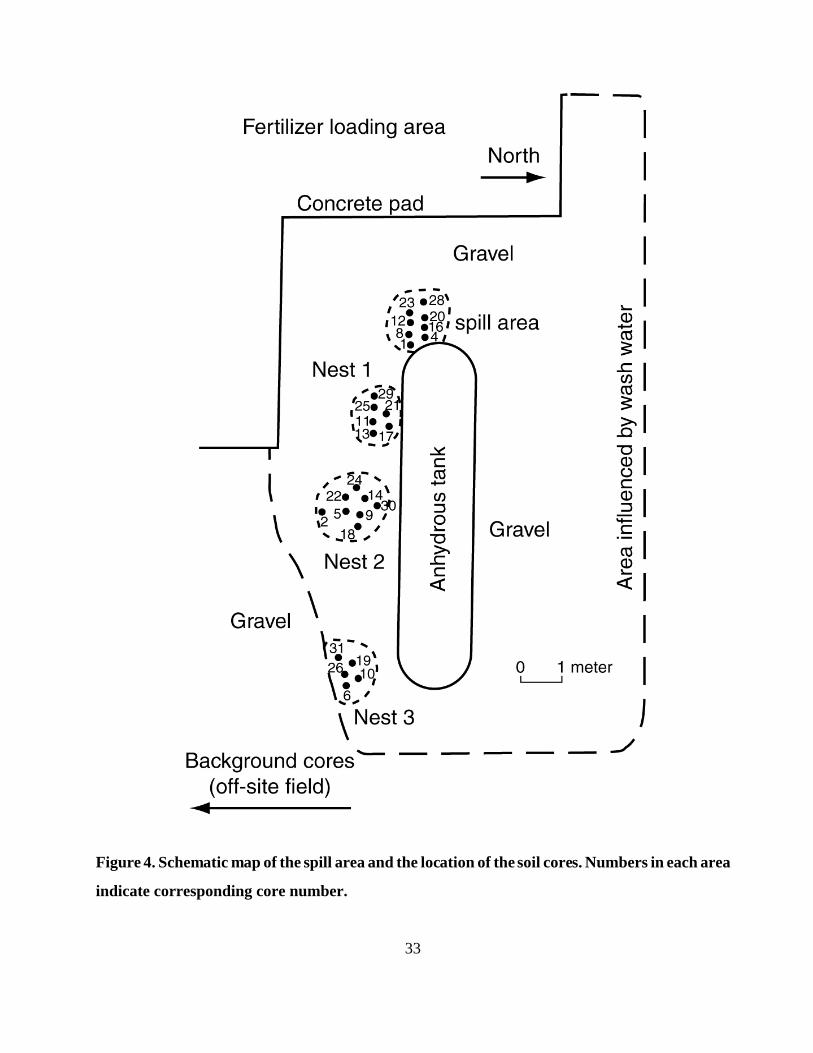

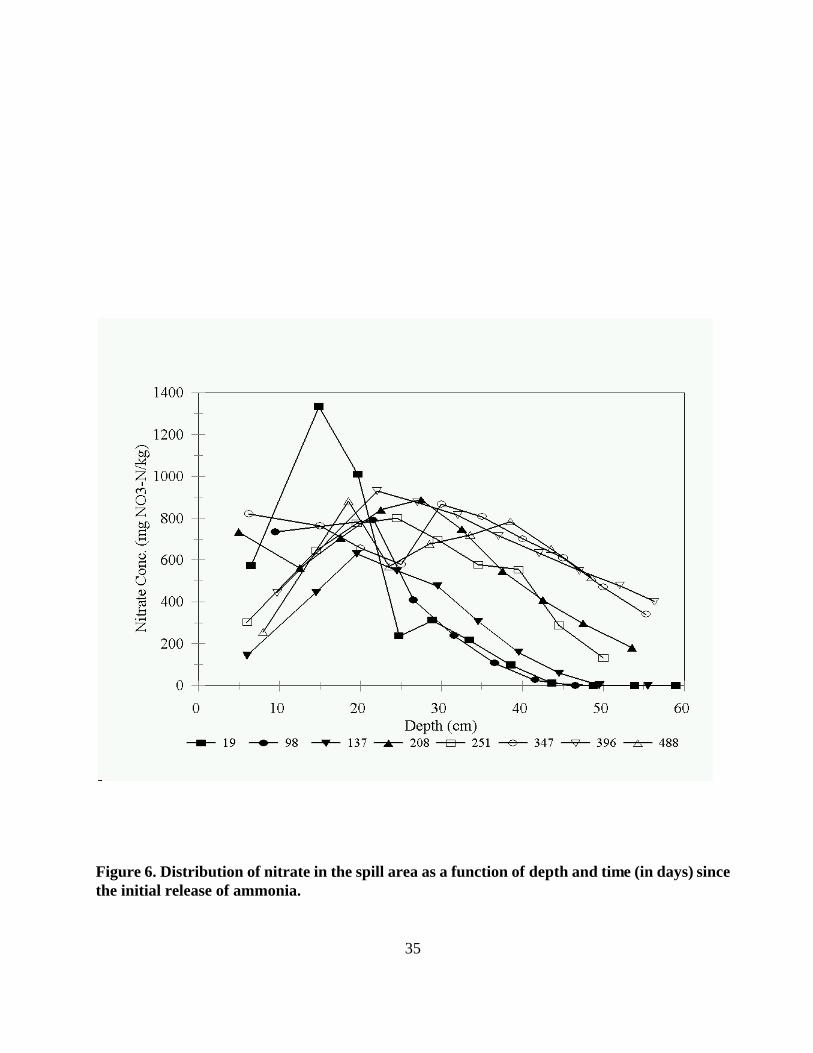


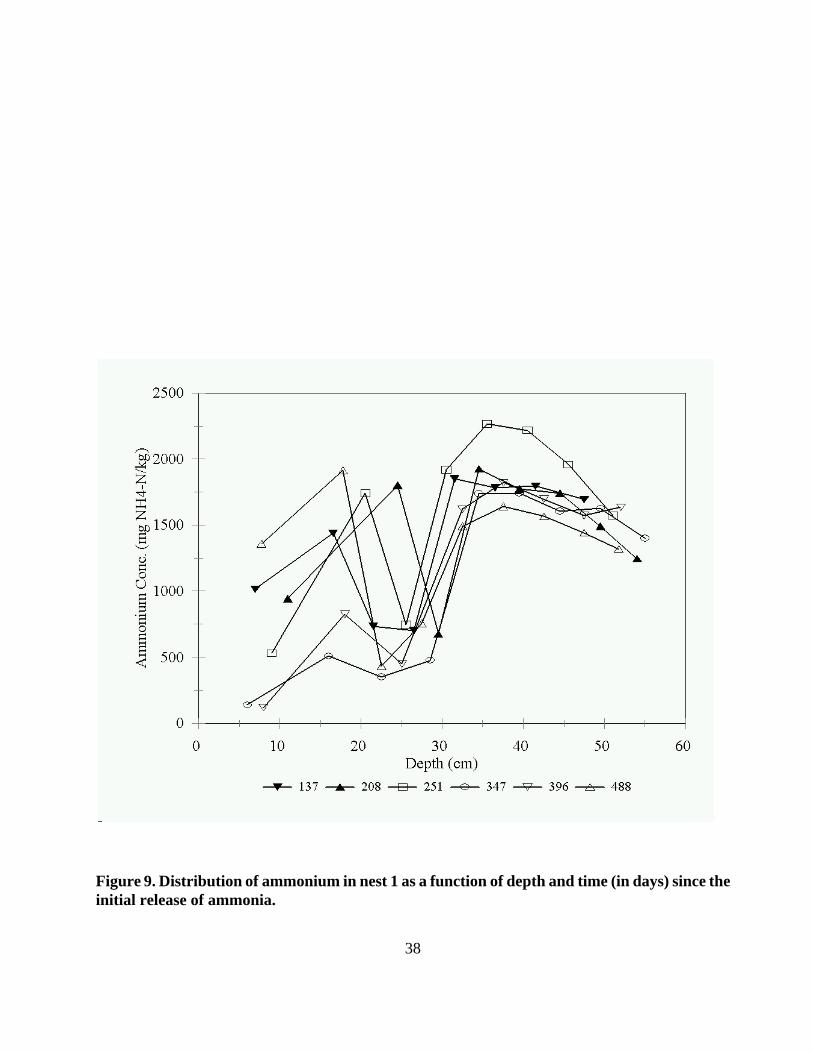


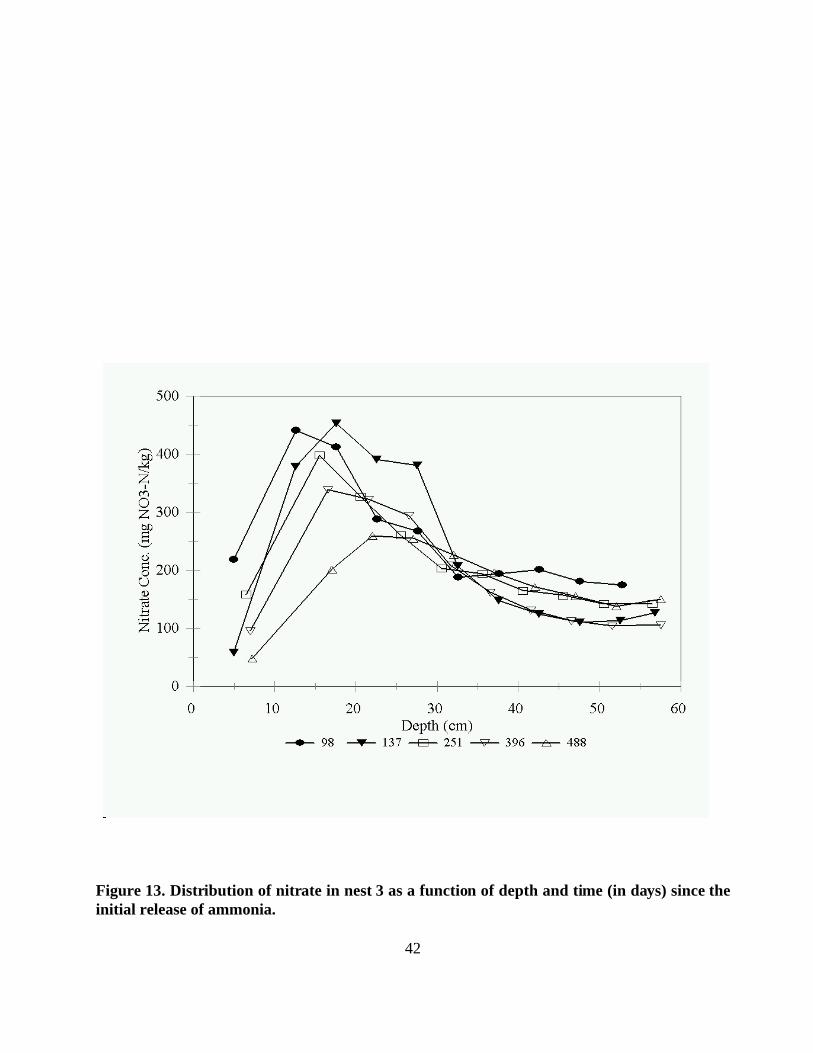
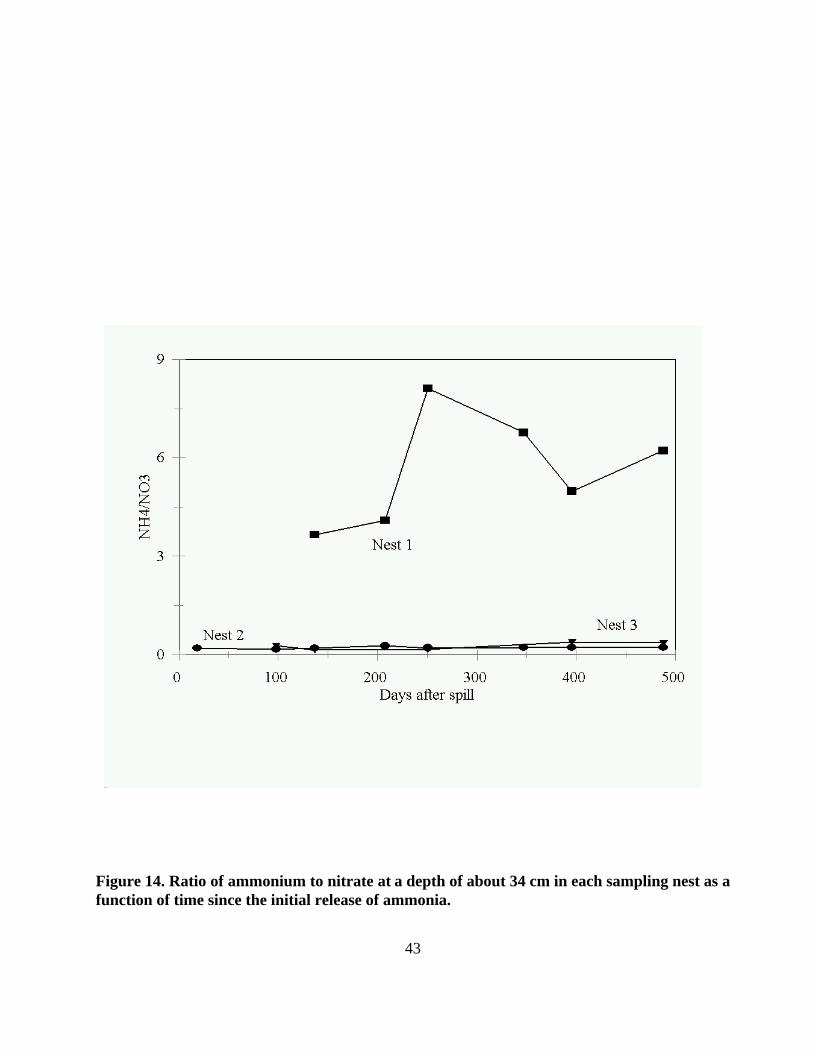

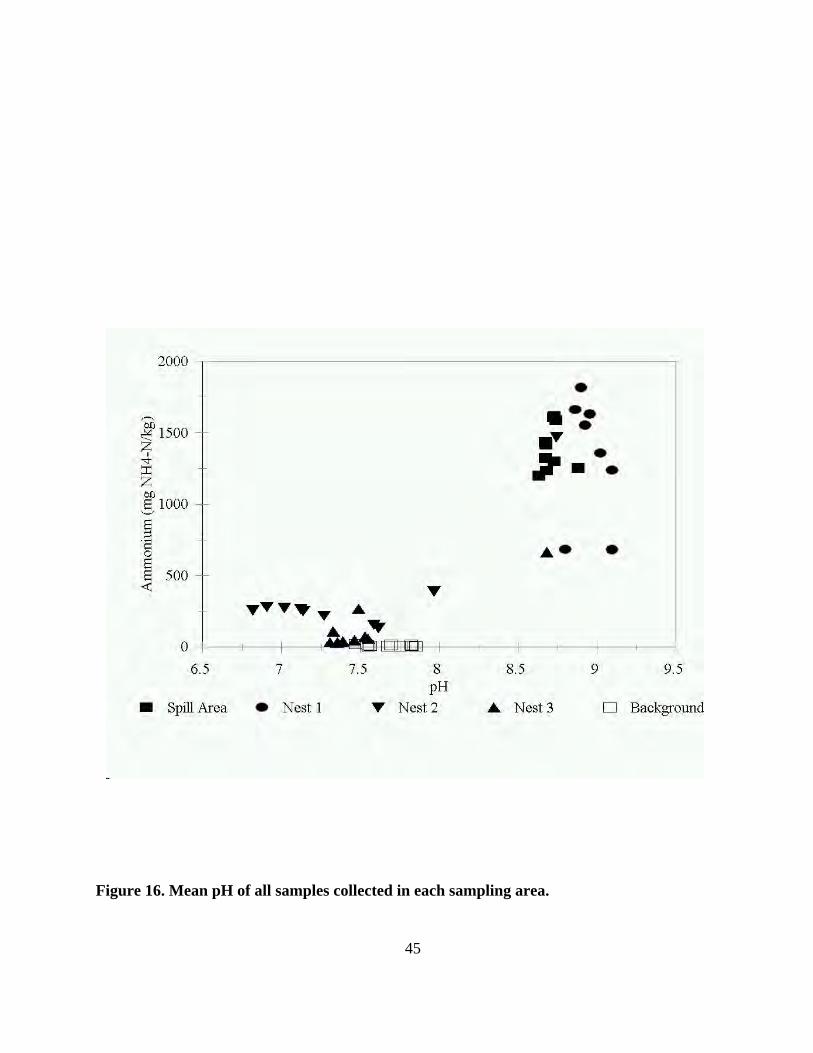


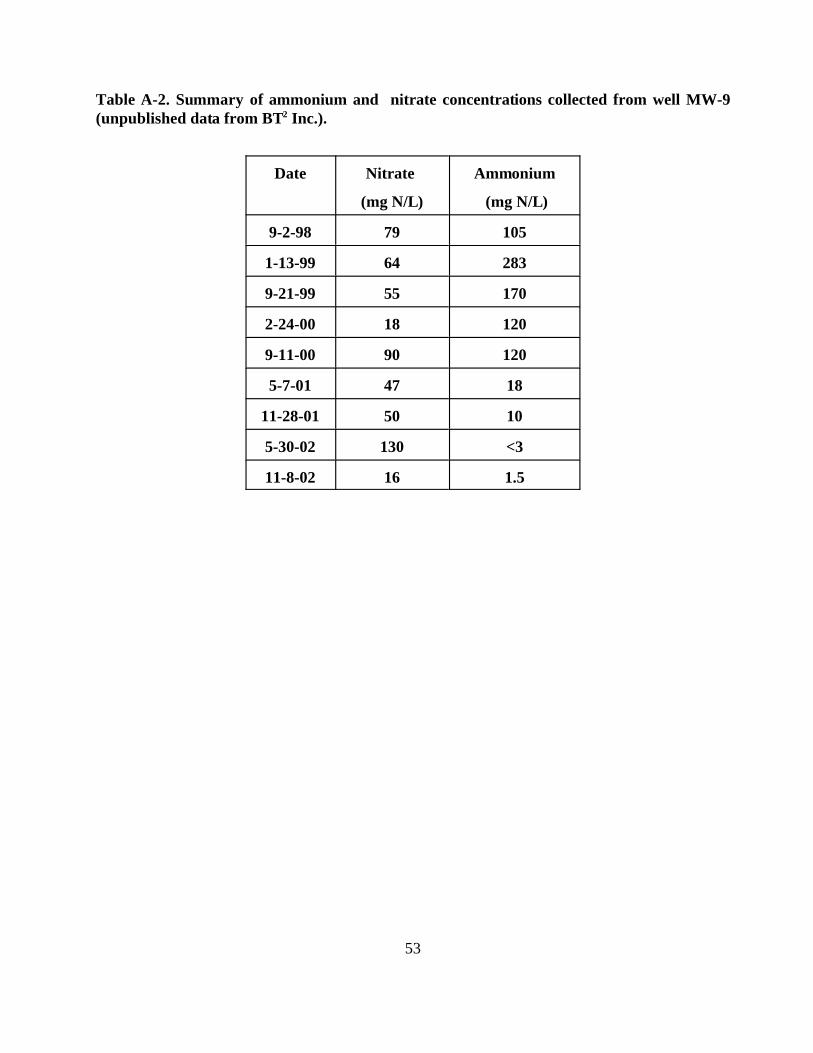


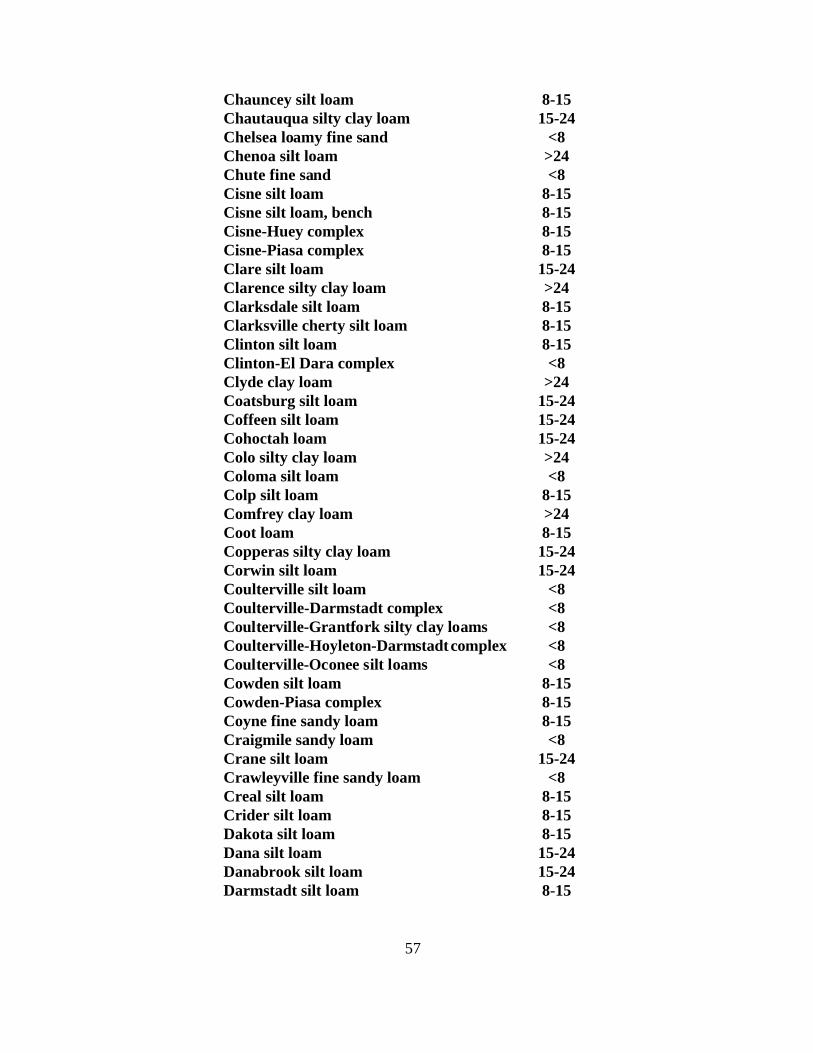
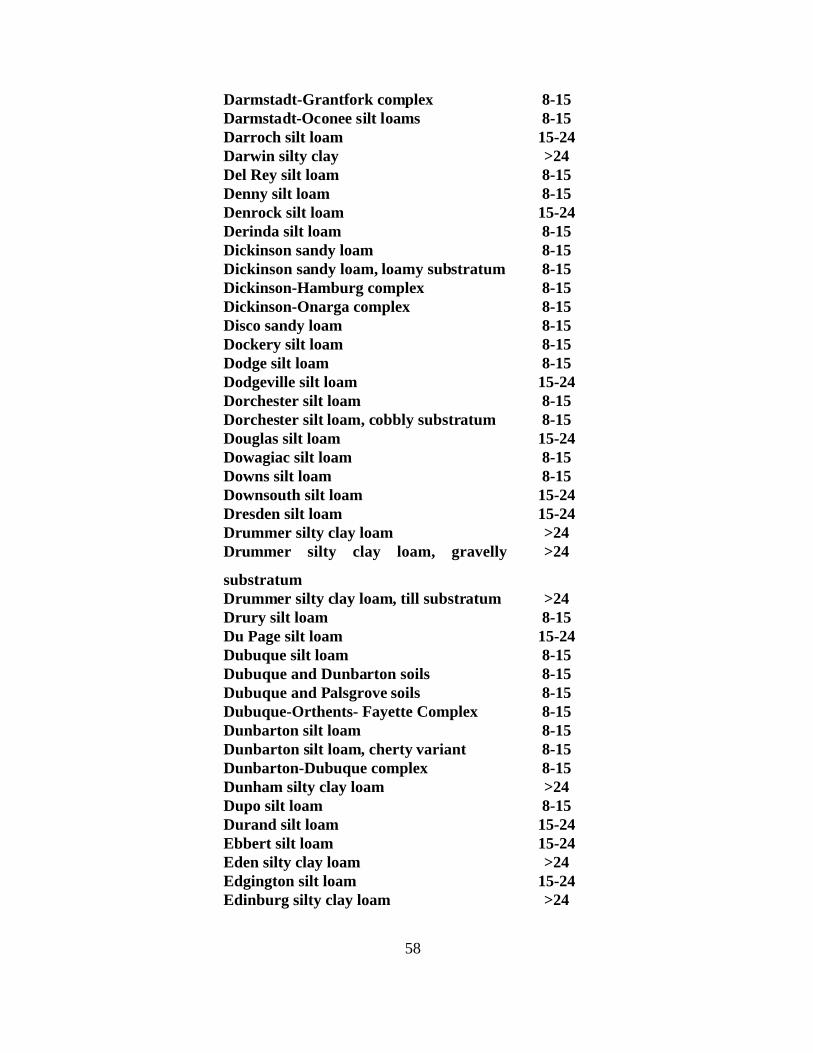

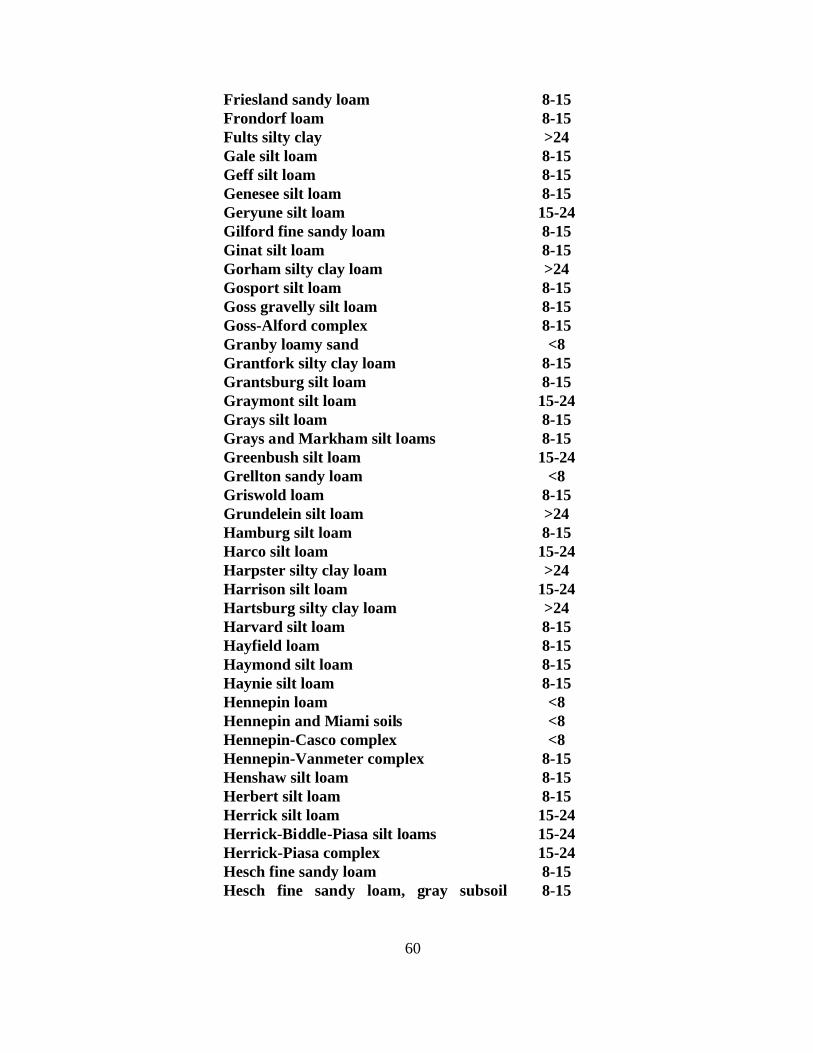
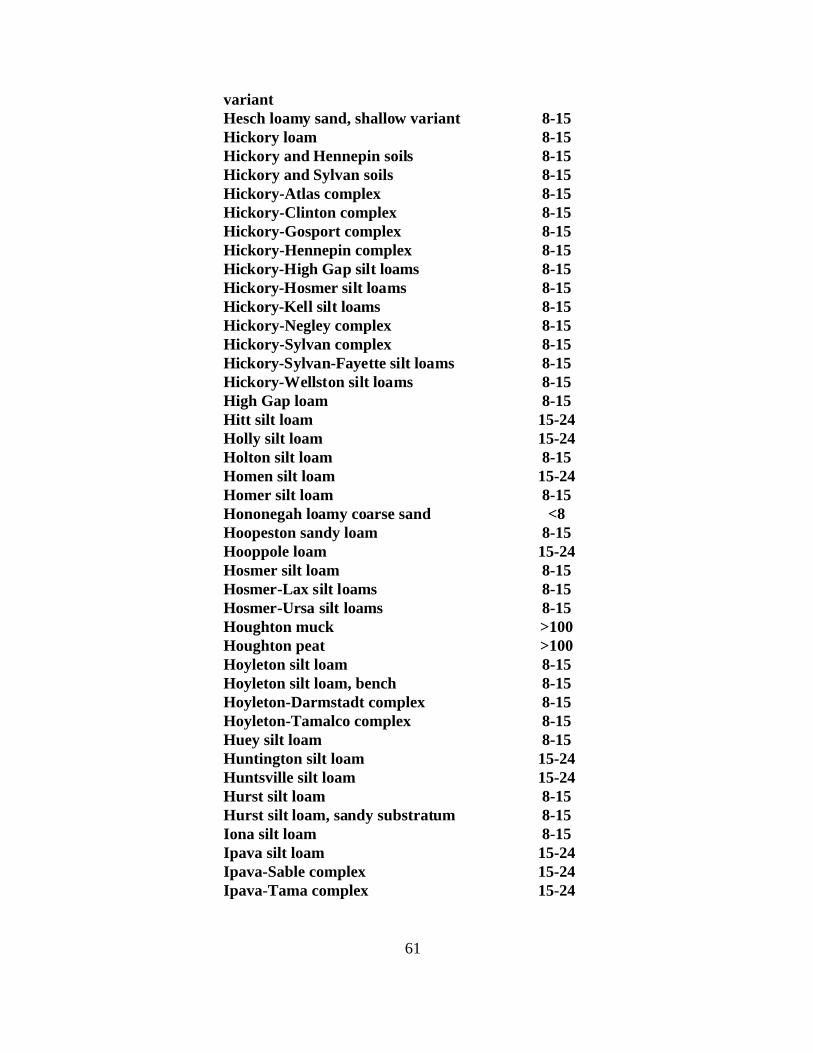
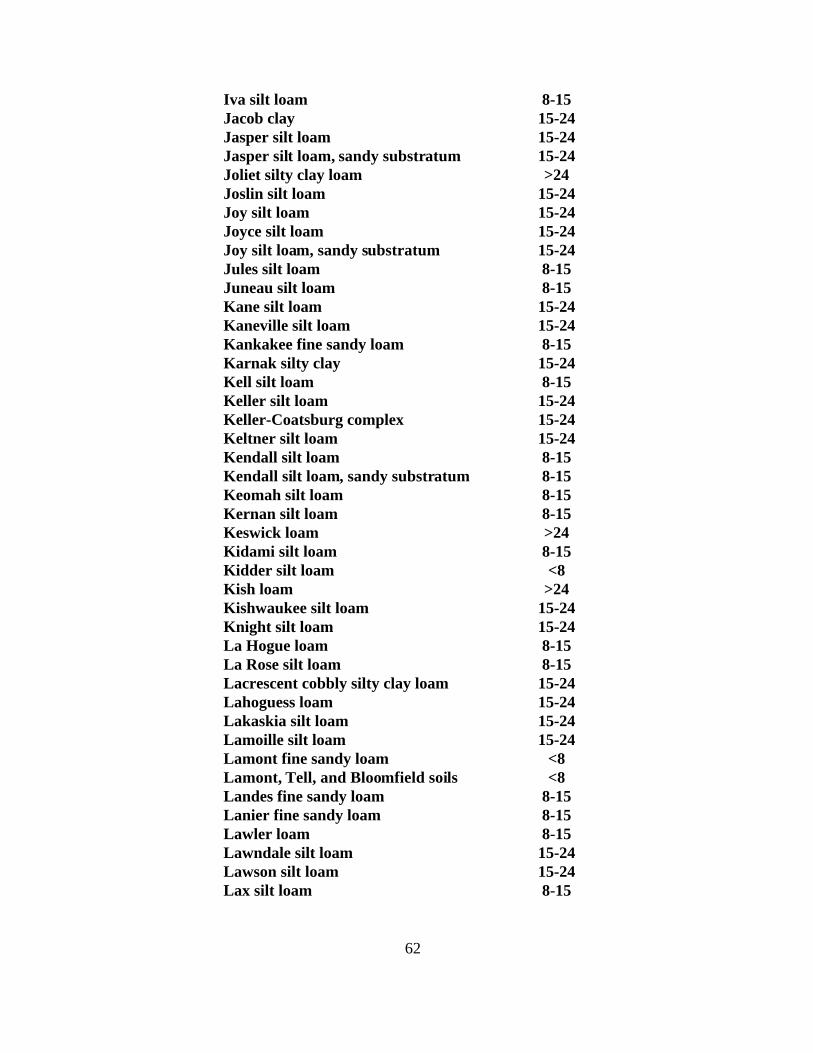


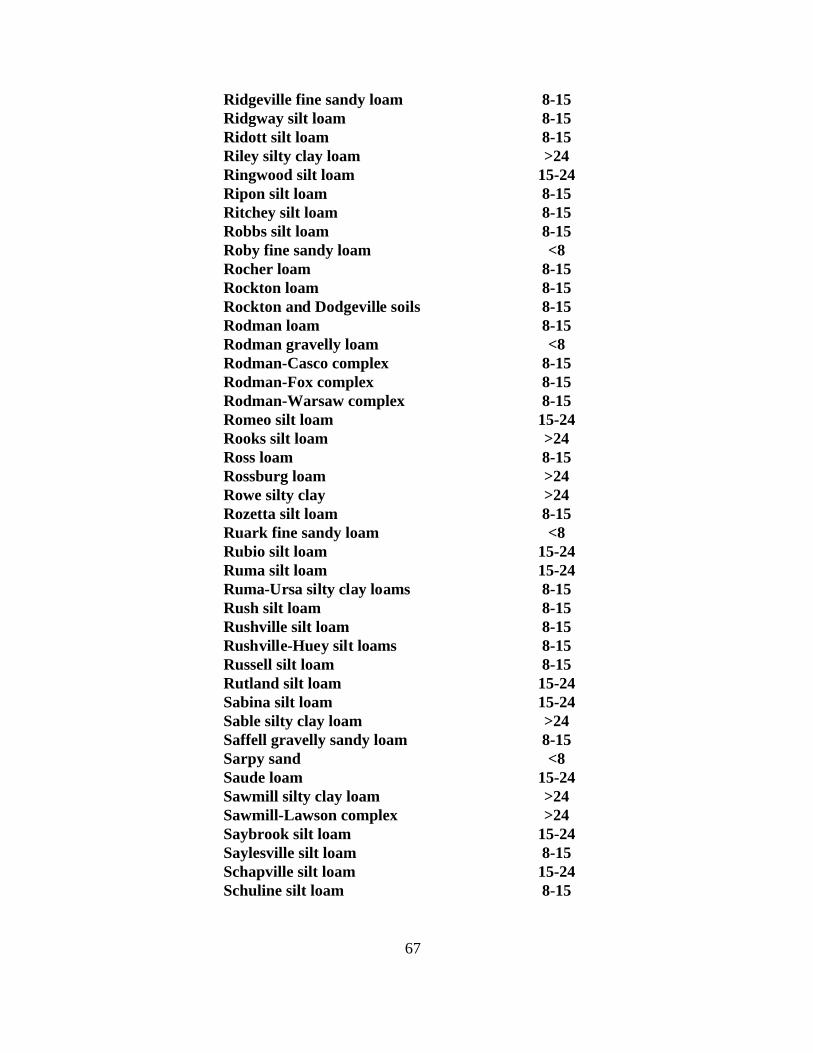


![The Genetics of Symbiotic Nitrogen Fixation: … › id › eprint › 7978 › ...nitrogen fixation as an alternative to nitrogen fertilizers is forecast to increase [1]. Symbiotic](https://static.documents.pub/doc/80x56/5f28b87fa2f7bf549f1d9235/the-genetics-of-symbiotic-nitrogen-fixation-a-id-a-eprint-a-7978-a-.jpg)
