23
Potentiometric Surface Map - September 2007 Sources of Nitrate and Estimated Groundwater Travel Times to Springs of the Santa Fe River Basin, 2013. AMEC
| Date post: | 24-Dec-2015 |
| Category: |
Documents |
| Upload: | monica-annabelle-hodges |
| View: | 214 times |
| Download: | 0 times |

Potentiometric Surface Map - September 2007
Sources of Nitrate and Estimated Groundwater Travel Times to Springs of the Santa Fe River Basin, 2013. AMEC
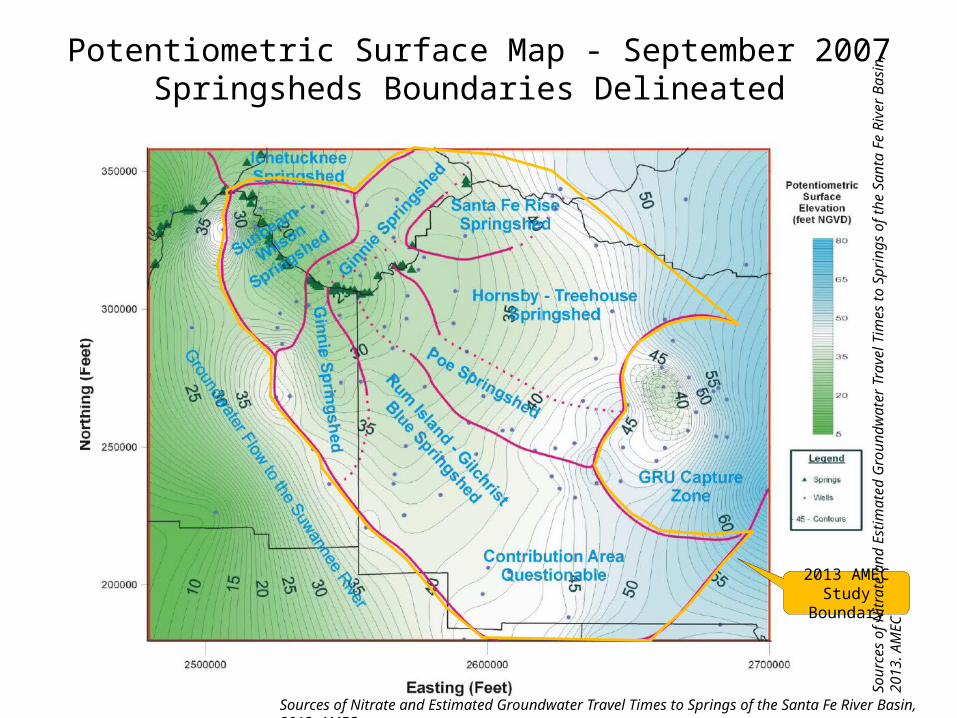
Potentiometric Surface Map - September 2007Springsheds Boundaries Delineated
2013 AMECStudy
Boundary
Sour
ces
of N
itrat
e an
d Es
timat
ed G
roun
dwat
er T
rave
l Tim
es to
Spr
ings
of t
he S
anta
Fe
Rive
r Bas
in, 2
013.
AM
EC
Sources of Nitrate and Estimated Groundwater Travel Times to Springs of the Santa Fe River Basin, 2013. AMEC

Estim
ated
Gro
undw
ater
Rec
harg
e Ra
tes
Sour
ces
of N
itrat
e an
d Es
timat
ed G
roun
dwat
er T
rave
l Tim
es to
Spr
ings
of t
he S
anta
Fe
Rive
r Bas
in, 2
013.
AM
EC

Aquifer Confining Layers in Alachua County

Aquafer Vulnerability and Stream-to-Sink Basins

Karst Landscapes
http://www.nwfwmd.state.fl.us/water-resources/springs/learn-about-springs/

Flow pathways connecting surface sources to aquifer
Unconfined Semi-Confined Confined
“indirect” flowpath
Surface runoff and subsurface pathway to aquifer via sinkholes
“restricted” flowpath
Mostly surface runoff and surficial aquifer
with limited connection to aquifer
“direct” flowpath
Vertical leaching directly to aquifer

Nitrate Concentrations in upper Floridan Aquifer September 2012

Springsheds Study Area Land Use
Sources of Nitrate and Estimated Groundwater Travel Times to Springs of the Santa Fe River Basin, 2013. AMEC

Sources of Nitrate and Estimated Groundwater Travel Times to Springs of the Santa Fe River Basin, 2013. AMEC
Estimated Nitrate-Nitrogen Loading by Land Use

http://www.alachuacounty.us/Depts/epd/WaterResources/GroundwaterAndSprings/SFRSBWG%20Presentations/130926_Nitrate%20Study%20in%20the%20Santa%20Fe%20Springs%20Restoration%20Focus%20Area_Katz.pdf

Sour
ces
of N
itrat
e an
d Es
timat
ed G
roun
dwat
er T
rave
l Tim
es to
Spr
ings
of t
he S
anta
Fe
Rive
r Bas
in, 2
013.
AM
EC
Gro
undw
ater
Tra
vel T
imes

Gro
undw
ater
Tra
vel T
imes
(le
ss th
an 1
00 y
ears
)
Sour
ces
of N
itrat
e an
d Es
timat
ed G
roun
dwat
er T
rave
l Tim
es to
Spr
ings
of t
he S
anta
Fe
Rive
r Bas
in, 2
013.
AM
EC

Mill Creek Sink Dye Trace Study
http://www.alachuacounty.us/Depts/epd/WaterResources/GroundwaterAndSprings/Reports%20and%20Maps%20Documents/Mill%20Creek%20Sink%20Dye%20Trace%202005%20REPORTCmplt.pdf

Mill Creek & Lee Sink Dye Trace Study• Dye released July 26, 11:34• Dye first detected in Hornsby spring August 8 (13 days later)• Distance between Mill Creek sink and Hornsby Spring 6 miles• Groundwater flow rate between Mill Creek Sink and Hornsby Springs 2,440 ft/day• Lee Sink day trace travel rate 1,382 ft/day
http://www.alachuacounty.us/Depts/epd/WaterResources/GroundwaterAndSprings/Reports%20and%20Maps%20Documents/Mill%20Creek%20Sink%20Dye%20Trace%202005%20REPORTCmplt.pdf

http://www.alachuacounty.us/Depts/epd/WaterResources/GroundwaterAndSprings/Reports%20and%20Maps%20Documents/Mill%20Creek%20Sink%20Dye%20Trace%202005%20REPORTCmplt.pdf

Cover-subsidence sinkholes -Cover-subsidence sinkholes tend to develop gradually where the covering sediments are permeable and contain sand. In areas where cover material is thicker or sediments contain more clay, cover-subsidence sinkholes are relatively uncommon, are smaller, and may go undetected for long periods.
Cover-collapse sinkholes - Cover-collapse sinkholes may develop abruptly (over a period of hours). They occur where the covering sediments contain a significant amount of clay.
Two Types of Sinkhole Formation
US Geological Service

Stormwater Basins in Karst Landscapes- prone to sinkhole formation -
Alternative - Dispersed Treatment Train:• Provides treatment near source thereby reducing
volume and contaminant loads in attenuation pond.• Shallower pond depths lower hydraulic head
pressure and allow for greater soil thickness between bottom of pond and underlying limestone.
• Increases treatment surface area for soil, plant, and microbial interaction to improve water quality.
• Distributes risk among multiple treatment cells each of which has lower potential for solution/sink formation.

Can We Achieve 0.35 mg/L Nitrate-Nitrogen?
Loadings to Lower Santa Fe Springsheds
Sources of Nitrate and Estimated Groundwater Travel Times to Springs of the Santa Fe River Basin, 2013. AMEC

Back of Envelope Calculation 1:How much N Fertilizer can you lose per hectare and stay below
nitrate standards?
• Loss of 30 kg/ha in one years worth of recharge (assume 12 in ~0.3 m3/m2)= 10 mg/l (Class I drinking water standard)
• Loss of 1 kg/ha in one years worth of recharge (assume 12 in ~0.3 m3/m2)= 0.35 mg/l (Class III springs nitrate standard)

Land use Assumed Average Leaching
concentration
Hectares of Native Vegetation per hectare of land use (assuming
no denitrification)
Hectares of Native Vegetation per hectare of land use (assuming 30% denitrification)
Forage1 0.85 mg/l 1.4 ha 0.7 ha
Planted Pine3 1.0 mg/l 1.9 ha 1 ha
Residential4 2.0 mg/l 5 ha 3 ha
Citrus2 7.5 mg/l 20 ha 14 ha
Poultry1 10 mg/l 28 ha 19 ha
Row Crop1 25 mg/l 70 ha 47 ha
Dairy1 42.5 mg/l 120 ha 84 ha
For every hectare of intensive land use within a springshed how much native area (leaching at 0 mg/l) do you need to achieve 0.35 mg/l ?
Back of Envelope Calculation 2:
1Graetz et al, 2008; 2Graham et al, 2000 3Harper et al.,20074Tucker et al, 2013 fertilizer, no septic tanks

Past and Projected Nitrate Loads
Sources of Nitrate and Estimated Groundwater Travel Times to Springs of the Santa Fe River Basin, 2013. AMEC

Gronberg, J.M., and Spahr, N.E., 2012, County-level estimates of nitrogen and phosphorus from commercial fertilizer for the Conterminous United States, 1987–2006: U.S. Geological Survey Scientific Investigations Report 2012-5207, 20 p.
Nitrogen Fertilizer Use in Alachua County 1987-2006
1985 1990 1995 2000 2005 2010 -
500,000
1,000,000
1,500,000
2,000,000
2,500,000
3,000,000
Farm Non Farm Linear (Non Farm)
Year
Nitr
ogen
Fer
tiliz
er, k
ilogr
ams


