59
South Asia Pro-Poor Livestock Policy Program Poultry based livelihoods of rural poor: Case of Kuroiler in West Bengal Vinod Ahuja Mamta Dhawan Meeta Punjabi Lucy Maarse
South Asia Pro-Poor Livestock Policy Program
Poultry based livelihoods of rural poor: Case of Kuroiler in West Bengal
Vinod Ahuja
Mamta Dhawan Meeta Punjabi
Lucy Maarse
ii
Poultry Based Livelihoods of Rural Poor Case of Kuroiler in West Bengal
Vinod Ahuja
Mamta Dhawan Meeta Punjabi Lucy Maarse
iii
CONTENTS PREFACE THE STUDY TEAM EXECUTE SUMMARY 1. THE SETTING 2. A BRIEF HISTORY OF KEGGFARMS AND KUROILER
- Free range bird in freed-up India—the birth of Kuroiler 3. METHODOLOGY AND SURVEY DESIGN
4. RESULTS AND DISCUSSION
- Sample profile o Education o Food and nutrition
- Husbandry practices - Credit and extension - Economics of poultry keeping and contribution to household income - Income mapping - Market orientation and women empowerment: Are the two incompatible? - The Value Chain that binds it all together
o Profile of Mother Units and Pheriwalas o Financial analysis of Mother Units and Pheriwalas
Mother Units Pheriwalas
5. SUMMARY AND CONCLUSIONS References ANNEX 1: Breeding Kuroiler and Farm Level ANNEX 2: The Asset Index ANNEX 3: Nine Square Mandala: A Brief Overview ANNEX 4: Division of labour across various tasks in poultry keeping
iv
Figures
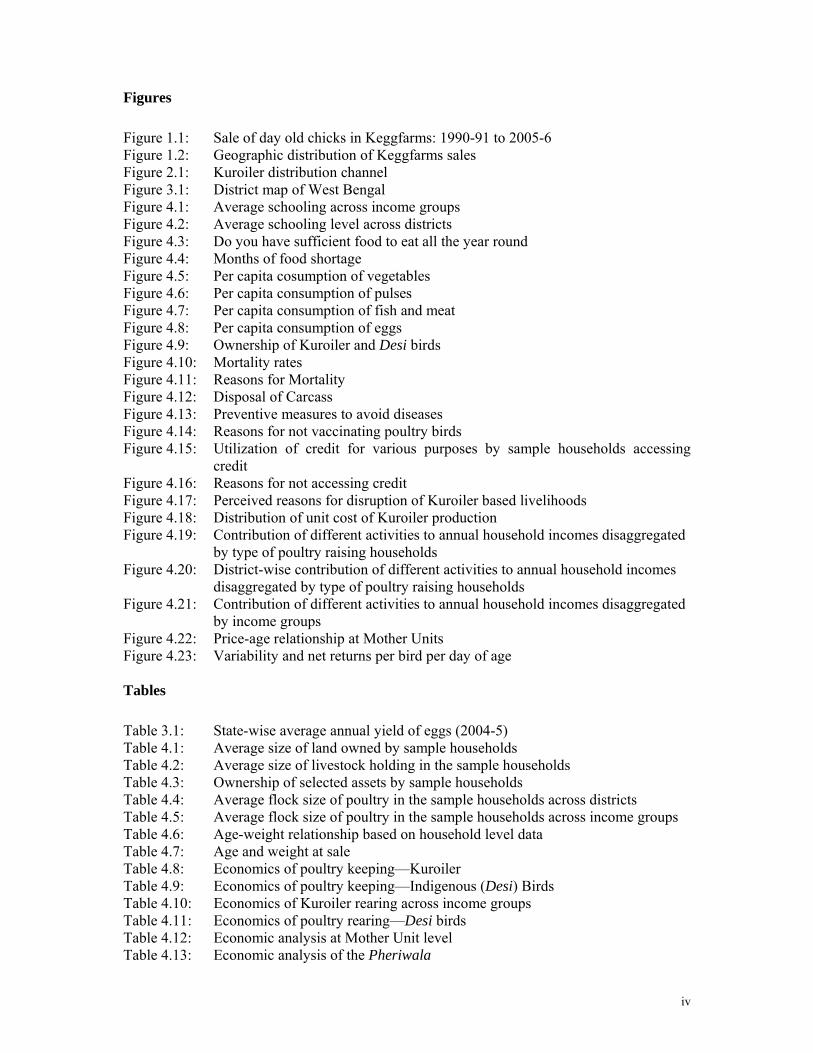
Figure 1.1: Sale of day old chicks in Keggfarms: 1990-91 to 2005-6 Figure 1.2: Geographic distribution of Keggfarms sales Figure 2.1: Kuroiler distribution channel Figure 3.1: District map of West Bengal Figure 4.1: Average schooling across income groups Figure 4.2: Average schooling level across districts Figure 4.3: Do you have sufficient food to eat all the year round Figure 4.4: Months of food shortage Figure 4.5: Per capita cosumption of vegetables Figure 4.6: Per capita consumption of pulses Figure 4.7: Per capita consumption of fish and meat Figure 4.8: Per capita consumption of eggs Figure 4.9: Ownership of Kuroiler and Desi birds Figure 4.10: Mortality rates Figure 4.11: Reasons for Mortality Figure 4.12: Disposal of Carcass Figure 4.13: Preventive measures to avoid diseases Figure 4.14: Reasons for not vaccinating poultry birds Figure 4.15: Utilization of credit for various purposes by sample households accessing
credit Figure 4.16: Reasons for not accessing credit Figure 4.17: Perceived reasons for disruption of Kuroiler based livelihoods Figure 4.18: Distribution of unit cost of Kuroiler production Figure 4.19: Contribution of different activities to annual household incomes disaggregated
by type of poultry raising households Figure 4.20: District-wise contribution of different activities to annual household incomes
disaggregated by type of poultry raising households Figure 4.21: Contribution of different activities to annual household incomes disaggregated
by income groups Figure 4.22: Price-age relationship at Mother Units Figure 4.23: Variability and net returns per bird per day of age Tables
Table 3.1: State-wise average annual yield of eggs (2004-5) Table 4.1: Average size of land owned by sample households Table 4.2: Average size of livestock holding in the sample households Table 4.3: Ownership of selected assets by sample households Table 4.4: Average flock size of poultry in the sample households across districts Table 4.5: Average flock size of poultry in the sample households across income groups Table 4.6: Age-weight relationship based on household level data Table 4.7: Age and weight at sale Table 4.8: Economics of poultry keeping—Kuroiler Table 4.9: Economics of poultry keeping—Indigenous (Desi) Birds Table 4.10: Economics of Kuroiler rearing across income groups Table 4.11: Economics of poultry rearing—Desi birds Table 4.12: Economic analysis at Mother Unit level Table 4.13: Economic analysis of the Pheriwala
v
Acknowledgments This study was commissioned by South Asia Pro-Poor Livestock Policy Program (SA PPLPP)
— A Joint Program of National Dairy Development Board, Anand and Food and Agriculture Organization of the UN, Rome, Italy. We are grateful to the SA PPLPP Management Board for their support.
The study has been both a challenge and an opportunity. But the challenges before us were
greatly reduced by the enthusiasm and seamless cooperation and support of Keggfarms management and staff. The zeal, curiosity, unconditional support and sheer enthusiasm shown by Mr. Vinod Kapur, Chairman, Keggfarms Private Ltd, were the real source of inspiration and energy for the study team. We take this opportunity to express our sincere gratitude to him. Other members of Keggfarms family who deserve special mention are Mr. Milan Biswas, Regional Manager (Eastern Zone) and Mr. Shiv Kumar. The study would not have been possible without their unstinted support. We express our sincere appreciation to them.
The fieldwork for the survey was carried out by a team of seven students—Arupananda Maiti,
Gopal Patra, Tista Mondal, Nabanita Chattopadhyaya, Bappa Goswami, and Devapriya Har, from West Bengal University of Animal and Fishery Sciences. In addition, the qualitative survey team was assisted by Sushmita Roy. The team travelled to some of the remotest parts of West Bengal in some of the most inhospitable weather and transport conditions. Despite the difficulties, it goes to their credit that they not only finished the task well in time but ensured the data quality was not compromised. The study teams wishes to acknowledge their commitment and sincerity and their contribution to the study.
We had the benefit of discussions and guidance from a number of colleagues and
professionals. Joachim Otte (Pro-Poor Livestock Policy Initiative, FAO), Anni Mcleod (FAO), Rebecca Kattikaren (Independent Consultant) and Kornel Das (SA PPLPP Associate Professional) provided generous intellectual inputs in design and implementation of survey and interpretation of results. We remain obliged to them for their contribution at all stages of the study.
Preliminary findings of the study were discussed at a workshop held in Kolkata in December
2007.. The workshop was attended by more than 80 participants and all of them participated with great enthusiasm and provided inputs that helped improve the analysis. We express our sincere thanks to all the participants. While it is not possible to mention individual names, the study team takes this opportunity to express special thanks to Dr. SK Bandopadhyaya, Animal Husbandry Commissioner, Government of India, Mr. Dilip Chakraborty, Principal Secretary, Animal Husbandry, Government of West Bengal, Mr. Shankar Ghosh, Senior Advisor, Keggfarm, Dr. Dilip Kumar Das, Director Department of Animal Resources and Development, Government of West Bengal, Dr. S. Pan, West Bengal University of Animal and Fishery Sciences, Dr. Datta Rangnekar, (independent consultant) and Dr Harun Ur Rashid, SA PPLPP country team associate / Manager of Poultry and Livestock Development, BRAC, Dhaka, Bangladesh.
Last, but not the least, our most special thanks go to Sheila Ann Koyyana, the Programme
Manager, of SA PPLPP. She not only responded to but in fact anticipated all the reasonable and not so reasonable demands of the study team with highest level of professionalism, efficiency, and courteousness and deserves much appreciation for that. Thanks Sheila.
--Study Team
vi
Authors
Vinod Ahuja is Associate Professor at Indian Institute of Management, Ahmedabad. Mamta Dhawan is senior consultant to SA PPLPP. Meeta Punjabi is consultant to FAO and Lucy Maarse is Regional Team Leader, South Asia Pro-Poor Livestock Policy Program (SA PPLPP).
Disclaimer The designations employed and the presentation of material in this publication do not imply the expression of any opinion whatsoever on the part of SA PPLPP or the supporting organizations namely the National Dairy Development Board (NDDB) of India and Food and Agriculture Organization (FAO) of the United Nations, concerning the legal status of any country, territory, city or area or its authorities or concerning the delimitations of its frontiers or boundaries. The opinions expressed are solely those of the author(s) and do not constitute in any way the official position of SA PPLPP, NDDB or FAO.
0
1. The Setting
In recent years there has been increasing recognition among the development
community of the role of backyard poultry production in sustaining and enhancing poor
peoples’ livelihoods in developing countries. Market oriented backyard poultry enterprises
are being recognized as a stepping stone for the poorest households enabling them to take the
first step towards breaking out of the vicious circle of poverty and deprivation. There is also
growing evidence to demonstrate the role of rural family poultry in enhancing the food and
nutrition security of the poorest households, reducing the livelihood vulnerability and
insecurity, and promotion of gender equity (Dolberg, 2004; Ahuja, 2004; Ahuja and Sen,
2007; Otte, 2006).
At the same time, the market and production context of poultry production has been
changing rapidly over the last two decades. Rapid economic growth and urbanization has
resulted in fast expansion of industrial large scale, vertically integrated, poultry production
units. Opportunities have also expanded for small scale poultry enterprises due to improved
market access infrastructure and a preference structure that might still favour free range desi1
birds and eggs. As a result, there has been increased market orientation even among small
scale poultry enterprises. These changes have brought large and small production systems in
overlapping competitive space which has created both challenges and opportunities.
Despite the potential offered by backyard poultry production in reaching out to the
poorest, there has been little public support for backyard poultry production in India.
Recently, however, the Government of India and a number of State governments have
become sensitive to the potential offered by this activity and have begun to promote backyard
poultry through various schemes. Similarly, there is growing realization among the private
sector players of the ‘business potential’ offered by this sector. This opens up new
possibilities of nurturing synergistic partnerships between public, private and civil society
organizations with the common objective of enhancing poor peoples’ livelihoods.
One example of private sector promoted backyard poultry in India pertains to the
‘Kuroiler’ introduced by Keggfarms Private Ltd. Kuroiler – “Kegg + Broiler” is a dual
purpose hardy bird with significantly higher productivity than indigenous birds while
1 ‘Desi’ refers to indigenous poultry species.
1
retaining many desirable features of indigenous birds, such as the feather colors for
camouflage, agility to escape from predators and resistance to diseases2.
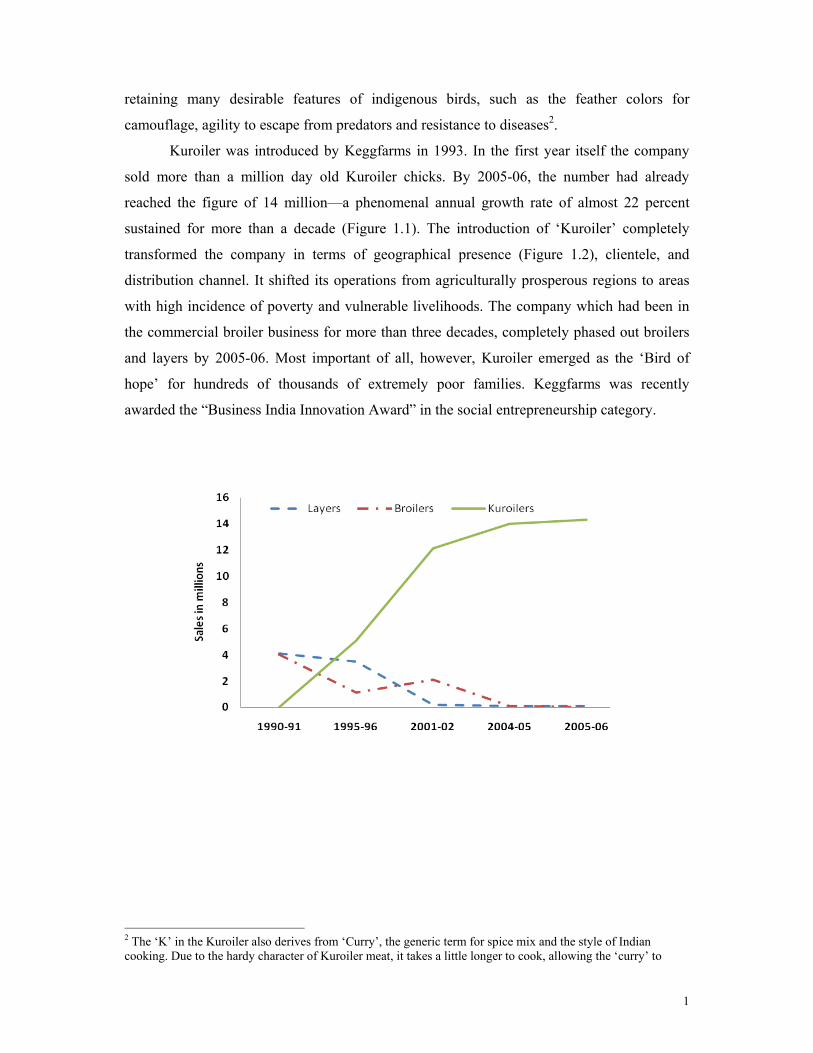
Kuroiler was introduced by Keggfarms in 1993. In the first year itself the company
sold more than a million day old Kuroiler chicks. By 2005-06, the number had already
reached the figure of 14 million—a phenomenal annual growth rate of almost 22 percent
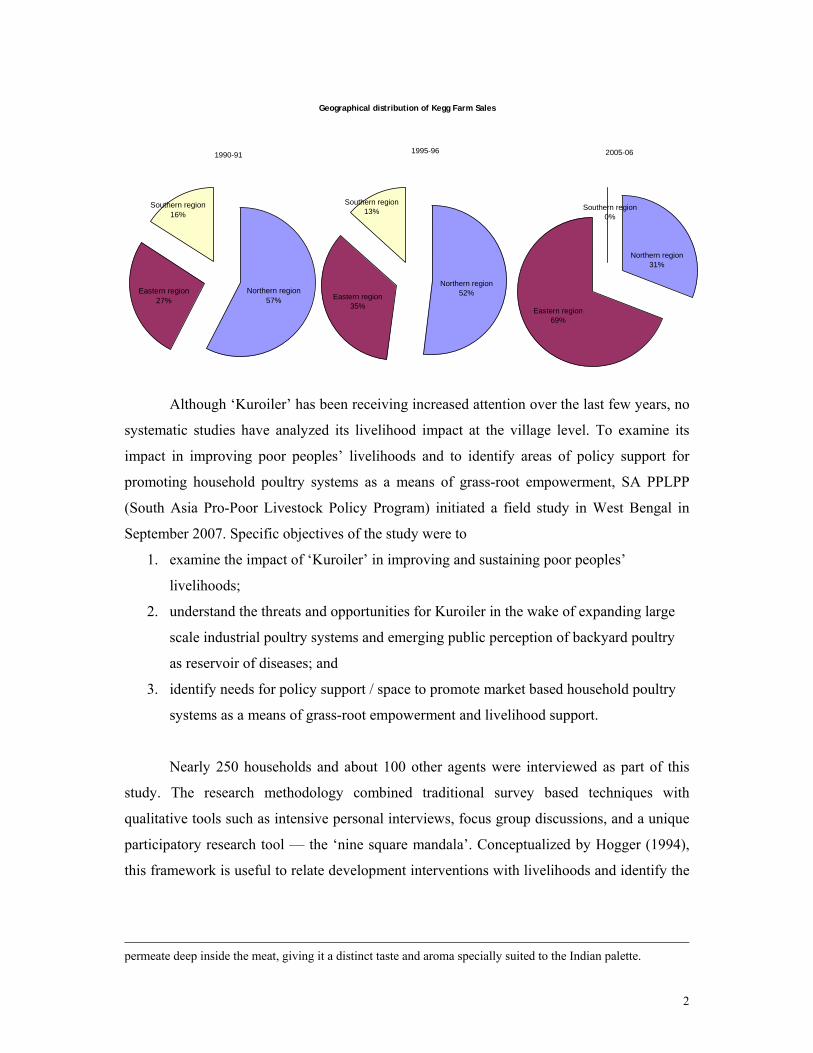
sustained for more than a decade (Figure 1.1). The introduction of ‘Kuroiler’ completely
transformed the company in terms of geographical presence (Figure 1.2), clientele, and
distribution channel. It shifted its operations from agriculturally prosperous regions to areas
with high incidence of poverty and vulnerable livelihoods. The company which had been in
the commercial broiler business for more than three decades, completely phased out broilers
and layers by 2005-06. Most important of all, however, Kuroiler emerged as the ‘Bird of
hope’ for hundreds of thousands of extremely poor families. Keggfarms was recently
awarded the “Business India Innovation Award” in the social entrepreneurship category.
2 The ‘K’ in the Kuroiler also derives from ‘Curry’, the generic term for spice mix and the style of Indian cooking. Due to the hardy character of Kuroiler meat, it takes a little longer to cook, allowing the ‘curry’ to
2
Although ‘Kuroiler’ has been receiving increased attention over the last few years, no
systematic studies have analyzed its livelihood impact at the village level. To examine its
impact in improving poor peoples’ livelihoods and to identify areas of policy support for
promoting household poultry systems as a means of grass-root empowerment, SA PPLPP
(South Asia Pro-Poor Livestock Policy Program) initiated a field study in West Bengal in
September 2007. Specific objectives of the study were to
1. examine the impact of ‘Kuroiler’ in improving and sustaining poor peoples’
livelihoods;
2. understand the threats and opportunities for Kuroiler in the wake of expanding large
scale industrial poultry systems and emerging public perception of backyard poultry
as reservoir of diseases; and
3. identify needs for policy support / space to promote market based household poultry
systems as a means of grass-root empowerment and livelihood support.
Nearly 250 households and about 100 other agents were interviewed as part of this
study. The research methodology combined traditional survey based techniques with
qualitative tools such as intensive personal interviews, focus group discussions, and a unique
participatory research tool — the ‘nine square mandala’. Conceptualized by Hogger (1994),
this framework is useful to relate development interventions with livelihoods and identify the
permeate deep inside the meat, giving it a distinct taste and aroma specially suited to the Indian palette.
Geographical distribution of Kegg Farm Sales
1990-91
Southern region16%
Eastern region27%
Northern region57%
1995-96
Northern region52%Eastern region
35%
Southern region13%
2005-06
Southern region0%
Eastern region69%
Northern region31%
3
gaps3. The tool provided the trigger points relating to all aspects of rural livelihood system
and helped in understanding human behavior in its setting—society, resources, politics,
traditions etc. The information gathered helped in bringing out patterns and links between
these aspects and provided insights about inner realities that lead to decision making. More
details about this framework are given in Annex 2.
The organization of this report is as follows. Section 2 lays out a brief history of
Keggfarms and Kuroiler as a background to the results presented in subsequent chapters.
Section 3 presents the design of surveys and the elements of methodology followed in this
study. The results of the study are presented in Section 4. Finally, Section 5 brings together
the findings and presents a synthesis of key lessons.
2. A Brief History of Keggfarms and Kuroiler
Keggfarms was established on a 23 acre compound in 1967 in Gurgaon, then a small
township about 25 Kms from Delhi4. The company was in the business of producing both
broiler and layer chick lines and mostly supplying to urban markets. This was the standard
model in poultry industry—to import the grand parent stock, multiply them and market the
off-springs.
Keggfarms pioneered genetic poultry breeding in India. The idea was to breed high
yielding stock that would be suited to Indian environmental conditions. Initial years were
difficult but fairly quickly the company could show that it was not necessary for India to go
on importing the grand parent stock. With modest resources, and high spirited determination,
Keggfarms proved that it was possible for India to develop its own stock that would be as,
and perhaps more, productive under Indian conditions than the imported stock. That earned
the Keggfarms substantial reputation and respect in the industry, even though the size of the
company continued to be small. The consequence was that other companies also persuaded
their foreign collaborators to provide them the ‘pure line’ stock to begin breeding in India and
developing birds for Indian production and market conditions. As a result, by 1980s India had
3 Baumgarter, R. & Högger, R. (Eds.). (2006) In Search of Sustainable Livelihood Systems, Managing Resources and Change, Sage Publications, New Delhi, Thousand Oaks, London. 4 After India’s liberalization drive initiated in 1991, Gurgaon has emerged as the BPO and mall capital of India and boasts of housing a number of high tech powerhouses including Nokia, Microsoft, Ericsson, Canon, Sapient and so on. The physical landscape of the town has completely transformed from a dusty little village to one that dots swanky glass buildings, wide highways and magnificent malls.
4
become completely self-sufficient in poultry breeding stock. By 1991, Keggfarms was selling
more than 9.5 million broiler and layer chicks. A significant proportion—close to 60
percent—of their sale was in North Indian states (Punjab, Haryana, Chandigarh, Delhi,
Western Uttar Pradesh, and Rajasthan).
Free range bird in freed-up India—the birth of Kuroiler
The year 1991 marked an important turning point for Indian economy. A highly
protected regime was thrown open to domestic and international players with significant
liberalization of industrial and foreign trade policies. At that time, the company faced three
choices. One, scale up the operations and compete with the multinationals with much deeper
pockets. Two, join hands with them. And three, somehow differentiate the product where the
company will have sustained demand for foreseeable future. At that time, the company
management thought of rural poultry.
The company took some time to study poultry production practices in villages. The
idea was to develop a bird that will be significantly more productive in the given sanitary
conditions and husbandry practices. After a careful study, the company decided to breed a
dual purpose bird which would be as hardy as a local village bird but would still produce
many more eggs and grow much faster than desi bird. In addition, it must retain the feather
colors, be agile to run away from predators and must be as disease resistant. With relatively
well developed in-house breeding capacities, it did not take the company too long to produce
a bird with the desired traits. ‘Kuroiler’ was born in 1993 and distributed in selected villages.
As noted earlier, the sale of Kuroiler day old chicks touched one million in the first year
itself.
Estimates of how far has the Kuroiler traveled are imprecise at best. Recent reports suggest
that the Kuroiler has already touched the lives of about a million households in some of
India’s poorest regions. Keggfarms supplies its ‘day old chicks’ to 1,500 mother units across
the states where it operates directly or through its appointed dealers/suppliers. The mother
units are operated by local entrepreneurs and keep anywhere between 50 to 2,000 birds at one
time.
5
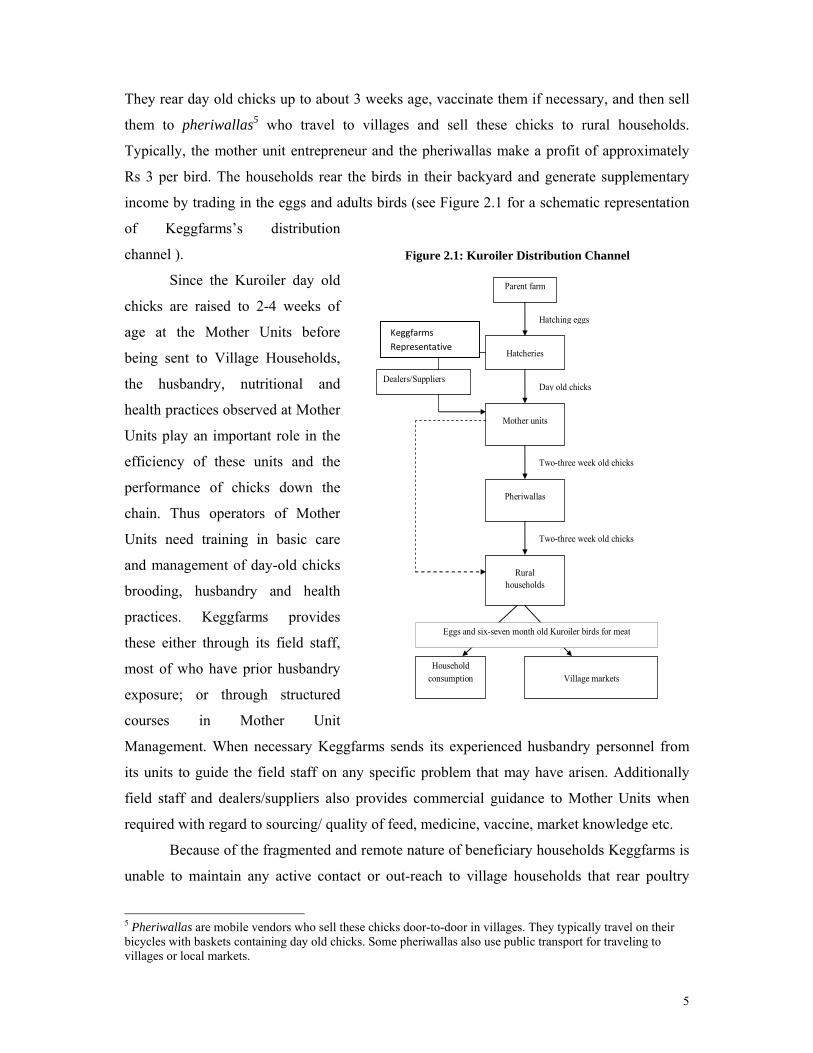
They rear day old chicks up to about 3 weeks age, vaccinate them if necessary, and then sell
them to pheriwallas5 who travel to villages and sell these chicks to rural households.
Typically, the mother unit entrepreneur and the pheriwallas make a profit of approximately
Rs 3 per bird. The households rear the birds in their backyard and generate supplementary
income by trading in the eggs and adults birds (see Figure 2.1 for a schematic representation
of Keggfarms’s distribution
channel ).
Since the Kuroiler day old
chicks are raised to 2-4 weeks of
age at the Mother Units before
being sent to Village Households,
the husbandry, nutritional and
health practices observed at Mother
Units play an important role in the
efficiency of these units and the
performance of chicks down the
chain. Thus operators of Mother
Units need training in basic care
and management of day-old chicks
brooding, husbandry and health
practices. Keggfarms provides
these either through its field staff,
most of who have prior husbandry
exposure; or through structured
courses in Mother Unit
Management. When necessary Keggfarms sends its experienced husbandry personnel from
its units to guide the field staff on any specific problem that may have arisen. Additionally
field staff and dealers/suppliers also provides commercial guidance to Mother Units when
required with regard to sourcing/ quality of feed, medicine, vaccine, market knowledge etc.
Because of the fragmented and remote nature of beneficiary households Keggfarms is
unable to maintain any active contact or out-reach to village households that rear poultry
5 Pheriwallas are mobile vendors who sell these chicks door-to-door in villages. They typically travel on their bicycles with baskets containing day old chicks. Some pheriwallas also use public transport for traveling to villages or local markets.
Figure 2.1: Kuroiler Distribution Channel
Parent farm
Hatcheries
Mother units
Pheriwallas
Rural households
Household consumption
Village markets
Hatching eggs
Day old chicks
Two-three week old chicks
Two-three week old chicks
Eggs and six-seven month old Kuroiler birds for meat
Dealers/Suppliers
KeggfarmsRepresentative
6
from 3 weeks onwards. This remains a critical gap and provides an important avenue for
public-private partnership for harnessing poverty reduction potential of household poultry.
Despite such shortcomings, however, Kuroiler seems to be performing efficiently in the
village conditions as demonstrated by the repeated and increasing demand for them. As a
policy, Keggfarms does not supply day old chicks to villages as this will result in huge
“infant” mortality. When birds are sent at 2-4 weeks of age the livability improves
dramatically.
Sustainability of the Kuroiler model derives from the interdependence of livelihoods
at all levels. Sustainability of pheriwallas depends on the sustainability at household level.
Sustainability of mother units depends on pheriwallas and finally that of Keggfarm depends
on the sustainability of all those in the chain. Unlike externally supported rural poultry
projects, everyone in the Kuroiler chain is independent and yet their livelihoods are
dependent on each other. This characteristic of the Keggfarms model prompted the jury of
“Business India Innovation Awards” jury to note that “(The Business is) sustainable because
it has created rural entrepreneurs. A great deal of scalability happens when such
entrepreneurship is created6” (http://www.businessworld.in/content/view/729/784/).
With regard to the threat of competition from larger players and other risks posed by
public health and bio-security considerations, the company believes that given the very
different nature and characteristics of large scale commercial and small scale household
production systems, the two systems are likely to continue to operate in segmented markets.
Currently, there are other companies selling synthetic birds for backyard rearing but they
have not developed the door step delivery system as Keggfarms, while others imitate the
Kuroiler by taking day-old male chicks (commercial layer variety), which are sold at a throw
away price by the industrial hatcheries, through a color bath so that they apparently look like
a Kuroiler. Despite such competition in the market, the sale of Kuroiler day old chicks has
continued to grow very rapidly. The company also believes that the risks posed by large scale
commercial systems are far greater than household based village poultry production due to
inherent resistance to diseases, biodiversity provided by mixed gene pool in local birds and
scattered nature of production thus lowering the risks of large scale outbreaks.
6 Keggfarms was recently conferred ‘Innovation for India’ award in Social (Business) category.
7
3. Methodology and Survey Design
Any study dealing with ‘livelihoods’ has to confront the issue of characterizing
aspects of the livelihood it wishes to examine while maintaining broad consistency with
generally understood notions of the term ‘livelihood’. Although there are a number of
different ways ‘livelihoods’ have been defined in the literature, nearly all of them look at
'livelihoods' as the means of making a living including access to a reliable and permanent
sources of food, income, and employment which in turn depends on a system of capabilities
and assets (resources, social networks, and skills). In order to understand the role and
contribution of Kuroiler in sustaining poor people’s livelihoods, this study focused on its
contribution to income, household nutrition, women’s empowerment, and development of
entrepreneurial capacity. Towards that end, this study followed a traditional survey
methodology and a qualitative approach. The formal methods were further supplemented by
formal and informal focus group discussions at the community level. The sample and the
sampling frame for both qualitative and quantitative components of the study were kept
identical to ensure the two methodological components complemented each other. A
quantitative survey collected information on measurable indicators such as income levels,
socio-demographic characteristics, physical assets and natural resource base, nutritional
levels, aspects of market access, and access to information. A qualitative component on the
other hand focused more on aspects which could not be easily captured within the framework
of quantitative measurement. These included aspects of livelihood systems such as intra-
household nutritional allocation, decision making dynamics within the household, gender
empowerment, etc and Kuroiler’s contribution towards them.
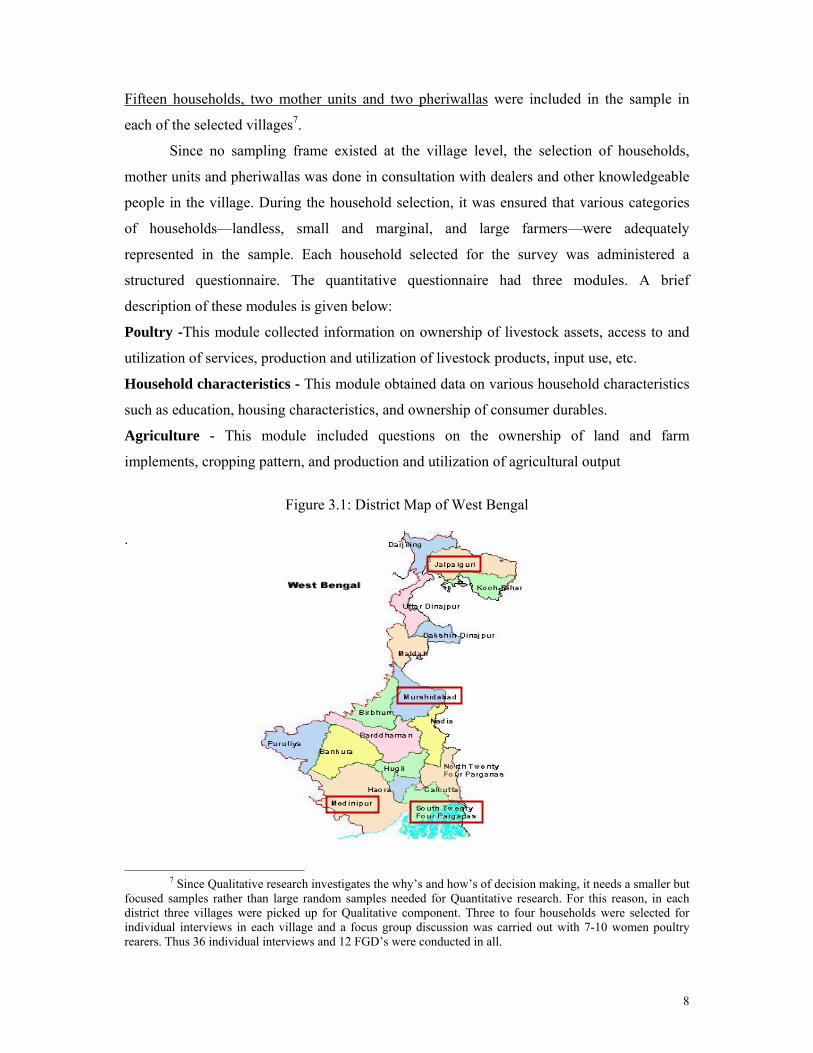
The study was conducted in four districts of West Bengal, namely South 24 Parganas,
East Midnapore, Murshidabad, and Jalpaiguri (see Figure 3.1 for location of these districts
within West Bengal). Since the primary objective of the study was to understand the
‘livelihood’ impact of Kuroiler, it was necessary that the sample contained sufficient data
points of Kuroiler and desi (indigenous) birds. Thus, the sample was drawn with two main
considerations in mind—adequate representation of (i) areas with Kuroiler and desi poultry
population and (ii) geographic and agro-climatic diversity. The fieldwork for this survey was
done during September--October 2007.
The sample selection followed a two-stage process. In the first stage, four districts
were selected to satisfy the sampling considerations. In the second stage, five villages per
district were selected in consultation with Keggfarm dealers and other informed observers.
8
Fifteen households, two mother units and two pheriwallas were included in the sample in
each of the selected villages7.
Since no sampling frame existed at the village level, the selection of households,
mother units and pheriwallas was done in consultation with dealers and other knowledgeable
people in the village. During the household selection, it was ensured that various categories
of households—landless, small and marginal, and large farmers—were adequately
represented in the sample. Each household selected for the survey was administered a
structured questionnaire. The quantitative questionnaire had three modules. A brief
description of these modules is given below:
Poultry -This module collected information on ownership of livestock assets, access to and
utilization of services, production and utilization of livestock products, input use, etc.
Household characteristics - This module obtained data on various household characteristics
such as education, housing characteristics, and ownership of consumer durables.
Agriculture - This module included questions on the ownership of land and farm
implements, cropping pattern, and production and utilization of agricultural output
Figure 3.1: District Map of West Bengal
.
7 Since Qualitative research investigates the why’s and how’s of decision making, it needs a smaller but
focused samples rather than large random samples needed for Quantitative research. For this reason, in each district three villages were picked up for Qualitative component. Three to four households were selected for individual interviews in each village and a focus group discussion was carried out with 7-10 women poultry rearers. Thus 36 individual interviews and 12 FGD’s were conducted in all.
9
Separate questionnaires with similar structure were prepared for mother unit owners
and pheriwallas and administered during the study. In all, data were collected from 260
households, 37 mother units and 37 pheriwallas across 19 villages in four districts.
Examination of livelihood patterns across income categories requires a robust
measure of income. Due to substantial diversity in occupations and sources of income (both
cash and kind) and the inevitability of relying on recall method in absence of any records, the
task of measuring household income within reasonable degree of measurement error is
extremely difficult. In order to get around this problem, this survey collected information on a
number of assets (land, livestock, housing and other consumer durables), created an index of
assets using weights derived from principal component method and used this index as a
measure for income and overall economic status. For the purpose of comparison across
income groups, the households were ranked in ascending order of the index, and comparisons
made across three categories—bottom 20 percent, middle 20 percent and top 20 percent.
Detailed description of the index along with some statistics demonstrating its internal
coherence is given in Annex 3.
4. Results and Discussion
Sample Profile
Similar to most low income countries, household poultry in India finds special favor
with the poor (landless, marginal and small farmers) and disadvantaged communities. Most
of these households work as daily wage workers on construction sites or on other people’s
farms and the earnings are usually insufficient to finance even subsistence consumption
throughout the year. These households rely on small scale low cost poultry production
systems to supplement and enhance their livelihoods or engage in other livelihood support
activities such as mat making or other petty household enterprises.
In the sample selected for this study, approximately half the households belonged to
landless category. The proportion was as high as 70 percent in East Midnapore. Further, the
size of holding was below one acre for nearly 70 percent of those who had some land. Thus,
the sample households comprised mainly landless households or marginal farmers. Land
ownership by income category is given in Table 4.1.
10
Table 4.1: Average size of land owned by sample households
Land holding (acres) Income group
Bottom 20 percent Middle 20 percent Top 20 percent
Irrigated 0.03 0.10 0.49 Non-irrigated 0.08 0.19 0.93
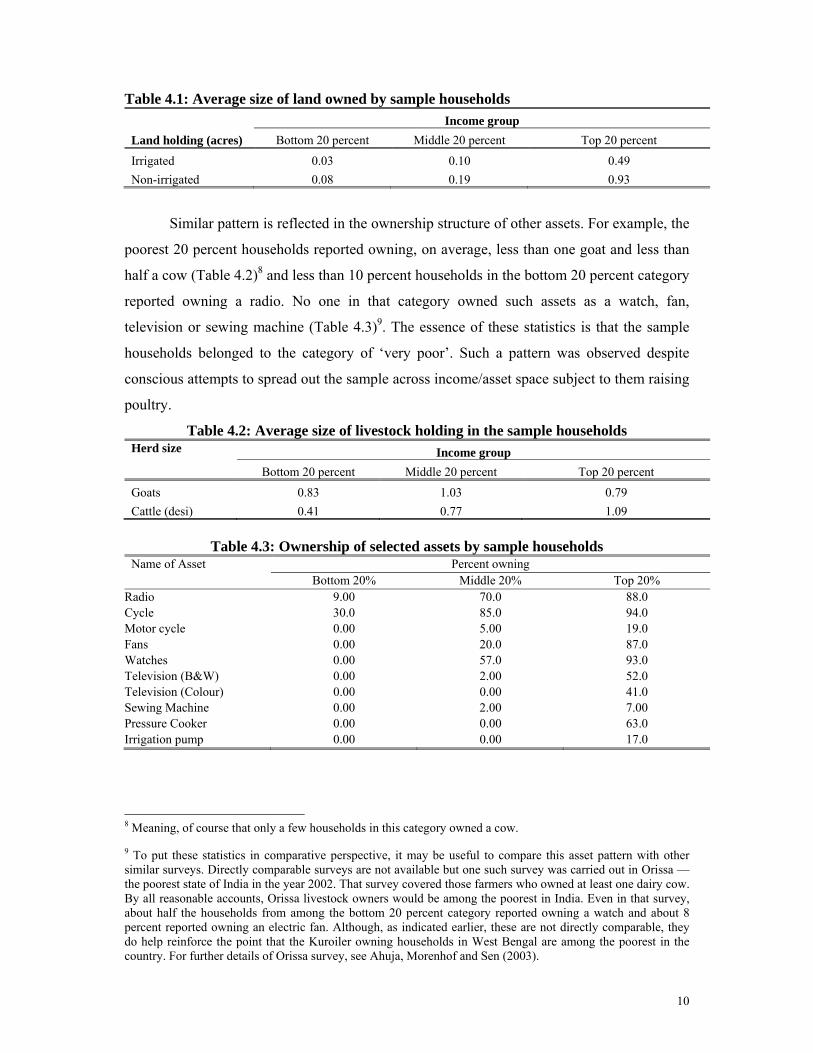
Similar pattern is reflected in the ownership structure of other assets. For example, the
poorest 20 percent households reported owning, on average, less than one goat and less than
half a cow (Table 4.2)8 and less than 10 percent households in the bottom 20 percent category
reported owning a radio. No one in that category owned such assets as a watch, fan,
television or sewing machine (Table 4.3)9. The essence of these statistics is that the sample
households belonged to the category of ‘very poor’. Such a pattern was observed despite
conscious attempts to spread out the sample across income/asset space subject to them raising
poultry.
Table 4.2: Average size of livestock holding in the sample households Herd size Income group
Bottom 20 percent Middle 20 percent Top 20 percent
Goats 0.83 1.03 0.79 Cattle (desi) 0.41 0.77 1.09
Table 4.3: Ownership of selected assets by sample households
Name of Asset Percent owning Bottom 20% Middle 20% Top 20%
Radio 9.00 70.0 88.0 Cycle 30.0 85.0 94.0 Motor cycle 0.00 5.00 19.0 Fans 0.00 20.0 87.0 Watches 0.00 57.0 93.0 Television (B&W) 0.00 2.00 52.0 Television (Colour) 0.00 0.00 41.0 Sewing Machine 0.00 2.00 7.00 Pressure Cooker 0.00 0.00 63.0 Irrigation pump 0.00 0.00 17.0
8 Meaning, of course that only a few households in this category owned a cow. 9 To put these statistics in comparative perspective, it may be useful to compare this asset pattern with other similar surveys. Directly comparable surveys are not available but one such survey was carried out in Orissa — the poorest state of India in the year 2002. That survey covered those farmers who owned at least one dairy cow. By all reasonable accounts, Orissa livestock owners would be among the poorest in India. Even in that survey, about half the households from among the bottom 20 percent category reported owning a watch and about 8 percent reported owning an electric fan. Although, as indicated earlier, these are not directly comparable, they do help reinforce the point that the Kuroiler owning households in West Bengal are among the poorest in the country. For further details of Orissa survey, see Ahuja, Morenhof and Sen (2003).
11
Education
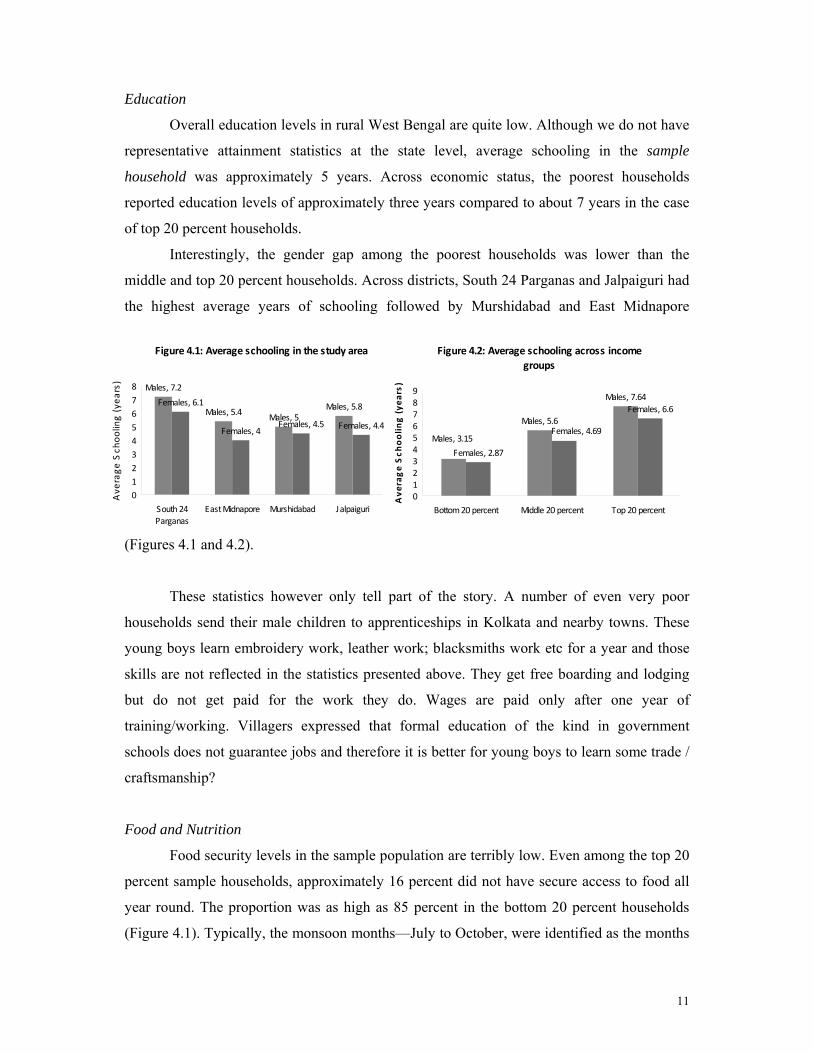
Overall education levels in rural West Bengal are quite low. Although we do not have
representative attainment statistics at the state level, average schooling in the sample
household was approximately 5 years. Across economic status, the poorest households
reported education levels of approximately three years compared to about 7 years in the case
of top 20 percent households.
Interestingly, the gender gap among the poorest households was lower than the
middle and top 20 percent households. Across districts, South 24 Parganas and Jalpaiguri had
the highest average years of schooling followed by Murshidabad and East Midnapore
(Figures 4.1 and 4.2).
These statistics however only tell part of the story. A number of even very poor
households send their male children to apprenticeships in Kolkata and nearby towns. These
young boys learn embroidery work, leather work; blacksmiths work etc for a year and those
skills are not reflected in the statistics presented above. They get free boarding and lodging
but do not get paid for the work they do. Wages are paid only after one year of
training/working. Villagers expressed that formal education of the kind in government
schools does not guarantee jobs and therefore it is better for young boys to learn some trade /
craftsmanship?
Food and Nutrition
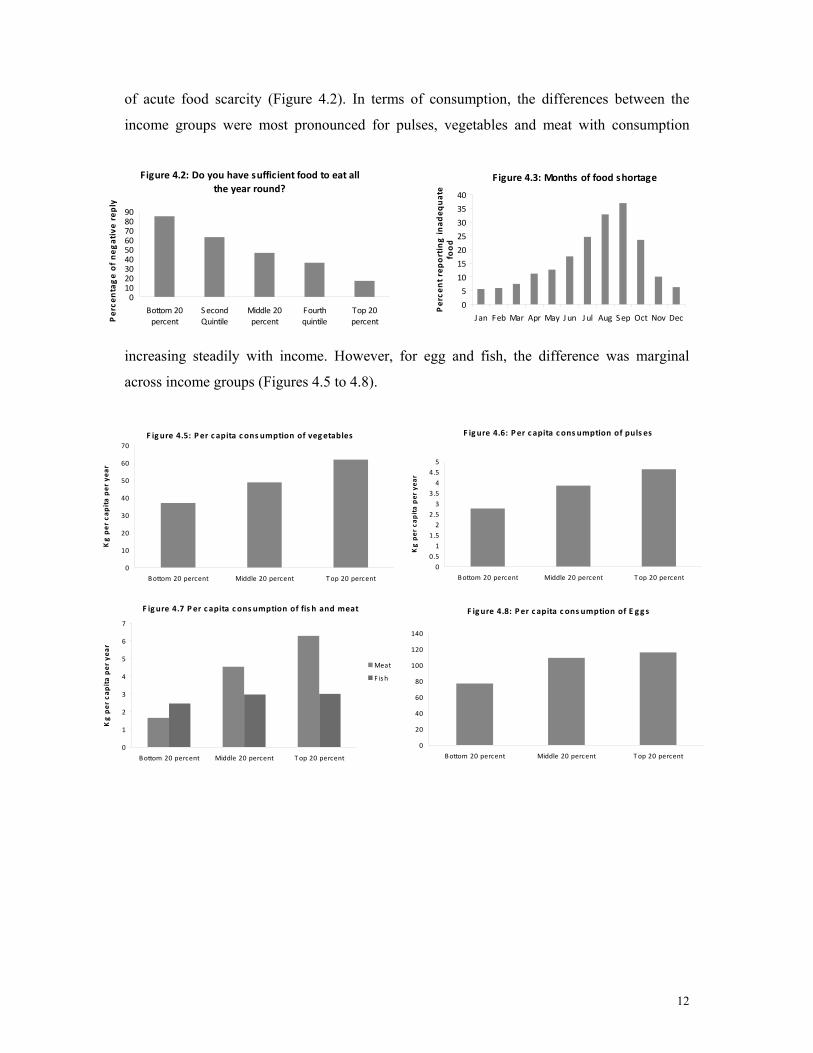
Food security levels in the sample population are terribly low. Even among the top 20
percent sample households, approximately 16 percent did not have secure access to food all
year round. The proportion was as high as 85 percent in the bottom 20 percent households
(Figure 4.1). Typically, the monsoon months—July to October, were identified as the months
Figure 4.2: Average schooling across income groups
Males, 5.6
Males, 7.64
Females, 2.87
Females, 6.6
Males, 3.15Females, 4.69
0123456789
Bottom 20 percent Middle 20 percent Top 20 percent
Ave
rage Sch
oolin
g (ye
ars)
Figure 4.1: Average schooling in the study area
Males, 7.2
Males, 5.4 Males, 5Males, 5.8Females, 6.1
Females, 4Females, 4.5 Females, 4.4
012345678
South 24Parganas
East Midnapore Murshidabad Jalpaiguri
Ave
rage
Sch
ooling (yea
rs)
12
of acute food scarcity (Figure 4.2). In terms of consumption, the differences between the
income groups were most pronounced for pulses, vegetables and meat with consumption
increasing steadily with income. However, for egg and fish, the difference was marginal
across income groups (Figures 4.5 to 4.8).
Figure 4.2: Do you have sufficient food to eat all the year round?
0102030405060708090
Bottom 20percent
SecondQuintile
Middle 20percent
Fourthquintile
Top 20percentP
erce
ntage of neg
ative reply
F igure 4.3: Months of food shortage
0
5
10
15
20
25
30
35
40
Jan Feb Mar Apr May Jun Jul Aug Sep Oct Nov Dec
Perce
nt reporting in
adeq
uate
food
F ig ure 4.6: Per c apita cons umption of puls es
00.51
1.5
22.53
3.54
4.55
Bottom 20 percent Middle 20 percent Top 20 percent
Kg per cap
ita per yea
r
F ig ure 4.5: Per c apita c ons umption of vegetables
0
10
20
30
40
50
60
70
Bottom 20 percent Middle 20 percent Top 20 percent
Kg per cap
ita per yea
r
F ig ure 4.8: Per c apita c ons umption of E gg s
0
20
40
60
80
100
120
140
Bottom 20 percent Middle 20 percent Top 20 percent
F igure 4.7 Per c apita cons umption of fis h and meat
0
1
2
3
4
5
6
7
Bottom 20 percent Middle 20 percent Top 20 percent
Kg per cap
ita per yea
r
Meat
F ish
13
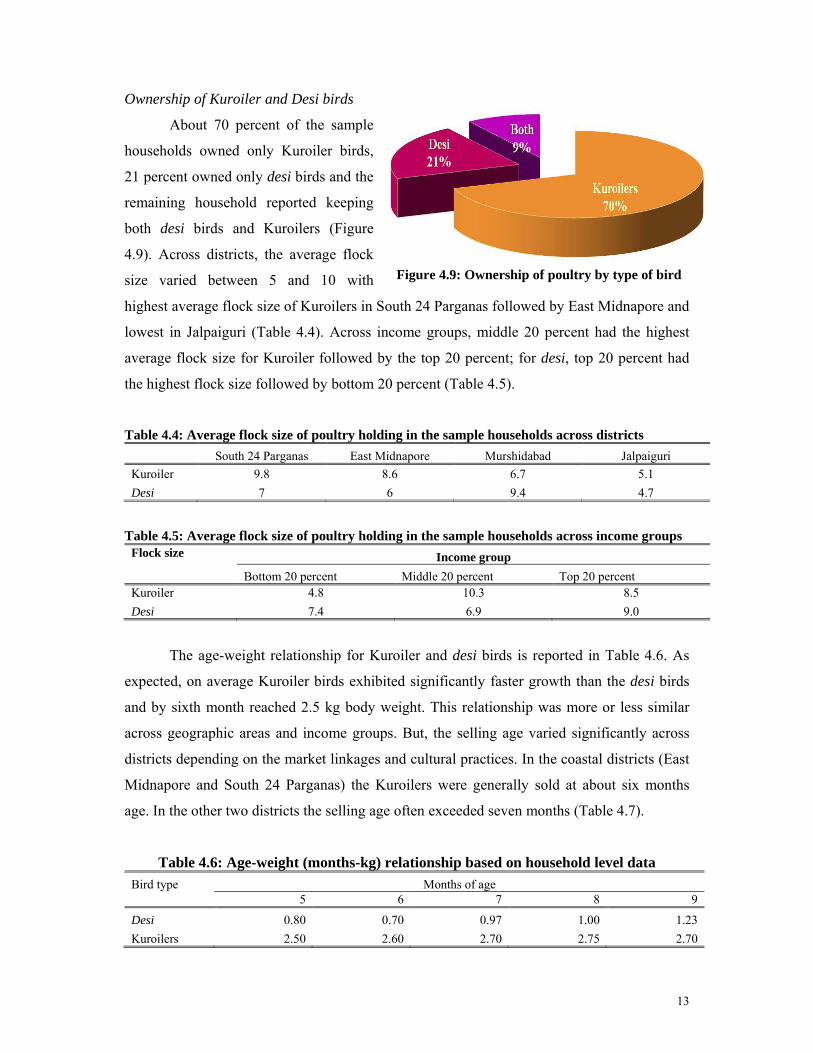
Ownership of Kuroiler and Desi birds
About 70 percent of the sample
households owned only Kuroiler birds,
21 percent owned only desi birds and the
remaining household reported keeping
both desi birds and Kuroilers (Figure
4.9). Across districts, the average flock
size varied between 5 and 10 with
highest average flock size of Kuroilers in South 24 Parganas followed by East Midnapore and
lowest in Jalpaiguri (Table 4.4). Across income groups, middle 20 percent had the highest
average flock size for Kuroiler followed by the top 20 percent; for desi, top 20 percent had
the highest flock size followed by bottom 20 percent (Table 4.5).
Table 4.4: Average flock size of poultry holding in the sample households across districts South 24 Parganas East Midnapore Murshidabad Jalpaiguri Kuroiler 9.8 8.6 6.7 5.1 Desi 7 6 9.4 4.7
Table 4.5: Average flock size of poultry holding in the sample households across income groups Flock size Income group
Bottom 20 percent Middle 20 percent Top 20 percent Kuroiler 4.8 10.3 8.5 Desi 7.4 6.9 9.0
The age-weight relationship for Kuroiler and desi birds is reported in Table 4.6. As
expected, on average Kuroiler birds exhibited significantly faster growth than the desi birds
and by sixth month reached 2.5 kg body weight. This relationship was more or less similar
across geographic areas and income groups. But, the selling age varied significantly across
districts depending on the market linkages and cultural practices. In the coastal districts (East
Midnapore and South 24 Parganas) the Kuroilers were generally sold at about six months
age. In the other two districts the selling age often exceeded seven months (Table 4.7).
Table 4.6: Age-weight (months-kg) relationship based on household level data Bird type Months of age 5 6 7 8 9
Desi 0.80 0.70 0.97 1.00 1.23 Kuroilers 2.50 2.60 2.70 2.75 2.70
Figure 4.9: Ownership of poultry by type of bird
14
Table 4.7: Age and weight at sale by districts
East Midnapore South 24 Parganas Murshidabad Age at sale (months) 6.2 5.1 7.0 Weight at sale (Kg) 2.4 2.5 2.8
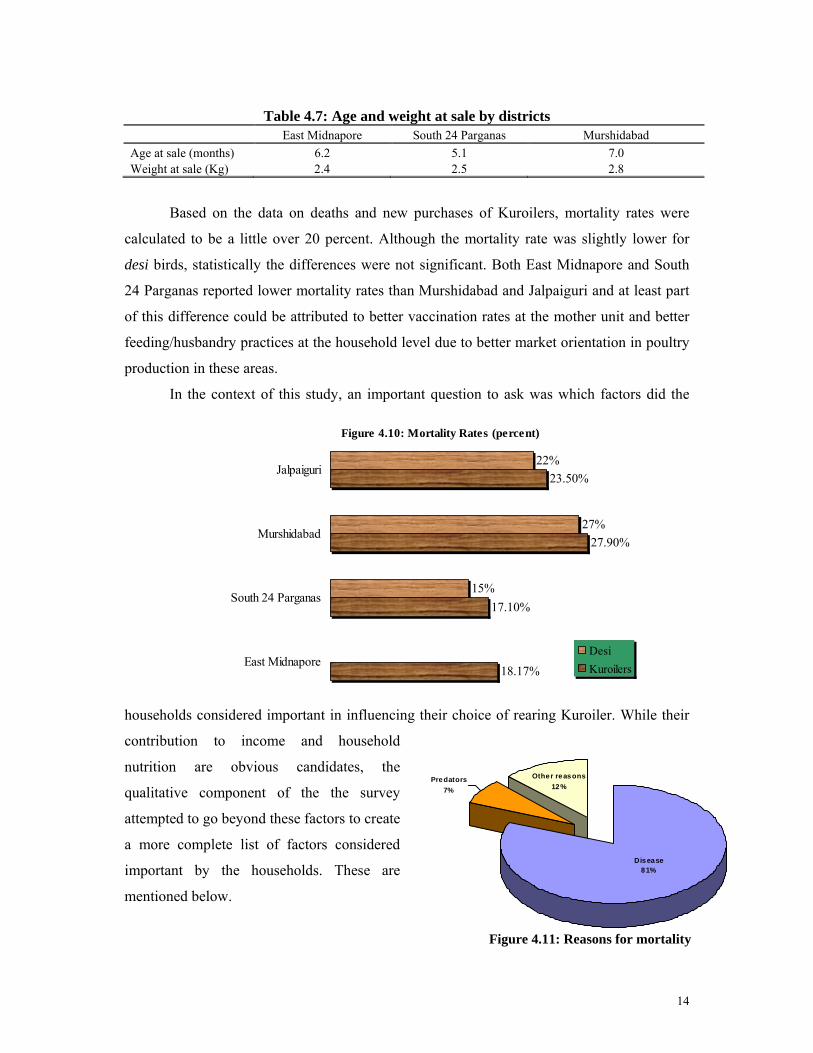
Based on the data on deaths and new purchases of Kuroilers, mortality rates were
calculated to be a little over 20 percent. Although the mortality rate was slightly lower for
desi birds, statistically the differences were not significant. Both East Midnapore and South
24 Parganas reported lower mortality rates than Murshidabad and Jalpaiguri and at least part
of this difference could be attributed to better vaccination rates at the mother unit and better
feeding/husbandry practices at the household level due to better market orientation in poultry
production in these areas.
In the context of this study, an important question to ask was which factors did the
households considered important in influencing their choice of rearing Kuroiler. While their
contribution to income and household
nutrition are obvious candidates, the
qualitative component of the the survey
attempted to go beyond these factors to create
a more complete list of factors considered
important by the households. These are
mentioned below.
Figure 4.11: Reasons for mortality
Figure 4.10: Mortality Rates (percent)
18.17%
17.10%
27.90%
23.50%
15%
27%
22%
East Midnapore
South 24 Parganas
Murshidabad
Jalpaiguri
DesiKuroilers
Disease81%
Other reasons12%
Predators7%
15
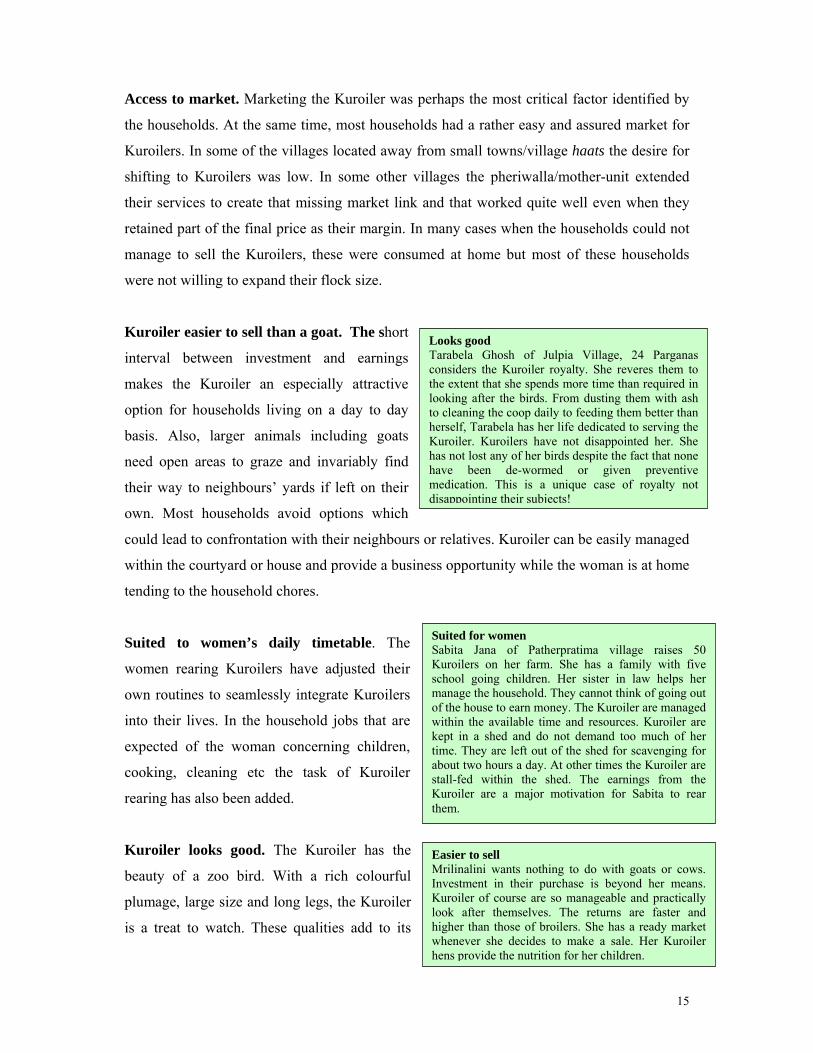
Suited for women Sabita Jana of Patherpratima village raises 50 Kuroilers on her farm. She has a family with five school going children. Her sister in law helps her manage the household. They cannot think of going out of the house to earn money. The Kuroiler are managed within the available time and resources. Kuroiler are kept in a shed and do not demand too much of her time. They are left out of the shed for scavenging for about two hours a day. At other times the Kuroiler are stall-fed within the shed. The earnings from the Kuroiler are a major motivation for Sabita to rear them.
Looks good Tarabela Ghosh of Julpia Village, 24 Parganas considers the Kuroiler royalty. She reveres them to the extent that she spends more time than required in looking after the birds. From dusting them with ash to cleaning the coop daily to feeding them better than herself, Tarabela has her life dedicated to serving the Kuroiler. Kuroilers have not disappointed her. She has not lost any of her birds despite the fact that none have been de-wormed or given preventive medication. This is a unique case of royalty not disappointing their subjects!
Easier to sell Mrilinalini wants nothing to do with goats or cows. Investment in their purchase is beyond her means. Kuroiler of course are so manageable and practically look after themselves. The returns are faster and higher than those of broilers. She has a ready market whenever she decides to make a sale. Her Kuroiler hens provide the nutrition for her children.
Access to market. Marketing the Kuroiler was perhaps the most critical factor identified by
the households. At the same time, most households had a rather easy and assured market for
Kuroilers. In some of the villages located away from small towns/village haats the desire for
shifting to Kuroilers was low. In some other villages the pheriwalla/mother-unit extended
their services to create that missing market link and that worked quite well even when they
retained part of the final price as their margin. In many cases when the households could not
manage to sell the Kuroilers, these were consumed at home but most of these households
were not willing to expand their flock size.
Kuroiler easier to sell than a goat. The short
interval between investment and earnings
makes the Kuroiler an especially attractive
option for households living on a day to day
basis. Also, larger animals including goats
need open areas to graze and invariably find
their way to neighbours’ yards if left on their
own. Most households avoid options which
could lead to confrontation with their neighbours or relatives. Kuroiler can be easily managed
within the courtyard or house and provide a business opportunity while the woman is at home
tending to the household chores.
Suited to women’s daily timetable. The
women rearing Kuroilers have adjusted their
own routines to seamlessly integrate Kuroilers
into their lives. In the household jobs that are
expected of the woman concerning children,
cooking, cleaning etc the task of Kuroiler
rearing has also been added.
Kuroiler looks good. The Kuroiler has the
beauty of a zoo bird. With a rich colourful
plumage, large size and long legs, the Kuroiler
is a treat to watch. These qualities add to its
16
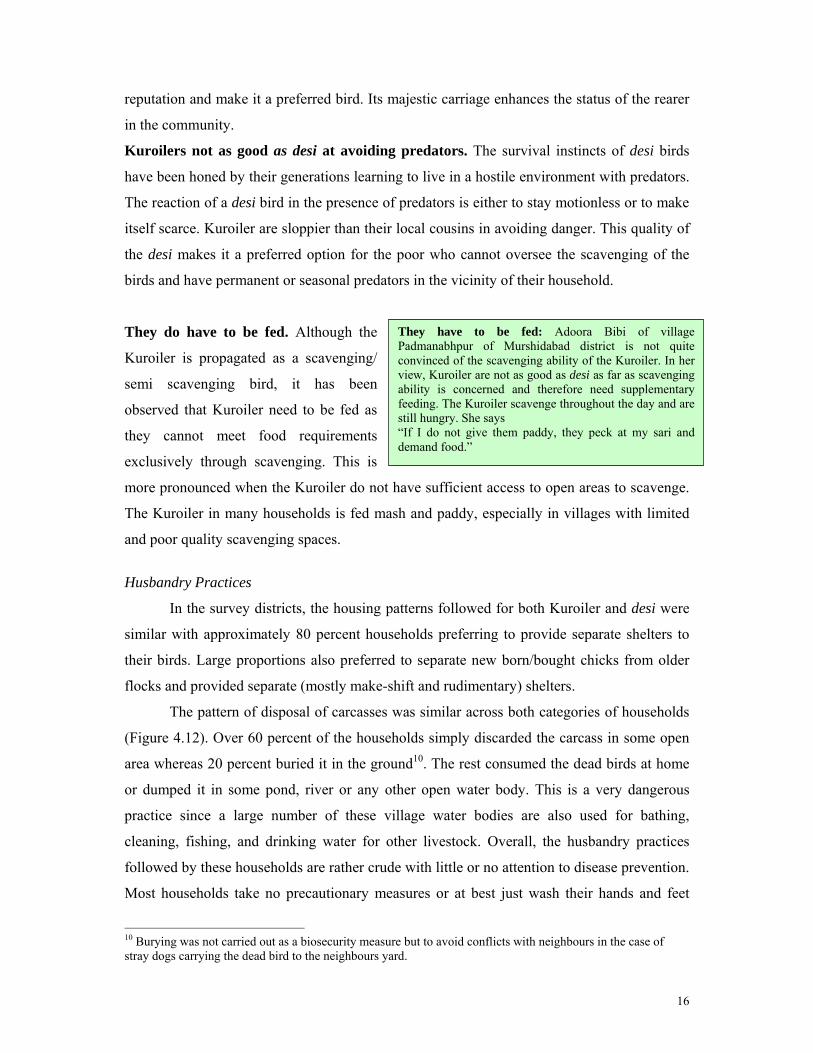
They have to be fed: Adoora Bibi of village Padmanabhpur of Murshidabad district is not quite convinced of the scavenging ability of the Kuroiler. In her view, Kuroiler are not as good as desi as far as scavenging ability is concerned and therefore need supplementary feeding. The Kuroiler scavenge throughout the day and are still hungry. She says “If I do not give them paddy, they peck at my sari and demand food.”
reputation and make it a preferred bird. Its majestic carriage enhances the status of the rearer
in the community.
Kuroilers not as good as desi at avoiding predators. The survival instincts of desi birds
have been honed by their generations learning to live in a hostile environment with predators.
The reaction of a desi bird in the presence of predators is either to stay motionless or to make
itself scarce. Kuroiler are sloppier than their local cousins in avoiding danger. This quality of
the desi makes it a preferred option for the poor who cannot oversee the scavenging of the
birds and have permanent or seasonal predators in the vicinity of their household.
They do have to be fed. Although the
Kuroiler is propagated as a scavenging/
semi scavenging bird, it has been
observed that Kuroiler need to be fed as
they cannot meet food requirements
exclusively through scavenging. This is
more pronounced when the Kuroiler do not have sufficient access to open areas to scavenge.
The Kuroiler in many households is fed mash and paddy, especially in villages with limited
and poor quality scavenging spaces.
Husbandry Practices
In the survey districts, the housing patterns followed for both Kuroiler and desi were
similar with approximately 80 percent households preferring to provide separate shelters to
their birds. Large proportions also preferred to separate new born/bought chicks from older
flocks and provided separate (mostly make-shift and rudimentary) shelters.
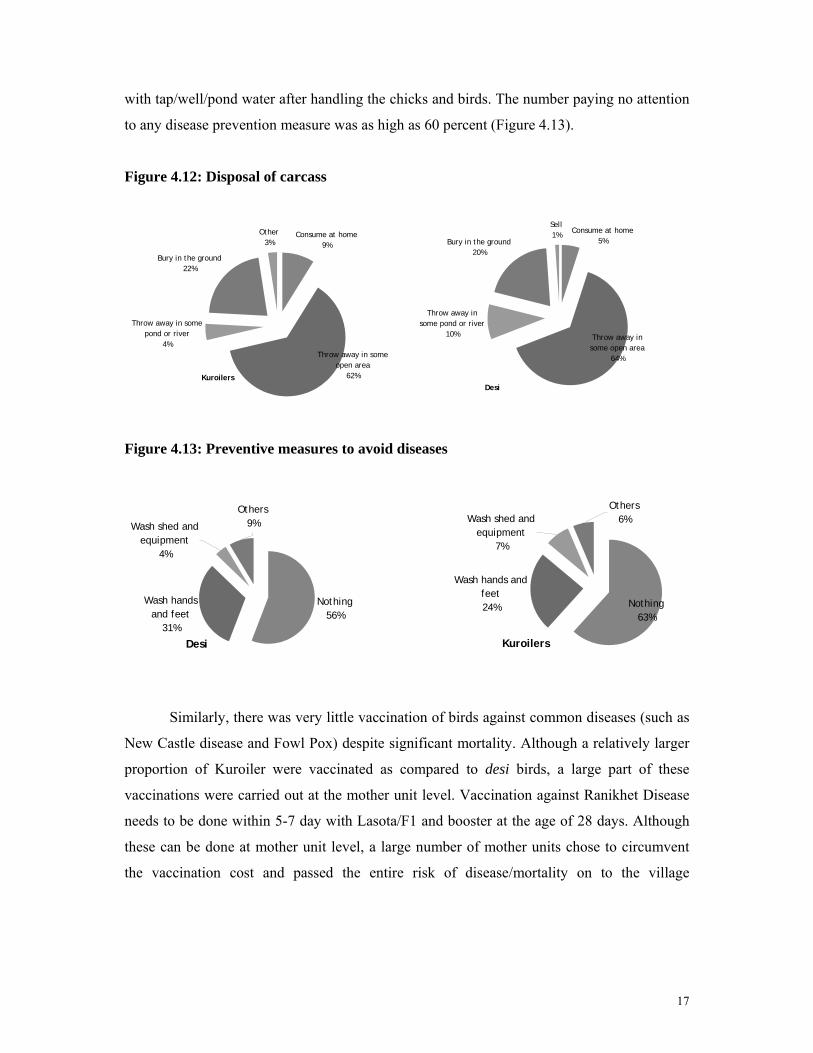
The pattern of disposal of carcasses was similar across both categories of households
(Figure 4.12). Over 60 percent of the households simply discarded the carcass in some open
area whereas 20 percent buried it in the ground10. The rest consumed the dead birds at home
or dumped it in some pond, river or any other open water body. This is a very dangerous
practice since a large number of these village water bodies are also used for bathing,
cleaning, fishing, and drinking water for other livestock. Overall, the husbandry practices
followed by these households are rather crude with little or no attention to disease prevention.
Most households take no precautionary measures or at best just wash their hands and feet
10 Burying was not carried out as a biosecurity measure but to avoid conflicts with neighbours in the case of stray dogs carrying the dead bird to the neighbours yard.
17
with tap/well/pond water after handling the chicks and birds. The number paying no attention
to any disease prevention measure was as high as 60 percent (Figure 4.13).
Figure 4.12: Disposal of carcass
Figure 4.13: Preventive measures to avoid diseases
Similarly, there was very little vaccination of birds against common diseases (such as
New Castle disease and Fowl Pox) despite significant mortality. Although a relatively larger
proportion of Kuroiler were vaccinated as compared to desi birds, a large part of these
vaccinations were carried out at the mother unit level. Vaccination against Ranikhet Disease
needs to be done within 5-7 day with Lasota/F1 and booster at the age of 28 days. Although
these can be done at mother unit level, a large number of mother units chose to circumvent
the vaccination cost and passed the entire risk of disease/mortality on to the village
Desi
Throw away in some pond or river
10%
Bury in the ground20%
Sell 1% Consume at home
5%
Throw away in some open area
64%
Kuroilers
Consume at home9%
Throw away in some pond or river
4%
Bury in the ground22%
Other3%
Throw away in some open area
62%
Desi
Nothing56%
Wash hands and feet
31%
Wash shed and equipment
4%
Others9%
Kuroilers
Wash hands and feet24% Nothing
63%
Others6%Wash shed and
equipment7%
18
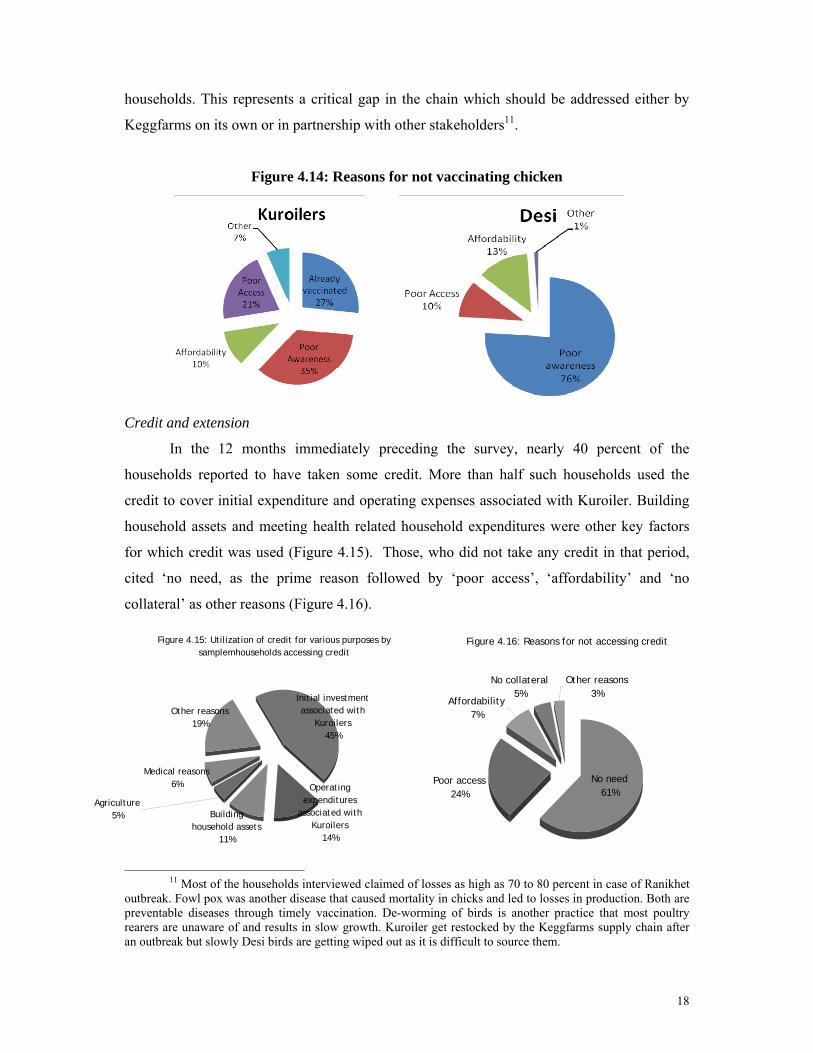
households. This represents a critical gap in the chain which should be addressed either by
Keggfarms on its own or in partnership with other stakeholders11.
Figure 4.14: Reasons for not vaccinating chicken
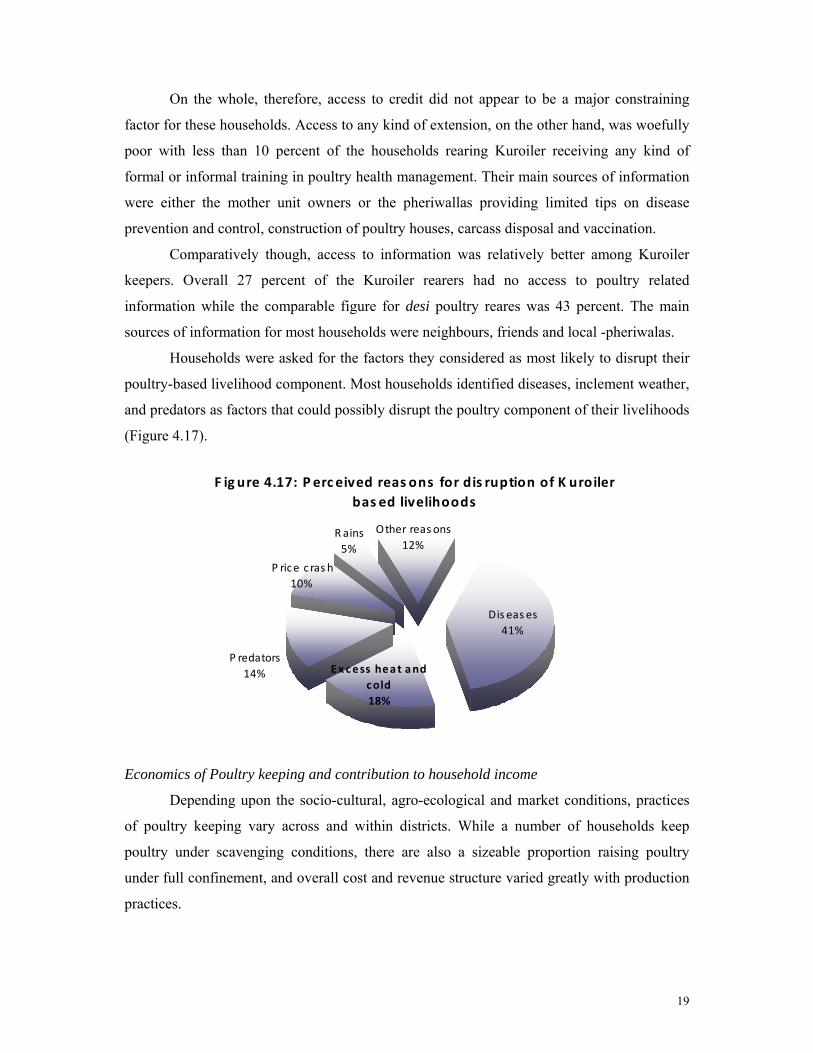
Credit and extension
In the 12 months immediately preceding the survey, nearly 40 percent of the
households reported to have taken some credit. More than half such households used the
credit to cover initial expenditure and operating expenses associated with Kuroiler. Building
household assets and meeting health related household expenditures were other key factors
for which credit was used (Figure 4.15). Those, who did not take any credit in that period,
cited ‘no need, as the prime reason followed by ‘poor access’, ‘affordability’ and ‘no
collateral’ as other reasons (Figure 4.16).
11 Most of the households interviewed claimed of losses as high as 70 to 80 percent in case of Ranikhet
outbreak. Fowl pox was another disease that caused mortality in chicks and led to losses in production. Both are preventable diseases through timely vaccination. De-worming of birds is another practice that most poultry rearers are unaware of and results in slow growth. Kuroiler get restocked by the Keggfarms supply chain after an outbreak but slowly Desi birds are getting wiped out as it is difficult to source them.
Figure 4.15: Utilization of credit for various purposes by samplemhouseholds accessing credit
Building household assets
11%
Agriculture5%
Medical reasons6%
Other reasons19%
Initial investment associated with
Kuroilers45%
Operating expenditures
associated with Kuroilers
14%
Figure 4.16: Reasons for not accessing credit
Poor access24%
No need61%
No collateral5%
Other reasons3%
Affordability7%
19
On the whole, therefore, access to credit did not appear to be a major constraining
factor for these households. Access to any kind of extension, on the other hand, was woefully
poor with less than 10 percent of the households rearing Kuroiler receiving any kind of
formal or informal training in poultry health management. Their main sources of information
were either the mother unit owners or the pheriwallas providing limited tips on disease
prevention and control, construction of poultry houses, carcass disposal and vaccination.
Comparatively though, access to information was relatively better among Kuroiler
keepers. Overall 27 percent of the Kuroiler rearers had no access to poultry related
information while the comparable figure for desi poultry reares was 43 percent. The main
sources of information for most households were neighbours, friends and local -pheriwalas.
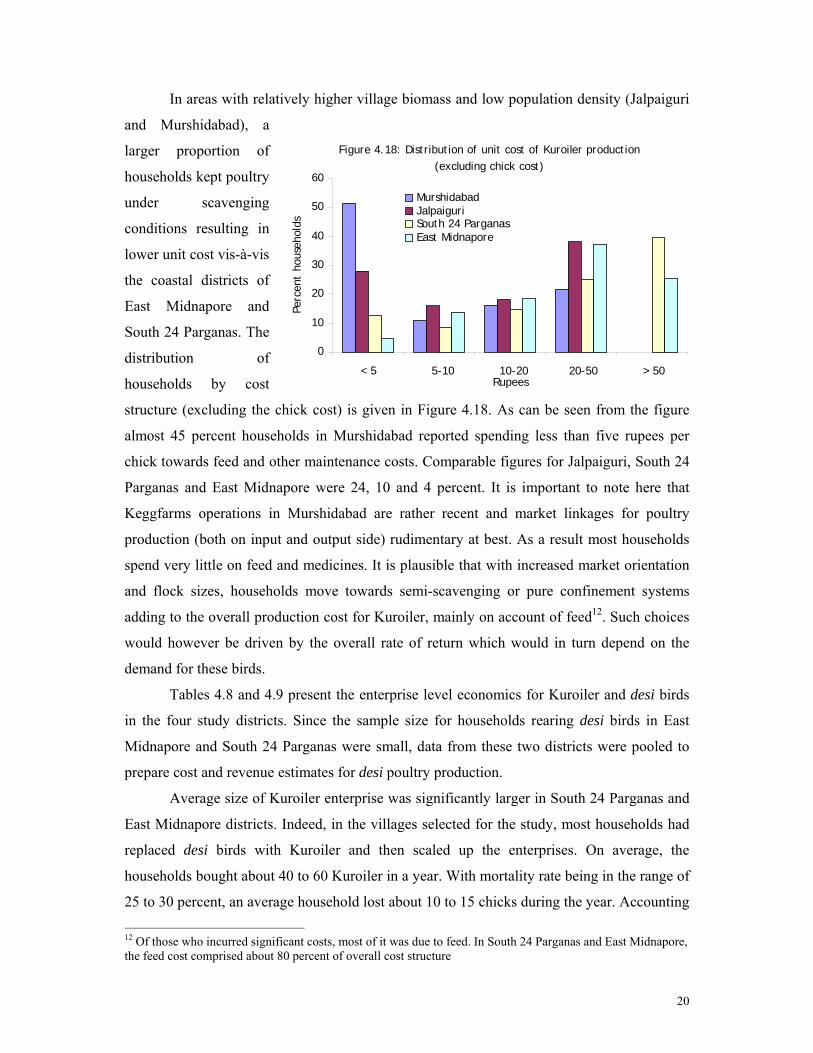
Households were asked for the factors they considered as most likely to disrupt their
poultry-based livelihood component. Most households identified diseases, inclement weather,
and predators as factors that could possibly disrupt the poultry component of their livelihoods
(Figure 4.17).
Economics of Poultry keeping and contribution to household income
Depending upon the socio-cultural, agro-ecological and market conditions, practices
of poultry keeping vary across and within districts. While a number of households keep
poultry under scavenging conditions, there are also a sizeable proportion raising poultry
under full confinement, and overall cost and revenue structure varied greatly with production
practices.
F ig ure 4.17: P erc eived reas ons for dis ruption of K uroiler bas ed livelihoods
P redators14%
P rice c ras h10%
Other reas ons12%
Rains5%
Dis eas es41%
Ex cess heat and cold18%
20
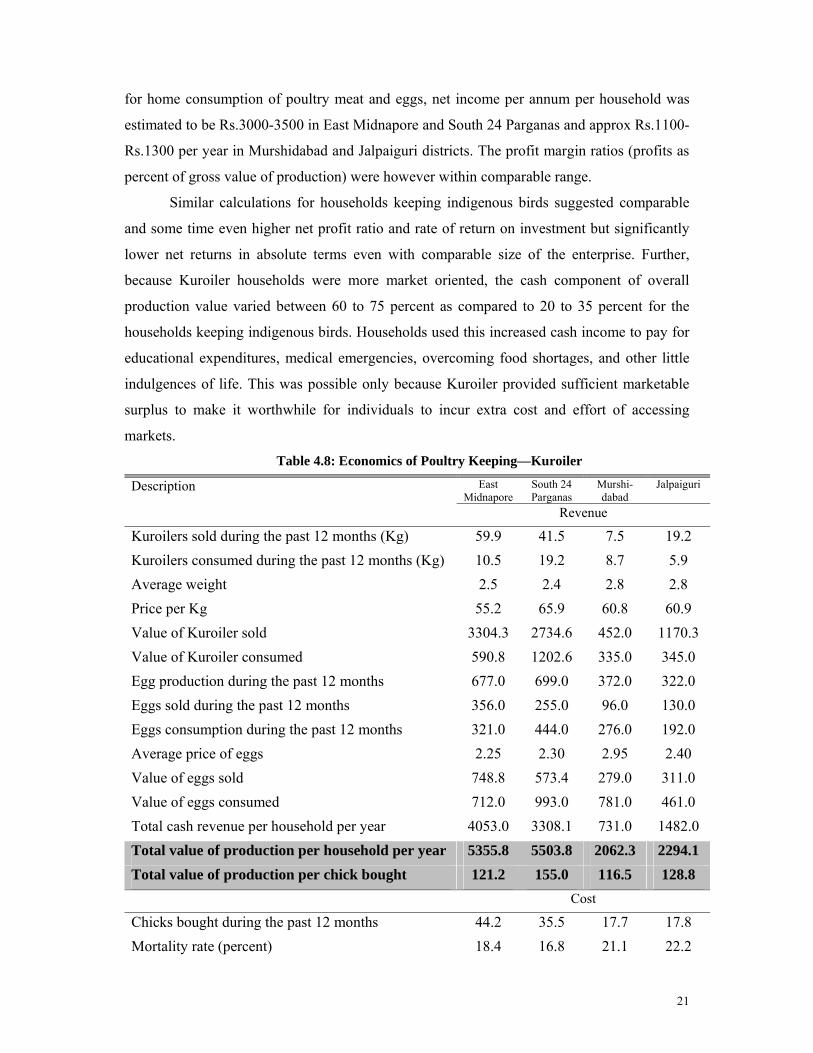
In areas with relatively higher village biomass and low population density (Jalpaiguri
and Murshidabad), a
larger proportion of
households kept poultry
under scavenging
conditions resulting in
lower unit cost vis-à-vis
the coastal districts of
East Midnapore and
South 24 Parganas. The
distribution of
households by cost
structure (excluding the chick cost) is given in Figure 4.18. As can be seen from the figure
almost 45 percent households in Murshidabad reported spending less than five rupees per
chick towards feed and other maintenance costs. Comparable figures for Jalpaiguri, South 24
Parganas and East Midnapore were 24, 10 and 4 percent. It is important to note here that
Keggfarms operations in Murshidabad are rather recent and market linkages for poultry
production (both on input and output side) rudimentary at best. As a result most households
spend very little on feed and medicines. It is plausible that with increased market orientation
and flock sizes, households move towards semi-scavenging or pure confinement systems
adding to the overall production cost for Kuroiler, mainly on account of feed12. Such choices
would however be driven by the overall rate of return which would in turn depend on the
demand for these birds.
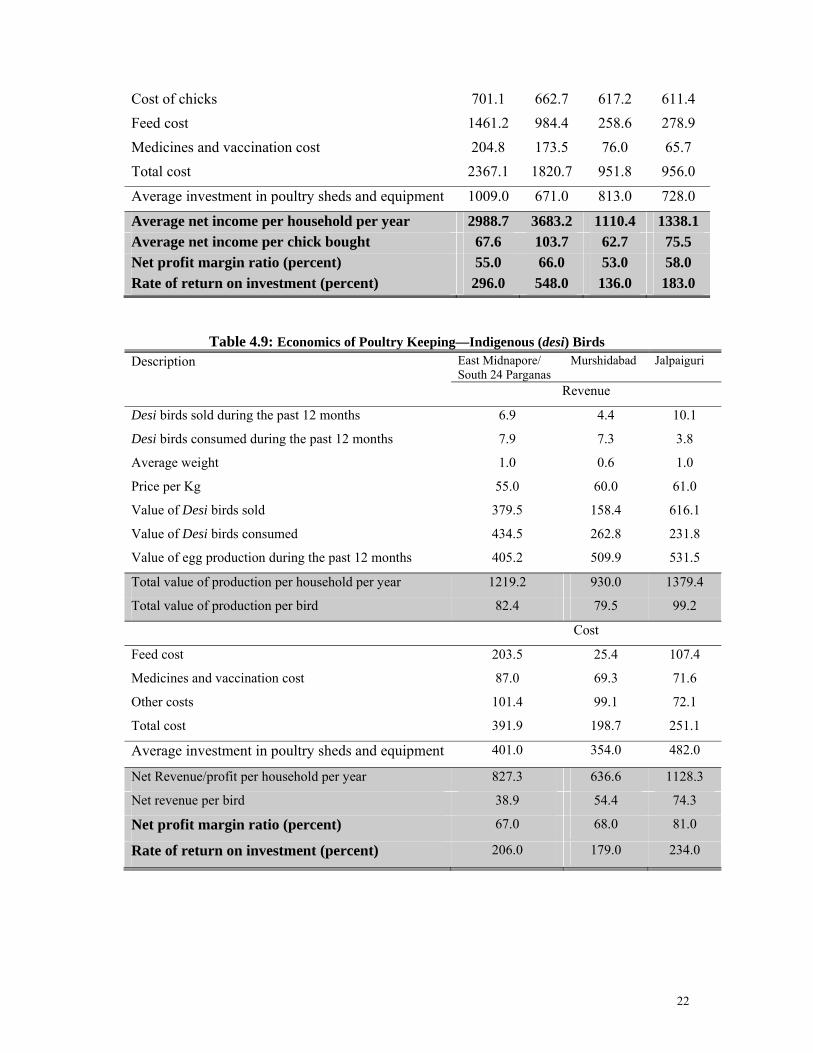
Tables 4.8 and 4.9 present the enterprise level economics for Kuroiler and desi birds
in the four study districts. Since the sample size for households rearing desi birds in East
Midnapore and South 24 Parganas were small, data from these two districts were pooled to
prepare cost and revenue estimates for desi poultry production.
Average size of Kuroiler enterprise was significantly larger in South 24 Parganas and
East Midnapore districts. Indeed, in the villages selected for the study, most households had
replaced desi birds with Kuroiler and then scaled up the enterprises. On average, the
households bought about 40 to 60 Kuroiler in a year. With mortality rate being in the range of
25 to 30 percent, an average household lost about 10 to 15 chicks during the year. Accounting 12 Of those who incurred significant costs, most of it was due to feed. In South 24 Parganas and East Midnapore, the feed cost comprised about 80 percent of overall cost structure
Figure 4.18: Distribution of unit cost of Kuroiler production (excluding chick cost)
0
10
20
30
40
50
60
< 5 5-10 10-20 20-50 > 50Rupees
Perc
ent
hous
ehol
ds
MurshidabadJalpaiguriSouth 24 ParganasEast Midnapore
21
for home consumption of poultry meat and eggs, net income per annum per household was
estimated to be Rs.3000-3500 in East Midnapore and South 24 Parganas and approx Rs.1100-
Rs.1300 per year in Murshidabad and Jalpaiguri districts. The profit margin ratios (profits as
percent of gross value of production) were however within comparable range.
Similar calculations for households keeping indigenous birds suggested comparable
and some time even higher net profit ratio and rate of return on investment but significantly
lower net returns in absolute terms even with comparable size of the enterprise. Further,
because Kuroiler households were more market oriented, the cash component of overall
production value varied between 60 to 75 percent as compared to 20 to 35 percent for the
households keeping indigenous birds. Households used this increased cash income to pay for
educational expenditures, medical emergencies, overcoming food shortages, and other little
indulgences of life. This was possible only because Kuroiler provided sufficient marketable
surplus to make it worthwhile for individuals to incur extra cost and effort of accessing
markets.
Table 4.8: Economics of Poultry Keeping—Kuroiler
Description East Midnapore
South 24 Parganas
Murshi-dabad
Jalpaiguri
Revenue
Kuroilers sold during the past 12 months (Kg) 59.9 41.5 7.5 19.2 Kuroilers consumed during the past 12 months (Kg) 10.5 19.2 8.7 5.9 Average weight 2.5 2.4 2.8 2.8 Price per Kg 55.2 65.9 60.8 60.9 Value of Kuroiler sold 3304.3 2734.6 452.0 1170.3 Value of Kuroiler consumed 590.8 1202.6 335.0 345.0 Egg production during the past 12 months 677.0 699.0 372.0 322.0 Eggs sold during the past 12 months 356.0 255.0 96.0 130.0 Eggs consumption during the past 12 months 321.0 444.0 276.0 192.0 Average price of eggs 2.25 2.30 2.95 2.40 Value of eggs sold 748.8 573.4 279.0 311.0 Value of eggs consumed 712.0 993.0 781.0 461.0 Total cash revenue per household per year 4053.0 3308.1 731.0 1482.0 Total value of production per household per year 5355.8 5503.8 2062.3 2294.1 Total value of production per chick bought 121.2 155.0 116.5 128.8 Cost
Chicks bought during the past 12 months 44.2 35.5 17.7 17.8 Mortality rate (percent) 18.4 16.8 21.1 22.2
22
Cost of chicks 701.1 662.7 617.2 611.4 Feed cost 1461.2 984.4 258.6 278.9 Medicines and vaccination cost 204.8 173.5 76.0 65.7 Total cost 2367.1 1820.7 951.8 956.0
Average investment in poultry sheds and equipment 1009.0 671.0 813.0 728.0
Average net income per household per year 2988.7 3683.2 1110.4 1338.1 Average net income per chick bought 67.6 103.7 62.7 75.5 Net profit margin ratio (percent) 55.0 66.0 53.0 58.0 Rate of return on investment (percent) 296.0 548.0 136.0 183.0
Table 4.9: Economics of Poultry Keeping—Indigenous (desi) Birds Description East Midnapore/
South 24 Parganas Murshidabad Jalpaiguri
Revenue
Desi birds sold during the past 12 months 6.9 4.4 10.1
Desi birds consumed during the past 12 months 7.9 7.3 3.8
Average weight 1.0 0.6 1.0
Price per Kg 55.0 60.0 61.0
Value of Desi birds sold 379.5 158.4 616.1
Value of Desi birds consumed 434.5 262.8 231.8
Value of egg production during the past 12 months 405.2 509.9 531.5
Total value of production per household per year 1219.2 930.0 1379.4
Total value of production per bird 82.4 79.5 99.2
Cost
Feed cost 203.5 25.4 107.4
Medicines and vaccination cost 87.0 69.3 71.6
Other costs 101.4 99.1 72.1
Total cost 391.9 198.7 251.1
Average investment in poultry sheds and equipment 401.0 354.0 482.0
Net Revenue/profit per household per year 827.3 636.6 1128.3
Net revenue per bird 38.9 54.4 74.3
Net profit margin ratio (percent) 67.0 68.0 81.0
Rate of return on investment (percent) 206.0 179.0 234.0
23
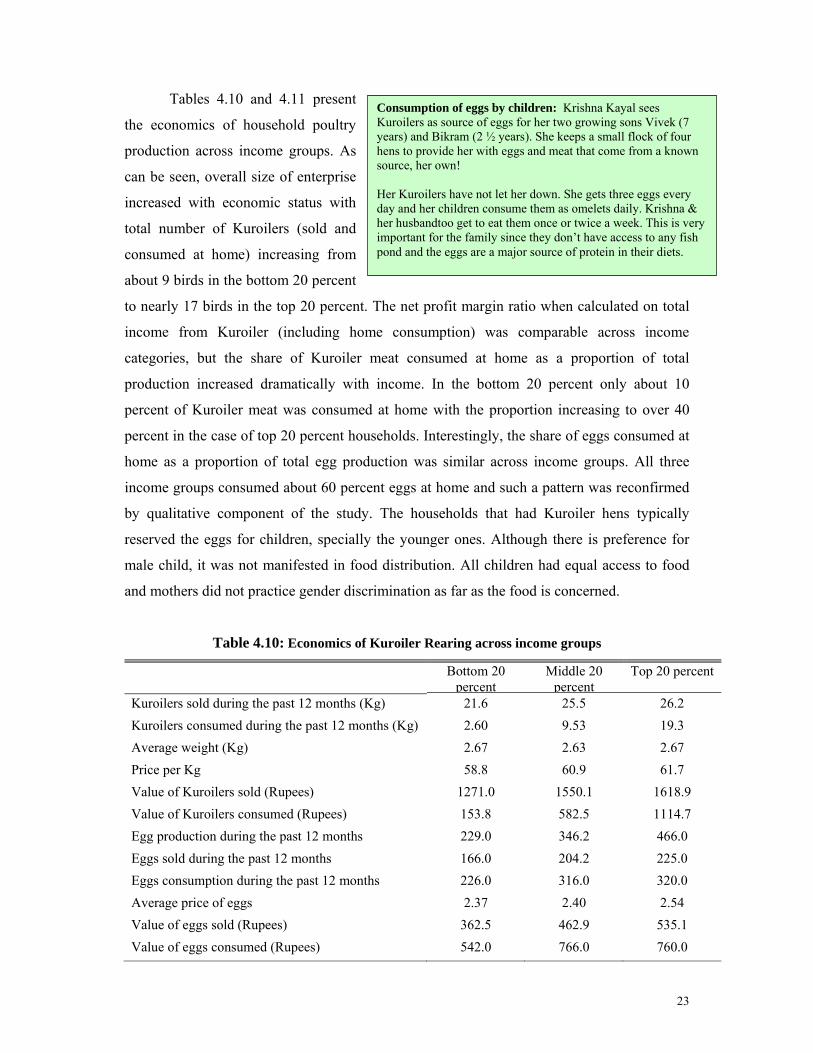
Consumption of eggs by children: Krishna Kayal sees Kuroilers as source of eggs for her two growing sons Vivek (7 years) and Bikram (2 ½ years). She keeps a small flock of four hens to provide her with eggs and meat that come from a known source, her own! Her Kuroilers have not let her down. She gets three eggs every day and her children consume them as omelets daily. Krishna & her husbandtoo get to eat them once or twice a week. This is very important for the family since they don’t have access to any fish pond and the eggs are a major source of protein in their diets.
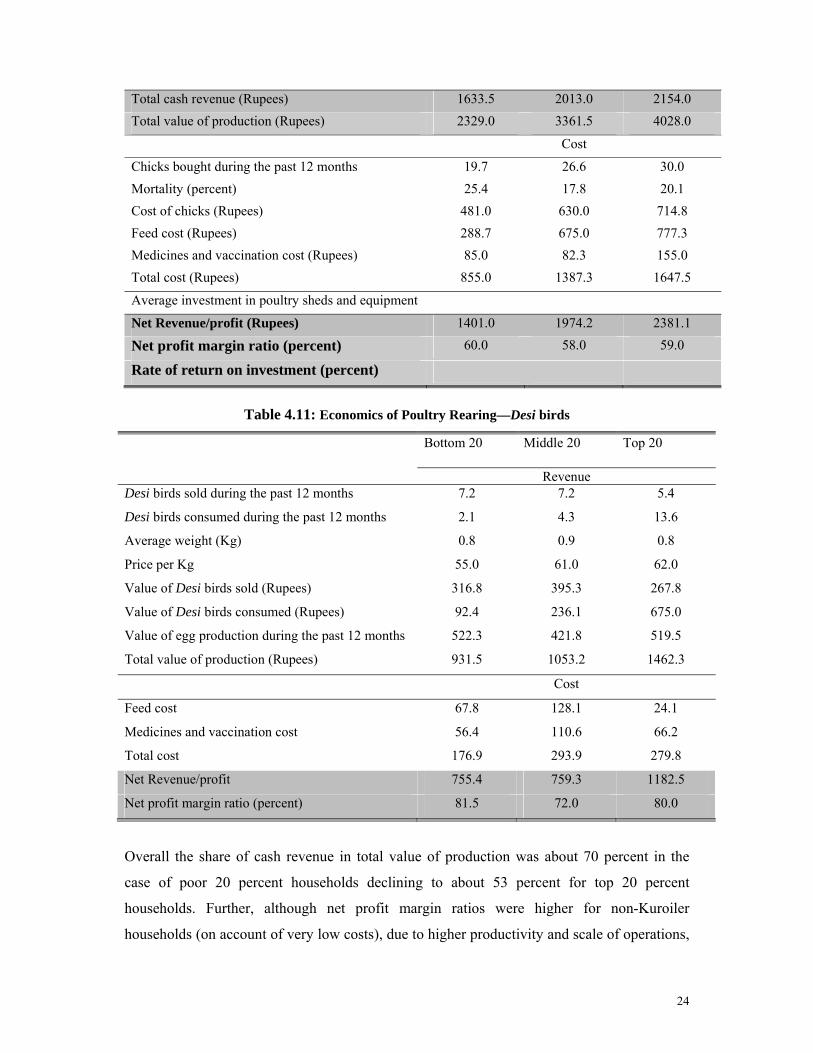
Tables 4.10 and 4.11 present
the economics of household poultry
production across income groups. As
can be seen, overall size of enterprise
increased with economic status with
total number of Kuroilers (sold and
consumed at home) increasing from
about 9 birds in the bottom 20 percent
to nearly 17 birds in the top 20 percent. The net profit margin ratio when calculated on total
income from Kuroiler (including home consumption) was comparable across income
categories, but the share of Kuroiler meat consumed at home as a proportion of total
production increased dramatically with income. In the bottom 20 percent only about 10
percent of Kuroiler meat was consumed at home with the proportion increasing to over 40
percent in the case of top 20 percent households. Interestingly, the share of eggs consumed at
home as a proportion of total egg production was similar across income groups. All three
income groups consumed about 60 percent eggs at home and such a pattern was reconfirmed
by qualitative component of the study. The households that had Kuroiler hens typically
reserved the eggs for children, specially the younger ones. Although there is preference for
male child, it was not manifested in food distribution. All children had equal access to food
and mothers did not practice gender discrimination as far as the food is concerned.
Table 4.10: Economics of Kuroiler Rearing across income groups
Bottom 20 percent
Middle 20 percent
Top 20 percent
Kuroilers sold during the past 12 months (Kg) 21.6 25.5 26.2 Kuroilers consumed during the past 12 months (Kg) 2.60 9.53 19.3 Average weight (Kg) 2.67 2.63 2.67 Price per Kg 58.8 60.9 61.7 Value of Kuroilers sold (Rupees) 1271.0 1550.1 1618.9 Value of Kuroilers consumed (Rupees) 153.8 582.5 1114.7 Egg production during the past 12 months 229.0 346.2 466.0 Eggs sold during the past 12 months 166.0 204.2 225.0 Eggs consumption during the past 12 months 226.0 316.0 320.0 Average price of eggs 2.37 2.40 2.54 Value of eggs sold (Rupees) 362.5 462.9 535.1 Value of eggs consumed (Rupees) 542.0 766.0 760.0
24
Total cash revenue (Rupees) 1633.5 2013.0 2154.0 Total value of production (Rupees) 2329.0 3361.5 4028.0
Cost
Chicks bought during the past 12 months 19.7 26.6 30.0 Mortality (percent) 25.4 17.8 20.1 Cost of chicks (Rupees) 481.0 630.0 714.8 Feed cost (Rupees) 288.7 675.0 777.3 Medicines and vaccination cost (Rupees) 85.0 82.3 155.0 Total cost (Rupees) 855.0 1387.3 1647.5
Average investment in poultry sheds and equipment
Net Revenue/profit (Rupees) 1401.0 1974.2 2381.1
Net profit margin ratio (percent) 60.0 58.0 59.0
Rate of return on investment (percent)
Table 4.11: Economics of Poultry Rearing—Desi birds
Bottom 20 Middle 20 Top 20
Revenue Desi birds sold during the past 12 months 7.2 7.2 5.4
Desi birds consumed during the past 12 months 2.1 4.3 13.6
Average weight (Kg) 0.8 0.9 0.8
Price per Kg 55.0 61.0 62.0
Value of Desi birds sold (Rupees) 316.8 395.3 267.8
Value of Desi birds consumed (Rupees) 92.4 236.1 675.0
Value of egg production during the past 12 months 522.3 421.8 519.5
Total value of production (Rupees) 931.5 1053.2 1462.3
Cost
Feed cost 67.8 128.1 24.1
Medicines and vaccination cost 56.4 110.6 66.2
Total cost 176.9 293.9 279.8
Net Revenue/profit 755.4 759.3 1182.5
Net profit margin ratio (percent) 81.5 72.0 80.0
Overall the share of cash revenue in total value of production was about 70 percent in the
case of poor 20 percent households declining to about 53 percent for top 20 percent
households. Further, although net profit margin ratios were higher for non-Kuroiler
households (on account of very low costs), due to higher productivity and scale of operations,
25
“Whenever there is a need to visit the doctor for medical emergency, a Kuroiler is sold”
“..boys can always work in the field even if they are illiterate but girls should be educated…”
Kuroiler households generated more than five times the value from their poultry enterprise
when compared to non-Kuroiler poultry households. In the case of very poor households the
cash earnings were typically used for buying carbohydrates like rice. Vegetable, pulses, oil
etc were bought but at a lower priority than rice. Other than food, major item of expenditure
were educational expenditures and medical emergencies. Remarkably, contrary to
conventional wisdom, many households indicated that they give priority to education of girls.
That could be the result of Kuroiler money
going the hands of women who would like
to see their daughters becoming useful
earning members for whom a big dowry
may not be required.
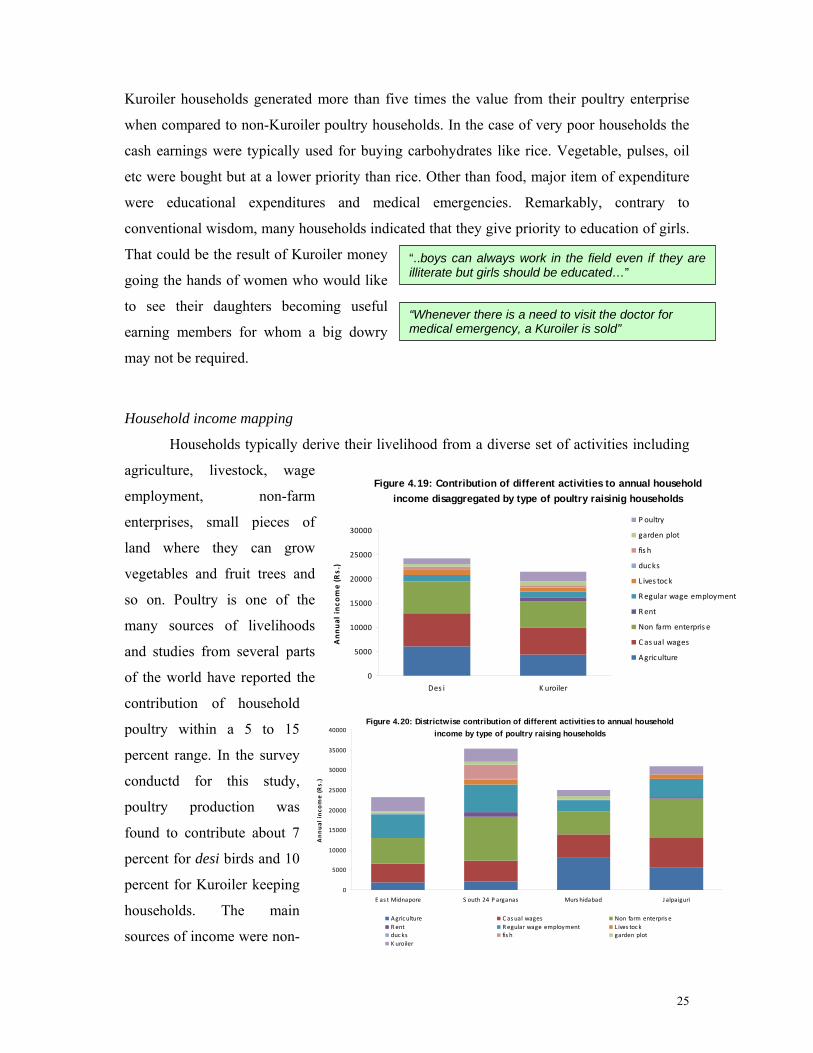
Household income mapping
Households typically derive their livelihood from a diverse set of activities including
agriculture, livestock, wage
employment, non-farm
enterprises, small pieces of
land where they can grow
vegetables and fruit trees and
so on. Poultry is one of the
many sources of livelihoods
and studies from several parts
of the world have reported the
contribution of household
poultry within a 5 to 15
percent range. In the survey
conductd for this study,
poultry production was
found to contribute about 7
percent for desi birds and 10
percent for Kuroiler keeping
households. The main
sources of income were non-
Figure 4.20: Districtwise contribution of different activities to annual household income by type of poultry raising households
0
5000
10000
15000
20000
25000
30000
35000
40000
E as t Midnapore S outh 24 P arganas Murs hidabad J alpaiguri
Annual inco
me (Rs.)
Agriculture C asual wages Non farm enterpris eR ent R egular wage employment L ives tockducks fis h garden plotK uroiler
Figure 4.19: Contribution of different activities to annual household income disaggregated by type of poultry raisinig households
0
5000
10000
15000
20000
25000
30000
Des i K uroiler
Annual inco
me (Rs.)
P oultry
garden plot
fis h
ducks
L ives tock
R egular wage employment
R ent
Non farm enterpris e
C as ual wages
Agriculture
26
farm enterprises13, casual wages and agriculture – together they accounted for over 70 percent
of the household income. Only 5-7 percent of the households had a family member with a
regular job. Interestingly, the contribution from other activities—agriculture, non-farm
enterprises, etc was lower than that for households keeping desi birds. This could mean that
poorer landless households found it more worthwhile to rear Kuroilers than those who had
some land or other means of livelihood support14.
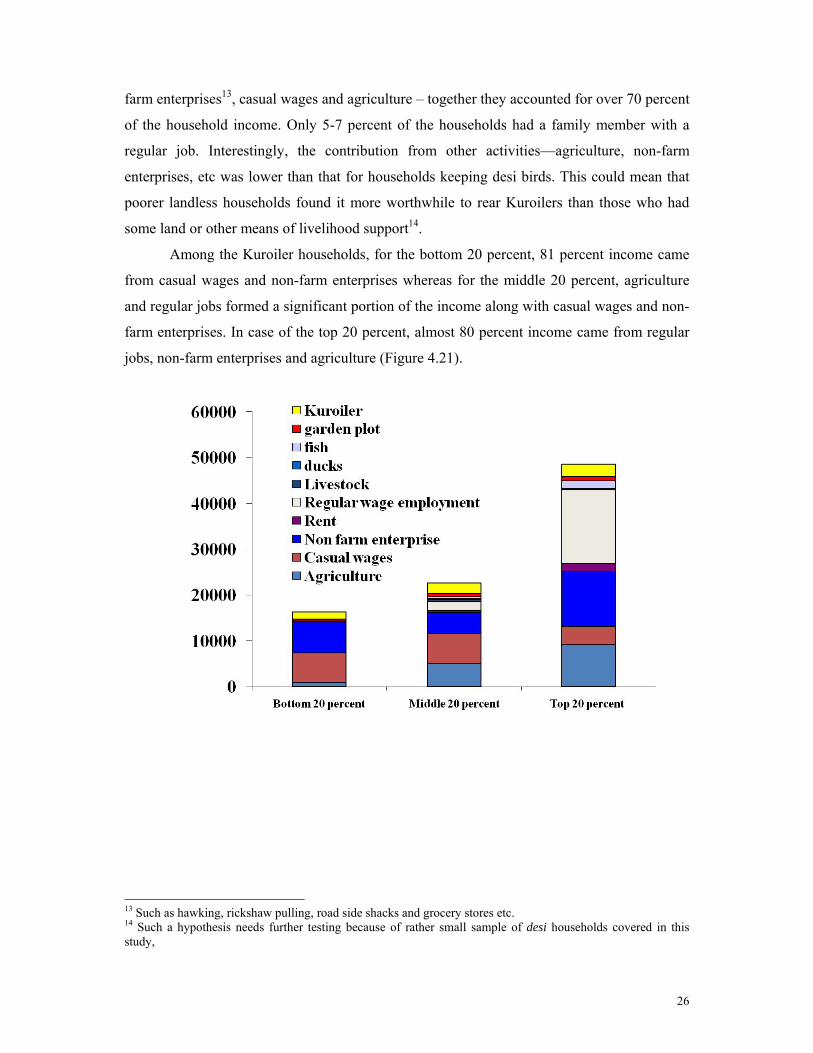
Among the Kuroiler households, for the bottom 20 percent, 81 percent income came
from casual wages and non-farm enterprises whereas for the middle 20 percent, agriculture
and regular jobs formed a significant portion of the income along with casual wages and non-
farm enterprises. In case of the top 20 percent, almost 80 percent income came from regular
jobs, non-farm enterprises and agriculture (Figure 4.21).
13 Such as hawking, rickshaw pulling, road side shacks and grocery stores etc. 14 Such a hypothesis needs further testing because of rather small sample of desi households covered in this study,
27
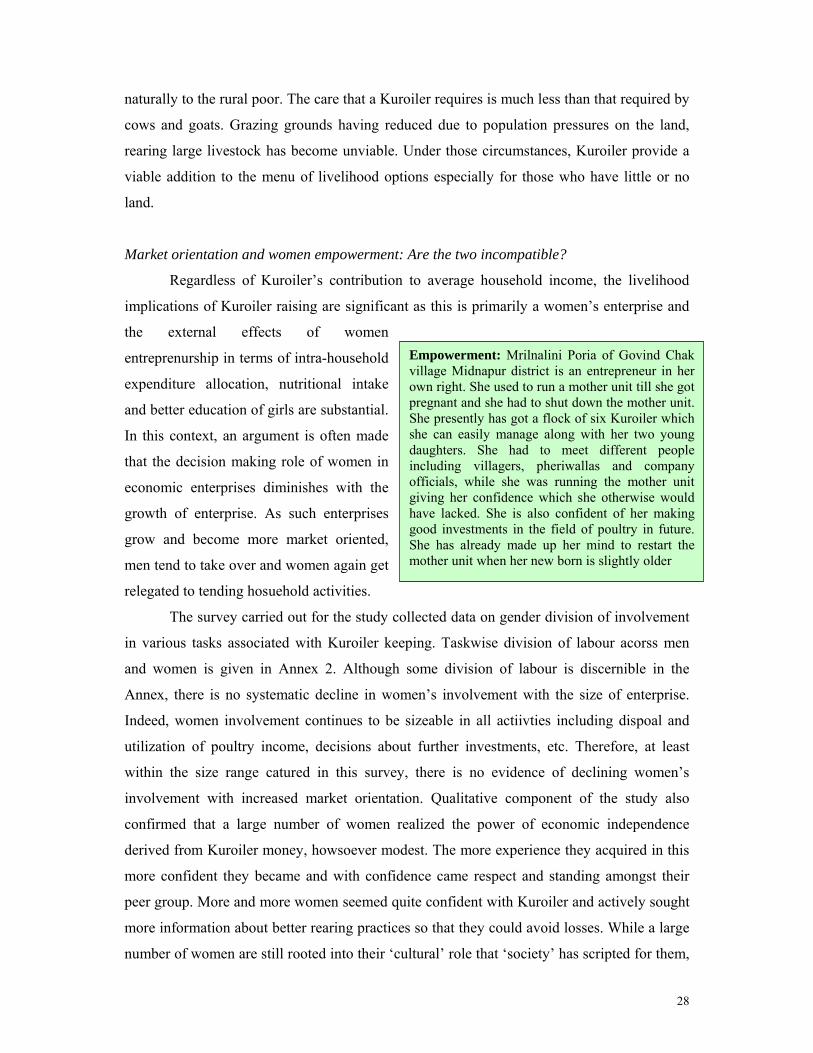
Bibijaan Bewa – Bewa means widow. This is how a widow is called in this predominantly Muslim village. Bibijaan is about 50 years old and lives on her own. She lost her husband six months ago. She has no land or kitchen plot although the house is her own. Since Bibijaan has no source of income her sons try to help their mother. Bibijaan had no experience in keeping poultry and decided to keep poultry for the first time seven months ago. She thought it to be something an old woman like her could take up and purchased five Kuroiler chicks from a pheriwalla. She wanted to earn some income through it as her sons are too poor to look after her. She saw an opportunity in Kuroiler keeping and went on to try it out.
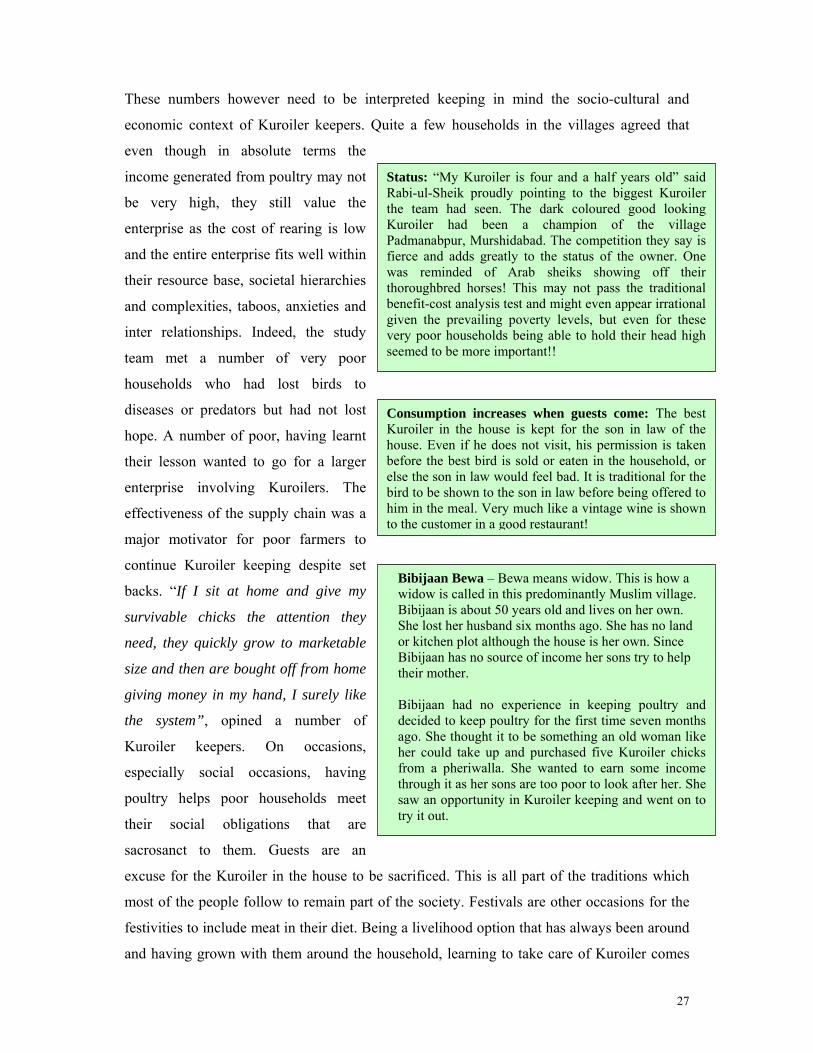
Status: “My Kuroiler is four and a half years old” said Rabi-ul-Sheik proudly pointing to the biggest Kuroiler the team had seen. The dark coloured good looking Kuroiler had been a champion of the village Padmanabpur, Murshidabad. The competition they say is fierce and adds greatly to the status of the owner. One was reminded of Arab sheiks showing off their thoroughbred horses! This may not pass the traditional benefit-cost analysis test and might even appear irrational given the prevailing poverty levels, but even for these very poor households being able to hold their head high seemed to be more important!!
Consumption increases when guests come: The best Kuroiler in the house is kept for the son in law of the house. Even if he does not visit, his permission is taken before the best bird is sold or eaten in the household, or else the son in law would feel bad. It is traditional for the bird to be shown to the son in law before being offered to him in the meal. Very much like a vintage wine is shown to the customer in a good restaurant!
These numbers however need to be interpreted keeping in mind the socio-cultural and
economic context of Kuroiler keepers. Quite a few households in the villages agreed that
even though in absolute terms the
income generated from poultry may not
be very high, they still value the
enterprise as the cost of rearing is low
and the entire enterprise fits well within
their resource base, societal hierarchies
and complexities, taboos, anxieties and
inter relationships. Indeed, the study
team met a number of very poor
households who had lost birds to
diseases or predators but had not lost
hope. A number of poor, having learnt
their lesson wanted to go for a larger
enterprise involving Kuroilers. The
effectiveness of the supply chain was a
major motivator for poor farmers to
continue Kuroiler keeping despite set
backs. “If I sit at home and give my
survivable chicks the attention they
need, they quickly grow to marketable
size and then are bought off from home
giving money in my hand, I surely like
the system”, opined a number of
Kuroiler keepers. On occasions,
especially social occasions, having
poultry helps poor households meet
their social obligations that are
sacrosanct to them. Guests are an
excuse for the Kuroiler in the house to be sacrificed. This is all part of the traditions which
most of the people follow to remain part of the society. Festivals are other occasions for the
festivities to include meat in their diet. Being a livelihood option that has always been around
and having grown with them around the household, learning to take care of Kuroiler comes
28
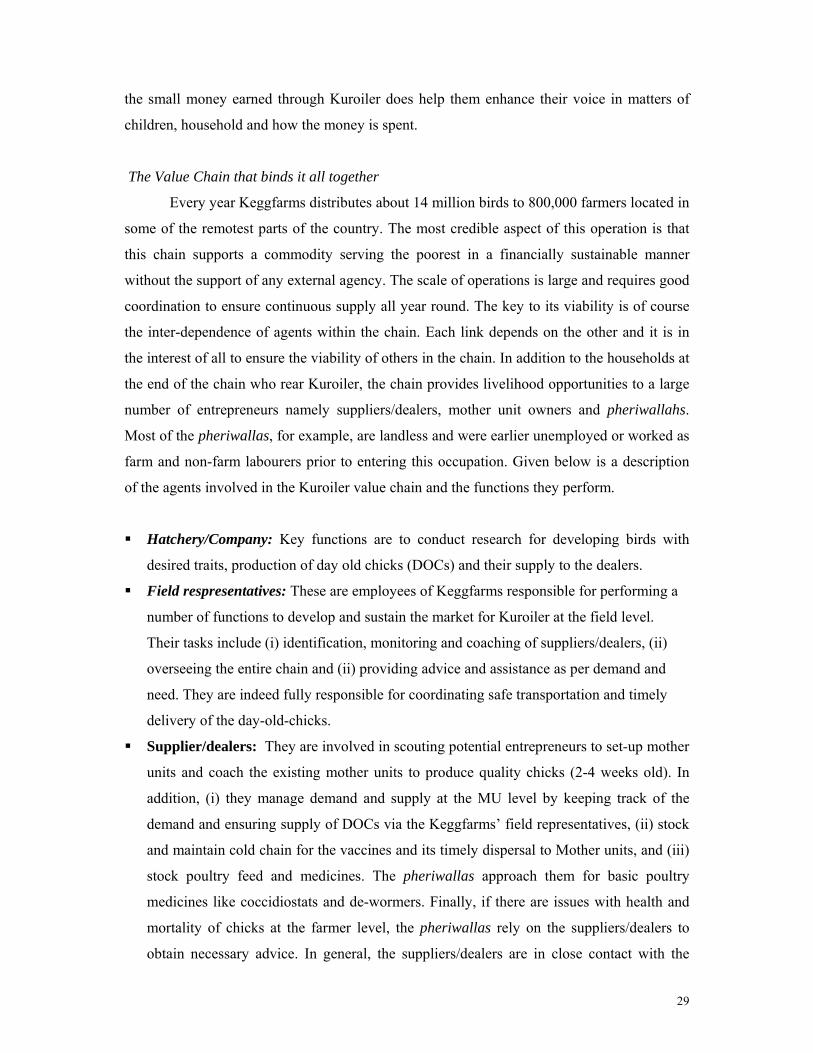
Empowerment: Mrilnalini Poria of Govind Chak village Midnapur district is an entrepreneur in her own right. She used to run a mother unit till she got pregnant and she had to shut down the mother unit. She presently has got a flock of six Kuroiler which she can easily manage along with her two young daughters. She had to meet different people including villagers, pheriwallas and company officials, while she was running the mother unit giving her confidence which she otherwise would have lacked. She is also confident of her making good investments in the field of poultry in future. She has already made up her mind to restart the mother unit when her new born is slightly older
naturally to the rural poor. The care that a Kuroiler requires is much less than that required by
cows and goats. Grazing grounds having reduced due to population pressures on the land,
rearing large livestock has become unviable. Under those circumstances, Kuroiler provide a
viable addition to the menu of livelihood options especially for those who have little or no
land.
Market orientation and women empowerment: Are the two incompatible?
Regardless of Kuroiler’s contribution to average household income, the livelihood
implications of Kuroiler raising are significant as this is primarily a women’s enterprise and
the external effects of women
entreprenurship in terms of intra-household
expenditure allocation, nutritional intake
and better education of girls are substantial.
In this context, an argument is often made
that the decision making role of women in
economic enterprises diminishes with the
growth of enterprise. As such enterprises
grow and become more market oriented,
men tend to take over and women again get
relegated to tending hosuehold activities.
The survey carried out for the study collected data on gender division of involvement
in various tasks associated with Kuroiler keeping. Taskwise division of labour acorss men
and women is given in Annex 2. Although some division of labour is discernible in the
Annex, there is no systematic decline in women’s involvement with the size of enterprise.
Indeed, women involvement continues to be sizeable in all actiivties including dispoal and
utilization of poultry income, decisions about further investments, etc. Therefore, at least
within the size range catured in this survey, there is no evidence of declining women’s
involvement with increased market orientation. Qualitative component of the study also
confirmed that a large number of women realized the power of economic independence
derived from Kuroiler money, howsoever modest. The more experience they acquired in this
more confident they became and with confidence came respect and standing amongst their
peer group. More and more women seemed quite confident with Kuroiler and actively sought
more information about better rearing practices so that they could avoid losses. While a large
number of women are still rooted into their ‘cultural’ role that ‘society’ has scripted for them,
29
the small money earned through Kuroiler does help them enhance their voice in matters of
children, household and how the money is spent.
The Value Chain that binds it all together
Every year Keggfarms distributes about 14 million birds to 800,000 farmers located in
some of the remotest parts of the country. The most credible aspect of this operation is that
this chain supports a commodity serving the poorest in a financially sustainable manner
without the support of any external agency. The scale of operations is large and requires good
coordination to ensure continuous supply all year round. The key to its viability is of course
the inter-dependence of agents within the chain. Each link depends on the other and it is in
the interest of all to ensure the viability of others in the chain. In addition to the households at
the end of the chain who rear Kuroiler, the chain provides livelihood opportunities to a large
number of entrepreneurs namely suppliers/dealers, mother unit owners and pheriwallahs.
Most of the pheriwallas, for example, are landless and were earlier unemployed or worked as
farm and non-farm labourers prior to entering this occupation. Given below is a description
of the agents involved in the Kuroiler value chain and the functions they perform.
Hatchery/Company: Key functions are to conduct research for developing birds with
desired traits, production of day old chicks (DOCs) and their supply to the dealers.
Field respresentatives: These are employees of Keggfarms responsible for performing a
number of functions to develop and sustain the market for Kuroiler at the field level.
Their tasks include (i) identification, monitoring and coaching of suppliers/dealers, (ii)
overseeing the entire chain and (ii) providing advice and assistance as per demand and
need. They are indeed fully responsible for coordinating safe transportation and timely
delivery of the day-old-chicks.
Supplier/dealers: They are involved in scouting potential entrepreneurs to set-up mother
units and coach the existing mother units to produce quality chicks (2-4 weeks old). In
addition, (i) they manage demand and supply at the MU level by keeping track of the
demand and ensuring supply of DOCs via the Keggfarms’ field representatives, (ii) stock
and maintain cold chain for the vaccines and its timely dispersal to Mother units, and (iii)
stock poultry feed and medicines. The pheriwallas approach them for basic poultry
medicines like coccidiostats and de-wormers. Finally, if there are issues with health and
mortality of chicks at the farmer level, the pheriwallas rely on the suppliers/dealers to
obtain necessary advice. In general, the suppliers/dealers are in close contact with the
30
relevant field representatives and where relevant they provide assistance in executing
their tasks.
Mother Units: The Mother Units purchase DOC and rear them for an initial period of two
to four weeks before selling to pheriwallas for further sale. This is a critical period for the
birds when it is very important to vaccinate the birds to reduce mortality further down the
chain. In principle, F1 and LaSota vaccination15 is provided respectively on day 6-7 and
4th week.
Pheriwallas: Pheriwallas purchase the birds from the Mother Units and sell them to the
farmer households. They are the sole agents in the chain with direct contact with the farm
households. They provide input to the farmers based on information they receives from
various sources. A pheriwalla is not obliged to buy from one particular mother unit.
Farmer Households: Farmers purchase birds from the pheriwallas/mother units and rear
them for consumption of eggs and meat within the household or sale to other farmers or
the local market.
Profile of sample mother units and pheriwallas
The mother units interviewed for the survey had been in this business for about 6
years. More than 80 percent of the people had undergone some education (average was 9
years of schooling) and about 60 percent of them had been involved in poultry business
before, mostly broilers. The average investment in setting up the mother unit was about
Rs.26,000.
About 60 percent of sample pheriwallas were landless and of those who owned land,
the land size was less than 2 acres. About 30 percent had no education and for the remaining,
the education level was less than 7 years. Before taking up this occupation, they were either
unemployed (30 percent), or worked as agricultural laborers/construction workers (43
percent) whereas the remaining were employed in some other jobs. Finally, for about 75
percent of the pheriwallas, this was their sole source of income.
The network of pheriwallas, mother unit owners and dealers/suppliers is fairly strong
and well coordinated but there is rather modest16 technical as well as extension input for
poultry husbandry in this network. The dealers/suppliers are given some training initially, but
there is no formal system in place to upgrade their knowledge base neither is the training very
15 When done F1 and LaSota vaccines are applied to prevent Ranikhet disease.
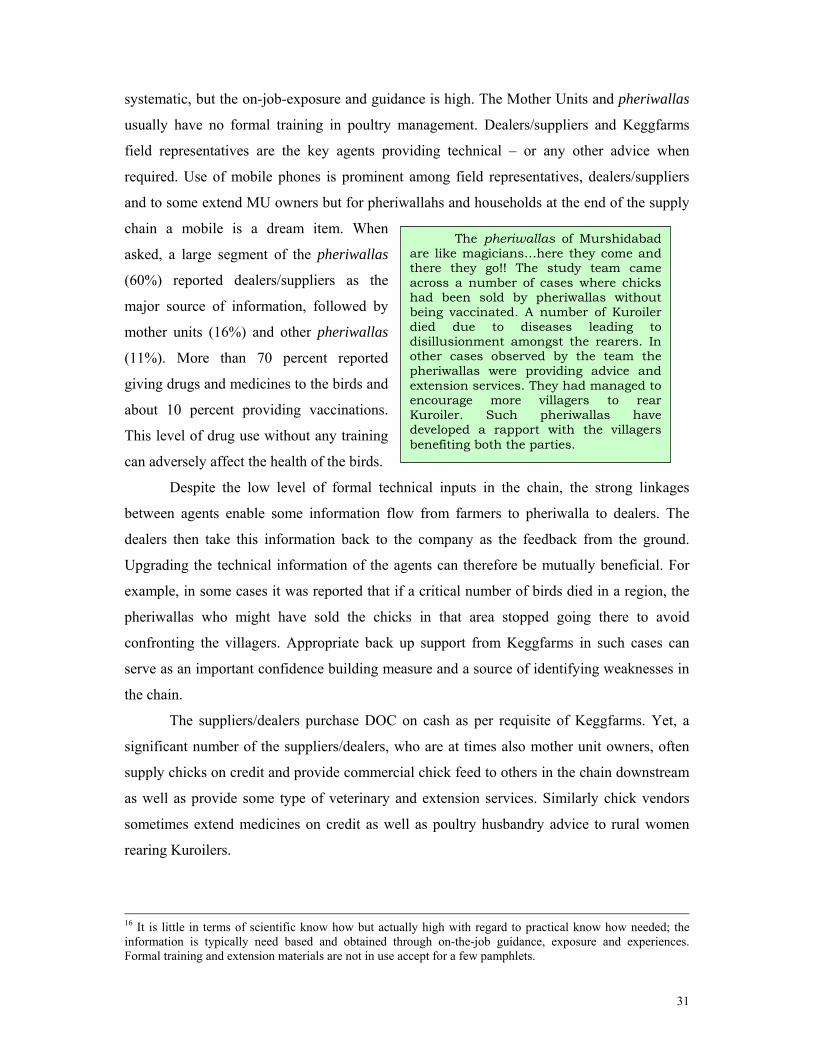
31
The pheriwallas of Murshidabad are like magicians…here they come and there they go!! The study team came across a number of cases where chicks had been sold by pheriwallas without being vaccinated. A number of Kuroiler died due to diseases leading to disillusionment amongst the rearers. In other cases observed by the team the pheriwallas were providing advice and extension services. They had managed to encourage more villagers to rear Kuroiler. Such pheriwallas have developed a rapport with the villagers benefiting both the parties.
systematic, but the on-job-exposure and guidance is high. The Mother Units and pheriwallas
usually have no formal training in poultry management. Dealers/suppliers and Keggfarms
field representatives are the key agents providing technical – or any other advice when
required. Use of mobile phones is prominent among field representatives, dealers/suppliers
and to some extend MU owners but for pheriwallahs and households at the end of the supply
chain a mobile is a dream item. When
asked, a large segment of the pheriwallas
(60%) reported dealers/suppliers as the
major source of information, followed by
mother units (16%) and other pheriwallas
(11%). More than 70 percent reported
giving drugs and medicines to the birds and
about 10 percent providing vaccinations.
This level of drug use without any training
can adversely affect the health of the birds.
Despite the low level of formal technical inputs in the chain, the strong linkages
between agents enable some information flow from farmers to pheriwalla to dealers. The
dealers then take this information back to the company as the feedback from the ground.
Upgrading the technical information of the agents can therefore be mutually beneficial. For
example, in some cases it was reported that if a critical number of birds died in a region, the
pheriwallas who might have sold the chicks in that area stopped going there to avoid
confronting the villagers. Appropriate back up support from Keggfarms in such cases can
serve as an important confidence building measure and a source of identifying weaknesses in
the chain.
The suppliers/dealers purchase DOC on cash as per requisite of Keggfarms. Yet, a
significant number of the suppliers/dealers, who are at times also mother unit owners, often
supply chicks on credit and provide commercial chick feed to others in the chain downstream
as well as provide some type of veterinary and extension services. Similarly chick vendors
sometimes extend medicines on credit as well as poultry husbandry advice to rural women
rearing Kuroilers.
16 It is little in terms of scientific know how but actually high with regard to practical know how needed; the information is typically need based and obtained through on-the-job guidance, exposure and experiences. Formal training and extension materials are not in use accept for a few pamphlets.
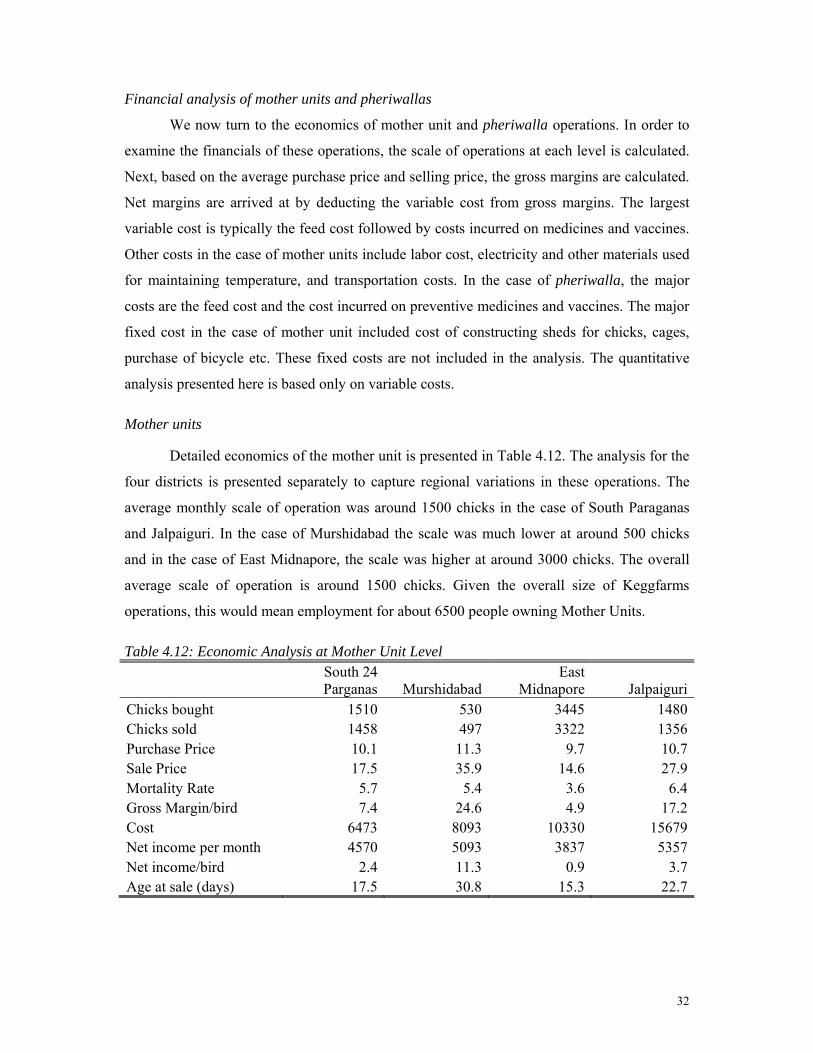
32
Financial analysis of mother units and pheriwallas
We now turn to the economics of mother unit and pheriwalla operations. In order to
examine the financials of these operations, the scale of operations at each level is calculated.
Next, based on the average purchase price and selling price, the gross margins are calculated.
Net margins are arrived at by deducting the variable cost from gross margins. The largest
variable cost is typically the feed cost followed by costs incurred on medicines and vaccines.
Other costs in the case of mother units include labor cost, electricity and other materials used
for maintaining temperature, and transportation costs. In the case of pheriwalla, the major
costs are the feed cost and the cost incurred on preventive medicines and vaccines. The major
fixed cost in the case of mother unit included cost of constructing sheds for chicks, cages,
purchase of bicycle etc. These fixed costs are not included in the analysis. The quantitative
analysis presented here is based only on variable costs. Mother units
Detailed economics of the mother unit is presented in Table 4.12. The analysis for the
four districts is presented separately to capture regional variations in these operations. The
average monthly scale of operation was around 1500 chicks in the case of South Paraganas
and Jalpaiguri. In the case of Murshidabad the scale was much lower at around 500 chicks
and in the case of East Midnapore, the scale was higher at around 3000 chicks. The overall
average scale of operation is around 1500 chicks. Given the overall size of Keggfarms
operations, this would mean employment for about 6500 people owning Mother Units. Table 4.12: Economic Analysis at Mother Unit Level
South 24 Parganas Murshidabad
East Midnapore Jalpaiguri
Chicks bought 1510 530 3445 1480Chicks sold 1458 497 3322 1356Purchase Price 10.1 11.3 9.7 10.7Sale Price 17.5 35.9 14.6 27.9Mortality Rate 5.7 5.4 3.6 6.4Gross Margin/bird 7.4 24.6 4.9 17.2Cost 6473 8093 10330 15679Net income per month 4570 5093 3837 5357Net income/bird 2.4 11.3 0.9 3.7Age at sale (days) 17.5 30.8 15.3 22.7
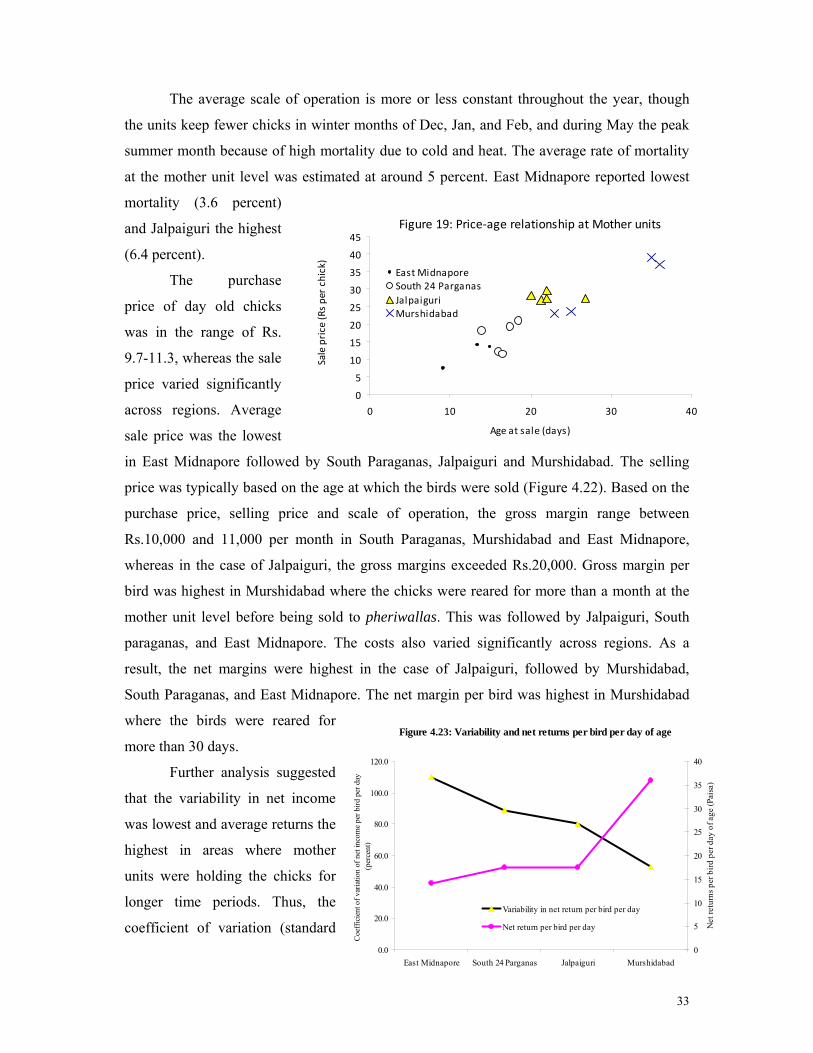
33
The average scale of operation is more or less constant throughout the year, though
the units keep fewer chicks in winter months of Dec, Jan, and Feb, and during May the peak
summer month because of high mortality due to cold and heat. The average rate of mortality
at the mother unit level was estimated at around 5 percent. East Midnapore reported lowest
mortality (3.6 percent)
and Jalpaiguri the highest
(6.4 percent).
The purchase
price of day old chicks
was in the range of Rs.
9.7-11.3, whereas the sale
price varied significantly
across regions. Average
sale price was the lowest
in East Midnapore followed by South Paraganas, Jalpaiguri and Murshidabad. The selling
price was typically based on the age at which the birds were sold (Figure 4.22). Based on the
purchase price, selling price and scale of operation, the gross margin range between
Rs.10,000 and 11,000 per month in South Paraganas, Murshidabad and East Midnapore,
whereas in the case of Jalpaiguri, the gross margins exceeded Rs.20,000. Gross margin per
bird was highest in Murshidabad where the chicks were reared for more than a month at the
mother unit level before being sold to pheriwallas. This was followed by Jalpaiguri, South
paraganas, and East Midnapore. The costs also varied significantly across regions. As a
result, the net margins were highest in the case of Jalpaiguri, followed by Murshidabad,
South Paraganas, and East Midnapore. The net margin per bird was highest in Murshidabad
where the birds were reared for
more than 30 days.
Further analysis suggested
that the variability in net income
was lowest and average returns the
highest in areas where mother
units were holding the chicks for
longer time periods. Thus, the
coefficient of variation (standard
Figure 19: Price‐age relationship at Mother units
0
5
10
15
20
25
30
35
40
45
0 10 20 30 40
Age at sale (days)
Sale price (R
s per chick)
East MidnaporeSouth 24 ParganasJalpaiguriMurshidabad
Figure 4.23: Variability and net returns per bird per day of age
0.0
20.0
40.0
60.0
80.0
100.0
120.0
East Midnapore South 24 Parganas Jalpaiguri Murshidabad
Coe
ffic
ient
of v
aria
tion
of n
et in
com
e pe
r bird
per
day
(p
erce
nt)
0
5
10
15
20
25
30
35
40
Net
retu
rns p
er b
ird p
er d
ay o
f age
(Pai
sa)
Variability in net return per bird per day
Net return per bird per day
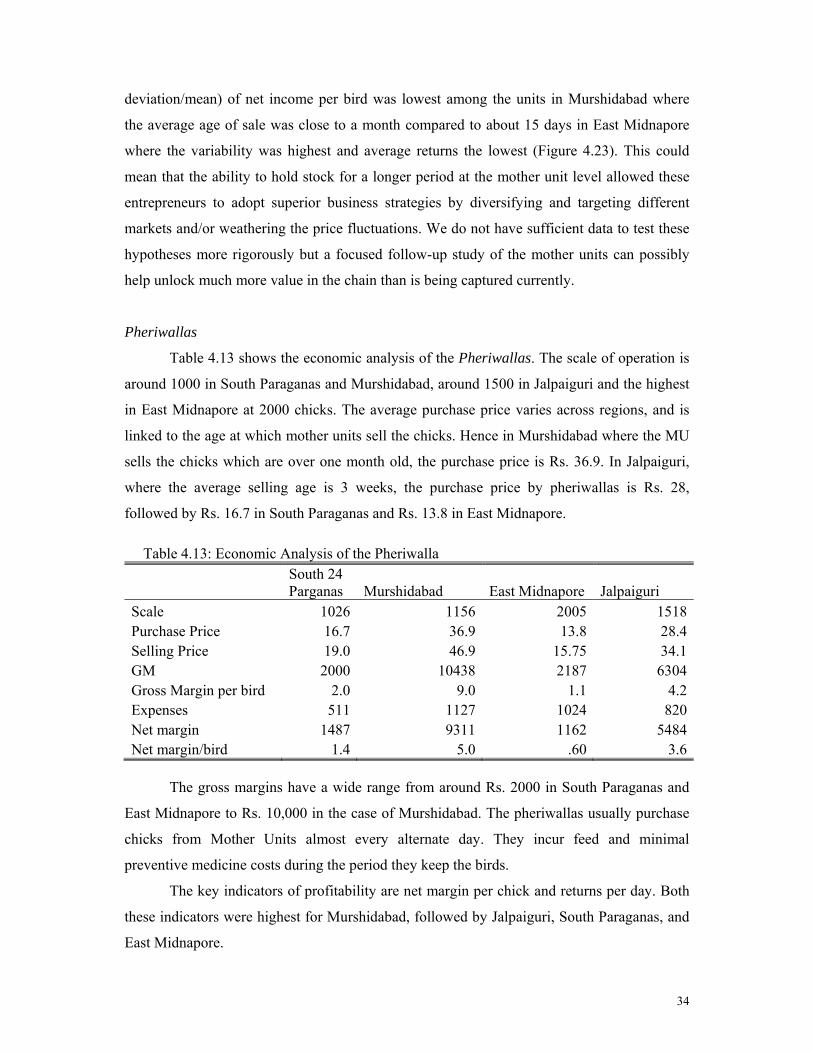
34
deviation/mean) of net income per bird was lowest among the units in Murshidabad where
the average age of sale was close to a month compared to about 15 days in East Midnapore
where the variability was highest and average returns the lowest (Figure 4.23). This could
mean that the ability to hold stock for a longer period at the mother unit level allowed these
entrepreneurs to adopt superior business strategies by diversifying and targeting different
markets and/or weathering the price fluctuations. We do not have sufficient data to test these
hypotheses more rigorously but a focused follow-up study of the mother units can possibly
help unlock much more value in the chain than is being captured currently.
Pheriwallas
Table 4.13 shows the economic analysis of the Pheriwallas. The scale of operation is
around 1000 in South Paraganas and Murshidabad, around 1500 in Jalpaiguri and the highest
in East Midnapore at 2000 chicks. The average purchase price varies across regions, and is
linked to the age at which mother units sell the chicks. Hence in Murshidabad where the MU
sells the chicks which are over one month old, the purchase price is Rs. 36.9. In Jalpaiguri,
where the average selling age is 3 weeks, the purchase price by pheriwallas is Rs. 28,
followed by Rs. 16.7 in South Paraganas and Rs. 13.8 in East Midnapore. Table 4.13: Economic Analysis of the Pheriwalla
South 24 Parganas Murshidabad East Midnapore Jalpaiguri
Scale 1026 1156 2005 1518Purchase Price 16.7 36.9 13.8 28.4Selling Price 19.0 46.9 15.75 34.1GM 2000 10438 2187 6304Gross Margin per bird 2.0 9.0 1.1 4.2Expenses 511 1127 1024 820Net margin 1487 9311 1162 5484Net margin/bird 1.4 5.0 .60 3.6
The gross margins have a wide range from around Rs. 2000 in South Paraganas and
East Midnapore to Rs. 10,000 in the case of Murshidabad. The pheriwallas usually purchase
chicks from Mother Units almost every alternate day. They incur feed and minimal
preventive medicine costs during the period they keep the birds.
The key indicators of profitability are net margin per chick and returns per day. Both
these indicators were highest for Murshidabad, followed by Jalpaiguri, South Paraganas, and
East Midnapore.
35
Independence Gauri Nauskar of Julpia village in South 24 Paraganas District is a poor Hindu woman for whom Kuroiler keeping is a source of income and food. Her two children, a son and a daughter get eggs to eat daily while she and her husband also get to consume eggs once a week. Surplus eggs are sold and money utilized for purchasing notebooks, stationary etc needed by her school going children. There is no discrimination in the diet pattern of the children. Her good management practices have ensured zero morbidity and mortality in her flock and raise in her status amongst peers. She is now leader of her SHG and has also undertaken training in poultry keeping organized by Panchayat.
It is evident from this analysis that as in the case of mother units, the pheriwallas also
make higher profits for chicks which 3-4 weeks old as compared to 2 week old chicks. This
could be because of lower perceived risk of mortality by households allowing the pheriwalla
to charge a higher retail price.
To summarize, effective functioning of value chain is perhaps the most critical aspect
of Kuroiler model that distinguishes it from other similar models. More important, however,
the aspect of organizational structure that ensures effective functioning of this chain is its
complete independence from any external support. Due to its market oriented nature, there is
sufficient opportunity for each agent in the chain to generate adequate surplus. At the same
time, close networking of agents ensures adequate information flow to prevent any serious
market failures. Finally, since every one is paying for the goods and services they receive,
there is sufficient pressure on delivery.
On the other hand, the aspects of
these operations that have implications of
public good nature are weak and deserve
attention. For example, there is no
monitoring of vaccination, mortality and
the level of drug use in the chain17. This
has significant implications for reducing
risk and containing losses in the chain
hence further enhancing the surplus for
rural households. Given that the risk
bearing ability of user households is
extremely low, any manifestation of this inherent risk (in the form of disease outbreak, for
example) can be destabilizing18. Addressing this issue, requires investment in skill building
and training in poultry management, livelihood analysis, and quality assurance of various
inputs used in the chain. Besides, there may also be scope of utilizing this network for
developing stronger market linkages such as purchase of eggs and buyback of birds with
appropriate links with emerging large scale retailers.
17 Non availability of thermo stable vaccines however makes the vaccination relatively complex. Maintaining the quality of vaccines in the cold chain is difficult considering the rural conditions of West Bengal where power supply in many places is absent or if in place frequent rationing is common. Additionally, the size of doses available is not favorable when limited number of birds are at stake. In short, available vaccines are typically meant for large scale poultry farming.
36
Security Sumitra Dakua of Madhav Danga, Jalpaiguri says “The Kuroiler are very useful in case of medical emergency, that is when you need to go to the doctor and need money, sell a bird and the problem is solved!”. The village women agree on this use of the Kuroiler.
5. Summary and Conclusions
This study had three key objectives—(i) to examine the impact of ‘Kuroiler’ in improving
and sustaining poor peoples’ livelihoods, (ii) to understand the threats and opportunities for
Kuroiler, and (iii) to identify need for policy support/space to promote market oriented
household based poultry systems. This section attempts to summarize key findings and
hazards a few recommendations in the process.
With the popularity of the Kuroiler increasing there are villages where rearing Kuroiler
has become a way of life. Here the status is influenced by the knowledge villagers have of
rearing birds and the quality/quantity of birds they hold. In the absence of any formal
extension it is the interdependence of the Kuroiler-growing community that helps them in
taking action to ensure the safety of their
flock.
Detailed data collected on the
costs and benefits of Kuroiler units (rural
households, pheriwallas, and mother
units) indicated high profit margin ratios at all levels and hence the enterprises passed the test
of economic viability. Although, the profit margin ratios of those rearing desi birds were
comparable with those rearing Kuroiler overall profits generated by Kuroiler enterprises were
significantly higher than those rearing desi birds. Thus Kuroilers bring in much more market
orientation and contribute significantly more to cash flows at the household level. Although
the overall average contribution of Kuroiler to total household income was about 10 percent
their contribution to other aspects of livelihoods such as security, development of
entrepreneurial capabilities in women, and strengthening of social networks was substantial.
Many poor households considered the Kuroiler as a living bank that they can cash in case of
an emergency or any other special occasion.
Poultry has been a part of the lives of rural households and they are quite adept at
handling birds. Emotional attachment to the birds can be traced back to the influence of the
birds in the formative years in the life of the poor. Besides the economics of it all, the
memories of chasing the chicken and having them pecking around in the house makes them a
natural choice in the livelihood portfolio of the poor. The enterprise also provides a
mechanism for effective use of kitchen/feed leftovers while in turn providing manure
18 For example, there was no awareness regarding Bird Flu despite the virus being endemic in neighboring
37
Sustainability “Kuroiler has given us a means of livelihood.” -Renu Jana. Renu and her husband Raju earn their livelihood through Kuroilers. Renu purchases and sells a flock of 25 Kuroilers thrice a year. They are reared to be sold for meat while Raju is a vendor who sells Kuroiler chicks in villages of the neighbourhood. They have been in Kuroiler business for the past 8 years. Renu had never reared poultry before but with the help of neighbours and the mother-unit person learned all about it. The mother-unit owner gives him chicks on credit to be returned on sale of chicken. Chick-mash is also bought on credit from the mother unit owner. Renu and Raju are grateful to the mother unit owner for helping them at all times with their Kuroiler business.
droppings and feathers for home gardens and making dusters. Thus, ‘Kuroiler’ easily forms
an integrated part of the livelihood system.
The power that the women feel when taking decisions independently is a positive step
towards empowerment. In households with alfa males these decisions remain small ones but
in many households women have taken the lead in making expenditure decisions. These
women are generally looked up to by their peer group and sought for advice in matters going
beyond poultry. Thus, Kuroiler make a considerable contribution towards inculcating
leadership and entrepreneurial skills in significant number of women and can even serve as a
window for entering into more complex businesses.
The other significant aspect of household poultry (not necessarily Kuroiler) relates to its
contribution towards food and nutrition security. Most households surveyed for this study
faced highly food insecure livelihoods. Eggs and poultry meat from their own backyard
contributed directly or indirectly to improved nutrition by becoming part of the weekly menu
or by facilitating purchase of carbohydrates (rice) and allowing a meal twice instead of one
per day.
Organizational structure of the
value chain that supports Kuroiler is what
set it apart from other models. It is not
the bird that is the discriminating
feature of Kuroiler operations but the
system that backs the bird. Close
coordination of chain for flow of goods,
services, and information, and economic
interdependence of agents in the chain
contributes significantly towards its
effective functioning. At the same time,
there are also a number of weak points in the chain that need strengthening. Firstly, there is
some selectivity in the nature and type of information flow in the chain. The information that
is of higher commercial interest to the company travels significantly faster than the
information that may be in larger public interest. For example, prescribed vaccinations at
mother unit level are not always provided while the vaccination against the major disease
New Castle (Ranikhet) is not practiced at all. The major losses therefore take place when a
Bangladesh for the last one and half year.
38
New Castle outbreak occurs which happens almost every winter. As a result, mortality rates
are relatively high and major improvements can be made by putting vaccination services in
place. Such information is slow to travel. Also, apart for brooding management (the care and
management of day-old chicks up to 4 – 6 weeks of age), no specific housing advice is
provided by the relevant chain agents. In general, however, rearers are able to respect the
basics of good housing namely sufficient ventilation and space, day light and dry
environment and make innovative use of local materials to keep the costs of housing low.
In this context, it is also important to understand that while there is substantial scope
for Keggfarms to strengthen information flow in the value chain, the responsibility of acting
in larger public interest goes much beyond Keggfarms. Relevant arms of Government need to
be far more active and pro-active in disease prevention and control and provision of extension
information while at the same time being supportive of commercial interests of all those
whose livelihoods depend on poultry birds including Kuroiler. In the information collected in
the survey, none of the poultry rearer received poultry related extension messages through the
Governmental or Non-Governmental channel. Most households developed the know-how
through experience and by consulting each other19. The poultry keepers were, for instance,
not at all aware of the danger of Bird Flu. None had ever heard of it and all mortality was
often mistaken with New Castle disease until the outbreak was confirmed by the government.
The point of the foregoing discussion is that there are significant spaces and avenues
for Keggfarms and the Department of Animal Resources Development to work together
cooperatively and collaboratively so as to combine their strengths for further enhancement of
Kuroiler based livelihoods. Unfortunately, the situation on that count did not appear very
encouraging. Although the Department of Animal Resources Development (DARD) is aware
of Keggfarms operations, there have been no attempts to either encourage it or seek concrete
cooperation and develop synergies. Indeed, the DARD appeared somewhat suspicious of
Keggfarms and raised concerns about growing dependence of poultry keepers on the
company since Kuroilers (as well as other synthetic birds sold in the West Bengal) do not
reproduce at household level due to lack of brooding ability and mothering instincts. The
DARD has therefore been promoting the Rhode Island Red (RIR) bird20. These schemes,
19 Formally a few write ups on poultry rearing have been produced by Keggfarms manager and were translated in Bangla. A few individuals in the Kuroiler chain established a relation with the government veterinarian but it remains exceptional. 20 RIR is also, in principle, a poor brooder but the argument is that fertile RIR eggs will be hatched by the desi hens; something what households also practice in case of Kuroiler eggs.
39
usually promoted through self-help groups (SHGs) are highly subsidized. DOCs are sold for a
symbolic price of 1 Rupee to a Self Help Group including free feed for the brooding period of
20 days. Brooding management of about 100 DOCs is in the hands of one SHG member,
while 10 female and one male chick are given out to each member. No data are available
regarding the performance of these birds. The RIR bird has already been promoted by the
DARD for almost three decades but still Kuroiler is far more widespread than RIR due to the
chain that delivers day old chicks to the doorsteps of poor farmers.
Similarly, the DARD has been promoting village animal health workers (Praani
Bandhu) but most of these workers, who have received short training from the DARD and
who belong to the community, do not reach out to poultry keepers and are actually not known
by the poultry keeping households. In may other setting, however, similar attempts have been
quite successful. For example, the concept has proven suitable in Bangladesh with the model
of poultry vaccinators –lay woman trained in basic preventive and curative health regarding
poultry production, equipped with equipment for vaccinations. They have access to vaccines
at district level, basic monitoring and support provided by NGO technical staff. These poultry
vaccinators play a crucial role in promoting bio-security measures and spreading awareness
with regard to Bird Flu.
Thus, there is much scope of public–private cooperation but unfortunately the ground
for such cooperation did not appear ripe. Any fruitful cooperation needs a critical minimum
level of trust in each other and belief in the common objectives21. Much remains to be done to
develop that trust and appreciation before meaningful public-private partnership can emerge
in this case. It needs to be understood that the word ‘profit’ in Indian policy makers’ lexicon
is still often equated with exploitation, whereas the sustainability of the Kuroiler chain
actually derives from the interdependent ‘profit motive’ of all stakeholders. Since each link in
the chain has an interest in doing well, the systems functions well in absence of any external
support. The entire Kuroiler chain has a life of its own and is sustainable as long as there is
steady source of Kuroiler day old chicks. All further attempts towards strengthening
livelihoods therefore need to work towards developing an appreciation of the critical role
played by ‘market orientation’.
21 For example, the private sector has the know how to produce a thermo stable New Castle vaccine but due to uncertainty of the market have not taken up such production. When the public sector would consider subsidizing such production lines and instituting other measures to reduce policy uncertainties, it might have a much larger impact than heavily subsidizing the production and distribution of RIR chicks.
40
References
Ahuja, Vinod, Jan Morrenhof and Arindam Sen. 2003. “Veterinary Services Delivery and the Poor: Case of Rural Orissa, India” OIEScientific and Technical Review, Vol 22, Number 3, December 2003.
Ahuja, Vinod (Editor). 2004. Livestock and Livelihoods: Challenges and Opportunities for
Asia in the Emerging Market Environment, National Dairy Development Board of Indian and Food and Agriculture Organization of the United Nations. 372p.
Ahuja, Vinod and Arindam Sen. 2007. Viability and future of small scale commercial poultry
production in developing countries, paper presented at International Conference on Poultry in the 21st Century: Avian Influenza and Beyond, Bangkok, November 5-7, 2007.
Baumgarter, R. & Högger, R. (Eds.). 2006. In Search of Sustainable Livelihood Systems,
Managing Resources and Change, Sage Publications, New Delhi, Thousand Oaks, London.
Dolberg, Frands. 2004. “Review of Household Poultry Production as a Tool in Poverty
Reduction with Focus on Bangladesh and India”, in Ahuja, Vinod (Editor), Livestock and Livelihoods: Challenges and Opportunities for Asia in the Emerging Market Environment, National Dairy Development Board, India and Pro-Poor Livestock Policy Facility (South Asia Hub) of FAO
Högger, R. 1994. The Family Universe, towards a Practical Concept of Rural Livelihood
Systems. Working Paper, NADEL, Swiss Federal Institute of Technology, Zürich, Switzerland.
Otte, Joachim. 2006. “The Hen Which Lays the Golden Eggs: Why Backyard Poultry are so
Popular?”, PPLPI Feature, www.fao.org/ag/pplpi.html.
41
ANNEXURES
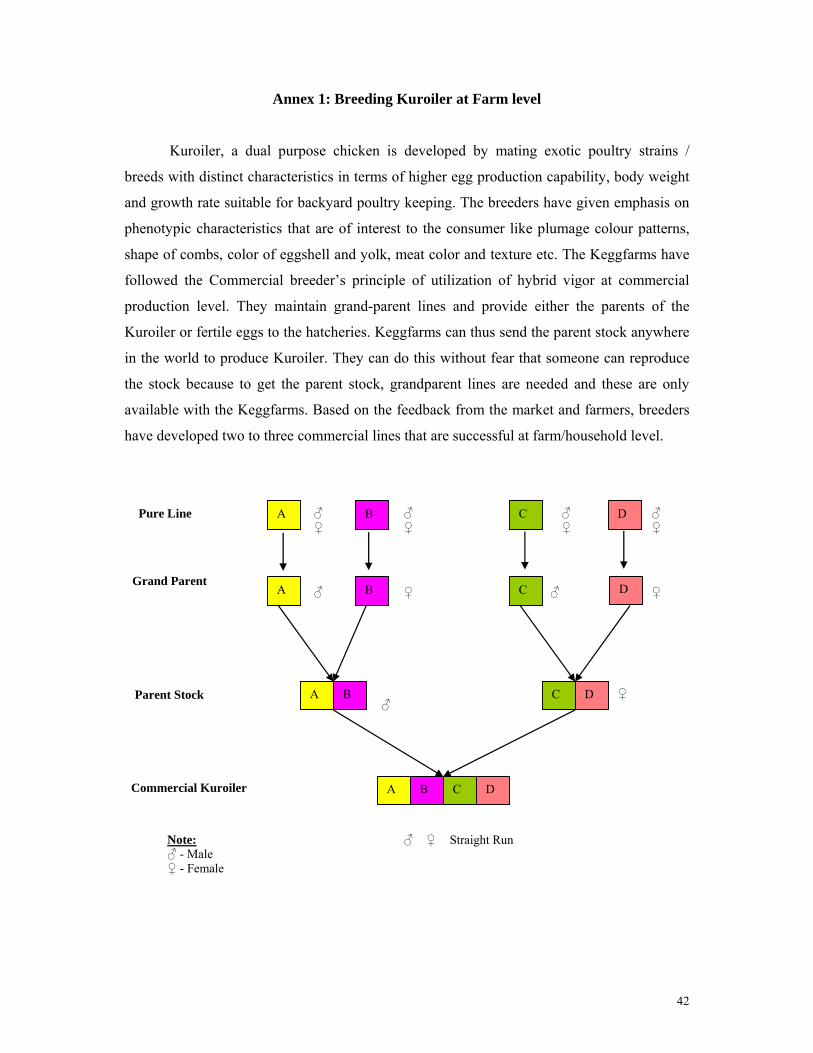
42
Annex 1: Breeding Kuroiler at Farm level
Kuroiler, a dual purpose chicken is developed by mating exotic poultry strains /
breeds with distinct characteristics in terms of higher egg production capability, body weight
and growth rate suitable for backyard poultry keeping. The breeders have given emphasis on
phenotypic characteristics that are of interest to the consumer like plumage colour patterns,
shape of combs, color of eggshell and yolk, meat color and texture etc. The Keggfarms have
followed the Commercial breeder’s principle of utilization of hybrid vigor at commercial
production level. They maintain grand-parent lines and provide either the parents of the
Kuroiler or fertile eggs to the hatcheries. Keggfarms can thus send the parent stock anywhere
in the world to produce Kuroiler. They can do this without fear that someone can reproduce
the stock because to get the parent stock, grandparent lines are needed and these are only
available with the Keggfarms. Based on the feedback from the market and farmers, breeders
have developed two to three commercial lines that are successful at farm/household level.
♂ ♀
♂♀
♂ ♀
♂♀
♂ ♂♀ ♀
♂♀
♂ ♀ Straight Run
Parent Stock
Grand Parent
Pure Line
Commercial Kuroiler
A B C D
A B C D
A B C D
A B C D
Note: ♂ - Male ♀ - Female
43
In West Bengal rural households keep 4 to 10 birds depending on the social
environment and scavenging area available. Housing is provided for night and adverse
weather conditions. These are made out of locally available material like bamboo, mud, palm
leaves etc. The birds, raised as backyard poultry scavenge substantial part of their total feed
requirement and are also given some locally grown grains and kitchen leftovers. At farms or
in rural households, Kuroiler rearing is undertaken primarily for meat and most hens are
retained for eggs and then sold for meat. It is also relevant to mention that since Kuroiler are
derived from exotic breeds, they do not have broodiness. Most villagers are aware of its
regeneration limitations and accept this.
It has been observed in some rural households that fertile eggs obtained from mating
of Kuroiler hens and cocks are set under desi hens to hatch chicks. In such chicks the level of
heterosis is diminished and also the genetic composition is altered, resulting in lower
productive capability and livability. This process while acceptable in F1 generation is further
heightened during F2 and further generations.
The households that have mixed flocks of desi and Kuroiler, natural mating does
occur between Kuroiler cocks and local desi hens. Such eggs result in 80 to 90 %
hatchability. This F1 generation shows good growth and egg laying capacity compared to
desi but in subsequent generations a drop in body-weight and in egg laying capacity is
noticed. Such progeny have productive capabilities far below Kuroiler.
Physical
• Birds of both sexes are fairly large in size weighing on an average about 2 to 2.5 Kg at 5 months of age. The cocks attain a body weight of 4kg while hens weigh 2-2.5 Kg.
• Body is rectangular in shape, broad and deep. Breast is broad and full, carried well forward .These characteristics make it a good meat producing bird.
• Legs are strong, straight and positioned wide apart from each other. The shanks are long and strong. Toes and shanks are yellow to blackish yellow in color and are free from feathers. Spur is not present.
• The birds are alert and have active appearance. • It has a multicolored plumage (color varies from red to grey to black). • Earlobes are oval in shape, smooth and red in color. • Beak is small, pointed at tip and wide at base. Its color varies from yellow to black. • Skin is pinkish white • Combs and wattles are bright red in color. Most have single, pea or rose combs that
are small in size like local poultry breeds. • Wattles are small in both sexes.
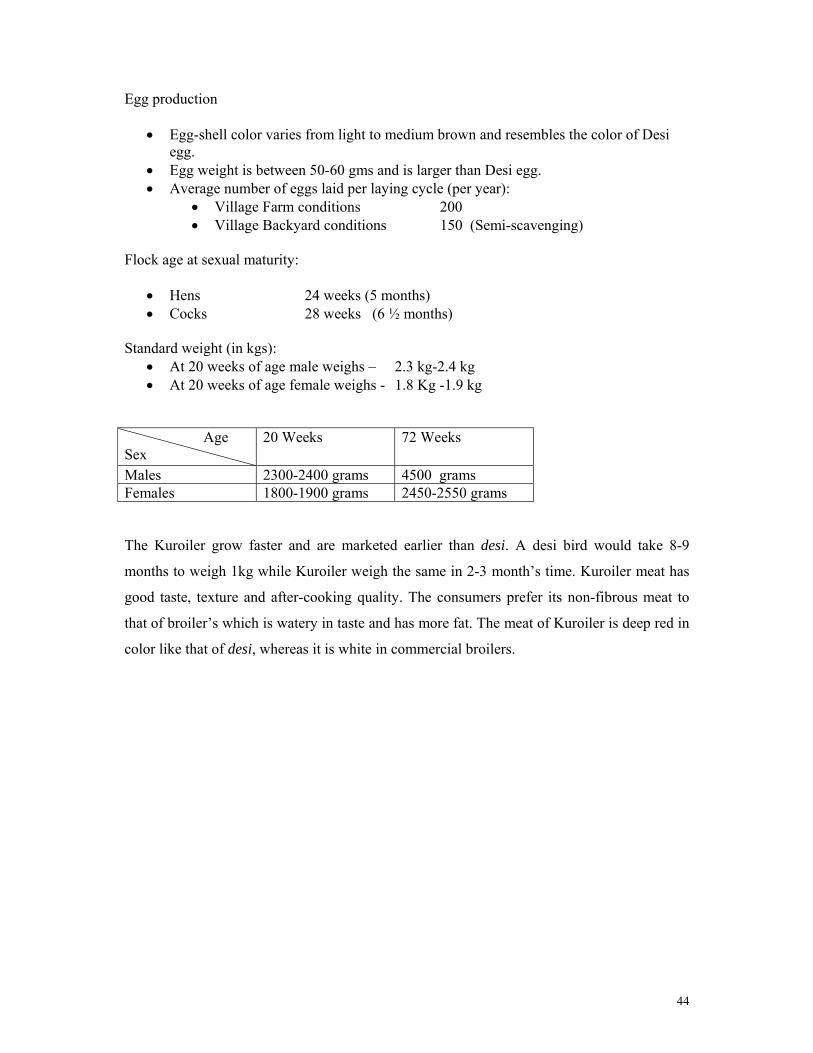
44
Egg production
• Egg-shell color varies from light to medium brown and resembles the color of Desi egg.
• Egg weight is between 50-60 gms and is larger than Desi egg. • Average number of eggs laid per laying cycle (per year):
• Village Farm conditions 200 • Village Backyard conditions 150 (Semi-scavenging)
Flock age at sexual maturity:
• Hens 24 weeks (5 months) • Cocks 28 weeks (6 ½ months)
Standard weight (in kgs):
• At 20 weeks of age male weighs – 2.3 kg-2.4 kg • At 20 weeks of age female weighs - 1.8 Kg -1.9 kg
Age Sex
20 Weeks 72 Weeks
Males 2300-2400 grams 4500 grams Females 1800-1900 grams 2450-2550 grams The Kuroiler grow faster and are marketed earlier than desi. A desi bird would take 8-9
months to weigh 1kg while Kuroiler weigh the same in 2-3 month’s time. Kuroiler meat has
good taste, texture and after-cooking quality. The consumers prefer its non-fibrous meat to
that of broiler’s which is watery in taste and has more fat. The meat of Kuroiler is deep red in
color like that of desi, whereas it is white in commercial broilers.
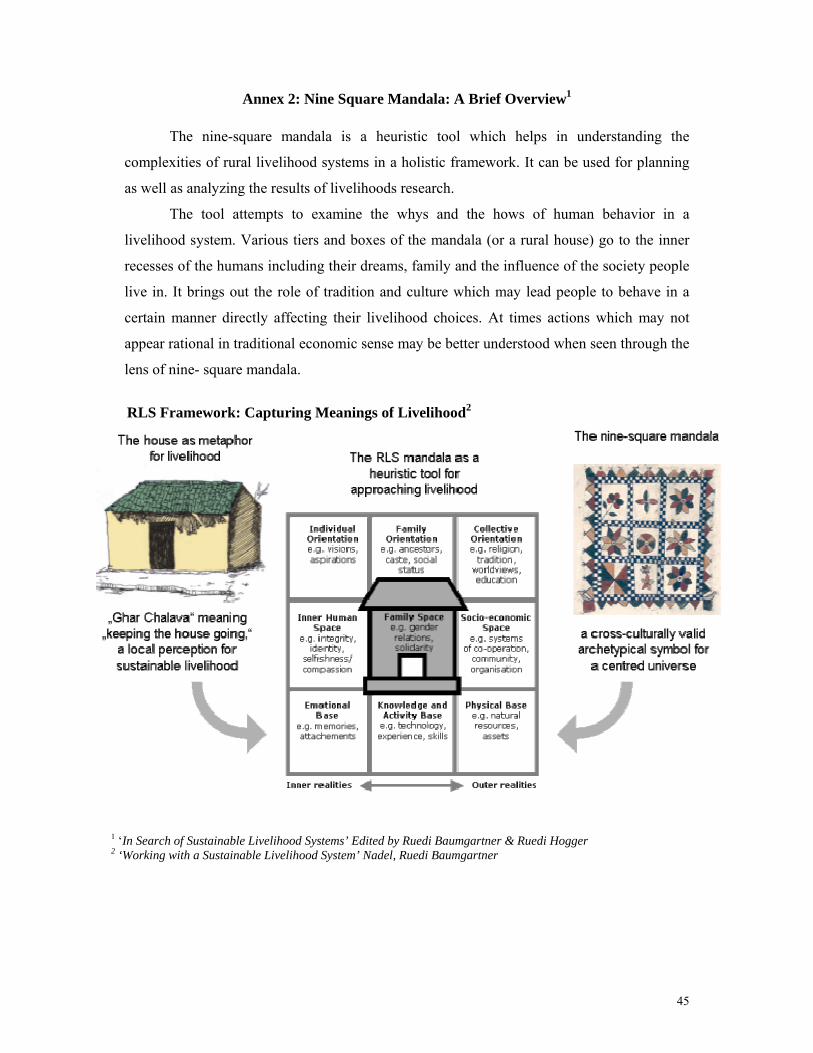
45
Annex 2: Nine Square Mandala: A Brief Overview1
The nine-square mandala is a heuristic tool which helps in understanding the
complexities of rural livelihood systems in a holistic framework. It can be used for planning
as well as analyzing the results of livelihoods research.
The tool attempts to examine the whys and the hows of human behavior in a
livelihood system. Various tiers and boxes of the mandala (or a rural house) go to the inner
recesses of the humans including their dreams, family and the influence of the society people
live in. It brings out the role of tradition and culture which may lead people to behave in a
certain manner directly affecting their livelihood choices. At times actions which may not
appear rational in traditional economic sense may be better understood when seen through the
lens of nine- square mandala.
RLS Framework: Capturing Meanings of Livelihood2
1 ‘In Search of Sustainable Livelihood Systems’ Edited by Ruedi Baumgartner & Ruedi Hogger 2 ‘Working with a Sustainable Livelihood System’ Nadel, Ruedi Baumgartner
46
Ruedi Hogger took a rural house as a metaphor and based the livelihood framework of nine-
square mandala on it. All houses have a base or floor, walls that enclose space and finally a
roof. Similarly Livelihood systems can also be understood as a three tiered entity: It has a
basis consisting of material and non material resources:(lower row of squares) the walls are
comparable to various spaces of socio economic, familial or personal nature (middle row of
squares); and there is always a mental roof providing for collective or individual orientation
(upper row of squares).
The Basis of Livelihood System
As we start ‘reading’ from the right hand lower corner of the mandala, we first touch
upon the physical basis of any livelihood system. It may refer to many realities, such as
natural or economic resources, income in cash or kind, accumulated wealth or remittances
from migrant family members.
At the same level but to the far left of the row, we find a reference to the emotional
basis that any livelihood system will depend on. What keeps people alive and on the move
are some of their emotional attachments to what they consider to be their homes and their
way of life.
The middle square of the lower row refers to the knowledge and activity basis i.e., to
the crafts, trades, skills or traditional knowledge on which the family universe is built. Their
role in a livelihood system is of key importance and high complexity, binding the physical
and the emotional basis of the system together in human activities.
Public, Private and Inner Human Space
The second row of squares referred to as ‘space’ characterizes the walls of a real
village home that demarcate an intricate puzzle of highly differentiated spaces, moving from
outer to inner, from public to private, from collective to intimate, from profane to sacred.
There are innumerable differentiations of the social space like neighborhoods, caste
hierarchies, village community, the panchayat, and multiple relations with government and
the market. All these make up the socio economic space referred to in the square at the right
hand of the middle tier.
The family space is depicted in the very center of the mandala because it is the key
area of what we call a livelihood system. The questions of gender, of generations, and of
seniority within generations play important roles. Here traditions are fostered or despised,
47
values are transmitted or refused and family planning is practiced or neglected. Social space
may be of great influence for economic and social decision making, but family space is
usually decisive and adds even more complexity to it.
On the left side of the middle row reference is made to inner human or intimate space.
This is to say that neither the broadly accepted rules of the socio economic space nor those of
the family space will ever alone determine what action is going to be taken in a given system.
These actions always depend on very personal consideration and qualities of individual
people.
The Roof: A Place to Look Up to
Roof of the house is made up of top row of squares in the RLS mandala. It is the place
to look up to and take orientation from. In this upper most tier we deal with all mental
perspectives that shape and guide the wider community. Some of the collective orientations
are common property rights, religious practices and festival, the laws of government and
standards of schools. The above orientations are practically the same for all inhabitants of a
given area. The multitude of mental orientations will be much bigger when we study the
values and convictions prevalent in individual families. The final opportunity and
responsibility to seek orientation lies with the individual (left hand square in the upper most
tier), who may or may not remain true to the given orientation of the family or the
community. Even in a traditional society there is room for personal visions, hopes, aspirations
and even ‘revolutionary’ changes. The dynamics of change very often originate in the attitude
or activity of a strong individual.
All Aspects are Inter Linked
As we read through the RLS Mandala from right to left we always go from the outer
to the inner realities, from those aspects that can be described with ‘hard’ data to those that
must be sensed and intuited. From the bottom to the top of the mandala it is a transition from
physical and emotional basis to the mental roof with its concepts and perspectives. In other
words it is the passage from what people ‘stand upon’ (looking back) to what they ‘look up’
to (for their future).
None of the nine chambers are truly independent of each other. Every one of them is
intricately linked with each other, and the transitions from one to the other are gradual not
abrupt.
48
These squares are all inter-related and change in one square of the Mandala has an
affect on the other squares. It is important to understand that the links between them have to
be analyzed to understand the complexities of a livelihood system. For example, policy
decisions to ban backyard poultry by the Government (Square 7) would have direct impact on
the family’s income (Square 4) and its well-being (Square 5).
Similarly relationship between husband and wife (Square 5) will have effect on the
Inner human space (Square 6) of the wife. If the husband is supportive, the wife will have
more self-confidence and more self esteem. She stands a better chance in succeeding in small
business like poultry keeping for she can take active part in decision making. This in turn will
impact their income (Square 4).
Looking through the nine squares of the Mandala helps in understanding and analyzing why
people behave in a certain way; why they might as per our perception take irrational
decisions. Normally we observe the so called outer realities but when looking through the
squares especially those on the left (3, 6, 9) helps gain insights in things people normally do
not share easily but keep to themselves.
49
Annex 3: The Asset Index
To make comparisons across income groups, this study used a composite index based
on indicators of household assets. The index was constructed using weights chosen by
principal components as proposed by Filmer and Pritchett (1998). This annex describes the
methodology used for constructing the index and presents some statistics to demonstrate the
robustness and internal coherence of the index.
The index uses 24 asset variables which can be divided into four categories:
ownership of consumer durables, characteristics of the house occupied by the household,
ownership of land, and ownership of livestock. The index is a weighted linear index where
the weights are obtained using the procedure of principal components22. The index is
constructed as follows
where Ai is value of index for ith household, fk is the factor score coefficient for kth asset, aik is
value of kth asset for ith household, and ak and sk are the mean and standard deviation of the
kth asset over all households. Mean value of the index is zero by construction and the mean,
minimum and maximum for the poorest households were –0.90, -1.17 and –0.76,
respectively. Comparable figures for the richest households were 1.67, 0.79 and 3.35 (Table
A1).
The index does very well in separating poor, middle and rich households. Table A2
presents the summary statistics for the variables used in constructing the index across bottom,
middle and top 20 percent categories. It is clear that index produces a very sharp difference
across these groups in nearly every asset. For example, ownership of un-irrigated land is 1.42
acres for the poorest households and 4.20 acres for the richest households. Comparable
figures for irrigated land are 0.08 acres and 1.82 acres. Similarly, the mean for cattle
ownership for the poorest 20 percent households in the sample was 2.37 compared to 4.37 for
the top 20 percent. At the same time, however, the proportion of crossbreds in cattle stock
was about 6 percent for the poorest households compared to nearly 10 percent for the richest
households. Similar separations can be seen across all variables.
22 Principal components is a procedure for extracting from a large number of variables those linear combinations that capture common information in those variables.
∑ −=
kk
kikki s
aafA
)(
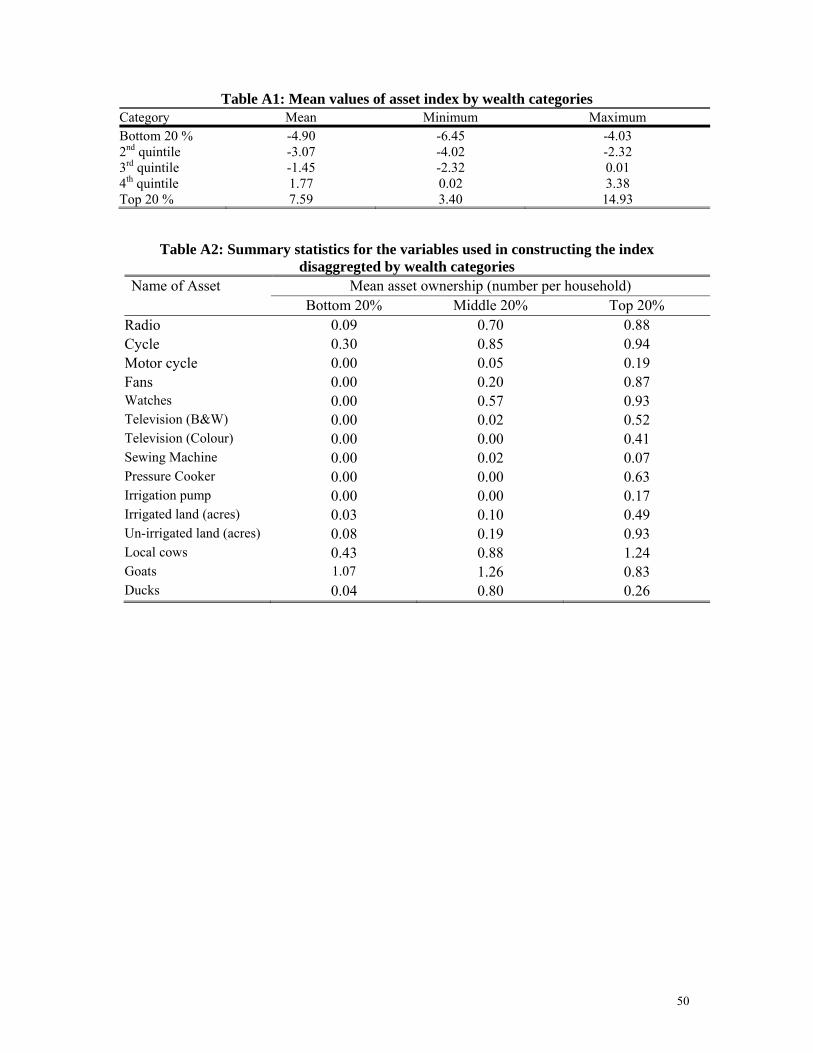
50
Table A1: Mean values of asset index by wealth categories Category Mean Minimum Maximum Bottom 20 % -4.90 -6.45 -4.03 2nd quintile -3.07 -4.02 -2.32 3rd quintile -1.45 -2.32 0.01 4th quintile 1.77 0.02 3.38 Top 20 % 7.59 3.40 14.93
Table A2: Summary statistics for the variables used in constructing the index disaggregted by wealth categories
Name of Asset Mean asset ownership (number per household) Bottom 20% Middle 20% Top 20%
Radio 0.09 0.70 0.88 Cycle 0.30 0.85 0.94 Motor cycle 0.00 0.05 0.19 Fans 0.00 0.20 0.87 Watches 0.00 0.57 0.93 Television (B&W) 0.00 0.02 0.52 Television (Colour) 0.00 0.00 0.41 Sewing Machine 0.00 0.02 0.07 Pressure Cooker 0.00 0.00 0.63 Irrigation pump 0.00 0.00 0.17 Irrigated land (acres) 0.03 0.10 0.49 Un-irrigated land (acres) 0.08 0.19 0.93 Local cows 0.43 0.88 1.24 Goats 1.07 1.26 0.83 Ducks 0.04 0.80 0.26
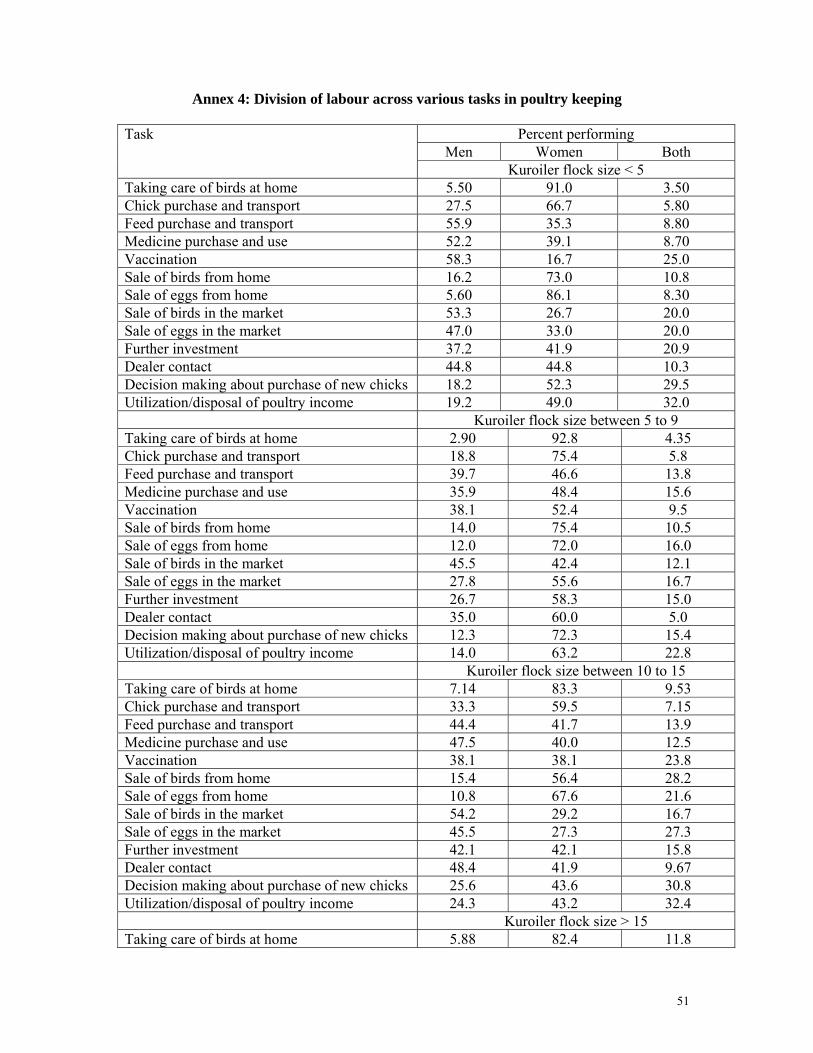
51
Annex 4: Division of labour across various tasks in poultry keeping
Task Percent performing Men Women Both
Kuroiler flock size < 5 Taking care of birds at home 5.50 91.0 3.50 Chick purchase and transport 27.5 66.7 5.80 Feed purchase and transport 55.9 35.3 8.80 Medicine purchase and use 52.2 39.1 8.70 Vaccination 58.3 16.7 25.0 Sale of birds from home 16.2 73.0 10.8 Sale of eggs from home 5.60 86.1 8.30 Sale of birds in the market 53.3 26.7 20.0 Sale of eggs in the market 47.0 33.0 20.0 Further investment 37.2 41.9 20.9 Dealer contact 44.8 44.8 10.3 Decision making about purchase of new chicks 18.2 52.3 29.5 Utilization/disposal of poultry income 19.2 49.0 32.0 Kuroiler flock size between 5 to 9 Taking care of birds at home 2.90 92.8 4.35 Chick purchase and transport 18.8 75.4 5.8 Feed purchase and transport 39.7 46.6 13.8 Medicine purchase and use 35.9 48.4 15.6 Vaccination 38.1 52.4 9.5 Sale of birds from home 14.0 75.4 10.5 Sale of eggs from home 12.0 72.0 16.0Sale of birds in the market 45.5 42.4 12.1 Sale of eggs in the market 27.8 55.6 16.7 Further investment 26.7 58.3 15.0 Dealer contact 35.0 60.0 5.0 Decision making about purchase of new chicks 12.3 72.3 15.4 Utilization/disposal of poultry income 14.0 63.2 22.8 Kuroiler flock size between 10 to 15 Taking care of birds at home 7.14 83.3 9.53 Chick purchase and transport 33.3 59.5 7.15 Feed purchase and transport 44.4 41.7 13.9 Medicine purchase and use 47.5 40.0 12.5 Vaccination 38.1 38.1 23.8 Sale of birds from home 15.4 56.4 28.2 Sale of eggs from home 10.8 67.6 21.6 Sale of birds in the market 54.2 29.2 16.7 Sale of eggs in the market 45.5 27.3 27.3 Further investment 42.1 42.1 15.8 Dealer contact 48.4 41.9 9.67 Decision making about purchase of new chicks 25.6 43.6 30.8 Utilization/disposal of poultry income 24.3 43.2 32.4 Kuroiler flock size > 15 Taking care of birds at home 5.88 82.4 11.8
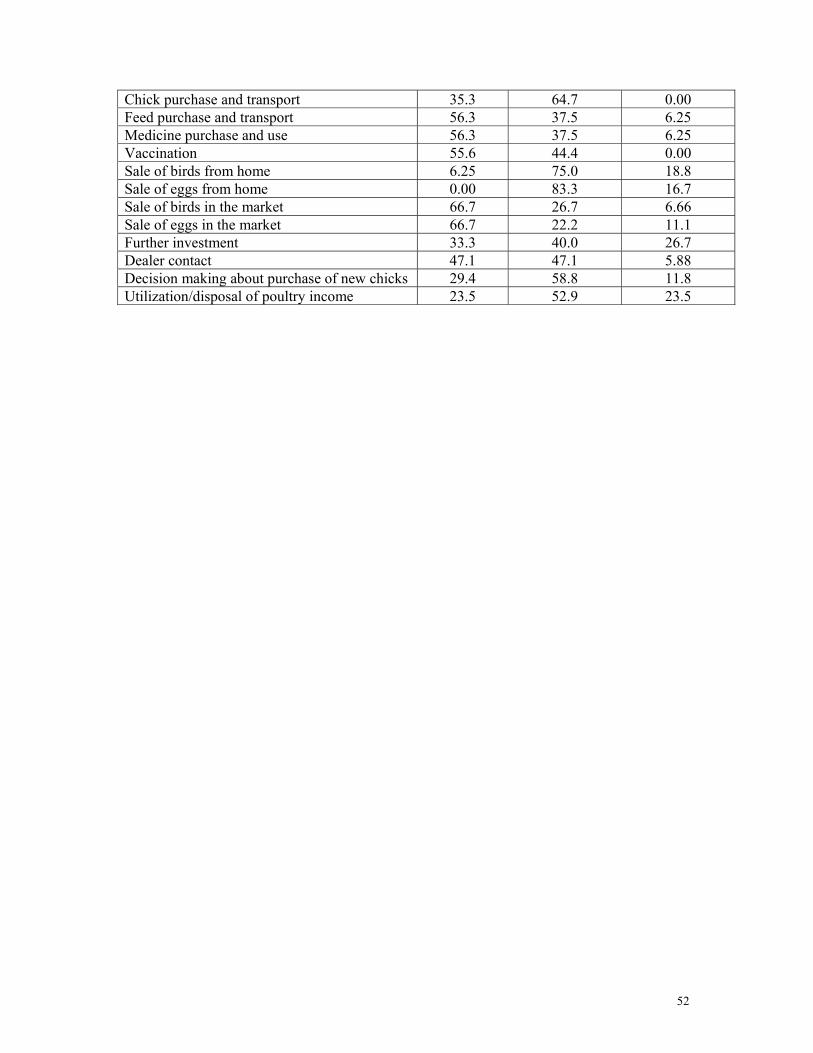
52
Chick purchase and transport 35.3 64.7 0.00 Feed purchase and transport 56.3 37.5 6.25 Medicine purchase and use 56.3 37.5 6.25 Vaccination 55.6 44.4 0.00 Sale of birds from home 6.25 75.0 18.8 Sale of eggs from home 0.00 83.3 16.7 Sale of birds in the market 66.7 26.7 6.66 Sale of eggs in the market 66.7 22.2 11.1 Further investment 33.3 40.0 26.7 Dealer contact 47.1 47.1 5.88 Decision making about purchase of new chicks 29.4 58.8 11.8 Utilization/disposal of poultry income 23.5 52.9 23.5


