Page 1
www.ijcrt.org © 2018 IJCRT | Volume 6, Issue 1 March 2018 | ISSN: 2320-2882
IJCRT1803165 International Journal of Creative Research Thoughts (IJCRT) www.ijcrt.org 479
Poverty across Socio-Religious Groups in Karnataka
by Using NSSO Data
Dr.Niranjan.R1 & Shivakumar2
Abstract
The present study attempt a horizontal analysis of division wise patterns of poverty on head count ratio of
existing among social and religious groups in Karnataka state and specially focus on Hyderabad-Karnataka
region. This region constrains six most backward districts in Karnataka that are below the state and national
average in majority of socio economic indicators and also study cover four administrative divisions are
Kalaburagi division, is also known as Hyderabad-Karnataka (HK) region, Bengaluru division, Mysuru division
and Belagavi division. Methodology of my research work is primarily uses specific poverty line of Karnataka
which is defined Tendulkar Methodology Rs.418 and Rs.588 in rural & urban area of 61st round (2004-05) and
Rs.902 and Rs.1089 in rural & urban area of 68th round (2011-12) of NSSO rounds data to decipher micro level
of poverty in districts of Karnataka, Division wise, Social groups and Religious groups such as SC/ST/OBC &
Others. Study also estimates of logistic regression to identify key determinants of poverty of the independent
variables. Poverty estimates district wise and division wise poverty, there is highest ratio found in Kalaburagi
division or (HK) region, second larger poverty consist in Belagavi division of both rural and urban. While
poverty in the state reduced by total 12.74%, points between 2004-05 and 2011-12. Remnants the incidence of
poverty in social group wise reduced by 19.67% in Scheduled Tries, 20.66% in Scheduled Caste, 15.9% in
OBC & 4.5% and the estimates poverty in religion wise reduced by 13.45% in Hindu and 11.46% in Muslims
communities.
Key words: Measurement of Poverty, Districts and Divisions Poverty across Socio-Religious groups.
I. Introduction
Poverty is a multidimensional phenomenon and it is the greatest challenge to the mankind. Poverty is
defined as deprivation in well-being. It must be seen as the scarcity of basic capabilities rather than simply
taking into thought the monetary aspect which forms a usual dimension as to whether the person is poor or not3.
Amartya Sen in his book, ‘Poverty and Famines’ importance of diverse concepts of poverty which has to be
taken under deliberation for the effective understanding of poverty. In broad terms the poverty is defined as the
1 Assistant Professor, Dept of Studies and Research in Economics, Vijayanagara Sri Krishnadevaraya University, Ballari-583105. 2 Doctoral Scholar, Dept of Studies and Research in Economics, Vijayanagara Sri Krishnadevaraya University, Ballari-583105 3 Amartya Sen's Theory of Poverty Mubashshir Sarshar, National Law University, Delhi
Page 2
www.ijcrt.org © 2018 IJCRT | Volume 6, Issue 1 March 2018 | ISSN: 2320-2882
IJCRT1803165 International Journal of Creative Research Thoughts (IJCRT) www.ijcrt.org 480
inability to acquire the basic goods and services essential for survival with distinction. It also includes low
levels of attainment, education and health, poor access to sanitation and clean water, insufficient physical
security, and inadequate capacity and opportunity to better one’s life4. Similarly it implies severe lack of
material and none maternal goods which impede the normal development of the individuals. In absolute terms,
it reflects the inability of an individual to satisfy certain basic minimum needs for a sustained, healthy and
reasonably productive living.
Economic growth is the most powerful device for reducing poverty and improving the quality of life in
developing countries. It’s creates job opportunities and thus stronger exact for labour, the main and often the
sole asset of the poor. In turn, increasing employment has been critical in delivering higher growth and is not
just associated with eradicate poverty. There is also clear evidence for a positive linking with economic
development and broader measures of human development. Amartya Sen has described economic growth as a
critical means for increasing the substantive freedoms that people value. These freedoms are strongly associated
with development in general living standards, such as greater opportunities for people to become improved, eat
better and live longer5.
Poverty is one of the most critical issues being faced by any economy. It has been defined variously by
the scholars. “Poverty is conservatively measured by the expenditure or income level that can continue an
exposed minimum standard of living”. There has been considerable discussion on the question whether poverty
line should reveal an ‘absolute’ or ‘relative’ view of poverty. ‘Absolute view of poverty’ considers the poverty
line as the expenditure required to purchase a ‘subsistence’ pack of items by the individual, whereas ‘Relative
view of poverty’ requires a comparative analysis of percentage of number of persons in different expenditure
groups. The problem of poverty has persisted long and it is the central challenge of development at the global
level. Poverty is said to be the inability to attain a minimum level of well-being, is the most fundamental
economic and social problem facing humanity.
In India context, poverty is measured in terms of a specified normative poverty line reflecting the
minimum living standard of people. The official approach has laid emphasis on ensuring a subsistence
minimum and hence, on eradicating absolute poverty (M.H. Suryanarayana (2010). The measurement of
poverty is a complex exercise and the estimates are broadly based on per capita consumption expenditure of
household consumption expenditure surveys of NSSO. As per the estimates of Tendulkar committee in 2011-
12, is 21.9 percentage of population are poor that is 269.9 millions of population is living below the poverty
4 World Bank (2006) 5 Amarthya Sen, (1999)
Page 3
www.ijcrt.org © 2018 IJCRT | Volume 6, Issue 1 March 2018 | ISSN: 2320-2882
IJCRT1803165 International Journal of Creative Research Thoughts (IJCRT) www.ijcrt.org 481
line6. Globally two-third of world population is living below the international poverty line which is measured in
terms of Purchasing Power Parity (PPP), of $ 1.90 per day7.
II. Concept in Poverty Estimation
The various measures of poverty estimation are Headcount Ratio, Poverty Gap Index, and Squared Poverty Gap
Index.
Head Count Ratio (Hp): The number of poor estimated as the proportion of people below the poverty
line is known as head count ratio. Is calculated by dividing the number of people below the poverty line
by the total population.
Hp= 𝑛
𝑁 (1)
Hp = Headcount ratio, n = Number of people below poverty line & N = Total population.
Poverty Gap Index (PGI): Another poverty measure is Poverty Gap Index. It is the ratio of gap
between the per capita income of the poor and poverty line income or it is difference between the
poverty line and average income of all households living below the poverty line expressed as percentage
of poverty line.
Z - Mp
PGI = ---------- (2)
Z
PGI=Poverty gap index, Z= Poverty line income in Rs, Mp=Income of poor & Z - MP= Aggregate
poverty gap.
Income Gap Ratio / Poverty Gap Ratio (Ip)
Sen (1976) called it Income Gap Ratio and Clark (1981) named it Poverty Gap Ratio. It is obtained by
dividing the total expenditure of the poor by number of people below the poverty line. It measures the
poor below the poverty line.
Z - Mp
Ip = ----------------- (3)
Z.N
6 Planning commission, Govt. of India 2014 report. 7 World Bank 2014 report
Page 4
www.ijcrt.org © 2018 IJCRT | Volume 6, Issue 1 March 2018 | ISSN: 2320-2882
IJCRT1803165 International Journal of Creative Research Thoughts (IJCRT) www.ijcrt.org 482
Where N is the number of poor and the rest of symbols are defined as above.
Squared Poverty Gap (Ip2): it is the mean of the squared proportionate poverty gaps. It indicates the
severity as well sensitive to inequality among the poor. It measures inequality among the poor. This
measure is a member of Foster- Greer-Thorbecke (FGT) family of poverty measure (Rani Anita 2011).
∑𝐴𝑖
=1 (Z - Mp)/Z] 2 Ip2 = (4)
III. Poverty Estimation Methodology in India
The measurement of poverty is a complex exercise. Dadabhai Naoroji was the first person to discuss the
concept of poverty Naoroji traced the extreme poverty the British colonial rule. After independence there have
been several efforts to develop mechanisms methodologies to construct poverty line and also identify the
number of poor in the country. In 1962, the Planning Commission constituted the working group to define the
poverty line based on minimum calorie requirements suggested by the Indian Council for Medical Research
(ICMR) 2,200 calories for rural and 2,100 calories for urban areas. The monetary value of these calories for a
family of 5 people is fixed at Rs.100 per month or Rs.20 per capita per month in 1960-61 prices for urban areas.
The urban poverty line is adjusted for prices and he working group fixed it for Rs.125 per month, this poverty
line is employed widely at national and state level during early sixties and seventies. In 1979 the planning
commission constituted Task Force committee to estimate the percentage of population below the poverty line
the committee fixed 2400 calorie per capita per day in rural area and 2100 calories calorie per capita per day in
urban area and estimated Rs.49.09 & Rs.56.64 monthly per capita for all India rural and urban areas using 28th
round of NSSO household consumption expenditure data of 1973-74 prices.
The expert group (1984) did not re-defined the estimation methodology of poverty, in state it adopted
the earlier task force committee estimation but it disintegrated the national poverty line into state specific
poverty lines by considering the interstate price differentials measured by Fisher Index, by using data from
CPIAL8 and CPIIL9. To define Rs.89.50 and Rs.115.65 Monthly per capita for rural & urban area and find out
the percentage of population below the poverty line of 45.65% rural area and 40.79% of urban area and total
44.48% population below the poverty line in all India. Subsequently Planning Commission using this same
methodology to find out the poverty line in 1987-88, 1993-94, and 2004-05.
8 Consumer Price Index for Agricultural Labour 9 Consumer Price Index for Industrial Labour
Page 5
www.ijcrt.org © 2018 IJCRT | Volume 6, Issue 1 March 2018 | ISSN: 2320-2882
IJCRT1803165 International Journal of Creative Research Thoughts (IJCRT) www.ijcrt.org 483
The planning commission constituted the expert group under the chairmanship of Tendulkar. The
Tendulkar committee did not construct a poverty line but they adopt earlier expert group of Lakdawala
methodology to estimate Rs.447 & Rs.579 per capita per month of both rural and urban area based on minimum
calorie requirements is 2100 calorie for rural and 1776 calorie for urban. This actual intake very closed to revise
of 1770 calories recommended by Food and Agricultural Organization (FAO) and find out 41.8% of poor in
rural, 25.7% of poor in urban and 37.2% poor in all India to using 61st round of NSSO consumption expenditure
data.
In 2012 the Rangarajan Committee computed the average requirements of calories of 2,155 kcal per
person per day in rural areas and 2,090 kcal per person per day in urban areas. This is significantly lower than
the 2,400 kcal in rural areas and slightly less than 2,100 kcal in urban areas based on proteins and fats
suggested by Indian Council of Medical Research (ICMR) norms differentiated by age, gender and activity
for all India. To find out 30.9% & 26.4% population below the poverty line in rural and urban area and 29.5%
in all India used by the earlier Lakdawala panel and the new poverty line, thus, translates to a monthly per
capita consumption expenditure of Rs 972 in rural areas and Rs 1,407 in urban areas or Rs 32 in rural areas and
Rs 47 in urban areas on a per capita daily basis in 2011-12. The World Bank set a new goal to end extreme
poverty in a generation target is to have no more than 3 percent of the world’s population living on just $1.90 a
day by 2030 and there has been marked progress in reducing poverty over the past decades. In 2013, estimates
to the word bank 10.7 percent of the population lived or below $1.90 a day.
IV. Literature Review
The empirical study on measuring poverty and inequality by using different methodology to define the
official poverty line on social religious groups in rural and urban areas by Arvind Panagariya and Megha
Mukim (2013) brings out that, during 1993-94 and 2009-10 poverty is declining in various social and religious
groups in all the states, secondly growing in growth rate and reduction of larger poverty scheduled caste and
scheduled tribes than the upper cast groups has conical overt the time between 2004-05 and 2009-10 and finally
they find that in case of India there is no strong relationship between poverty and inequality. Further, the study
estimated the official poverty line and male and female using minimum calorie requirements by Ranjan Ray &
Geoffrey Lancaster (2004) estimated official poverty line in India on the basis of cost of minimum calorie
requirements for using the household specific estimated nutrient prices, and specified directly in terms of
calories and study goes beyond previous investigations on the discrepancy between the official poverty
estimates and the calorie based ones by identifying and quantifying in every major region the households who
are poor on the calorie definition but deemed non poor in official Further study also estimated poverty by using
Page 6
www.ijcrt.org © 2018 IJCRT | Volume 6, Issue 1 March 2018 | ISSN: 2320-2882
IJCRT1803165 International Journal of Creative Research Thoughts (IJCRT) www.ijcrt.org 484
food and non-food by Deaton Angus and Tarozzi Alessandro (2000), measures poverty in India on the basis
of prices of food and non-food through Consumer Prices indexes of urban and rural areas separately. They used
43rd, 50th& 55th rounds of NSSO consumption data for two periods 1987-88 and 1993-94 and also estimated the
rate of inflation over the six years for 17 largest states. After couple of years, estimated poverty line and
calculated cost of living indices by Himanshu (2010), measures the all India poverty line based on Planning
Commission food10 and non-food expenditure, later estimate state-wise poverty line by used Fisher Index of
state prices and using consumer price index11 and set up new poverty line for consumption expenditure survey
of 2004-05 and also based on Mixed Recall Period using NSSO data and used. The study finds that estimating
of incidence of rural poverty shows a head count ratio of 41.8% for 2004-05 as against the official estimate of
28.3%. Deaton Angus and Dreze Jean (2002), Estimates poverty has declined in the 1990s preceded more or
less in line with earlier trends based on National Sample Survey data and most widely-used poverty indicator is
the headcount ratio. The study bring out that First, enduring poverty decline in nineties in terms of the
headcount ratio, second, head count ratio, third, growth patterns by major regional imbalances fourth, of
regional disparities pattern of increasing economic inequality in the nineties. Further, Meenakshi V J and Ray
Ranjan (1999), the study Comprehensive set of poverty estimates for SC, ST and female-headed households at
the state level and for rural and urban areas separately. Findings indicate that poverty rates are uniformly higher
for the SC and ST communities, irrespective of the deprivation. Later, the study to measured by poverty and
inequality in cast based discrimination by Comprehensive analysis of division wise with across social group by
Arora Akash & Singh P S (2015) regional as well as disaggregated of district wise pattern of poverty
prevailing among social groups of oh rural and urban areas in Uttar Pradesh by using unit level records of the
61st (2004-05) and 68th (2011-12) rounds of NSSO Consumption Expenditure Survey. It identifies the critical
regions in UP, there poverty among social groups and particularly in the central, southern and eastern region is
unfairly distributed. The study also attempt to gauge the causes for the unequal distributed of poverty among
social and religious groups in the state and estimates of logistic regression for identify the cause of poverty
among social and religious groups in rural and urban area of Uttar Pradesh.
V. Poverty in Karnataka: An Empirical Analysis
History of Karnataka shows that North Karnataka was more developed politically, economically and
culturally. The regional disparities in state have always been studied by isolating the state by North Karnataka
10Food expenditure on Recommended Dietary Allowances (RDA) of 2400 calorie in rural and 2100 calorie in urban areas on state
level. 11Consumer price index for agriculture labour (CPIAL) in rural areas and consumer price index for industrial workers (CPIIW) in
urban areas
Page 7
www.ijcrt.org © 2018 IJCRT | Volume 6, Issue 1 March 2018 | ISSN: 2320-2882
IJCRT1803165 International Journal of Creative Research Thoughts (IJCRT) www.ijcrt.org 485
and South Karnataka. In North again divided by two parts namely, Hyderabad Karnataka and Bombay
Karnataka regions. The south Karnataka has relatively achieved a higher level of development compared to the
North Karnataka and particularly the Hyderabad Karnataka region, This region constrains six most backward
districts i.e.,. Bidar, Gulbarga, Bellary, Raichur, Yadgiri and Koppal in Karnataka that are below the state and
national average in majority of socio economic indicators performed very poorly in majority of socio economic
parameters. Intensive efforts are required to bridge the development gap and focus on education, health, and
nutrition and skill development, along with development of farm and non-farm activities. The region will get by
amendment to the constitution of India, Article 371(J). Study also cover four administrative divisions are
Kalaburagi division, is also known as Hyderabad-Karnataka (HK) region, Bangalore division, Mysuru division
and Belagavi division. Under this for division have 49 sub-divisions, 30 districts, 177 taluks for administrative
purpose as per 2011 census. The Hyderabad-Karnataka (HK) region is one of the most neglected province, both
by the state and the centre in developmental aspect. In fact, today the issue of inter-regional variations in
development is being discussed much more seriously in Karnataka. Specific mention is being made about the
north south disparity within the state. Therefore, a detailed analysis of poverty, social inequality and regional
Karnataka Government has taken several steps to reduce the regional disparities like setting up
Hyderabad Karnataka Area Development Board, Border Area Development Programme, Bayaluseeme
Development Board and Malanad Area Development Board and so on. Government had also appointed a high
power committee for redressed of regional imbalances under the chairmanship of Prof. D. M. Nanjundappa
during 2002-03. The committee found that Hyderabad Karnataka is most backward region and the north
Karnataka was similar backward region. However there is still a general concern about relative backwardness
of some districts belonging to the northern part of the state. The committee suggested various programmes for
decline of regional inequalities. Karnataka government has started implementing the committee’s
recommendations since 2007-0812.
The main objective of this current study is to provide a profile of social group poverty and social
disparity. So the study is intended to examine the level of poverty by dividing the households into those
belonging to scheduled castes (SC), scheduled tribes (ST) and OBCs in the region. A decomposition analysis is
planned in order to comprehensively examine the level of poverty in HK region. To design effective policies
and strategies to reduce poverty, it is vital to understand the characteristics of a given region. It can shed light
on whether poverty is increasing or decreasing and on whether economic growth is benefiting the poor. Poverty
profiles of regions can help governments identify the poor by region, by different social groups, level of
12 H Shiddalingaswami & V K Raghavendra, 2010
Page 8
www.ijcrt.org © 2018 IJCRT | Volume 6, Issue 1 March 2018 | ISSN: 2320-2882
IJCRT1803165 International Journal of Creative Research Thoughts (IJCRT) www.ijcrt.org 486
education, gender, or form of employment. Inequality can have many dimensions. Economists are concerned
specifically with the monetarily-measurable dimension related to individual or household income and
consumption. Methodologically, this is just one perspective and inequality can be linked to inequality in skills,
education, opportunities, health and assets. The current research will, in reviewing the literature, give attention
to the relationship between poverty and income inequality and the non income inequality dimensions. There
exist several studies on assessments and determinants of poverty both a macro and micro level-Interstate and
Intrastate studies focus on spatial divergence in poverty. However the empirical analyses on poverty focusing at
district level on socio-religious groups are scanty. The study in respect to Karnataka since this gap by analyzing
the status of district wise and division wise poverty across socio-religious groups.
The present study uses unit level data of the 61st (2004-05) and 68th (2011-12) rounds of NSSO’s
Consumption Expenditure Survey (CES) to define poverty in terms of Head Count Ratio (HCR) in Rural &
Urban areas. The HCR measures poverty as a proportion of households living below the poverty line (BPL).
Define poverty ratio by using household consumption expenditure which is Uniform Reference Period (URP13)
consumption based into Mixed Reference Period (MRP14) consumption by Lakdawala Methodology and later
the same methodology using Tendulkar Committee in 2005. The planning commission, on recommendation of
Tendulkar Committee, decided to adopt consumption expenditure based on an MRP.
The study examines district wise and division wise status of poverty across socio-religious groups in
Karnataka by making use of 61st and 68th round of NSSO Household Consumption Expenditure Data. The study
also links the incidence of poverty to education at district level and division level across socio-religious groups.
Section I to understand the official poverty estimation methodologies are set up by planning commission Govt.
of India. Sectional II, estimates incidence of mean poverty by administrative division wise (there is a four
division like, 1.Kalaburagi Division15 is also known as (Hyderabad-Karnataka (HK) Region), 2.Belagavi
Division16, 3.Bengaluru Division17 and 4.Mysuru division18) with across social and religious groups both rural
and urban areas of Karnataka. Higher the poverty ration in across social and religion groups located in HK
region of both rural and urban area. Section III, Level of education per household head and Type of ration card
have secured below the poverty line of across social and religious groups in all division of Karnataka. Finally
the Section IV, conclusion by summarizing the main findings of the result and policy implications.
13 URP = consumption data are collected from the households using 30 day recall period for all the items. 14 MRP = consumption data for five non-food items viz., clothing, footwear, durable goods, education, and institutional medical
expenses are collected using 365-day recall period and 30-day recall period for the remaining items. 15 Kalaburagi Division consist of Bidar, Kalaburagi, Raichur, Ballari and Koppal 16 Belagavi Division consist of Belagavi, Bagalkot, Dharwad, Gadag, Haveri, Uttar Kannada and Vijayapura 17 Bengaluru Division consist of Bengaluru rural, Bengaluru urban, Chitradurga, Davangere, Kolar, Shivamogga and Tumkur 18 Mysuru division consist of Chamrajnagara, Chikkamagaluru, Dakshin Kannada, Hassan, Kodagu, Mandya, Mysuru and Udupi
Page 9
www.ijcrt.org © 2018 IJCRT | Volume 6, Issue 1 March 2018 | ISSN: 2320-2882
IJCRT1803165 International Journal of Creative Research Thoughts (IJCRT) www.ijcrt.org 487
VI. Empirical Analysis
Karnataka a state in southern India was formed on November 1st, 1956 name of Mysore state on
November 1st, 1973 renamed as Karnataka. The state is now the largest state in India by fifth largest state of
gross domestic product and the state divided in four administrative divisions are 1. Kalaburagi Division is also
known as Hyderabad-Karnataka (HK) region 2.Belagavi Division 3.Bengaluru Division and 4.Mysuru
Division. Under this for division have 49 sub-divisions, 30 districts, 177 taluks for administrative purpose as
per 2011 census. HK region it was based partly with intention of development the most backward region of the
state which is the name gave to area which was the part of erstwhile Hyderabad province before the formation
of new state. The region namely, Bidar, Kalaburagi, Raichur, Yadgir, Ballari and Koppal Intensive efforts are
required to bridge the development gap and focus on education, health, and nutrition and skill development,
along with development of farm and non-farm activities. The region will get by amendment to the constitution
of India, Article 371(J).
The district level poverty along with division wise has been illustrated by rural and urban areas being mapped separately
(refer figures 1, 2, 3 and 4).
Figure: 01 Figure: 02
Source: Author Computed from estimated results of Poverty in Rural & Urban areas of Karnataka, using 61st round of CES, 2004-05
Page 10
www.ijcrt.org © 2018 IJCRT | Volume 6, Issue 1 March 2018 | ISSN: 2320-2882
IJCRT1803165 International Journal of Creative Research Thoughts (IJCRT) www.ijcrt.org 488
Figure: 03 Figure: 04
Source: Author Computed from estimated results of Poverty in Rural & Urban areas of Karnataka, using 68th round of CES, 2011-12
Table No.01 Incidence of Poverty by NSS Rounds & Sector in Karnataka
Round Rural Urban Total
61 37.50 25.88 33.92
68 24.53 15.28 21.18
Total 30.83 19.79 27.11
Source: Authors estimate based on 61st and 68th round of NSS data.
Poverty can be a useful policy tool for focusing resources and development efforts in poor areas.
The study attempt to identify where the incidence of poverty in rural and urban area was improperly distributed
in Karnataka during 2004-05 (61st NSS round) and 2011-12 (68th NSS round) rural poverty declining by
12.97% and urban poverty was 10.06% during 2004-05 to 2011-12. In 61st round the total poverty is 33.92%
which is come down by 21.18% in 68th round so around 12.74% declining in the study period.
Table No.02
Incidence of Poverty District wise Scenario in Karnataka
Districts Rural Urban Total
61st Round 68th Round 61st Round 68th Round 61st Round 68th Round
Belgaum 36.3 27.5 38.1 32.3 36.6 28.8
Bagalkot 42.8 32.1 66 45 47 35.8
Page 11
www.ijcrt.org © 2018 IJCRT | Volume 6, Issue 1 March 2018 | ISSN: 2320-2882
IJCRT1803165 International Journal of Creative Research Thoughts (IJCRT) www.ijcrt.org 489
Bijapur 30.6 21.4 47.5 28.5 35.4 23.1
Gulbarga 65.1 38.9 49.4 32 61.2 37.2
Bidar 54.7 32.5 29.8 45.9 51.3 35.1
Raichur 63.9 37.6 80.7 38.2 68.6 37.7
Koppal 26.2 42 56.6 34.6 29.4 40.7
Gadag 49.4 25.6 47.4 15 48.7 21.8
Dharwad 13.7 57.3 32.1 15.5 23.8 34
Uttar Kannada 59.2 19.3 63.5 20.1 60.5 19.6
Haveri 72.5 31.3 75.3 52.2 73 33.7
Ballari 60.3 33.1 64.6 53 61.3 40.8
Chitradurga 56.3 48.3 55.1 40.4 56.1 46.7
Davangere 70.8 23 62.4 23.8 69.1 23.3
Shivamogga 22.6 32.5 13.3 22.3 19.1 29.3
Udupi 4.4 22.7 42.2 21.4 5.8 22.4
Chikkamaglur 11.8 10.4 27.6 24.6 14.1 14.7
Tumkur 30.6 14.4 3.4 5.9 25.8 13
Kolar 30.8 4.7 20.1 2.5 28.4 4.2
Bangalore Urban 15.5 0 2.6 1.7 4.5 1.5
Bangalore Rural 34.7 15.2 22.9 2.2 33 13
Mandya 29.6 18.9 50.5 4.1 31.7 16.4
Hassana 20.2 11.3 37.5 13.9 22.9 11.6
Dakshin Kannada 15.3 1.5 8.9 1.9 13.7 1.6
Kodagu 11.5 1.2 5.6 2.8 11 1.5
Mysuru 20.8 20.7 18.6 7 20 15.5
Chamarajagara 22.2 1.3 37.1 4.1 24.4 1.6
Total 37.5 24.5 25.9 15.3 33.9 21.1
Source: Authors estimate based on 61st and 68th round of NSS data.
Incidence of poverty across district in Karnataka there are not significantly ratio in rural and urban areas of both
rounds. Below the table no 02, in 61st (2004-05) round there higher poverty ratio in Davangere of 69.1%, is
followed by Raichur 68.6%, Ballari 61.3%, Gulbarga 61.2%, and Uttar Kannada 60.5%. In 68th (2011-12)
round higher the poverty ration in Chitradurga district was 46.7% is followed by Ballari 40.8% and Koppal was
40.7% and the lower the poverty ration in Bengaluru urban of 1.5% is followed by Kodagu 1.5%, Dakshin
Kannada 1.6% and Chamarajnagara 1.6%.
Table No: 03
Incidence of Poverty & MPCE by Social Groups in Karnataka
Sector Round Round ST SC OBC Others
Rural
61st Round Poverty 50.53 57.37 35.87 23.72
MPCE (452.73) (454.68) (538.73) (626.06)
68th Round Poverty 30.81 37.06 20.75 21.62
MPCE (1191.89) (1281.80) (1452.47) (1409.14)
Urban 61st Round
Poverty 55.7 41.22 32.14 14.31
MPCE (694.55) (740.65) (923.76) (1463.37)
68th Round Poverty 33.69 24.96 15.09 8.77
Page 12
www.ijcrt.org © 2018 IJCRT | Volume 6, Issue 1 March 2018 | ISSN: 2320-2882
IJCRT1803165 International Journal of Creative Research Thoughts (IJCRT) www.ijcrt.org 490
MPCE (1867.36) (1931.20) (2441.57) (4214.18)
Source: Authors estimate based on 61st and 68th round of NSS data.
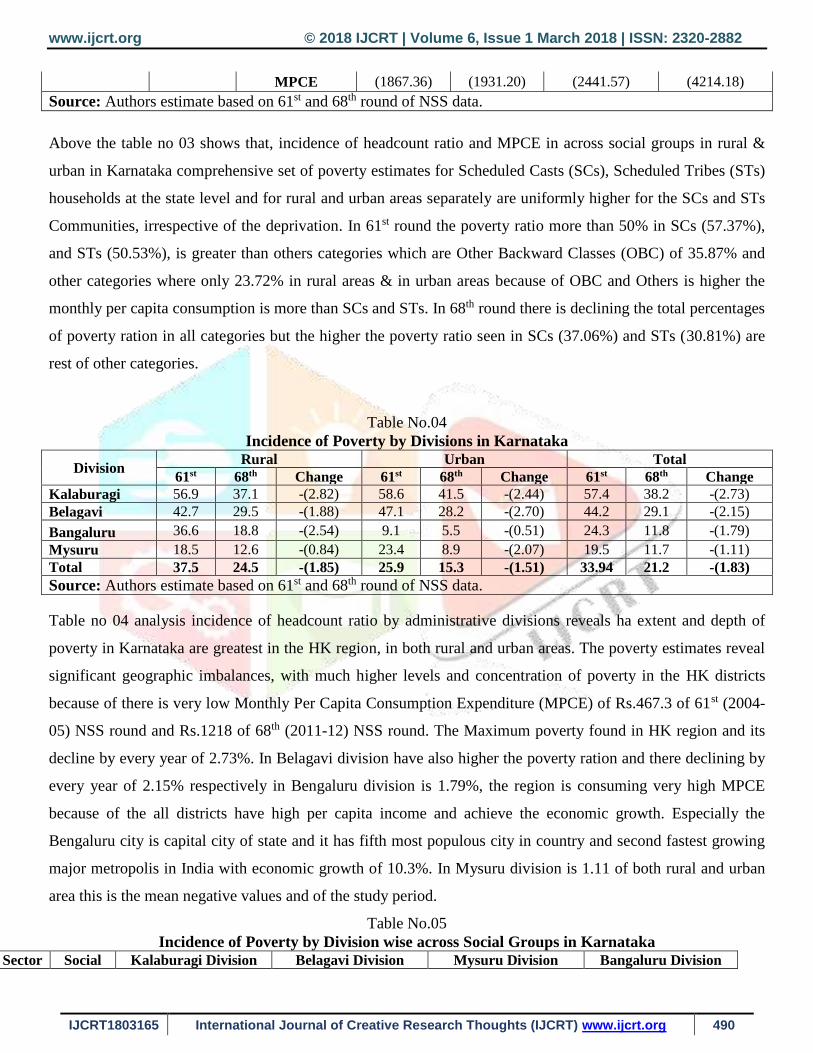
Above the table no 03 shows that, incidence of headcount ratio and MPCE in across social groups in rural &
urban in Karnataka comprehensive set of poverty estimates for Scheduled Casts (SCs), Scheduled Tribes (STs)
households at the state level and for rural and urban areas separately are uniformly higher for the SCs and STs
Communities, irrespective of the deprivation. In 61st round the poverty ratio more than 50% in SCs (57.37%),
and STs (50.53%), is greater than others categories which are Other Backward Classes (OBC) of 35.87% and
other categories where only 23.72% in rural areas & in urban areas because of OBC and Others is higher the
monthly per capita consumption is more than SCs and STs. In 68th round there is declining the total percentages
of poverty ration in all categories but the higher the poverty ratio seen in SCs (37.06%) and STs (30.81%) are
rest of other categories.
Table No.04
Incidence of Poverty by Divisions in Karnataka
Division Rural Urban Total
61st 68th Change 61st 68th Change 61st 68th Change
Kalaburagi 56.9 37.1 -(2.82) 58.6 41.5 -(2.44) 57.4 38.2 -(2.73)
Belagavi 42.7 29.5 -(1.88) 47.1 28.2 -(2.70) 44.2 29.1 -(2.15)
Bangaluru 36.6 18.8 -(2.54) 9.1 5.5 -(0.51) 24.3 11.8 -(1.79)
Mysuru 18.5 12.6 -(0.84) 23.4 8.9 -(2.07) 19.5 11.7 -(1.11)
Total 37.5 24.5 -(1.85) 25.9 15.3 -(1.51) 33.94 21.2 -(1.83)
Source: Authors estimate based on 61st and 68th round of NSS data.
Table no 04 analysis incidence of headcount ratio by administrative divisions reveals ha extent and depth of
poverty in Karnataka are greatest in the HK region, in both rural and urban areas. The poverty estimates reveal
significant geographic imbalances, with much higher levels and concentration of poverty in the HK districts
because of there is very low Monthly Per Capita Consumption Expenditure (MPCE) of Rs.467.3 of 61st (2004-
05) NSS round and Rs.1218 of 68th (2011-12) NSS round. The Maximum poverty found in HK region and its
decline by every year of 2.73%. In Belagavi division have also higher the poverty ration and there declining by
every year of 2.15% respectively in Bengaluru division is 1.79%, the region is consuming very high MPCE
because of the all districts have high per capita income and achieve the economic growth. Especially the
Bengaluru city is capital city of state and it has fifth most populous city in country and second fastest growing
major metropolis in India with economic growth of 10.3%. In Mysuru division is 1.11 of both rural and urban
area this is the mean negative values and of the study period.
Table No.05
Incidence of Poverty by Division wise across Social Groups in Karnataka Sector Social Kalaburagi Division Belagavi Division Mysuru Division Bangaluru Division
Page 13
www.ijcrt.org © 2018 IJCRT | Volume 6, Issue 1 March 2018 | ISSN: 2320-2882
IJCRT1803165 International Journal of Creative Research Thoughts (IJCRT) www.ijcrt.org 491
Groups 61 68 Change 61 68 Change 61 68 Change 61 68 Change
Rural
ST 73.73 28.2 -(6.5) 53.86 34.95 -(2.70) 14.7 25.82 (1.58) 46.22 34.49 -(1.67)
SC 66.94 57.55 -(1.34) 65.06 41.47 -(3.37) 51.8 18.04 -(4.82) 48.91 29.9 -(2.71)
OBC 62.32 35.72 -(3.8) 49.32 25.86 -(3.35) 18.75 13.4 -(0.76) 32.25 11.43 -(2.97)
Others 37.41 28.68 -(1.24) 24.02 27.62 (0.51) 5.01 0 -(0.71) 27.57 21.22 -(0.90)
TOTAL 57.00 37.09 -(2.84) 43.18 29.52 -(1.95) 18.5 12.61 -(0.84) 36.56 18.83 -(2.53)
Urban
ST 89.1 55.46 -(4.80) 80.25 46.48 -(4.82) 45.19 0 -(6.45) 22.12 4.97 -(24.5)
SC 66.97 54.00 -(1.85) 46.97 34.9 -(1.72) 38.27 23.47 -(2.11) 27.14 16.76 -(1.48)
OBC 68.39 40.21 -(4.02) 62.65 30.33 -(4.61) 28.84 9.55 -(2.75) 9.3 4.5 -(0.68)
Others 42.73 31.02 -(1.67) 29.15 20.36 -(1.25) 6.04 3.37 -(0.38) 4.65 0.83 -(0.54)
TOTAL 58.64 41.5 -(2.44) 47.05 28.19 -(2.69) 23.39 8.9 -(2.07) 9.1 5.49 -(0.51)
Source: Authors estimate based on 61st and 68th round of NSS data.
Above table 05 brings out that, during 2004-05 and 2011-12 poverty is declining in various social and religious
groups in all the states, growing in growth rate and reduction of larger poverty scheduled cast and scheduled
tribes than the upper cast groups has conical overt the time in all four region. Higher the poverty ration in HK
region across social groups of 57% poverty in rural area and 58.64% of poverty in urban area followed by rest
of divisions. In HK region where STs Poverty is very high of 73.73% (2004-05), is fastest declining by 28.20%
in (2011-12) it was around 6.5 points reduced by every year of study period and respectively reduced by SCs
1.34, OBC 3.8 and Others 1.24 in rural area and also higher the poverty ratio seen in urban areas. But the
highest points of poverty ratio are declining by every year in Belagavi division rural area both 61st and 68th NSS
round, followed by Bengaluru and Mysuru divisions of the study period. The state has taken several steps to
reduce by social, gender and regional disparities.
Table No.06
Incidence of Poverty by Division wise & Religion Groups in Karnataka
Sector Religion
Groups
Kalaburagi Division Belagavi Division Mysuru Division Bangaluru Division
61 68 Change 61 68 Change 61 68 Change 61 68 Change
Rural
Hindu 56.37 36.34 -(2.86) 43.18 29.82 -(1.91) 19.76 13.27 -(0.93) 37.51 18.43 -(2.73)
Muslim 62.65 41.5 -(3.02) 46.5 22.59 -(3.42) 8.07 8.69 (0.09) 25.37 25.92 (0.08)
TOTAL 56.94 37.1 -(2.83) 43.43 29.12 -(2.04) 18.92 13.1 -(0.83) 36.75 18.84 -(2.56)
Urban
Hindu 53.85 38.25 -(2.23) 40.39 25.24 -(2.16) 21.23 7.96 -(1.90) 9.14 4.48 -(0.67)
Muslim 68.3 53.95 -(2.05) 69.79 35.6 -(4.88) 34.17 14.91 -(2.75) 11.37 7.84 -(0.50)
TOTAL 58.47 41.81 -(2.38) 47.54 28.39 -(2.74) 23.69 9.29 -(2.06) 9.56 5.01 -(0.65)
Source: Authors estimate based on 61st and 68th round of NSS data.
Above the table 06 exhibits that, incidence of poverty across religious groups where Muslims are found to be
comparatively poorer in all the region of Karnataka, more than 60% of Muslim poor against Hindu religion in
HK region and Belagavi division because of high percentage of Muslim population approximately 12.91% of
Karnataka and it can similarly found in all districts but Muslims have a stronger presence in Gulbarga, Bidar,
Raichur, Bijapur, Ballari, Belagavi and Dharwad districts these districts are comes under HK region and
Page 14
www.ijcrt.org © 2018 IJCRT | Volume 6, Issue 1 March 2018 | ISSN: 2320-2882
IJCRT1803165 International Journal of Creative Research Thoughts (IJCRT) www.ijcrt.org 492
Belagavi division but the Hindu populations are equally distributed in all the divisions. The higher MPCE is in
Bengaluru division of Rs.1384 in 61st round (2004-05) and Rs.3690 in 68th round (2011) of rural area followed
by other division. In rural area higher the MPCE in Mysuru division of Rs.638.6 in 61st round (2004-05) and
Rs.1696 in 68th round (2011) followed by other divisions. But the lower MPCE is in HK region of both rural
and urban areas of both NSS round.
The division wise poverty along with district level has been illustrated by rural and urban areas being tables and line
graph separately (refer tables 7, 8, 9 and 10 & line graph refer figures 5, 6, 7 & 8).
Table No: 07- Poverty in H-K Region
Districts 61st Round 68th Round
Bidar 51.74 35.11
Gulbarga 61.18 37.24
Raichur 68.61 37.73
Koppal 29.42 40.71
Ballari 61.34 40.81
Total 57.36 38.20
Figure: 05
Table No: 08 - Poverty in Belagavi Division
Districts 61st Round 68th Round
Belgaum 36.63 28.80
Bagalkot 47.00 35.76
Bijapur 35.37 23.12
Gadag 52.51 21.78
Dharwad 23.76 34.03
Uttar Kannada 60.48 19.55
Haveri 72.96 33.71
Total 44.22 29.14
Figure: 06
51.7461.18
68.61
29.42
61.34 57.36
35.11 37.24 37.73 40.71 40.81 38.20
0.00
20.00
40.00
60.00
80.00
Kalaburagi Division/H-K Region
61st Round 68th Round
36.6347.00
35.37
52.51
23.76
60.48
72.96
44.22
28.8035.76
23.12 21.78
34.03
19.55
33.71 29.14
0.00
20.00
40.00
60.00
80.00Belagavi Division
61st Round 68th Round
Page 15
www.ijcrt.org © 2018 IJCRT | Volume 6, Issue 1 March 2018 | ISSN: 2320-2882
IJCRT1803165 International Journal of Creative Research Thoughts (IJCRT) www.ijcrt.org 493
Table No: 9 - Poverty in Bengaluru
Division
Districts 61st
Round
68th
Round
Bangalore Urban 4.53 1.48
Bangalore Rural 33.02 13.02
Chitradurga 56.12 46.74
Davangere 69.05 23.30
Shivamogga 19.12 29.33
Tumkur 25.85 13.04
Kolar 28.42 4.17
Total 24.32 11.76
Figure: 07
Table No: 10 - Poverty in Mysuru
Division
Districts 61st
Round
68th
Round
Chamarajagara 24.43 1.64
Chikkamaglur 14.08 14.69
Dakshin Kannada 13.66 1.63
Hassan 22.93 11.59
Kodagu 10.99 1.51
Mandya 31.68 16.44
Mysuru 19.96 15.47
Udupi 5.77 22.44
Total 19.47 11.69
Figure: 08
Table No: 11
Poverty and Level of Education across Socio-Religions groups in Karnataka
Education
Level
Social Groups Religion Groups
ST SC OBC Others Hindu Muslim
61st 68th 61st 68th 61st 68th 61st 68th 61st 68th 61st 68th
Rural Sector
NL 57.04 38.55 62.78 51.28 47.49 27.9 30.24 30.55 48.82 35.03 49.63 32.55
LWFS 32.82 (**) 50.59 (**) 25.56 (**) 30.95 13.94 33.25 2.96 19.97 (**)
BP 38.54 23.77 43.62 37.59 15.07 22.81 15.78 27.17 20.32 19.57 3.64 54.02
P-M (**) 18.39 35.25 10.54 15.56 13.04 8.92 18.37 16.07 14.87 6.45 5.76
S-HS (**) 27.23 19.47 20.24 21.37 16.69 4.73 4.52 12.94 15.27 (**) 6.18
Urban Sector
NL 76.91 59.15 58.6 43.22 51.99 34.05 43.38 42.64 50.55 38.44 57.77 46.97
LWFS 60.5 (**) 50.61 (**) 50.94 (**) 31.05 (**) 36.86 40.44 59.25 (**)
BP 39.79 31.6 40.06 55.59 16.15 30.33 10.2 19.08 17.4 30.21 23.34 29.71
P-M 17.13 22.58 22.75 20.92 19.68 15.46 7.96 15.71 14.41 14.53 16.48 23.32
4.53
33.02
56.12
69.05
19.1225.85 28.4224.32
1.48
13.02
46.74
23.3029.33
13.044.17
11.76
0.0010.0020.0030.0040.0050.0060.0070.0080.00
Bengaluru Division
61st Round 68th Round
24.43
14.0813.66
22.93
10.99
31.68
19.96
5.77
19.47
1.64
14.69
1.63
11.59
1.51
16.4415.47
22.44
11.69
0.00
10.00
20.00
30.00
40.00Mysuru Division
61st Round 68th Round
Page 16
www.ijcrt.org © 2018 IJCRT | Volume 6, Issue 1 March 2018 | ISSN: 2320-2882
IJCRT1803165 International Journal of Creative Research Thoughts (IJCRT) www.ijcrt.org 494
S-HS (**) 4.18 (**) 8.05 4.47 8.04 0.54 6.08 1.59 6.65 (**) 13.32
Source: Authors estimate based on 61st and 68th round of NSS data.
Note: NL= Not Literate, LWFS= Literate Without Formal Schooling, BP: Below Primary, P-M: Primary-Middle,
S-Hs: Secondary-Higher Secondary.
(* *)= are excluded because of small sample size.
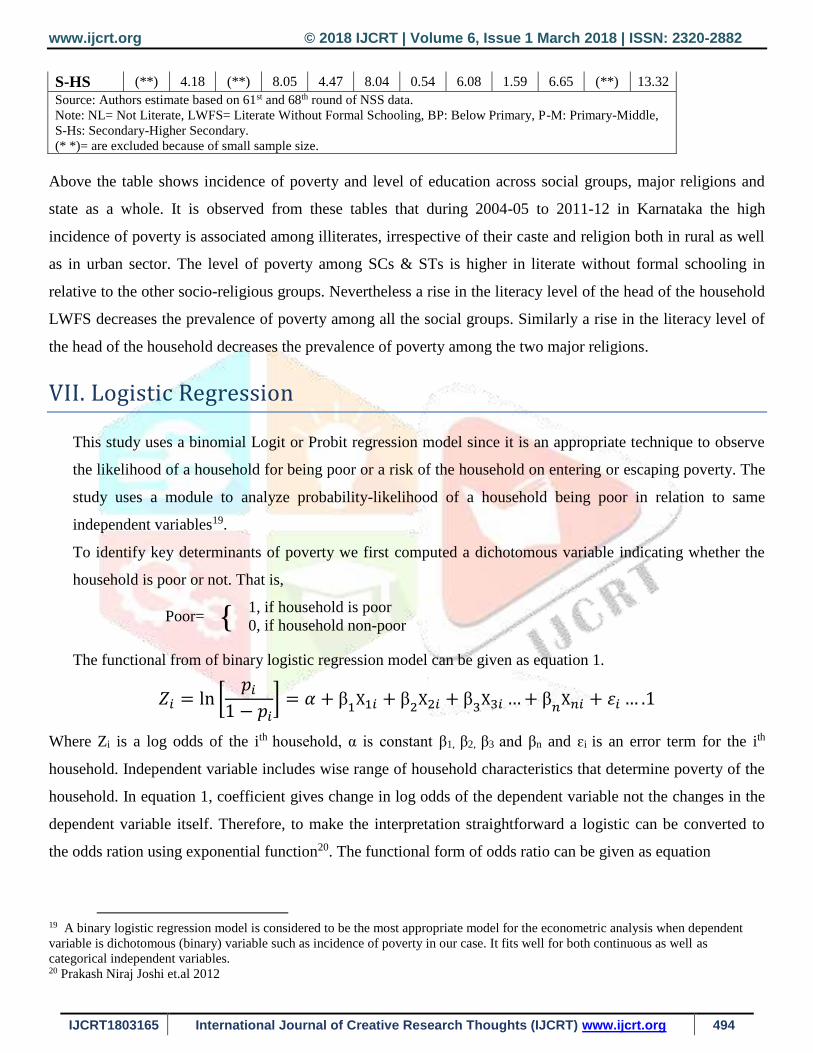
Above the table shows incidence of poverty and level of education across social groups, major religions and
state as a whole. It is observed from these tables that during 2004-05 to 2011-12 in Karnataka the high
incidence of poverty is associated among illiterates, irrespective of their caste and religion both in rural as well
as in urban sector. The level of poverty among SCs & STs is higher in literate without formal schooling in
relative to the other socio-religious groups. Nevertheless a rise in the literacy level of the head of the household
LWFS decreases the prevalence of poverty among all the social groups. Similarly a rise in the literacy level of
the head of the household decreases the prevalence of poverty among the two major religions.
VII. Logistic Regression
This study uses a binomial Logit or Probit regression model since it is an appropriate technique to observe
the likelihood of a household for being poor or a risk of the household on entering or escaping poverty. The
study uses a module to analyze probability-likelihood of a household being poor in relation to same
independent variables19.
To identify key determinants of poverty we first computed a dichotomous variable indicating whether the
household is poor or not. That is,
Poor= { 1, if household is poor
0, if household non-poor
The functional from of binary logistic regression model can be given as equation 1.
𝑍𝑖 = ln [𝑝𝑖
1 − 𝑝𝑖] = 𝛼 + β
1X1𝑖 + β
2X2𝑖 + β
3X3𝑖 …+ β
𝑛X𝑛𝑖 + 𝜀𝑖 … .1
Where Zi is a log odds of the ith household, α is constant β1, β2, β3 and βn and ɛi is an error term for the ith
household. Independent variable includes wise range of household characteristics that determine poverty of the
household. In equation 1, coefficient gives change in log odds of the dependent variable not the changes in the
dependent variable itself. Therefore, to make the interpretation straightforward a logistic can be converted to
the odds ration using exponential function20. The functional form of odds ratio can be given as equation
19 A binary logistic regression model is considered to be the most appropriate model for the econometric analysis when dependent
variable is dichotomous (binary) variable such as incidence of poverty in our case. It fits well for both continuous as well as
categorical independent variables. 20 Prakash Niraj Joshi et.al 2012
Page 17
www.ijcrt.org © 2018 IJCRT | Volume 6, Issue 1 March 2018 | ISSN: 2320-2882
IJCRT1803165 International Journal of Creative Research Thoughts (IJCRT) www.ijcrt.org 495
𝑂𝑑𝑑𝑠𝑟𝑎𝑡𝑖𝑜 = [𝑝𝑖
1 − 𝑝𝑖] = 𝑒𝛼+β1X1𝑖+β2X2𝑖+β3X3𝑖…+β𝑛X𝑛𝑖+𝜀𝑖….2
Here, odds ratio is simply the ratio of the probability that the household will be poor to the probability that the
household will be non-poor. In case of binary independent variables, exponential of the respective coefficient
gives the proportion of change odds for shift in the given independent variable. However, if the independent
variable is continuous exponential of coefficient is associated with the effect of per unit change in the given
independent variable to odds ratio. In both type of variables sign of coefficient reveals the direction of change.
The Particulars of the Regression are As Follows.
Dependent variable - A new dummy variable called poor is created, which takes the value' l' if the
individual is poor and the value '0' if he or she is non poor.
Independent variables – Sector, Round, Social Groups, Administrative Division, Education Level,
Household Occupation, Land Ownership.
The final model that was fit to the data was given by
Logit (Zi) = α+ β1X1+ β2X2+ β3X3+ β4X4+ β5X5+ β6X6+ β7X7
Where X1 is Sector, X2 is Round, X3 is Social Groups, X4 is Administrative Division, X5 is Education Level, X6
is Household Occupation and X7 is Land Ownership.
Table No: 12
Logistic Regression 61st & 68th Round of Karnataka
Poor Odds Ratio Std.Err. Z P>|Z|
Sector (Rural Reference)
Urban 1.531125 0.121194 5.38 0***
Round (61st Reference)
68th Round 0.571884 0.042768 -7.47 0***
Social Group (Others Reference)
ST 2.664859 0.359506 7.27 0***
SC 2.853829 0.279291 10.72 0***
OBC 1.706293 0.135777 6.71 0***
Administrative Division (Mysuru Reference)
Kalaburagi 4.203439 0.443021 13.62 0***
Belagavi 3.204364 0.321045 11.62 0***
Bengaluru 1.209348 0.12108 1.9 0.058
Household Size (< 3 Member)
4 to 7 Member 3.134 0.271053 13.21 0***
> 8 Member 7.425937 0.898905 16.56 0***
Education Level (Not Literate Reference)
LWFS 0.259115 0.165728 -2.11 0.035
Page 18
www.ijcrt.org © 2018 IJCRT | Volume 6, Issue 1 March 2018 | ISSN: 2320-2882
IJCRT1803165 International Journal of Creative Research Thoughts (IJCRT) www.ijcrt.org 496
Below Primary 0.966255 0.144214 -0.23 0.818
Primary-Middle 0.499544 0.041218 -8.41 0***
Sec-Higher Sec 0.218327 0.019154 -17.35 0***
Graduate & Above 0.046611 0.014792 -9.66 0***
Occupation (Self-Employed-non-Agricultural Reference)
Self Employed in Agricultural 1.096708 0.092377 1.1 0.273
Agricultural labour 1.42449 0.142049 3.55 0***
casual labour- 0.951307 0.112758 -0.42 0.674
Other Labor 0.71033 0.169447 -1.43 0.152
Other 1.114892 0.15614 0.78 0.437
Land Ownership (0.001-0.004 Reference)
0.005-0.400 0.671357 0.054892 -4.87 0***
0.410-1.000 0.568917 0.072987 -4.4 0***
1.001-2.000 0.453555 0.063039 -5.69 0***
2.001-4.000 0.347438 0.05248 -7 0***
>4.001 0.207238 0.036936 -8.83 0***
_cons 0.096951 0.015322 -14.77 0***
Log likelihood=-3099.1651 Prob>chi2=0
LR chi2(25)=1843.37 Pseudo R2=0.2292
Source: Author Estimated Based on 61st & 68th NSS data ***, **, * significant at 1%, 5% and 10% degree of precision respectively
Above the table exhibits that, the probability of becoming poor person belonging to female poor households
headed is an almost equal probability of falling under poverty to (Male) reference group. Among the social
group ST and SC category are almost double poor as compare to people belonging to reference group but the
OBC households are one times higher the probabilities of falling under poverty of the study period. Study also
reveals among the administrative division there Kalaburagi division has four times and Belagavi division has
three times probability of falling under poverty is statistically significance at 1 percent but Bengaluru division is
almost same as reference group. The household size also has strong positive relationship with poverty status as
well the household occupation.
Page 19
www.ijcrt.org © 2018 IJCRT | Volume 6, Issue 1 March 2018 | ISSN: 2320-2882
IJCRT1803165 International Journal of Creative Research Thoughts (IJCRT) www.ijcrt.org 497
Conclusion
Poverty reduction is a key policy debate in recent literature on the social issues. The elaboration of policies
for poverty relief requires a thorough knowledge of this phenomenon. Therefore, there is a need for research
aimed at the identification of determinants of poverty and assessing the impact of policies and welfare
programs on the poor21. Poverty of India is of great importance today even thought so many measures have
been taken by various Governments and International Organization to alleviate the global poverty. Since the
Government of Karnataka also has initiated various poverty alleviation programmers in both rural and urban
areas have achieved to eradicate extreme poverty in the state. The study examines district wise and division
wise status of poverty across socio-religious groups in Karnataka by making use of 61st and 68th round of
NSSO Household Consumption Expenditure Data. There is significance between poverty across socio-
religious groups in both round of rural and urban areas in Karnataka and poverty to education at district
level and division level across socio-religious groups. To find out expose that while poverty in the state
reduced by total 12.74%, points between 2004-05 and 2011-12 in Karnataka. Remnants the incidence of
poverty in social group wise reduced by 19.67% in Scheduled Tries, 20.66% in Scheduled Caste, 15.9% in
OBC & 4.5% and the estimates poverty in religion wise reduced by 13.45% in Hindu and 11.46% in
Muslims religion. Higher the poverty ration in HK region across social groups of 57% poverty in rural area
and 58.64% of poverty in urban area followed by rest of divisions. In HK region where STs Poverty is very
high of 73.73% (2004-05), is fastest declining by 28.20% in (2011-12) it was around -6.5 points reduced by
every year of study period and respectively reduced by SCs 1.34, OBC -38 and Others -1.24 in rural area
and also higher the poverty ratio seen in urban areas.
Acknowledgement:
This research paper is the outcome of “NSSO Data Analysis Workshop Using STATA” Jointly Organized by Aligarh
Muslim University, Murshidabad Centre and SNAP Academy, West Bengal. The authors wish to thanks Dr.Zakaria Siddiqui
for his help in understanding and analyzing the NSSO data.
21 Hanna Dudek, Iga Lisicka 2015
Page 20
www.ijcrt.org © 2018 IJCRT | Volume 6, Issue 1 March 2018 | ISSN: 2320-2882
IJCRT1803165 International Journal of Creative Research Thoughts (IJCRT) www.ijcrt.org 498
Reference:
Arora Akash & Singh P S (2015) “Poverty across Social and Religious Groups in Uttar Pradesh an Interregional
Analysis” Economic & Political Weekly vol. L No 52-2015.
Borooah K. Vani (2005) “Caste, Inequality, and Poverty in India” Review of Development Economics, 9(3), 399–
414, 2005
Bradshaw K. Ted (2005) “Theories of Poverty and Anti-Poverty Programs in Community Development” RPRC
Working Paper No. 06-05.
Chandra Hukum and U. C. Sud (2010), “Estimation of District Level Poor Households in the State of Uttar
Pradesh in India by Combining NSSO Survey and Census Data”.
Deaton Angus and Dreze Jean (2002) “Poverty and Inequality in India: A Re-Examination” Economic and
Political Weekly September, 2002.
Deaton Angus and Tarozzi Alessandro (2000) “Prices and poverty in India” Research Program in Development
Studies Princeton University Version 4, July 29, 2000.
Jha Raghbendra (2000) “Reducing Poverty and Inequality in India: Has Liberalization Helped?” Working paper
no. 204 (UNU/WIDER).
Methodology for Estimation of Poverty 2014 report, Planning Commission Govt. of India.
Murgai Rinku et.all (2003) “Measuring poverty in Karnataka the Regional Dimension” Economic and Political
Weekly January 25th, 2003.
Meenakshi V J and Ray Ranjan (1999) ‘Poverty, Household Size and Female Headed Household in India
Mutatkar Rohit (2005) “Social Group Disparities and Poverty in India” Working Paper (IGIDR) Series No. WP-
2005-004-2005.
Panagariya Arvind & Mukim Megha (2013). “A comprehensive analysis of poverty in India” working paper no.
2013-01.
Rani Anita (2011) “Poverty in Punjab: A District Level Study” Ph.D. Thesis
Suryanarayana M H (2009) “Intra-State Economic Disparities: Karnataka and Maharashtra” Economic &
Political Weekly Vol-xliv no 26 & 27.
Ranjan Ray and Geoffrey Lancaster (2004) “On Setting the Poverty Line Based on Estimated Nutrient Prices
With Application to the Socially Disadvantaged Groups in India During the Reforms Period” Discussion Paper
2004-09 ISSN 1443-8593-ISBN 1 86295 216 7.
Tilak B. G Jandhyala (2000) “Education poverty in Karnataka” National Institute of Education Planning and
Administration”, New-Delhi”